Caroline, WI Map & Demographics
Caroline Map
Caroline Overview
$23,524
PER CAPITA INCOME
$72,222
AVG FAMILY INCOME
$70,972
AVG HOUSEHOLD INCOME
0.25
INEQUALITY / GINI INDEX
406
TOTAL POPULATION
176
MALE POPULATION
230
FEMALE POPULATION
76.52
MALES / 100 FEMALES
130.68
FEMALES / 100 MALES
33.2
MEDIAN AGE
4.1
AVG FAMILY SIZE
3.5
AVG HOUSEHOLD SIZE
133
LABOR FORCE [ PEOPLE ]
55.6%
PERCENT IN LABOR FORCE
3.8%
UNEMPLOYMENT RATE
Caroline Zip Codes
Income in Caroline
Income Overview in Caroline
Per Capita Income in Caroline is $23,524, while median incomes of families and households are $72,222 and $70,972 respectively.
| Characteristic | Number | Measure |
| Per Capita Income | 406 | $23,524 |
| Median Family Income | 94 | $72,222 |
| Mean Family Income | 94 | $85,490 |
| Median Household Income | 115 | $70,972 |
| Mean Household Income | 115 | $78,977 |
| Income Deficit | 94 | $0 |
| Wage / Income Gap (%) | 406 | 0.00% |
| Wage / Income Gap ($) | 406 | 100.00¢ per $1 |
| Gini / Inequality Index | 406 | 0.25 |
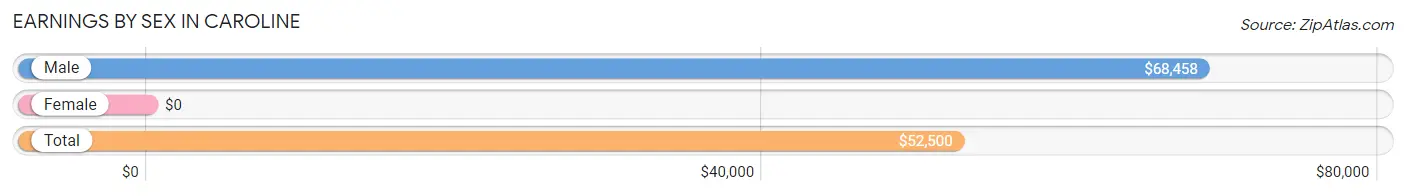
Earnings by Sex in Caroline
| Sex | Number | Average Earnings |
| Male | 77 (48.1%) | $68,458 |
| Female | 83 (51.9%) | $0 |
| Total | 160 (100.0%) | $52,500 |
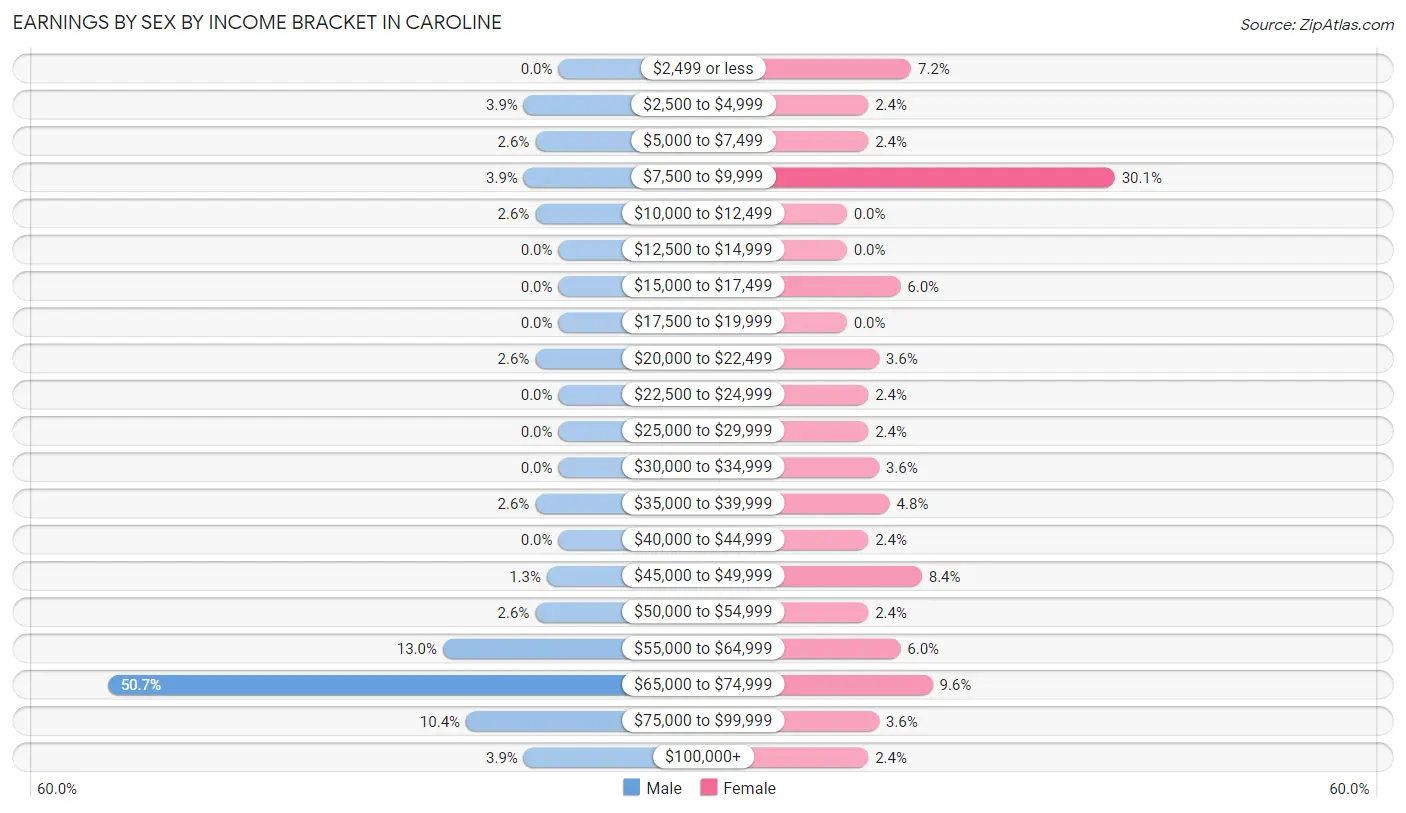
Earnings by Sex by Income Bracket in Caroline
The most common earnings brackets in Caroline are $65,000 to $74,999 for men (39 | 50.6%) and $7,500 to $9,999 for women (25 | 30.1%).
| Income | Male | Female |
| $2,499 or less | 0 (0.0%) | 6 (7.2%) |
| $2,500 to $4,999 | 3 (3.9%) | 2 (2.4%) |
| $5,000 to $7,499 | 2 (2.6%) | 2 (2.4%) |
| $7,500 to $9,999 | 3 (3.9%) | 25 (30.1%) |
| $10,000 to $12,499 | 2 (2.6%) | 0 (0.0%) |
| $12,500 to $14,999 | 0 (0.0%) | 0 (0.0%) |
| $15,000 to $17,499 | 0 (0.0%) | 5 (6.0%) |
| $17,500 to $19,999 | 0 (0.0%) | 0 (0.0%) |
| $20,000 to $22,499 | 2 (2.6%) | 3 (3.6%) |
| $22,500 to $24,999 | 0 (0.0%) | 2 (2.4%) |
| $25,000 to $29,999 | 0 (0.0%) | 2 (2.4%) |
| $30,000 to $34,999 | 0 (0.0%) | 3 (3.6%) |
| $35,000 to $39,999 | 2 (2.6%) | 4 (4.8%) |
| $40,000 to $44,999 | 0 (0.0%) | 2 (2.4%) |
| $45,000 to $49,999 | 1 (1.3%) | 7 (8.4%) |
| $50,000 to $54,999 | 2 (2.6%) | 2 (2.4%) |
| $55,000 to $64,999 | 10 (13.0%) | 5 (6.0%) |
| $65,000 to $74,999 | 39 (50.6%) | 8 (9.6%) |
| $75,000 to $99,999 | 8 (10.4%) | 3 (3.6%) |
| $100,000+ | 3 (3.9%) | 2 (2.4%) |
| Total | 77 (100.0%) | 83 (100.0%) |
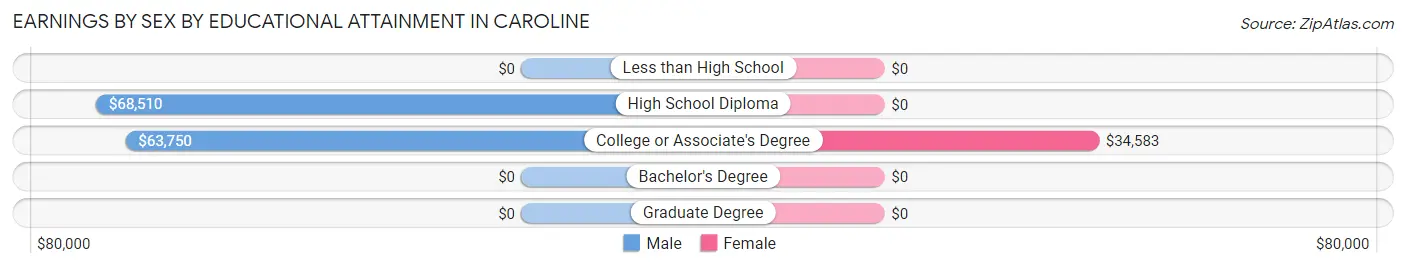
Earnings by Sex by Educational Attainment in Caroline
| Educational Attainment | Male Income | Female Income |
| Less than High School | - | - |
| High School Diploma | $68,510 | $0 |
| College or Associate's Degree | $63,750 | $34,583 |
| Bachelor's Degree | - | - |
| Graduate Degree | - | - |
| Total | $68,625 | $0 |
Family Income in Caroline
Family Income Brackets in Caroline
According to the Caroline family income data, there are 43 families falling into the $50,000 to $74,999 income range, which is the most common income bracket and makes up 45.7% of all families.
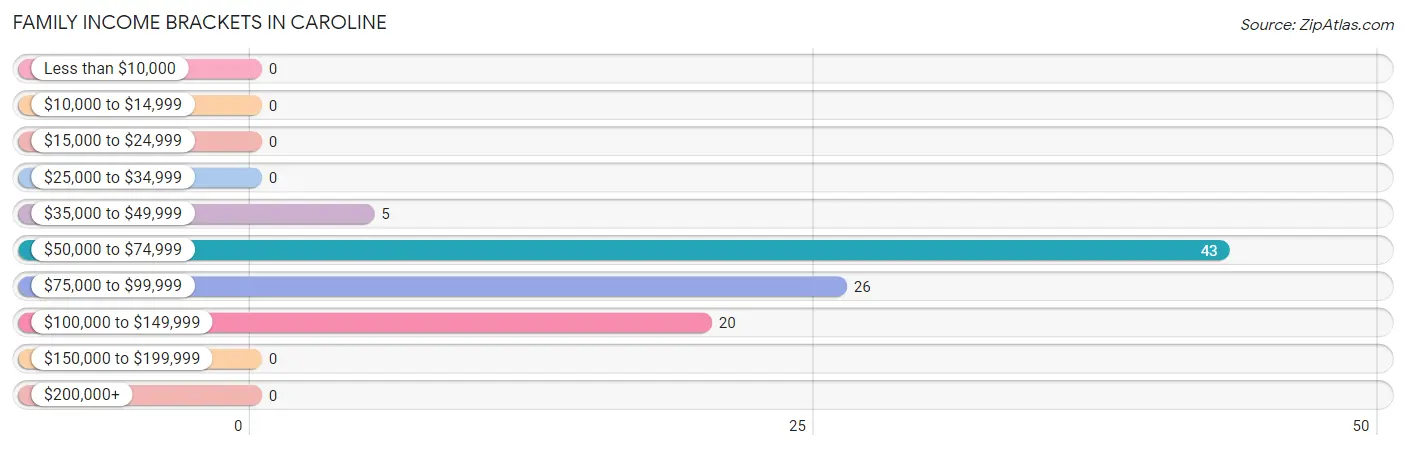
| Income Bracket | # Families | % Families |
| Less than $10,000 | 0 | 0.0% |
| $10,000 to $14,999 | 0 | 0.0% |
| $15,000 to $24,999 | 0 | 0.0% |
| $25,000 to $34,999 | 0 | 0.0% |
| $35,000 to $49,999 | 5 | 5.3% |
| $50,000 to $74,999 | 43 | 45.7% |
| $75,000 to $99,999 | 26 | 27.7% |
| $100,000 to $149,999 | 20 | 21.3% |
| $150,000 to $199,999 | 0 | 0.0% |
| $200,000+ | 0 | 0.0% |
Family Income by Famaliy Size in Caroline
3-person families (10 | 10.6%) account for the highest median family income in Caroline with $79,583 per family, while 2-person families (41 | 43.6%) have the highest median income of $35,486 per family member.
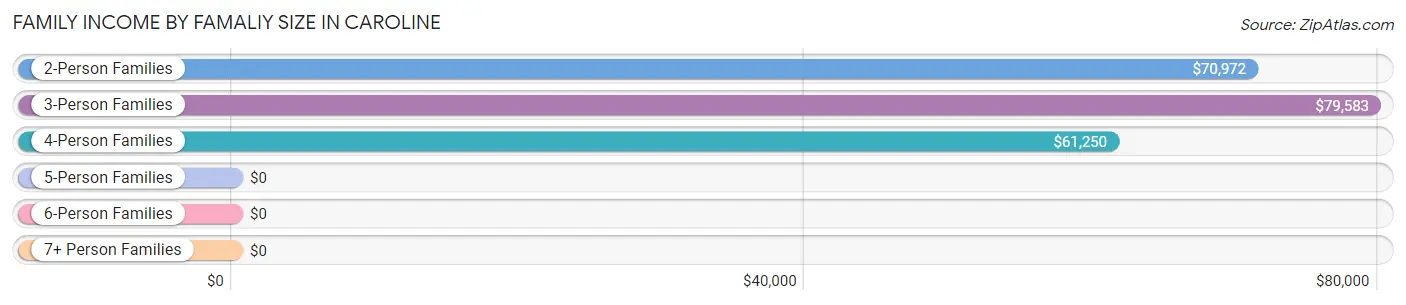
| Income Bracket | # Families | Median Income |
| 2-Person Families | 41 (43.6%) | $70,972 |
| 3-Person Families | 10 (10.6%) | $79,583 |
| 4-Person Families | 8 (8.5%) | $61,250 |
| 5-Person Families | 9 (9.6%) | $0 |
| 6-Person Families | 17 (18.1%) | $0 |
| 7+ Person Families | 9 (9.6%) | $0 |
| Total | 94 (100.0%) | $72,222 |
Family Income by Number of Earners in Caroline
The median family income in Caroline is $72,222, with families comprising 3+ earners (18) having the highest median family income of $110,000, while families with no earners (12) have the lowest median family income of $56,875, accounting for 19.2% and 12.8% of families, respectively.
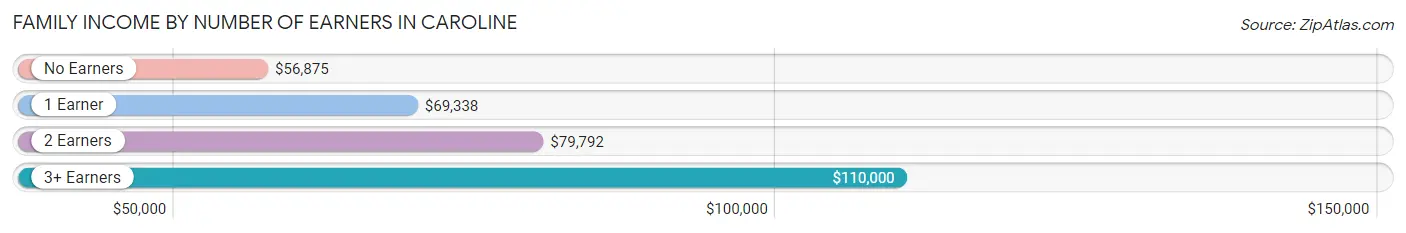
| Number of Earners | # Families | Median Income |
| No Earners | 12 (12.8%) | $56,875 |
| 1 Earner | 43 (45.7%) | $69,338 |
| 2 Earners | 21 (22.3%) | $79,792 |
| 3+ Earners | 18 (19.2%) | $110,000 |
| Total | 94 (100.0%) | $72,222 |
Household Income in Caroline
Household Income Brackets in Caroline
With 47 households falling in the category, the $50,000 to $74,999 income range is the most frequent in Caroline, accounting for 40.9% of all households.
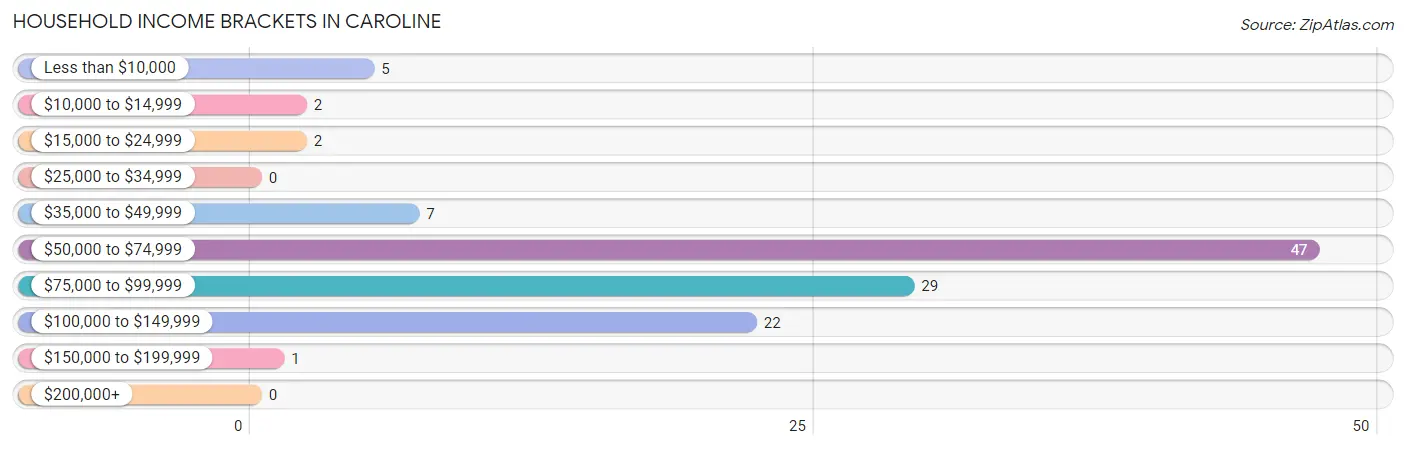
| Income Bracket | # Households | % Households |
| Less than $10,000 | 5 | 4.3% |
| $10,000 to $14,999 | 2 | 1.7% |
| $15,000 to $24,999 | 2 | 1.7% |
| $25,000 to $34,999 | 0 | 0.0% |
| $35,000 to $49,999 | 7 | 6.1% |
| $50,000 to $74,999 | 47 | 40.9% |
| $75,000 to $99,999 | 29 | 25.2% |
| $100,000 to $149,999 | 22 | 19.1% |
| $150,000 to $199,999 | 1 | 0.9% |
| $200,000+ | 0 | 0.0% |
Household Income by Householder Age in Caroline
The median household income in Caroline is $70,972, with the highest median household income of $78,542 found in the 25 to 44 years age bracket for the primary householder. A total of 49 households (42.6%) fall into this category. Meanwhile, the 15 to 24 years age bracket for the primary householder has the lowest median household income of $0, with 1 households (0.9%) in this group.
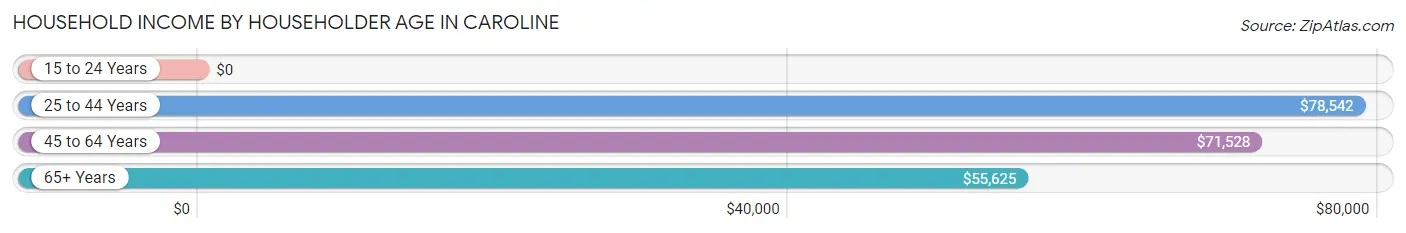
| Income Bracket | # Households | Median Income |
| 15 to 24 Years | 1 (0.9%) | $0 |
| 25 to 44 Years | 49 (42.6%) | $78,542 |
| 45 to 64 Years | 35 (30.4%) | $71,528 |
| 65+ Years | 30 (26.1%) | $55,625 |
| Total | 115 (100.0%) | $70,972 |
Poverty in Caroline
Income Below Poverty by Sex and Age in Caroline
With 2.8% poverty level for males and 0.9% for females among the residents of Caroline, 75 year old and over males and 65 to 74 year old females are the most vulnerable to poverty, with 3 males (42.9%) and 2 females (10.5%) in their respective age groups living below the poverty level.
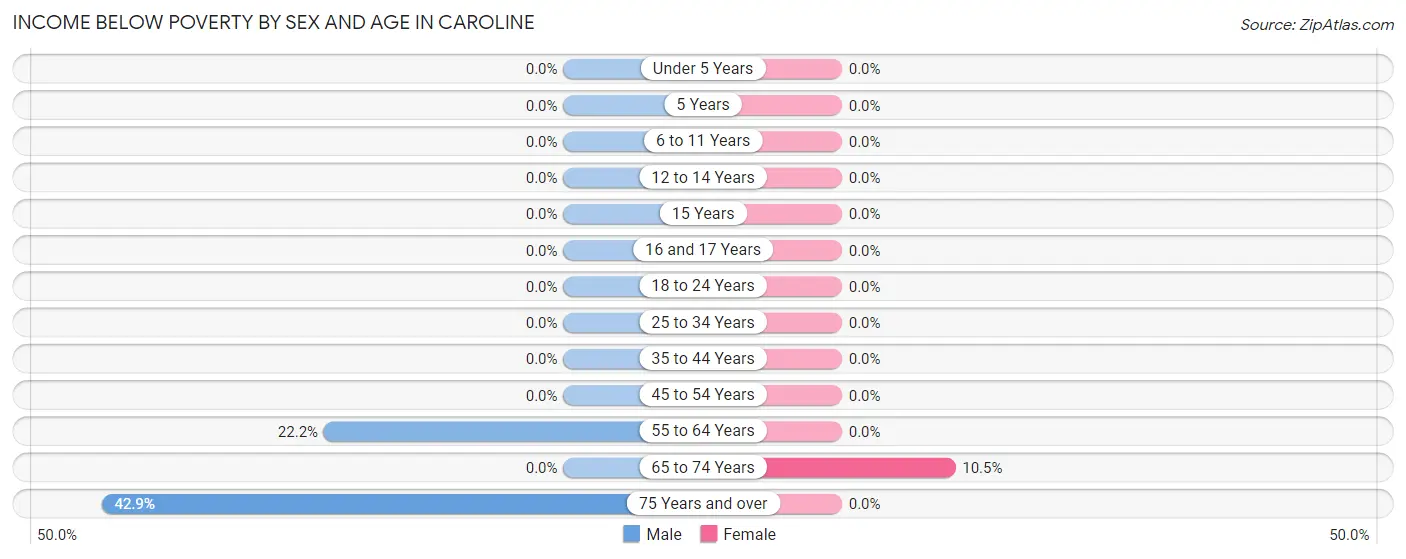
| Age Bracket | Male | Female |
| Under 5 Years | 0 (0.0%) | 0 (0.0%) |
| 5 Years | 0 (0.0%) | 0 (0.0%) |
| 6 to 11 Years | 0 (0.0%) | 0 (0.0%) |
| 12 to 14 Years | 0 (0.0%) | 0 (0.0%) |
| 15 Years | 0 (0.0%) | 0 (0.0%) |
| 16 and 17 Years | 0 (0.0%) | 0 (0.0%) |
| 18 to 24 Years | 0 (0.0%) | 0 (0.0%) |
| 25 to 34 Years | 0 (0.0%) | 0 (0.0%) |
| 35 to 44 Years | 0 (0.0%) | 0 (0.0%) |
| 45 to 54 Years | 0 (0.0%) | 0 (0.0%) |
| 55 to 64 Years | 2 (22.2%) | 0 (0.0%) |
| 65 to 74 Years | 0 (0.0%) | 2 (10.5%) |
| 75 Years and over | 3 (42.9%) | 0 (0.0%) |
| Total | 5 (2.8%) | 2 (0.9%) |
Income Above Poverty by Sex and Age in Caroline
According to the poverty statistics in Caroline, males aged under 5 years and females aged under 5 years are the age groups that are most secure financially, with 100.0% of males and 100.0% of females in these age groups living above the poverty line.
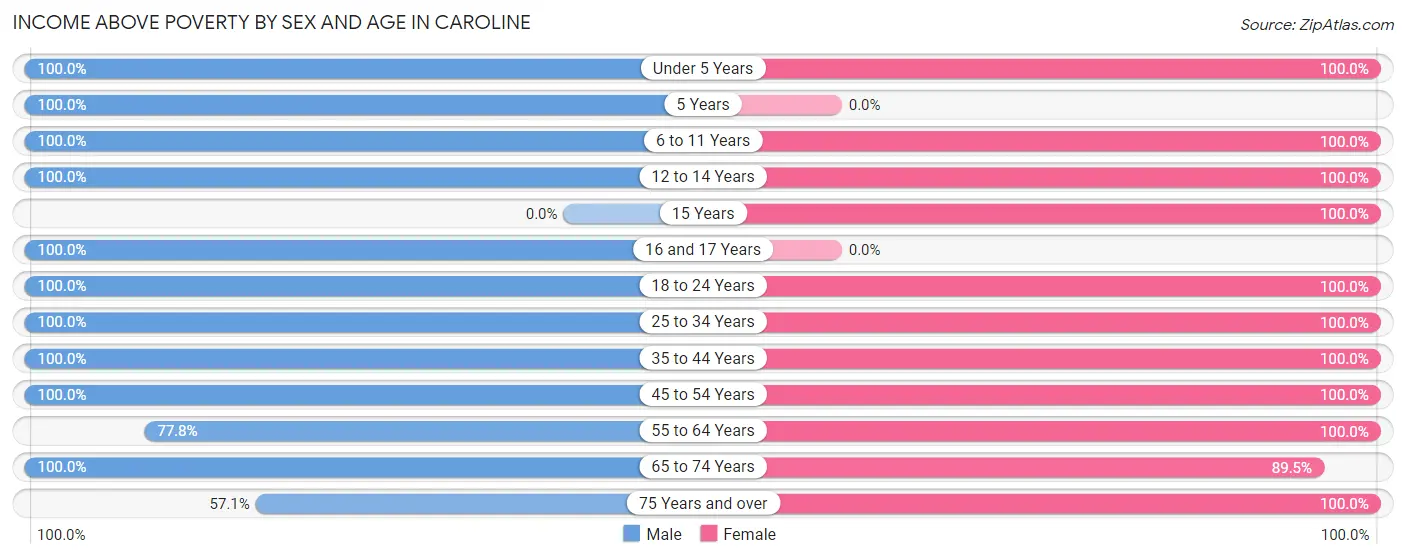
| Age Bracket | Male | Female |
| Under 5 Years | 24 (100.0%) | 26 (100.0%) |
| 5 Years | 5 (100.0%) | 0 (0.0%) |
| 6 to 11 Years | 34 (100.0%) | 53 (100.0%) |
| 12 to 14 Years | 6 (100.0%) | 8 (100.0%) |
| 15 Years | 0 (0.0%) | 11 (100.0%) |
| 16 and 17 Years | 5 (100.0%) | 0 (0.0%) |
| 18 to 24 Years | 1 (100.0%) | 5 (100.0%) |
| 25 to 34 Years | 31 (100.0%) | 14 (100.0%) |
| 35 to 44 Years | 15 (100.0%) | 36 (100.0%) |
| 45 to 54 Years | 22 (100.0%) | 11 (100.0%) |
| 55 to 64 Years | 7 (77.8%) | 43 (100.0%) |
| 65 to 74 Years | 17 (100.0%) | 17 (89.5%) |
| 75 Years and over | 4 (57.1%) | 4 (100.0%) |
| Total | 171 (97.2%) | 228 (99.1%) |
Income Below Poverty Among Married-Couple Families in Caroline
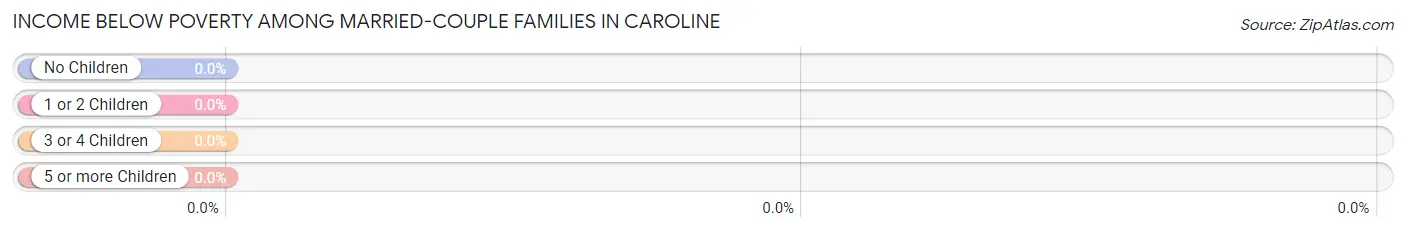
| Children | Above Poverty | Below Poverty |
| No Children | 29 (100.0%) | 0 (0.0%) |
| 1 or 2 Children | 16 (100.0%) | 0 (0.0%) |
| 3 or 4 Children | 33 (100.0%) | 0 (0.0%) |
| 5 or more Children | 0 (0.0%) | 0 (0.0%) |
| Total | 78 (100.0%) | 0 (0.0%) |
Income Below Poverty Among Single-Parent Households in Caroline
| Children | Single Father | Single Mother |
| No Children | 0 (0.0%) | 0 (0.0%) |
| 1 or 2 Children | 0 (0.0%) | 0 (0.0%) |
| 3 or 4 Children | 0 (0.0%) | 0 (0.0%) |
| 5 or more Children | 0 (0.0%) | 0 (0.0%) |
| Total | 0 (0.0%) | 0 (0.0%) |
Income Below Poverty Among Married-Couple vs Single-Parent Households in Caroline
| Children | Married-Couple Families | Single-Parent Households |
| No Children | 0 (0.0%) | 0 (0.0%) |
| 1 or 2 Children | 0 (0.0%) | 0 (0.0%) |
| 3 or 4 Children | 0 (0.0%) | 0 (0.0%) |
| 5 or more Children | 0 (0.0%) | 0 (0.0%) |
| Total | 0 (0.0%) | 0 (0.0%) |
Race in Caroline
The most populous races in Caroline are White / Caucasian (377 | 92.9%), Two or more Races (27 | 6.7%), and Native / Alaskan (2 | 0.5%).
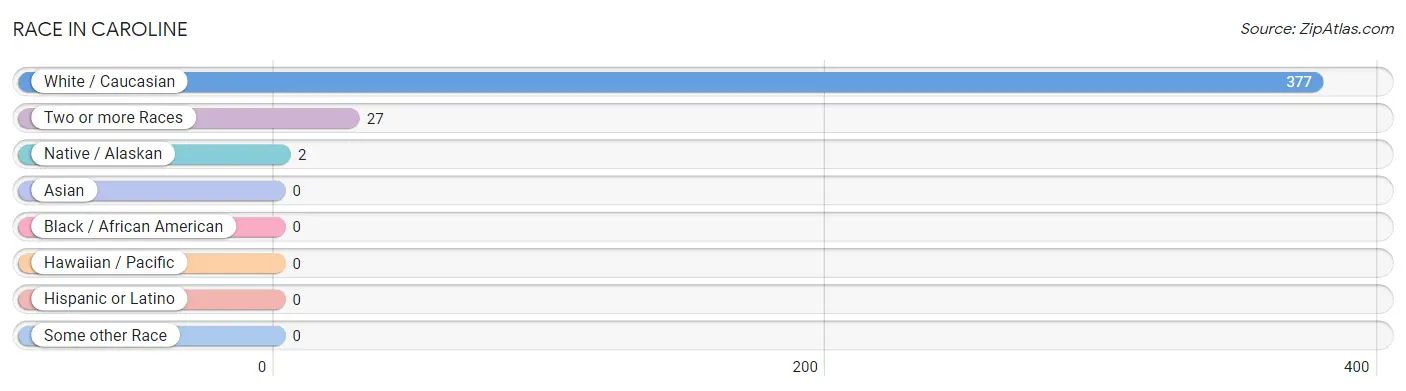
| Race | # Population | % Population |
| Asian | 0 | 0.0% |
| Black / African American | 0 | 0.0% |
| Hawaiian / Pacific | 0 | 0.0% |
| Hispanic or Latino | 0 | 0.0% |
| Native / Alaskan | 2 | 0.5% |
| White / Caucasian | 377 | 92.9% |
| Two or more Races | 27 | 6.7% |
| Some other Race | 0 | 0.0% |
| Total | 406 | 100.0% |
Ancestry in Caroline
The most populous ancestries reported in Caroline are German (252 | 62.1%), Dutch (62 | 15.3%), American (27 | 6.7%), Irish (25 | 6.2%), and Russian (13 | 3.2%), together accounting for 93.4% of all Caroline residents.
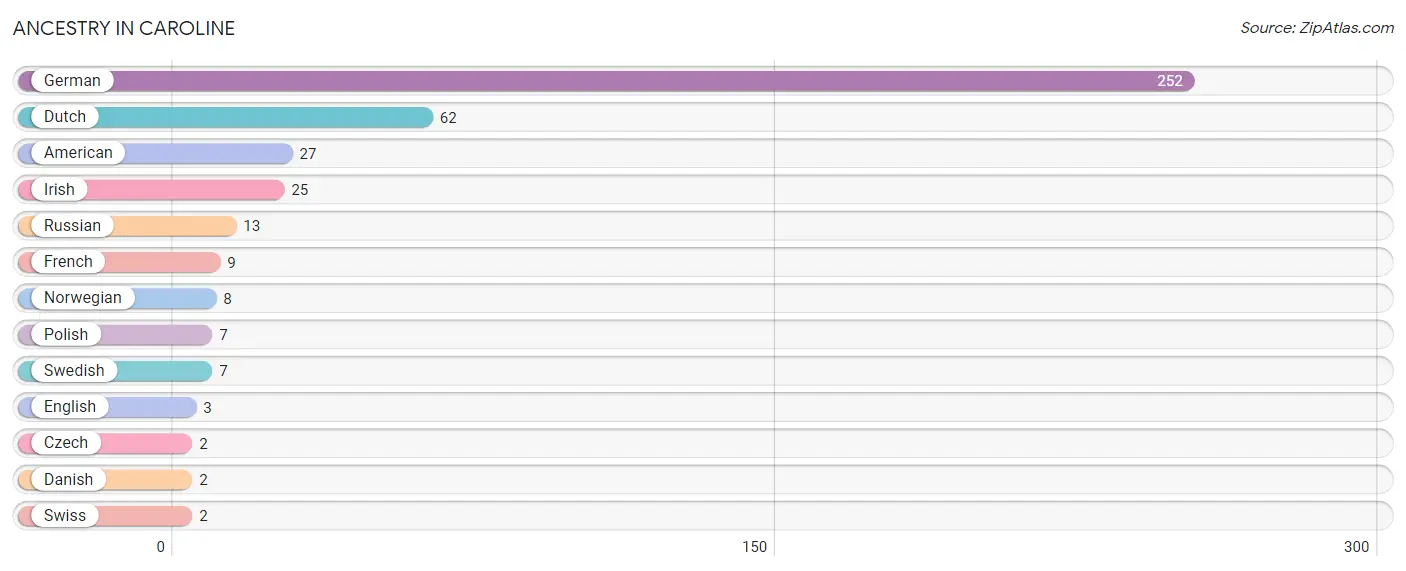
| Ancestry | # Population | % Population |
| American | 27 | 6.7% |
| Czech | 2 | 0.5% |
| Danish | 2 | 0.5% |
| Dutch | 62 | 15.3% |
| English | 3 | 0.7% |
| French | 9 | 2.2% |
| German | 252 | 62.1% |
| Irish | 25 | 6.2% |
| Norwegian | 8 | 2.0% |
| Polish | 7 | 1.7% |
| Russian | 13 | 3.2% |
| Swedish | 7 | 1.7% |
| Swiss | 2 | 0.5% | View All 13 Rows |
Immigrants in Caroline

| Immigration Origin | # Population | % Population | View All 0 Rows |
Sex and Age in Caroline
Sex and Age in Caroline
The most populous age groups in Caroline are 30 to 34 Years (26 | 14.8%) for men and 10 to 14 Years (54 | 23.5%) for women.
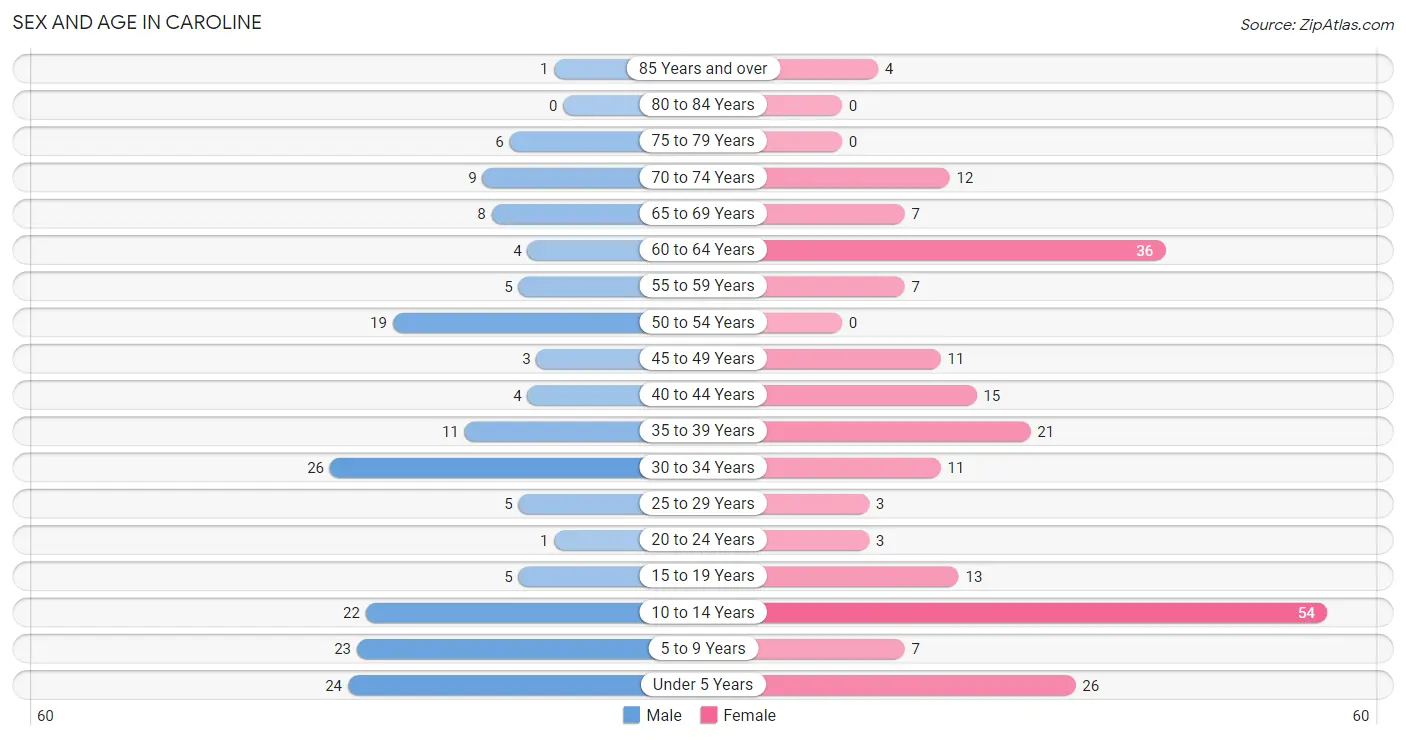
| Age Bracket | Male | Female |
| Under 5 Years | 24 (13.6%) | 26 (11.3%) |
| 5 to 9 Years | 23 (13.1%) | 7 (3.0%) |
| 10 to 14 Years | 22 (12.5%) | 54 (23.5%) |
| 15 to 19 Years | 5 (2.8%) | 13 (5.7%) |
| 20 to 24 Years | 1 (0.6%) | 3 (1.3%) |
| 25 to 29 Years | 5 (2.8%) | 3 (1.3%) |
| 30 to 34 Years | 26 (14.8%) | 11 (4.8%) |
| 35 to 39 Years | 11 (6.2%) | 21 (9.1%) |
| 40 to 44 Years | 4 (2.3%) | 15 (6.5%) |
| 45 to 49 Years | 3 (1.7%) | 11 (4.8%) |
| 50 to 54 Years | 19 (10.8%) | 0 (0.0%) |
| 55 to 59 Years | 5 (2.8%) | 7 (3.0%) |
| 60 to 64 Years | 4 (2.3%) | 36 (15.7%) |
| 65 to 69 Years | 8 (4.5%) | 7 (3.0%) |
| 70 to 74 Years | 9 (5.1%) | 12 (5.2%) |
| 75 to 79 Years | 6 (3.4%) | 0 (0.0%) |
| 80 to 84 Years | 0 (0.0%) | 0 (0.0%) |
| 85 Years and over | 1 (0.6%) | 4 (1.7%) |
| Total | 176 (100.0%) | 230 (100.0%) |
Families and Households in Caroline
Median Family Size in Caroline
The median family size in Caroline is 4.06 persons per family, with married-couple families (78 | 83.0%) accounting for the largest median family size of 4.33 persons per family. On the other hand, single male/father families (3 | 3.2%) represent the smallest median family size with 2.00 persons per family.
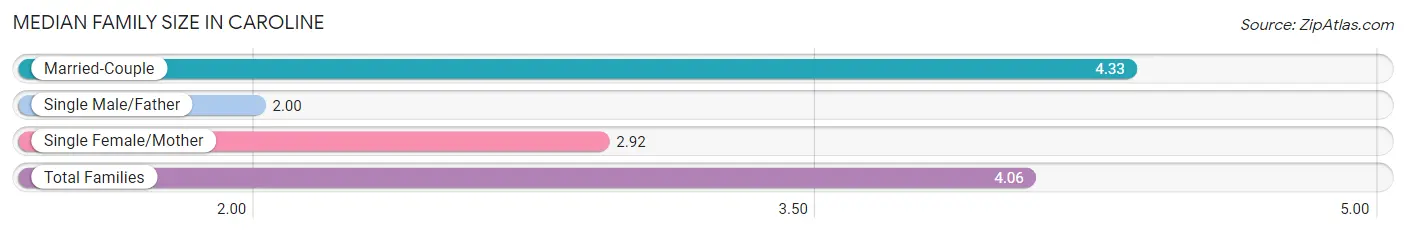
| Family Type | # Families | Family Size |
| Married-Couple | 78 (83.0%) | 4.33 |
| Single Male/Father | 3 (3.2%) | 2.00 |
| Single Female/Mother | 13 (13.8%) | 2.92 |
| Total Families | 94 (100.0%) | 4.06 |
Median Household Size in Caroline
The median household size in Caroline is 3.53 persons per household, with married-couple households (78 | 67.8%) accounting for the largest median household size of 4.33 persons per household. non-family households (21 | 18.3%) represent the smallest median household size with 1.14 persons per household.
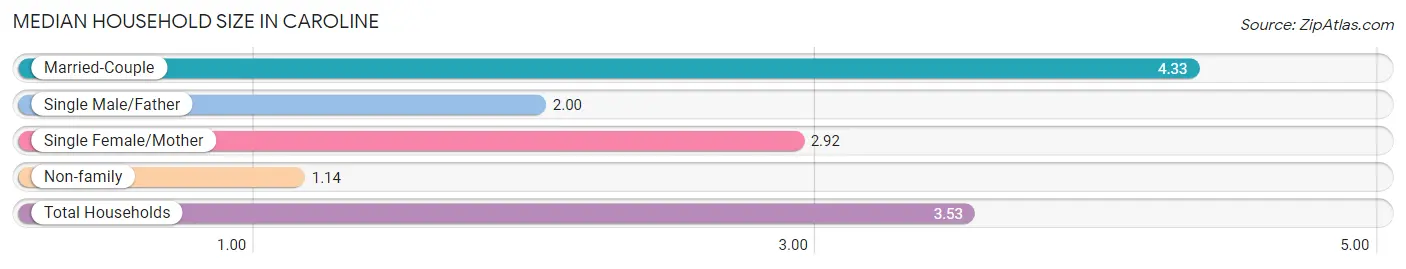
| Household Type | # Households | Household Size |
| Married-Couple | 78 (67.8%) | 4.33 |
| Single Male/Father | 3 (2.6%) | 2.00 |
| Single Female/Mother | 13 (11.3%) | 2.92 |
| Non-family | 21 (18.3%) | 1.14 |
| Total Households | 115 (100.0%) | 3.53 |
Household Size by Marriage Status in Caroline
Out of a total of 115 households in Caroline, 94 (81.7%) are family households, while 21 (18.3%) are nonfamily households. The most numerous type of family households are 2-person households, comprising 41, and the most common type of nonfamily households are 1-person households, comprising 18.
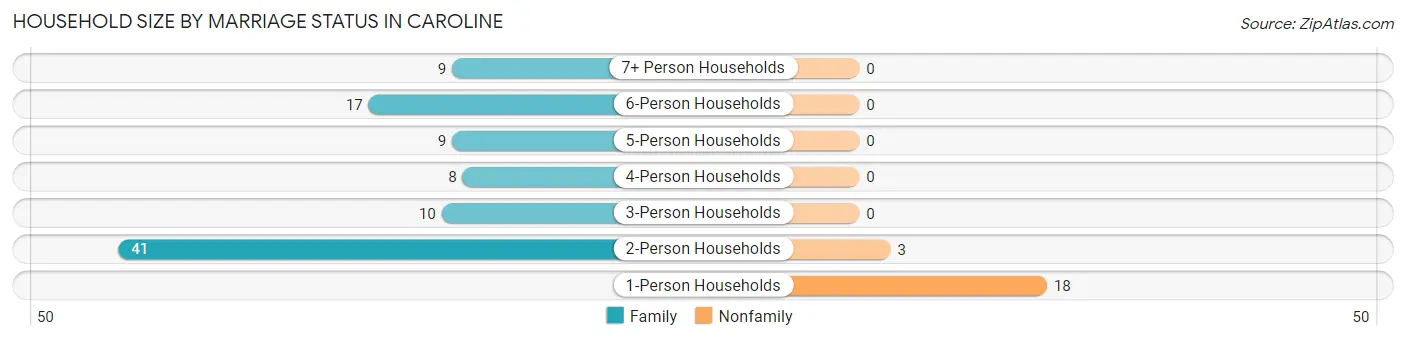
| Household Size | Family Households | Nonfamily Households |
| 1-Person Households | - | 18 (15.7%) |
| 2-Person Households | 41 (35.6%) | 3 (2.6%) |
| 3-Person Households | 10 (8.7%) | 0 (0.0%) |
| 4-Person Households | 8 (7.0%) | 0 (0.0%) |
| 5-Person Households | 9 (7.8%) | 0 (0.0%) |
| 6-Person Households | 17 (14.8%) | 0 (0.0%) |
| 7+ Person Households | 9 (7.8%) | 0 (0.0%) |
| Total | 94 (81.7%) | 21 (18.3%) |
Female Fertility in Caroline
Fertility by Age in Caroline
Average fertility rate in Caroline is 260.0 births per 1,000 women. Women in the age bracket of 35 to 50 years have the highest fertility rate with 362.0 births per 1,000 women. Women in the age bracket of 35 to 50 years acount for 85.0% of all women with births.
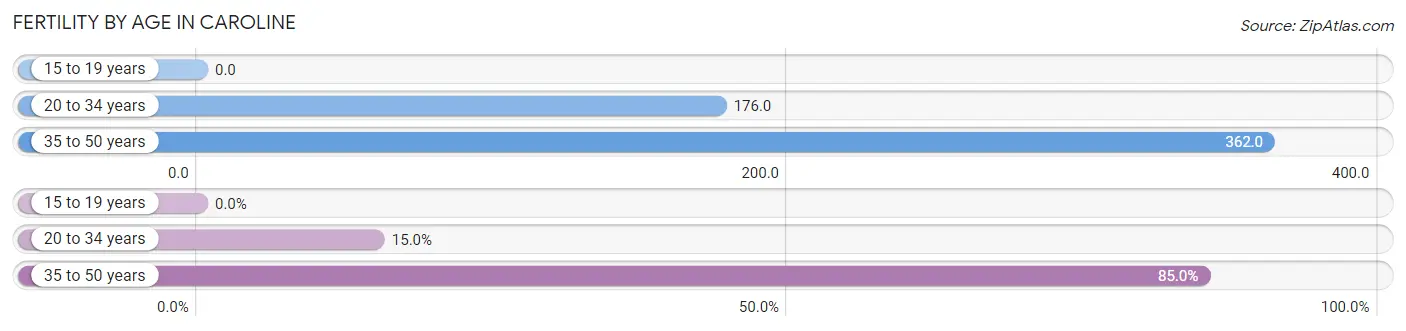
| Age Bracket | Women with Births | Births / 1,000 Women |
| 15 to 19 years | 0 (0.0%) | 0.0 |
| 20 to 34 years | 3 (15.0%) | 176.0 |
| 35 to 50 years | 17 (85.0%) | 362.0 |
| Total | 20 (100.0%) | 260.0 |
Fertility by Age by Marriage Status in Caroline
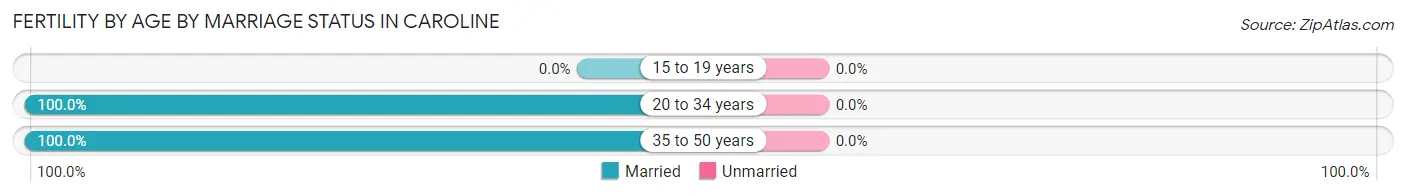
| Age Bracket | Married | Unmarried |
| 15 to 19 years | 0 (0.0%) | 0 (0.0%) |
| 20 to 34 years | 3 (100.0%) | 0 (0.0%) |
| 35 to 50 years | 17 (100.0%) | 0 (0.0%) |
| Total | 20 (100.0%) | 0 (0.0%) |
Fertility by Education in Caroline
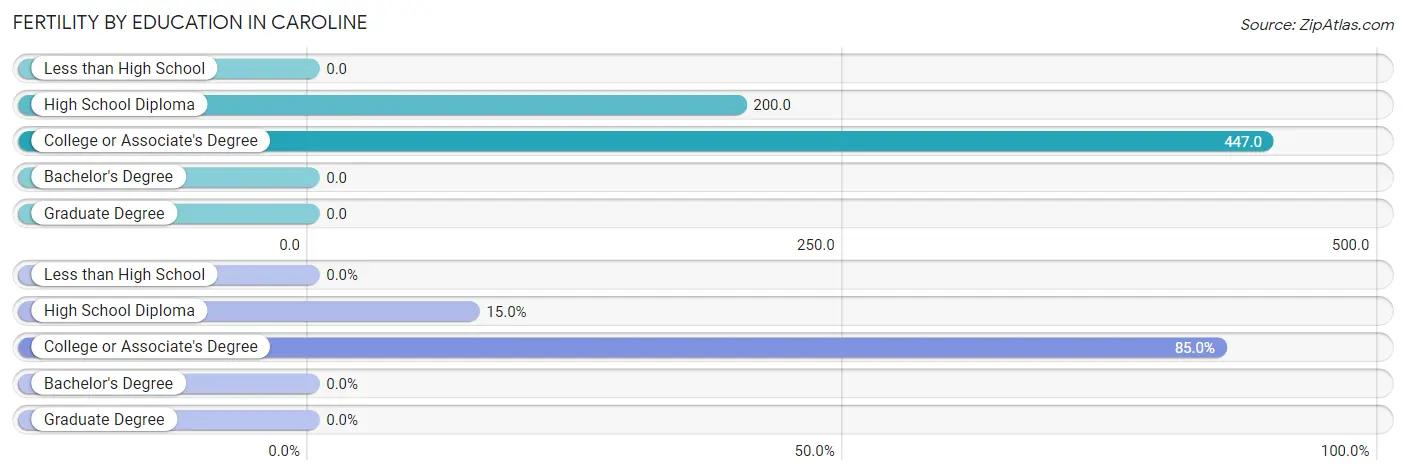
| Educational Attainment | Women with Births | Births / 1,000 Women |
| Less than High School | 0 (0.0%) | 0.0 |
| High School Diploma | 3 (15.0%) | 200.0 |
| College or Associate's Degree | 17 (85.0%) | 447.0 |
| Bachelor's Degree | 0 (0.0%) | 0.0 |
| Graduate Degree | 0 (0.0%) | 0.0 |
| Total | 20 (100.0%) | 260.0 |
Fertility by Education by Marriage Status in Caroline
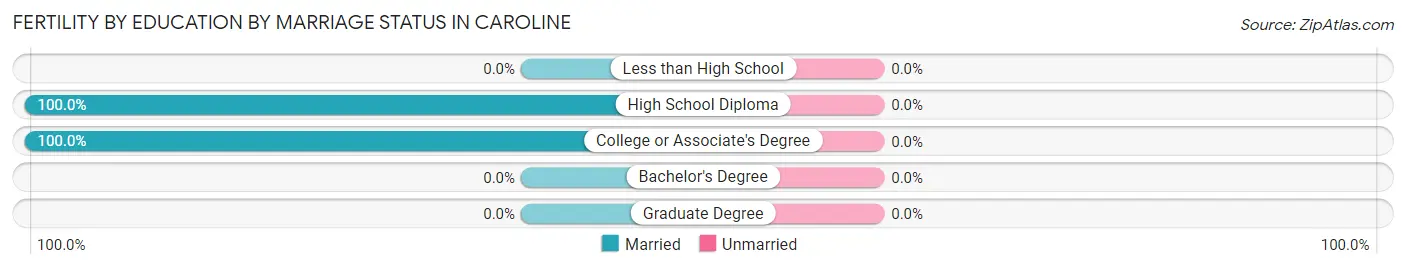
| Educational Attainment | Married | Unmarried |
| Less than High School | 0 (0.0%) | 0 (0.0%) |
| High School Diploma | 3 (100.0%) | 0 (0.0%) |
| College or Associate's Degree | 17 (100.0%) | 0 (0.0%) |
| Bachelor's Degree | 0 (0.0%) | 0 (0.0%) |
| Graduate Degree | 0 (0.0%) | 0 (0.0%) |
| Total | 20 (100.0%) | 0 (0.0%) |
Employment Characteristics in Caroline
Employment by Class of Employer in Caroline
Among the 128 employed individuals in Caroline, private company employees (98 | 76.6%), not-for-profit organizations (11 | 8.6%), and self-employed (incorporated) (5 | 3.9%) make up the most common classes of employment.
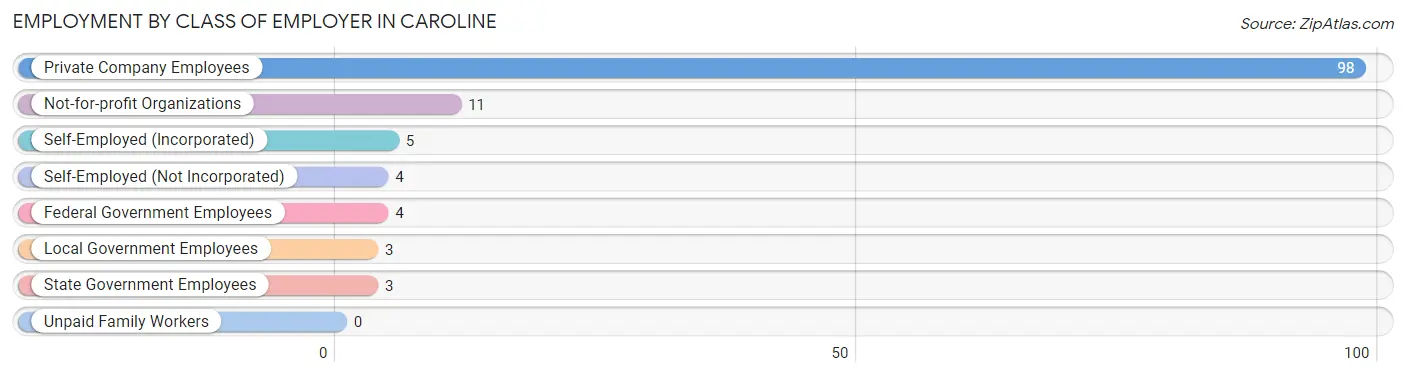
| Employer Class | # Employees | % Employees |
| Private Company Employees | 98 | 76.6% |
| Self-Employed (Incorporated) | 5 | 3.9% |
| Self-Employed (Not Incorporated) | 4 | 3.1% |
| Not-for-profit Organizations | 11 | 8.6% |
| Local Government Employees | 3 | 2.3% |
| State Government Employees | 3 | 2.3% |
| Federal Government Employees | 4 | 3.1% |
| Unpaid Family Workers | 0 | 0.0% |
| Total | 128 | 100.0% |
Employment Status by Age in Caroline
According to the labor force statistics for Caroline, out of the total population over 16 years of age (239), 55.6% or 133 individuals are in the labor force, with 3.8% or 5 of them unemployed. The age group with the highest labor force participation rate is 20 to 24 years, with 100.0% or 4 individuals in the labor force. Within the labor force, the 30 to 34 years age range has the highest percentage of unemployed individuals, with 13.5% or 5 of them being unemployed.
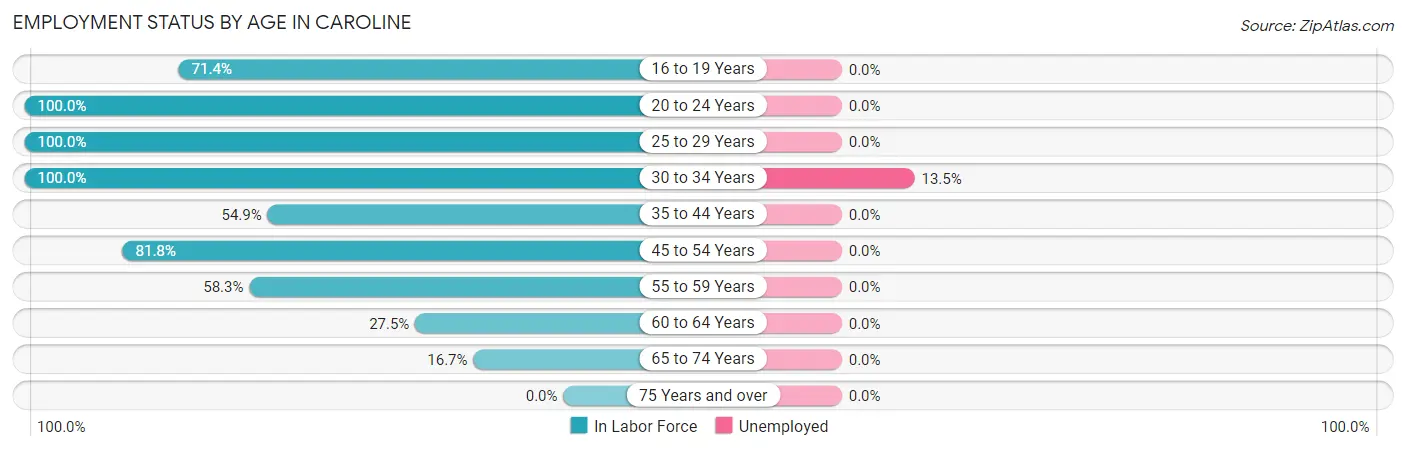
| Age Bracket | In Labor Force | Unemployed |
| 16 to 19 Years | 5 (71.4%) | 0 (0.0%) |
| 20 to 24 Years | 4 (100.0%) | 0 (0.0%) |
| 25 to 29 Years | 8 (100.0%) | 0 (0.0%) |
| 30 to 34 Years | 37 (100.0%) | 5 (13.5%) |
| 35 to 44 Years | 28 (54.9%) | 0 (0.0%) |
| 45 to 54 Years | 27 (81.8%) | 0 (0.0%) |
| 55 to 59 Years | 7 (58.3%) | 0 (0.0%) |
| 60 to 64 Years | 11 (27.5%) | 0 (0.0%) |
| 65 to 74 Years | 6 (16.7%) | 0 (0.0%) |
| 75 Years and over | 0 (0.0%) | 0 (0.0%) |
| Total | 133 (55.6%) | 5 (3.8%) |
Employment Status by Educational Attainment in Caroline
According to labor force statistics for Caroline, 65.2% of individuals (118) out of the total population between 25 and 64 years of age (181) are in the labor force, with 4.2% or 5 of them being unemployed. The group with the highest labor force participation rate are those with the educational attainment of less than high school, with 100.0% or 10 individuals in the labor force. Within the labor force, individuals with college / associate degree education have the highest percentage of unemployment, with 14.3% or 5 of them being unemployed.
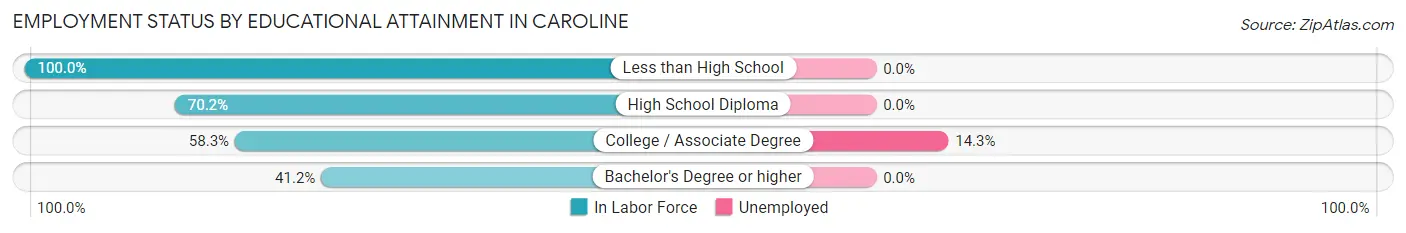
| Educational Attainment | In Labor Force | Unemployed |
| Less than High School | 10 (100.0%) | 0 (0.0%) |
| High School Diploma | 66 (70.2%) | 0 (0.0%) |
| College / Associate Degree | 35 (58.3%) | 9 (14.3%) |
| Bachelor's Degree or higher | 7 (41.2%) | 0 (0.0%) |
| Total | 118 (65.2%) | 8 (4.2%) |
Employment Occupations by Sex in Caroline
Management, Business, Science and Arts Occupations
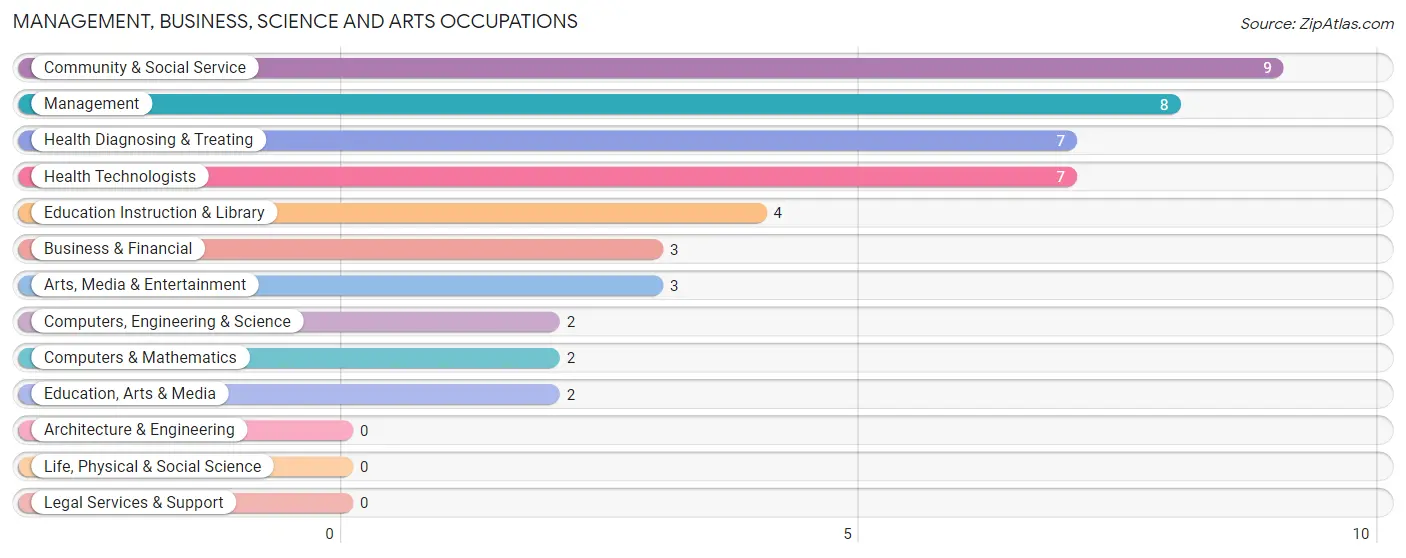
The most common Management, Business, Science and Arts occupations in Caroline are Community & Social Service (9 | 7.0%), Management (8 | 6.2%), Health Diagnosing & Treating (7 | 5.5%), Health Technologists (7 | 5.5%), and Education Instruction & Library (4 | 3.1%).
Management, Business, Science and Arts Occupations by Sex
Within the Management, Business, Science and Arts occupations in Caroline, the most male-oriented occupations are Computers, Engineering & Science (100.0%), Computers & Mathematics (100.0%), and Management (37.5%), while the most female-oriented occupations are Business & Financial (100.0%), Community & Social Service (100.0%), and Education, Arts & Media (100.0%).
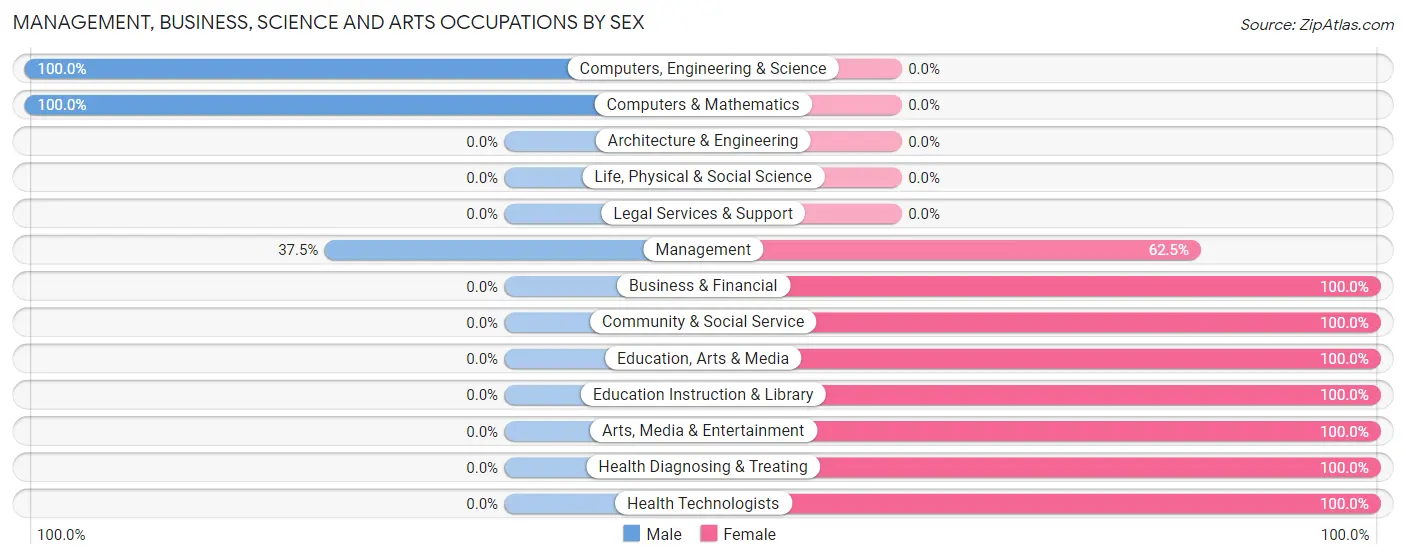
| Occupation | Male | Female |
| Management | 3 (37.5%) | 5 (62.5%) |
| Business & Financial | 0 (0.0%) | 3 (100.0%) |
| Computers, Engineering & Science | 2 (100.0%) | 0 (0.0%) |
| Computers & Mathematics | 2 (100.0%) | 0 (0.0%) |
| Architecture & Engineering | 0 (0.0%) | 0 (0.0%) |
| Life, Physical & Social Science | 0 (0.0%) | 0 (0.0%) |
| Community & Social Service | 0 (0.0%) | 9 (100.0%) |
| Education, Arts & Media | 0 (0.0%) | 2 (100.0%) |
| Legal Services & Support | 0 (0.0%) | 0 (0.0%) |
| Education Instruction & Library | 0 (0.0%) | 4 (100.0%) |
| Arts, Media & Entertainment | 0 (0.0%) | 3 (100.0%) |
| Health Diagnosing & Treating | 0 (0.0%) | 7 (100.0%) |
| Health Technologists | 0 (0.0%) | 7 (100.0%) |
| Total (Category) | 5 (17.2%) | 24 (82.8%) |
| Total (Overall) | 72 (56.2%) | 56 (43.8%) |
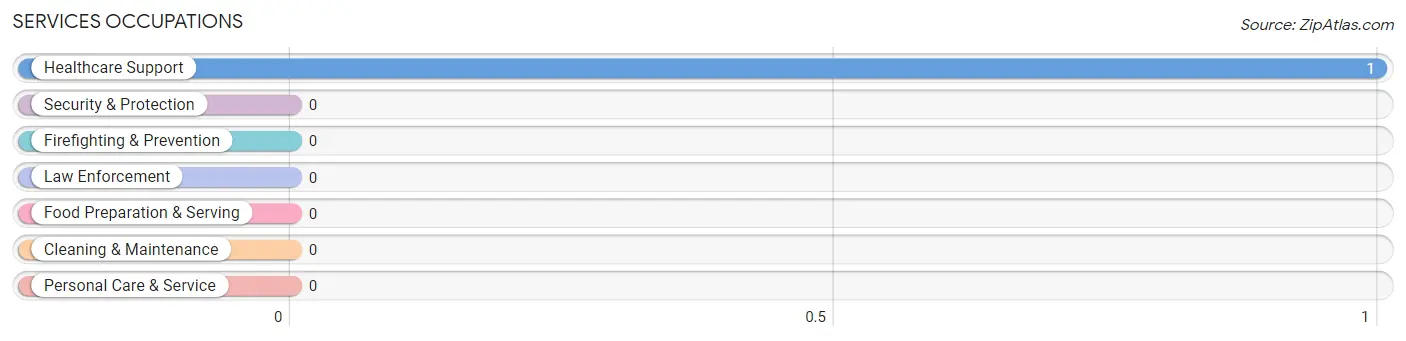
Services Occupations
The most common Services occupations in Caroline are , and Healthcare Support (1 | 0.8%).
Services Occupations by Sex
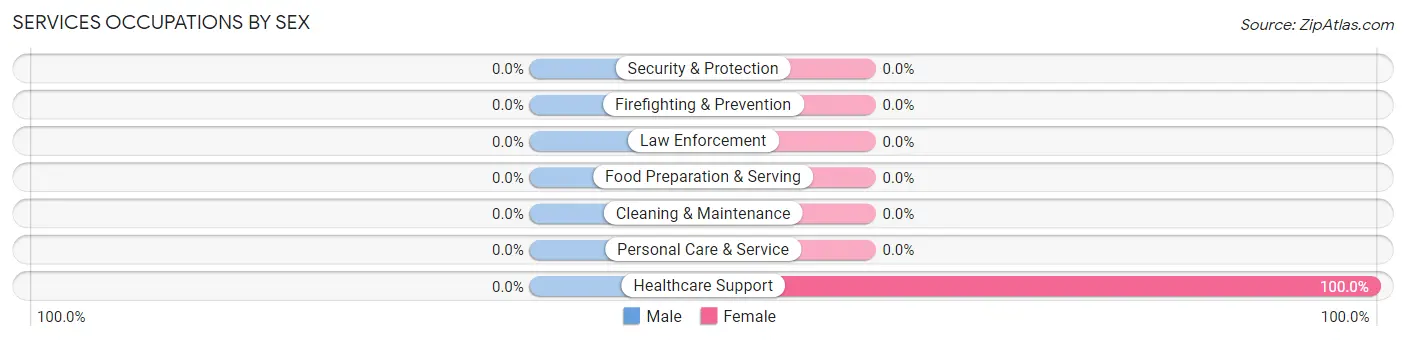
| Occupation | Male | Female |
| Healthcare Support | 0 (0.0%) | 1 (100.0%) |
| Security & Protection | 0 (0.0%) | 0 (0.0%) |
| Firefighting & Prevention | 0 (0.0%) | 0 (0.0%) |
| Law Enforcement | 0 (0.0%) | 0 (0.0%) |
| Food Preparation & Serving | 0 (0.0%) | 0 (0.0%) |
| Cleaning & Maintenance | 0 (0.0%) | 0 (0.0%) |
| Personal Care & Service | 0 (0.0%) | 0 (0.0%) |
| Total (Category) | 0 (0.0%) | 1 (100.0%) |
| Total (Overall) | 72 (56.2%) | 56 (43.8%) |
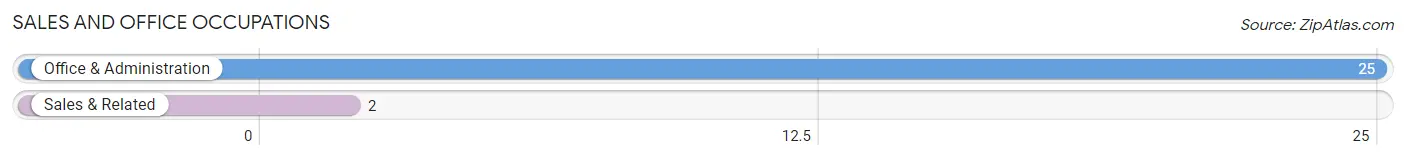
Sales and Office Occupations
The most common Sales and Office occupations in Caroline are Office & Administration (25 | 19.5%), and Sales & Related (2 | 1.6%).
Sales and Office Occupations by Sex
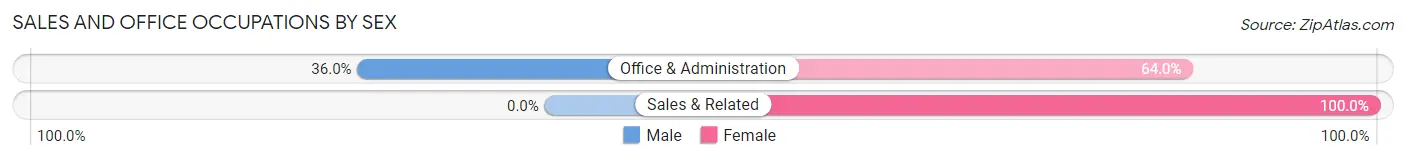
| Occupation | Male | Female |
| Sales & Related | 0 (0.0%) | 2 (100.0%) |
| Office & Administration | 9 (36.0%) | 16 (64.0%) |
| Total (Category) | 9 (33.3%) | 18 (66.7%) |
| Total (Overall) | 72 (56.2%) | 56 (43.8%) |
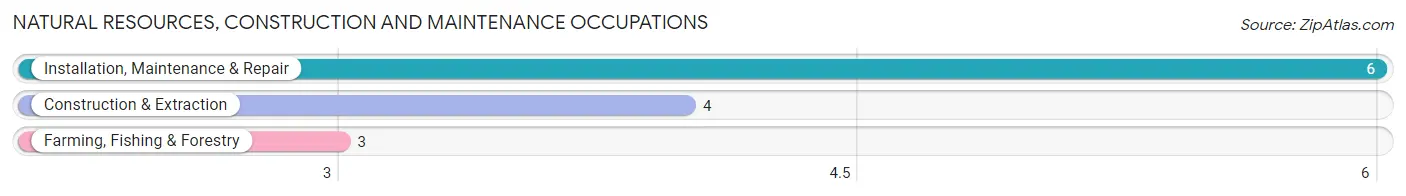
Natural Resources, Construction and Maintenance Occupations
The most common Natural Resources, Construction and Maintenance occupations in Caroline are Installation, Maintenance & Repair (6 | 4.7%), Construction & Extraction (4 | 3.1%), and Farming, Fishing & Forestry (3 | 2.3%).
Natural Resources, Construction and Maintenance Occupations by Sex
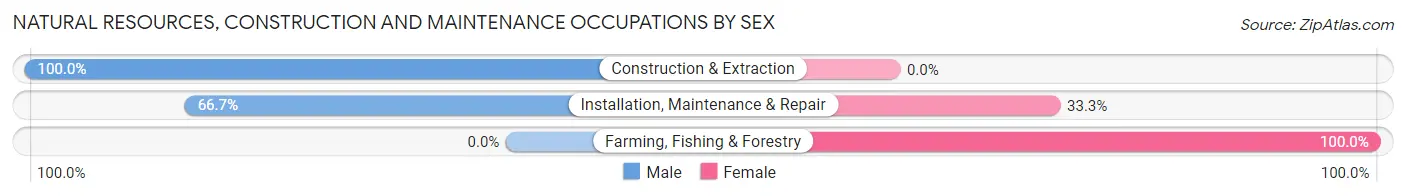
| Occupation | Male | Female |
| Farming, Fishing & Forestry | 0 (0.0%) | 3 (100.0%) |
| Construction & Extraction | 4 (100.0%) | 0 (0.0%) |
| Installation, Maintenance & Repair | 4 (66.7%) | 2 (33.3%) |
| Total (Category) | 8 (61.5%) | 5 (38.5%) |
| Total (Overall) | 72 (56.2%) | 56 (43.8%) |
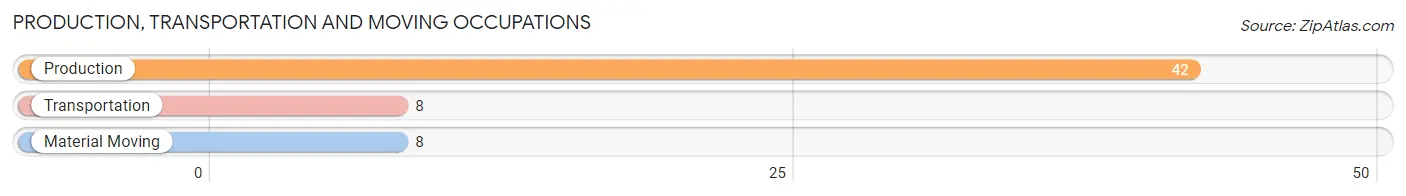
Production, Transportation and Moving Occupations
The most common Production, Transportation and Moving occupations in Caroline are Production (42 | 32.8%), Transportation (8 | 6.2%), and Material Moving (8 | 6.2%).
Production, Transportation and Moving Occupations by Sex
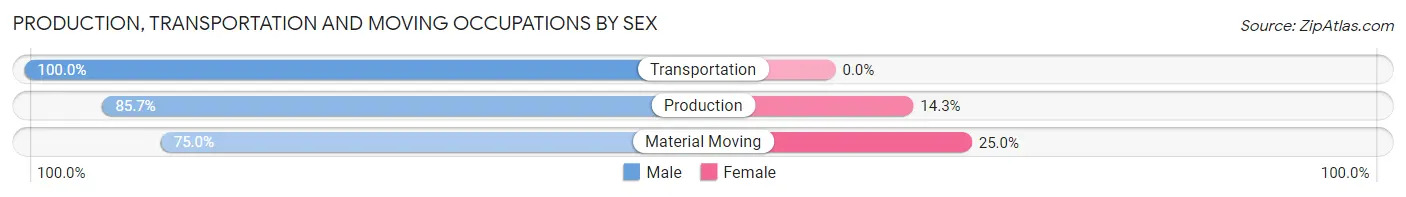
| Occupation | Male | Female |
| Production | 36 (85.7%) | 6 (14.3%) |
| Transportation | 8 (100.0%) | 0 (0.0%) |
| Material Moving | 6 (75.0%) | 2 (25.0%) |
| Total (Category) | 50 (86.2%) | 8 (13.8%) |
| Total (Overall) | 72 (56.2%) | 56 (43.8%) |
Employment Industries by Sex in Caroline
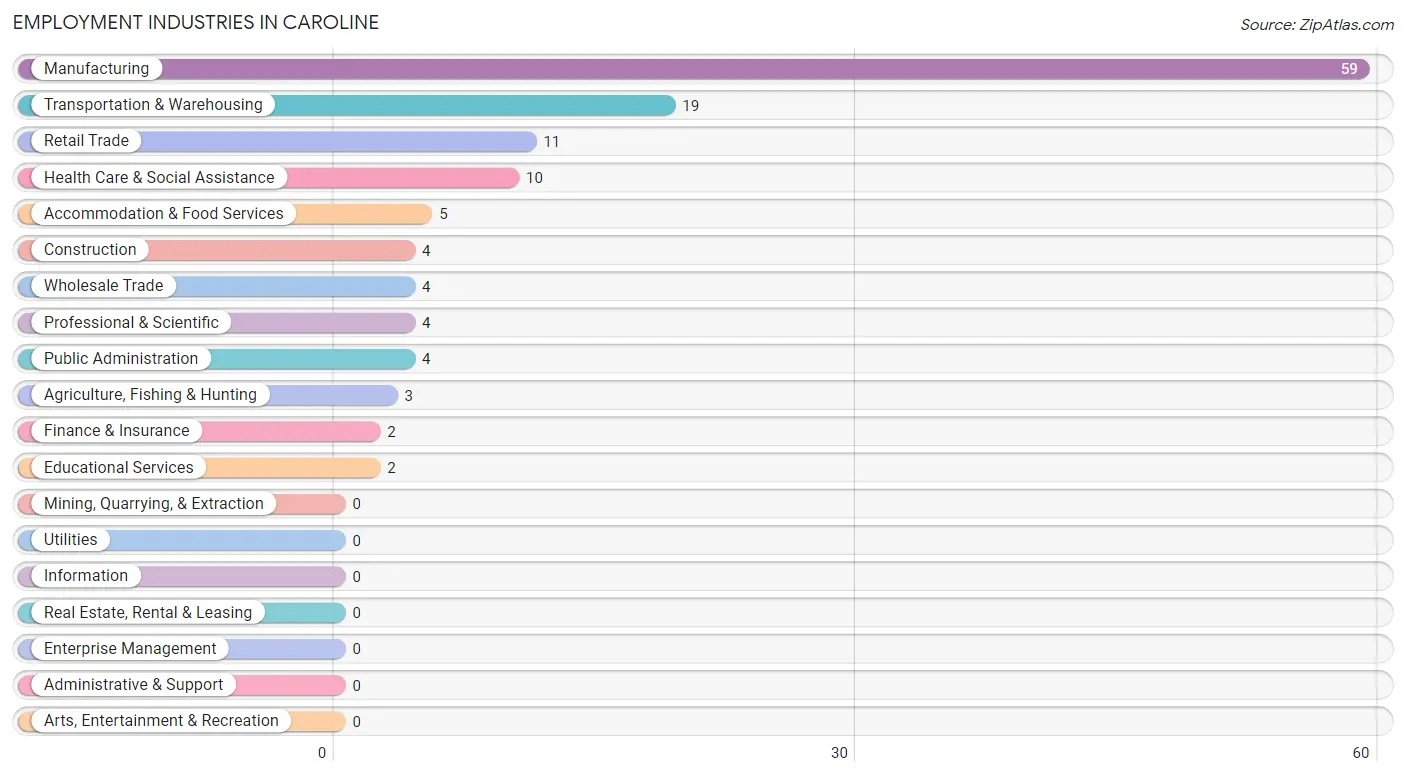
Employment Industries in Caroline
The major employment industries in Caroline include Manufacturing (59 | 46.1%), Transportation & Warehousing (19 | 14.8%), Retail Trade (11 | 8.6%), Health Care & Social Assistance (10 | 7.8%), and Accommodation & Food Services (5 | 3.9%).
Employment Industries by Sex in Caroline
The Caroline industries that see more men than women are Construction (100.0%), Professional & Scientific (100.0%), and Retail Trade (81.8%), whereas the industries that tend to have a higher number of women are Agriculture, Fishing & Hunting (100.0%), Wholesale Trade (100.0%), and Finance & Insurance (100.0%).
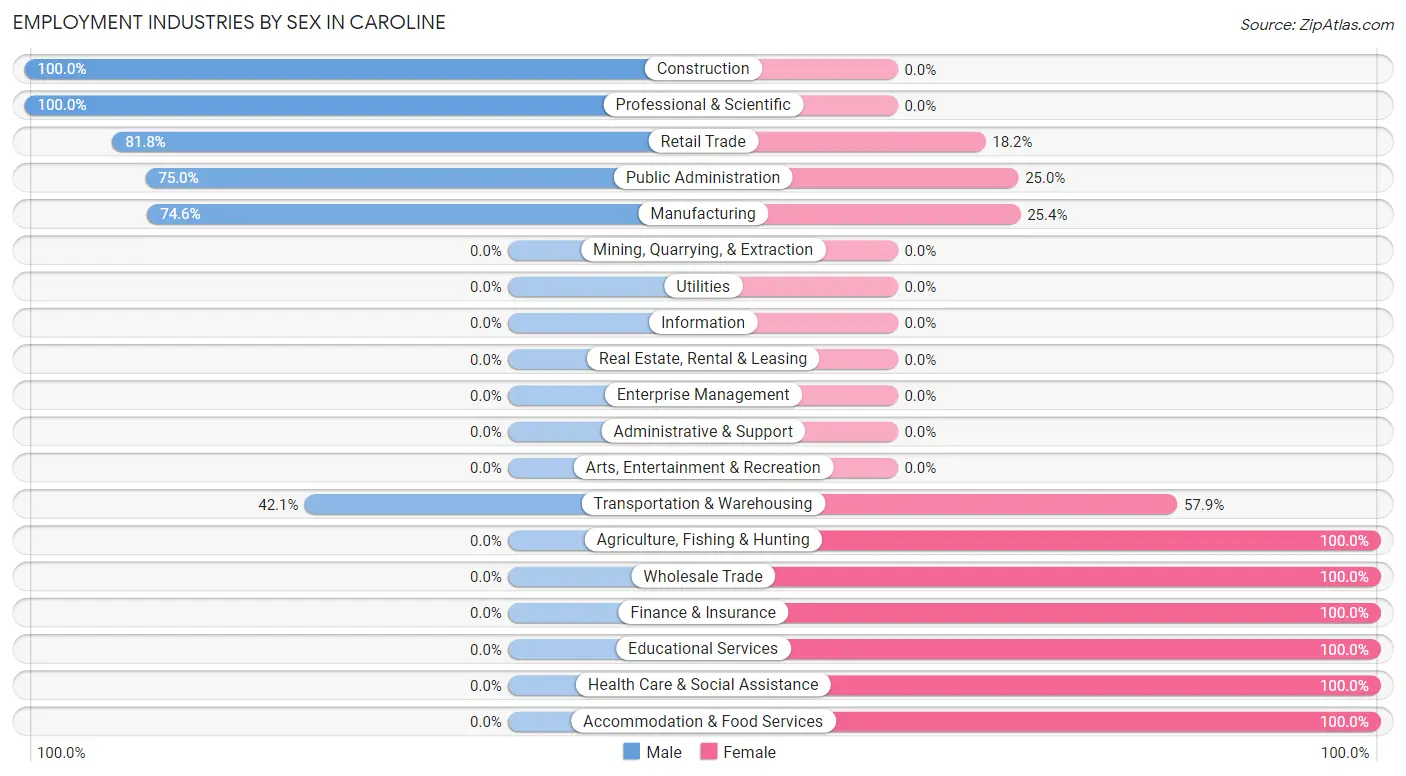
| Industry | Male | Female |
| Agriculture, Fishing & Hunting | 0 (0.0%) | 3 (100.0%) |
| Mining, Quarrying, & Extraction | 0 (0.0%) | 0 (0.0%) |
| Construction | 4 (100.0%) | 0 (0.0%) |
| Manufacturing | 44 (74.6%) | 15 (25.4%) |
| Wholesale Trade | 0 (0.0%) | 4 (100.0%) |
| Retail Trade | 9 (81.8%) | 2 (18.2%) |
| Transportation & Warehousing | 8 (42.1%) | 11 (57.9%) |
| Utilities | 0 (0.0%) | 0 (0.0%) |
| Information | 0 (0.0%) | 0 (0.0%) |
| Finance & Insurance | 0 (0.0%) | 2 (100.0%) |
| Real Estate, Rental & Leasing | 0 (0.0%) | 0 (0.0%) |
| Professional & Scientific | 4 (100.0%) | 0 (0.0%) |
| Enterprise Management | 0 (0.0%) | 0 (0.0%) |
| Administrative & Support | 0 (0.0%) | 0 (0.0%) |
| Educational Services | 0 (0.0%) | 2 (100.0%) |
| Health Care & Social Assistance | 0 (0.0%) | 10 (100.0%) |
| Arts, Entertainment & Recreation | 0 (0.0%) | 0 (0.0%) |
| Accommodation & Food Services | 0 (0.0%) | 5 (100.0%) |
| Public Administration | 3 (75.0%) | 1 (25.0%) |
| Total | 72 (56.2%) | 56 (43.8%) |
Education in Caroline
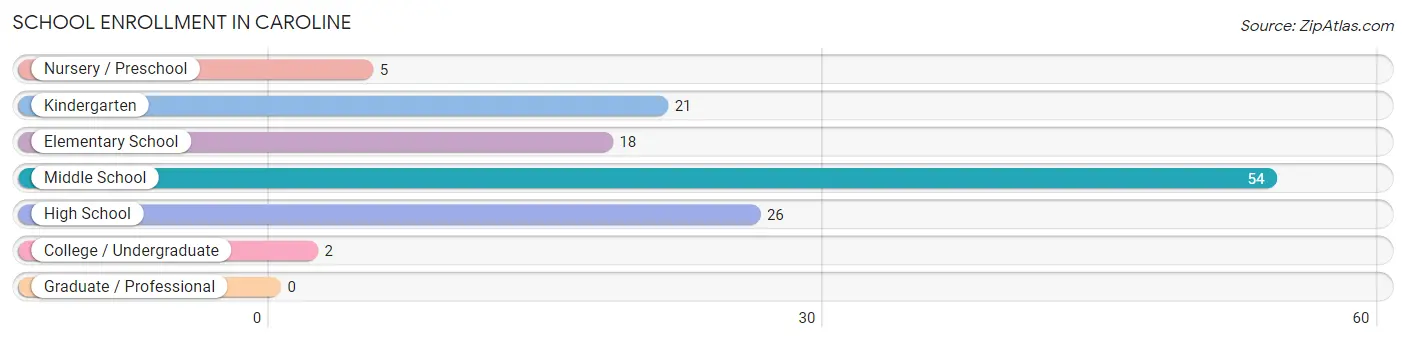
School Enrollment in Caroline
The most common levels of schooling among the 126 students in Caroline are middle school (54 | 42.9%), high school (26 | 20.6%), and kindergarten (21 | 16.7%).
| School Level | # Students | % Students |
| Nursery / Preschool | 5 | 4.0% |
| Kindergarten | 21 | 16.7% |
| Elementary School | 18 | 14.3% |
| Middle School | 54 | 42.9% |
| High School | 26 | 20.6% |
| College / Undergraduate | 2 | 1.6% |
| Graduate / Professional | 0 | 0.0% |
| Total | 126 | 100.0% |
School Enrollment by Age by Funding Source in Caroline
Out of a total of 126 students who are enrolled in schools in Caroline, 48 (38.1%) attend a private institution, while the remaining 78 (61.9%) are enrolled in public schools. The age group of 10 to 14 year olds has the highest likelihood of being enrolled in private schools, with 39 (53.4% in the age bracket) enrolled. Conversely, the age group of 3 to 4 year olds has the lowest likelihood of being enrolled in a private school, with 5 (100.0% in the age bracket) attending a public institution.
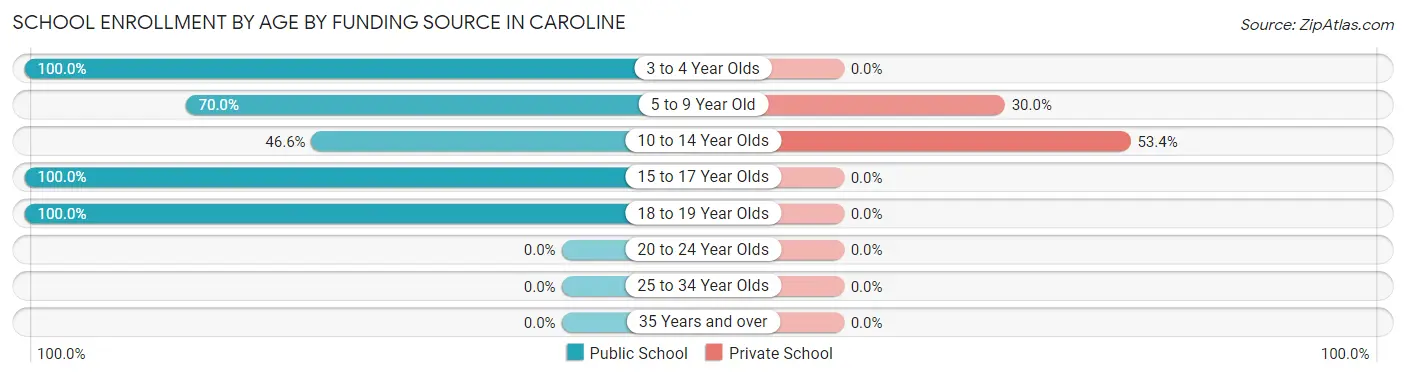
| Age Bracket | Public School | Private School |
| 3 to 4 Year Olds | 5 (100.0%) | 0 (0.0%) |
| 5 to 9 Year Old | 21 (70.0%) | 9 (30.0%) |
| 10 to 14 Year Olds | 34 (46.6%) | 39 (53.4%) |
| 15 to 17 Year Olds | 16 (100.0%) | 0 (0.0%) |
| 18 to 19 Year Olds | 2 (100.0%) | 0 (0.0%) |
| 20 to 24 Year Olds | 0 (0.0%) | 0 (0.0%) |
| 25 to 34 Year Olds | 0 (0.0%) | 0 (0.0%) |
| 35 Years and over | 0 (0.0%) | 0 (0.0%) |
| Total | 78 (61.9%) | 48 (38.1%) |
Educational Attainment by Field of Study in Caroline
Science & technology (9 | 37.5%), education (8 | 33.3%), psychology (6 | 25.0%), and visual & performing arts (1 | 4.2%) are the most common fields of study among 24 individuals in Caroline who have obtained a bachelor's degree or higher.
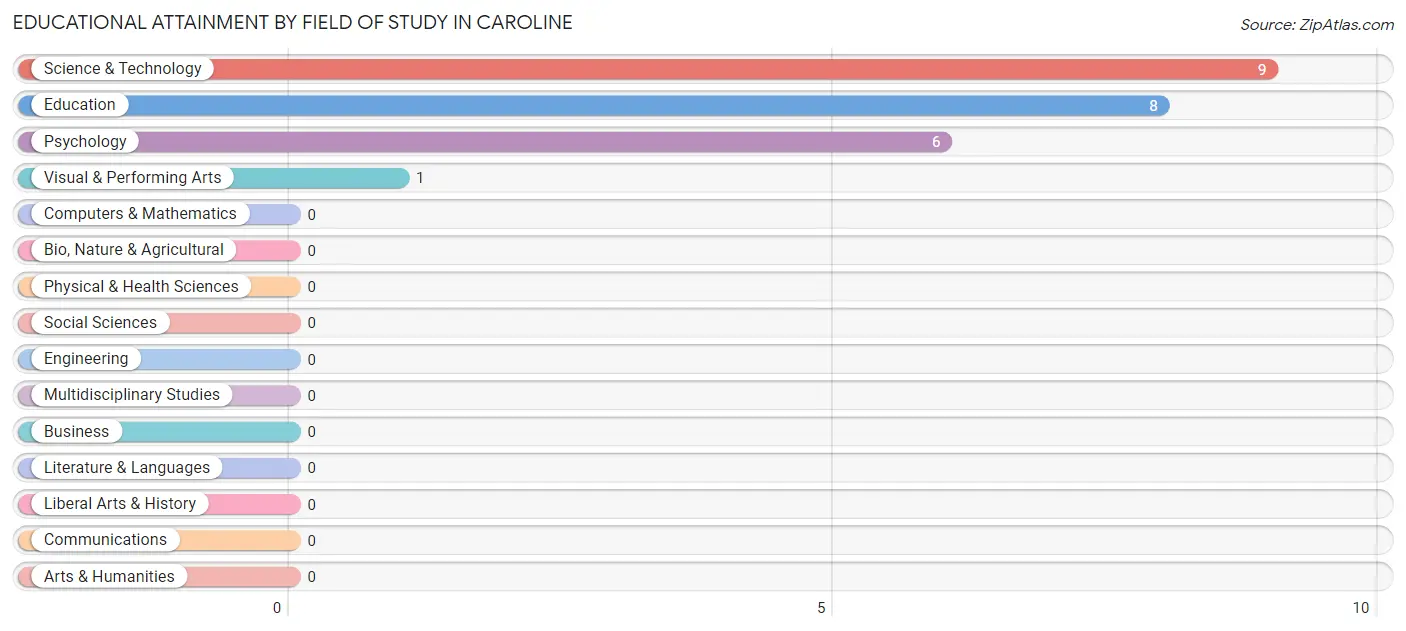
| Field of Study | # Graduates | % Graduates |
| Computers & Mathematics | 0 | 0.0% |
| Bio, Nature & Agricultural | 0 | 0.0% |
| Physical & Health Sciences | 0 | 0.0% |
| Psychology | 6 | 25.0% |
| Social Sciences | 0 | 0.0% |
| Engineering | 0 | 0.0% |
| Multidisciplinary Studies | 0 | 0.0% |
| Science & Technology | 9 | 37.5% |
| Business | 0 | 0.0% |
| Education | 8 | 33.3% |
| Literature & Languages | 0 | 0.0% |
| Liberal Arts & History | 0 | 0.0% |
| Visual & Performing Arts | 1 | 4.2% |
| Communications | 0 | 0.0% |
| Arts & Humanities | 0 | 0.0% |
| Total | 24 | 100.0% |
Transportation & Commute in Caroline
Vehicle Availability by Sex in Caroline
The most prevalent vehicle ownership categories in Caroline are males with 3 vehicles (48, accounting for 66.7%) and females with 3 vehicles (18, making up 85.7%).
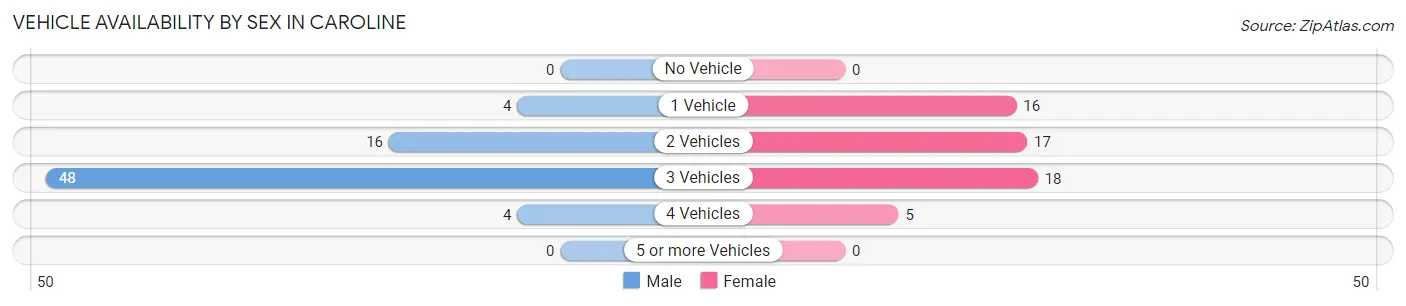
| Vehicles Available | Male | Female |
| No Vehicle | 0 (0.0%) | 0 (0.0%) |
| 1 Vehicle | 4 (5.6%) | 16 (28.6%) |
| 2 Vehicles | 16 (22.2%) | 17 (30.4%) |
| 3 Vehicles | 48 (66.7%) | 18 (32.1%) |
| 4 Vehicles | 4 (5.6%) | 5 (8.9%) |
| 5 or more Vehicles | 0 (0.0%) | 0 (0.0%) |
| Total | 72 (100.0%) | 56 (100.0%) |
Commute Time in Caroline
The most frequently occuring commute durations in Caroline are 15 to 19 minutes (25 commuters, 22.1%), 5 to 9 minutes (24 commuters, 21.2%), and 45 to 59 minutes (12 commuters, 10.6%).
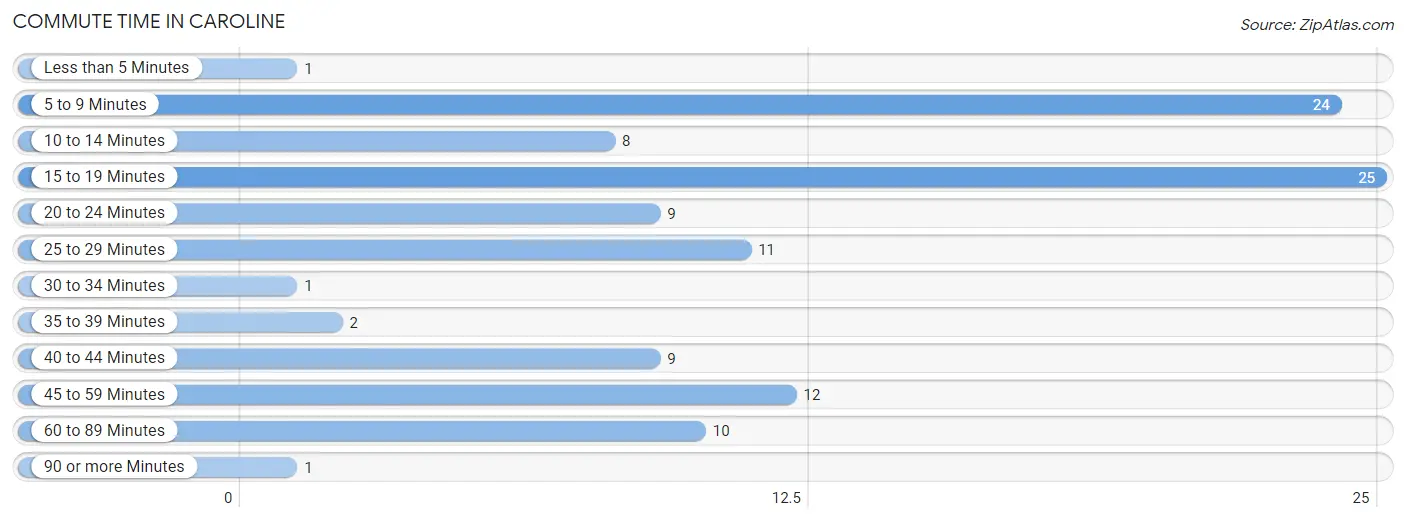
| Commute Time | # Commuters | % Commuters |
| Less than 5 Minutes | 1 | 0.9% |
| 5 to 9 Minutes | 24 | 21.2% |
| 10 to 14 Minutes | 8 | 7.1% |
| 15 to 19 Minutes | 25 | 22.1% |
| 20 to 24 Minutes | 9 | 8.0% |
| 25 to 29 Minutes | 11 | 9.7% |
| 30 to 34 Minutes | 1 | 0.9% |
| 35 to 39 Minutes | 2 | 1.8% |
| 40 to 44 Minutes | 9 | 8.0% |
| 45 to 59 Minutes | 12 | 10.6% |
| 60 to 89 Minutes | 10 | 8.8% |
| 90 or more Minutes | 1 | 0.9% |
Commute Time by Sex in Caroline
The most common commute times in Caroline are 5 to 9 minutes (22 commuters, 36.1%) for males and 25 to 29 minutes (11 commuters, 21.1%) for females.
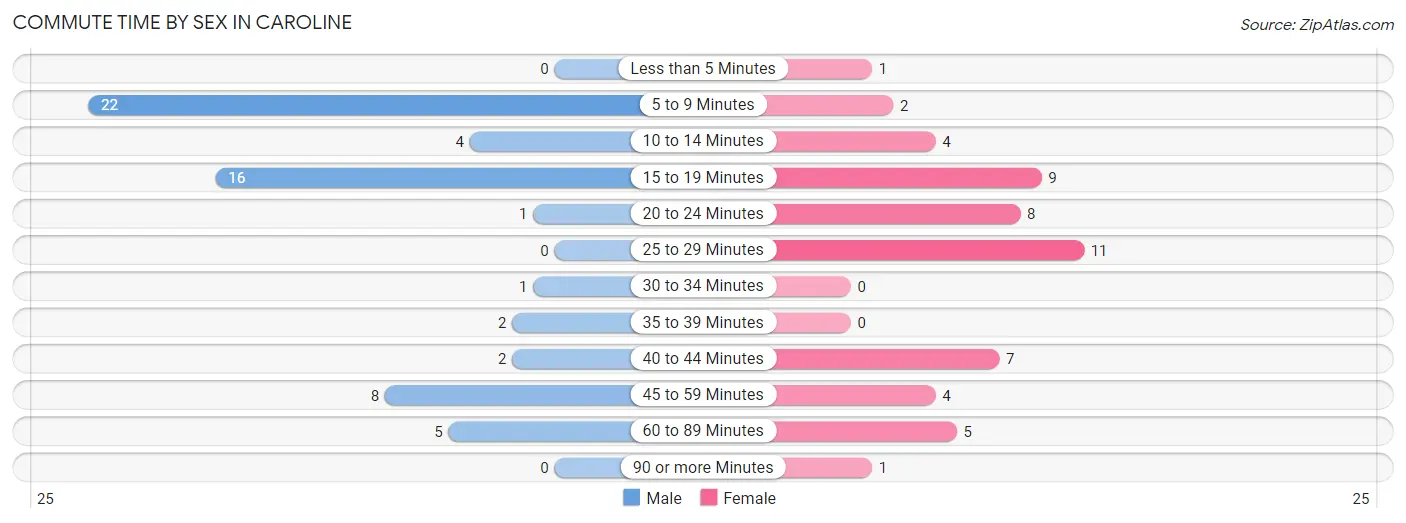
| Commute Time | Male | Female |
| Less than 5 Minutes | 0 (0.0%) | 1 (1.9%) |
| 5 to 9 Minutes | 22 (36.1%) | 2 (3.8%) |
| 10 to 14 Minutes | 4 (6.6%) | 4 (7.7%) |
| 15 to 19 Minutes | 16 (26.2%) | 9 (17.3%) |
| 20 to 24 Minutes | 1 (1.6%) | 8 (15.4%) |
| 25 to 29 Minutes | 0 (0.0%) | 11 (21.1%) |
| 30 to 34 Minutes | 1 (1.6%) | 0 (0.0%) |
| 35 to 39 Minutes | 2 (3.3%) | 0 (0.0%) |
| 40 to 44 Minutes | 2 (3.3%) | 7 (13.5%) |
| 45 to 59 Minutes | 8 (13.1%) | 4 (7.7%) |
| 60 to 89 Minutes | 5 (8.2%) | 5 (9.6%) |
| 90 or more Minutes | 0 (0.0%) | 1 (1.9%) |
Time of Departure to Work by Sex in Caroline
The most frequent times of departure to work in Caroline are 5:00 AM to 5:29 AM (25, 41.0%) for males and 7:00 AM to 7:29 AM (16, 30.8%) for females.
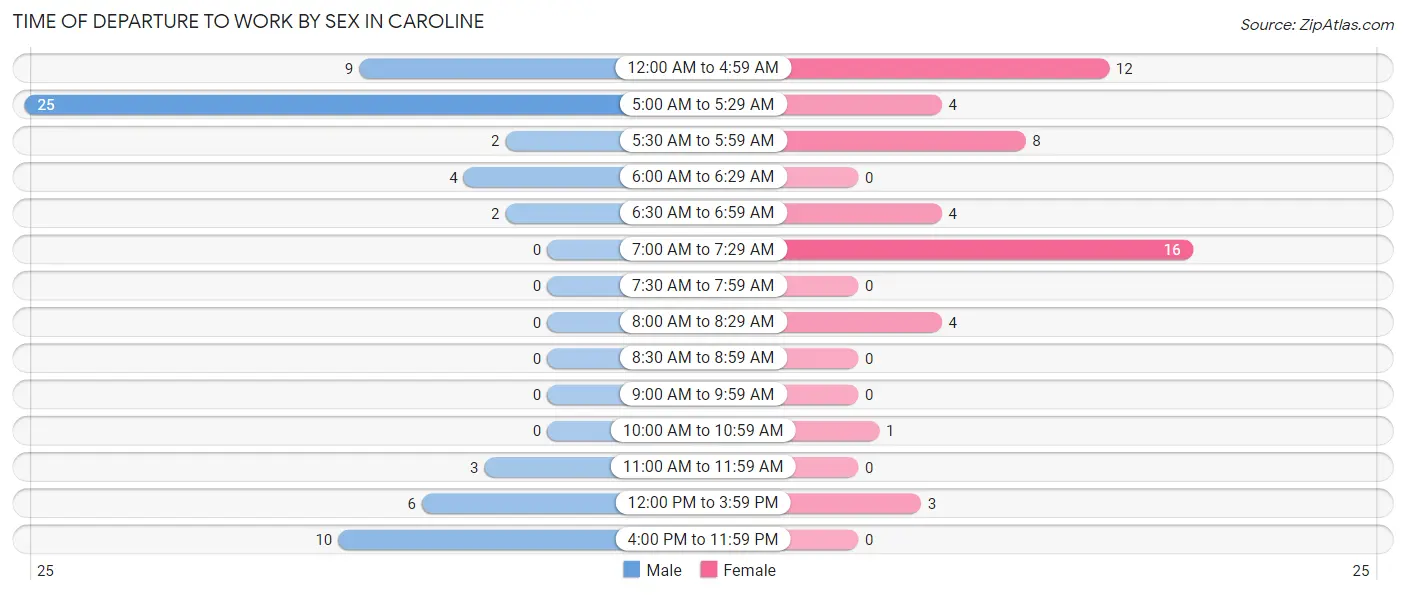
| Time of Departure | Male | Female |
| 12:00 AM to 4:59 AM | 9 (14.7%) | 12 (23.1%) |
| 5:00 AM to 5:29 AM | 25 (41.0%) | 4 (7.7%) |
| 5:30 AM to 5:59 AM | 2 (3.3%) | 8 (15.4%) |
| 6:00 AM to 6:29 AM | 4 (6.6%) | 0 (0.0%) |
| 6:30 AM to 6:59 AM | 2 (3.3%) | 4 (7.7%) |
| 7:00 AM to 7:29 AM | 0 (0.0%) | 16 (30.8%) |
| 7:30 AM to 7:59 AM | 0 (0.0%) | 0 (0.0%) |
| 8:00 AM to 8:29 AM | 0 (0.0%) | 4 (7.7%) |
| 8:30 AM to 8:59 AM | 0 (0.0%) | 0 (0.0%) |
| 9:00 AM to 9:59 AM | 0 (0.0%) | 0 (0.0%) |
| 10:00 AM to 10:59 AM | 0 (0.0%) | 1 (1.9%) |
| 11:00 AM to 11:59 AM | 3 (4.9%) | 0 (0.0%) |
| 12:00 PM to 3:59 PM | 6 (9.8%) | 3 (5.8%) |
| 4:00 PM to 11:59 PM | 10 (16.4%) | 0 (0.0%) |
| Total | 61 (100.0%) | 52 (100.0%) |
Housing Occupancy in Caroline
Occupancy by Ownership in Caroline
Of the total 115 dwellings in Caroline, owner-occupied units account for 96 (83.5%), while renter-occupied units make up 19 (16.5%).
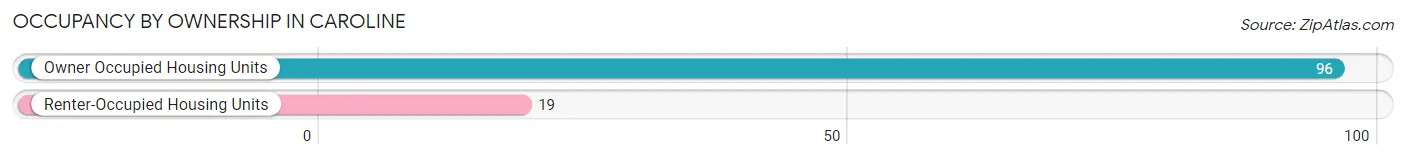
| Occupancy | # Housing Units | % Housing Units |
| Owner Occupied Housing Units | 96 | 83.5% |
| Renter-Occupied Housing Units | 19 | 16.5% |
| Total Occupied Housing Units | 115 | 100.0% |
Occupancy by Household Size in Caroline
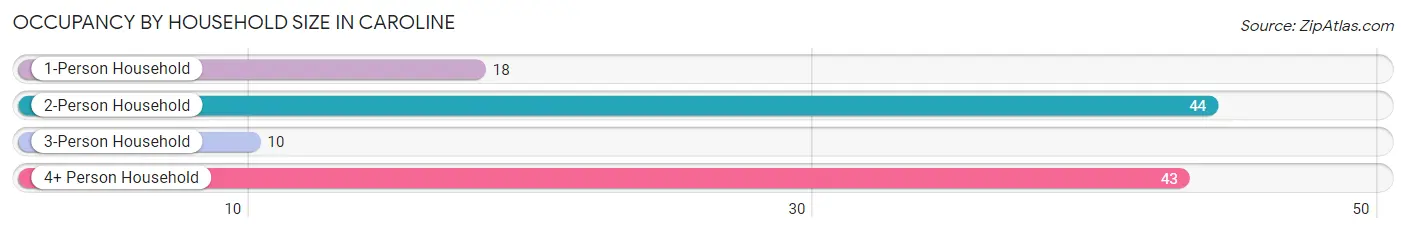
| Household Size | # Housing Units | % Housing Units |
| 1-Person Household | 18 | 15.7% |
| 2-Person Household | 44 | 38.3% |
| 3-Person Household | 10 | 8.7% |
| 4+ Person Household | 43 | 37.4% |
| Total Housing Units | 115 | 100.0% |
Occupancy by Ownership by Household Size in Caroline
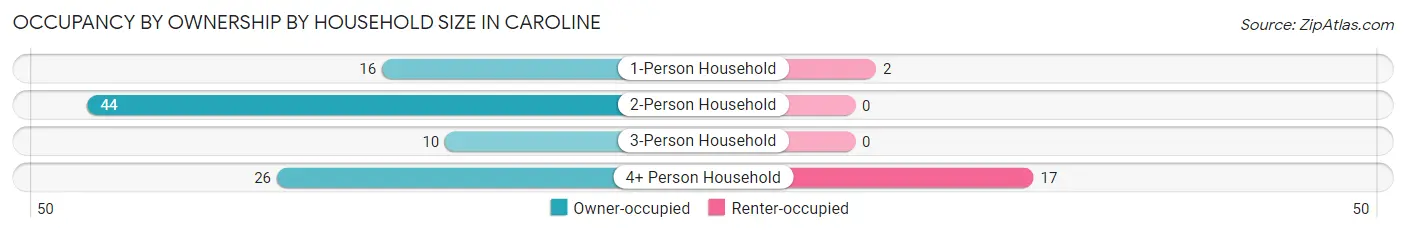
| Household Size | Owner-occupied | Renter-occupied |
| 1-Person Household | 16 (88.9%) | 2 (11.1%) |
| 2-Person Household | 44 (100.0%) | 0 (0.0%) |
| 3-Person Household | 10 (100.0%) | 0 (0.0%) |
| 4+ Person Household | 26 (60.5%) | 17 (39.5%) |
| Total Housing Units | 96 (83.5%) | 19 (16.5%) |
Occupancy by Educational Attainment in Caroline
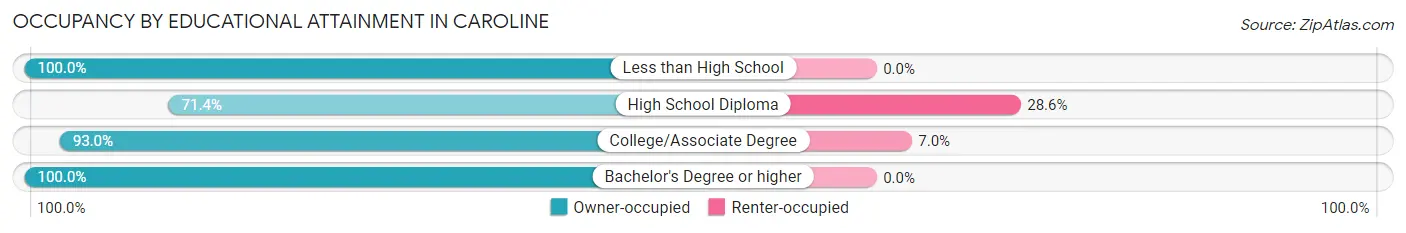
| Household Size | Owner-occupied | Renter-occupied |
| Less than High School | 2 (100.0%) | 0 (0.0%) |
| High School Diploma | 40 (71.4%) | 16 (28.6%) |
| College/Associate Degree | 40 (93.0%) | 3 (7.0%) |
| Bachelor's Degree or higher | 14 (100.0%) | 0 (0.0%) |
Occupancy by Age of Householder in Caroline
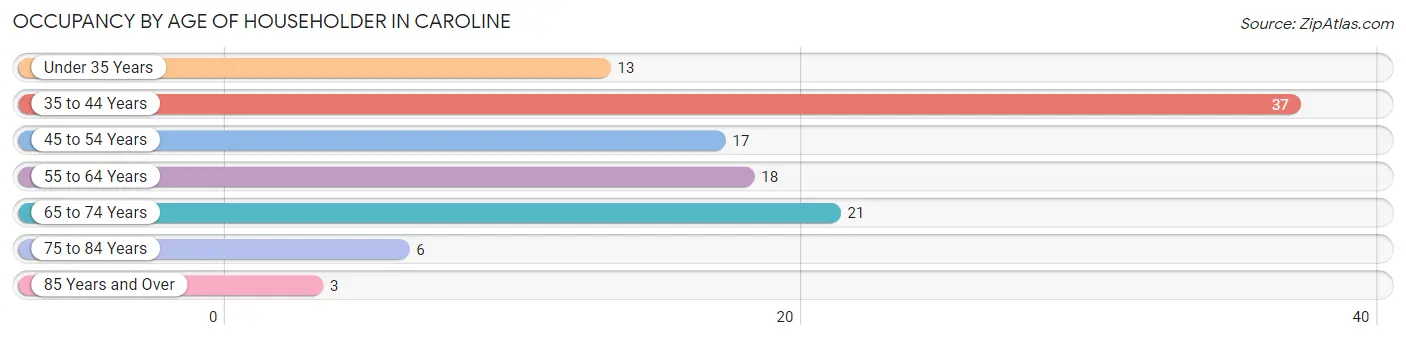
| Age Bracket | # Households | % Households |
| Under 35 Years | 13 | 11.3% |
| 35 to 44 Years | 37 | 32.2% |
| 45 to 54 Years | 17 | 14.8% |
| 55 to 64 Years | 18 | 15.7% |
| 65 to 74 Years | 21 | 18.3% |
| 75 to 84 Years | 6 | 5.2% |
| 85 Years and Over | 3 | 2.6% |
| Total | 115 | 100.0% |
Housing Finances in Caroline
Median Income by Occupancy in Caroline
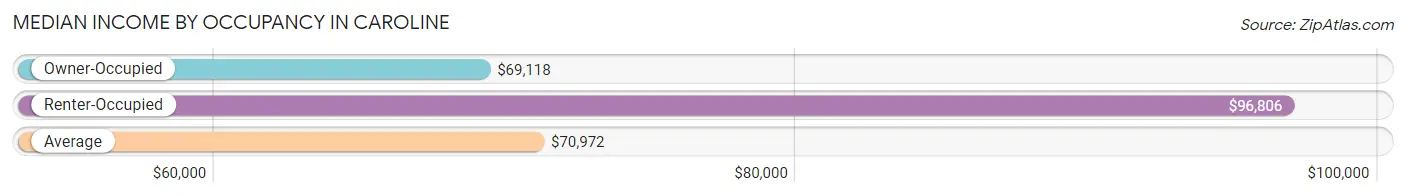
| Occupancy Type | # Households | Median Income |
| Owner-Occupied | 96 (83.5%) | $69,118 |
| Renter-Occupied | 19 (16.5%) | $96,806 |
| Average | 115 (100.0%) | $70,972 |
Occupancy by Householder Income Bracket in Caroline
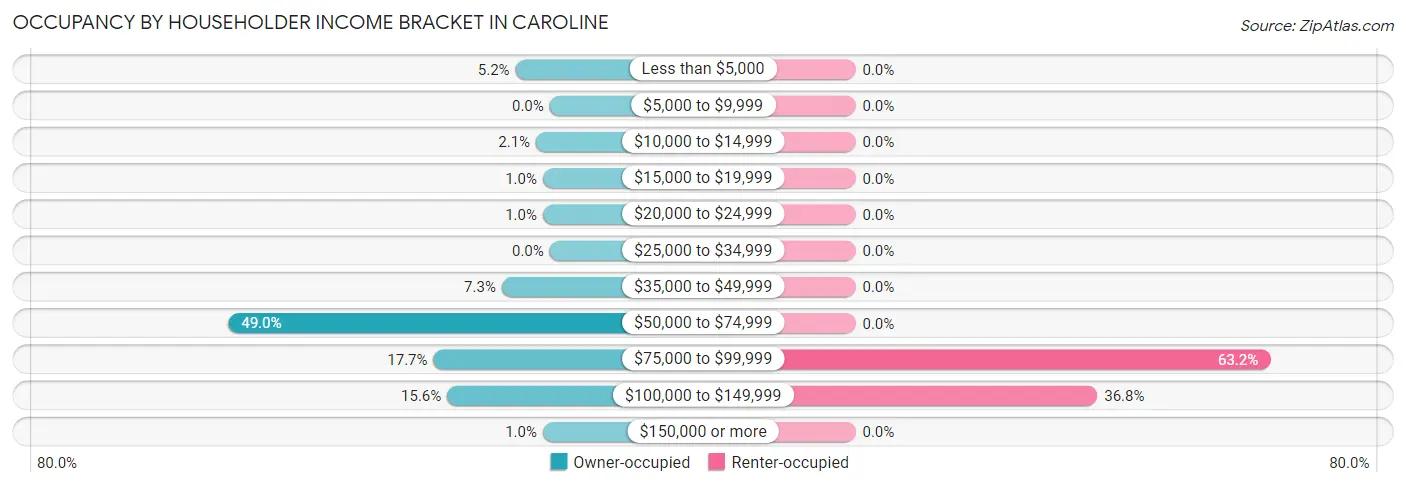
| Income Bracket | Owner-occupied | Renter-occupied |
| Less than $5,000 | 5 (5.2%) | 0 (0.0%) |
| $5,000 to $9,999 | 0 (0.0%) | 0 (0.0%) |
| $10,000 to $14,999 | 2 (2.1%) | 0 (0.0%) |
| $15,000 to $19,999 | 1 (1.0%) | 0 (0.0%) |
| $20,000 to $24,999 | 1 (1.0%) | 0 (0.0%) |
| $25,000 to $34,999 | 0 (0.0%) | 0 (0.0%) |
| $35,000 to $49,999 | 7 (7.3%) | 0 (0.0%) |
| $50,000 to $74,999 | 47 (49.0%) | 0 (0.0%) |
| $75,000 to $99,999 | 17 (17.7%) | 12 (63.2%) |
| $100,000 to $149,999 | 15 (15.6%) | 7 (36.8%) |
| $150,000 or more | 1 (1.0%) | 0 (0.0%) |
| Total | 96 (100.0%) | 19 (100.0%) |
Monthly Housing Cost Tiers in Caroline
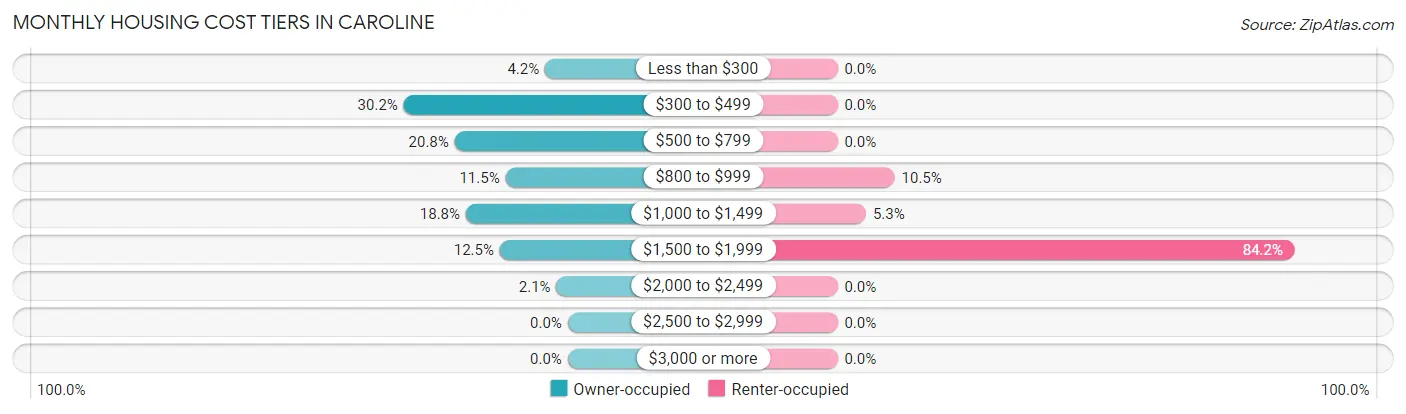
| Monthly Cost | Owner-occupied | Renter-occupied |
| Less than $300 | 4 (4.2%) | 0 (0.0%) |
| $300 to $499 | 29 (30.2%) | 0 (0.0%) |
| $500 to $799 | 20 (20.8%) | 0 (0.0%) |
| $800 to $999 | 11 (11.5%) | 2 (10.5%) |
| $1,000 to $1,499 | 18 (18.8%) | 1 (5.3%) |
| $1,500 to $1,999 | 12 (12.5%) | 16 (84.2%) |
| $2,000 to $2,499 | 2 (2.1%) | 0 (0.0%) |
| $2,500 to $2,999 | 0 (0.0%) | 0 (0.0%) |
| $3,000 or more | 0 (0.0%) | 0 (0.0%) |
| Total | 96 (100.0%) | 19 (100.0%) |
Physical Housing Characteristics in Caroline
Housing Structures in Caroline
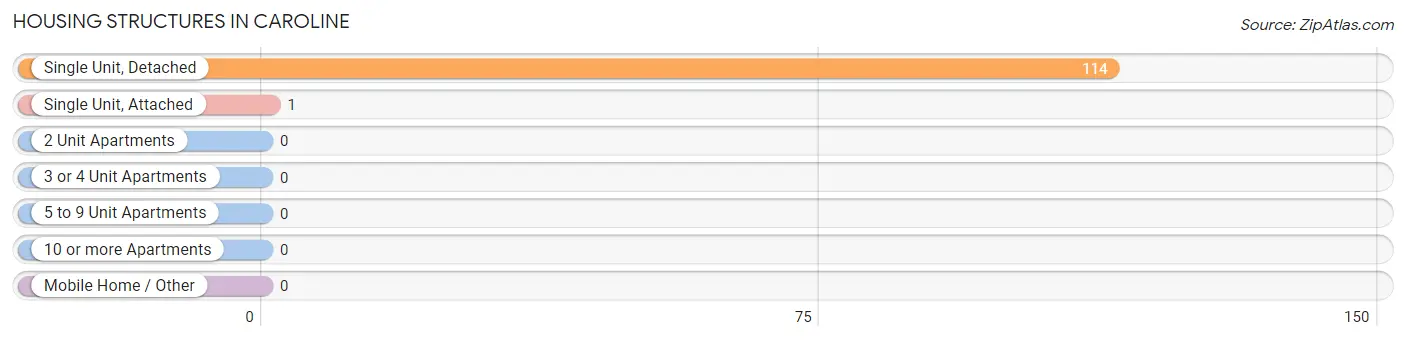
| Structure Type | # Housing Units | % Housing Units |
| Single Unit, Detached | 114 | 99.1% |
| Single Unit, Attached | 1 | 0.9% |
| 2 Unit Apartments | 0 | 0.0% |
| 3 or 4 Unit Apartments | 0 | 0.0% |
| 5 to 9 Unit Apartments | 0 | 0.0% |
| 10 or more Apartments | 0 | 0.0% |
| Mobile Home / Other | 0 | 0.0% |
| Total | 115 | 100.0% |
Housing Structures by Occupancy in Caroline
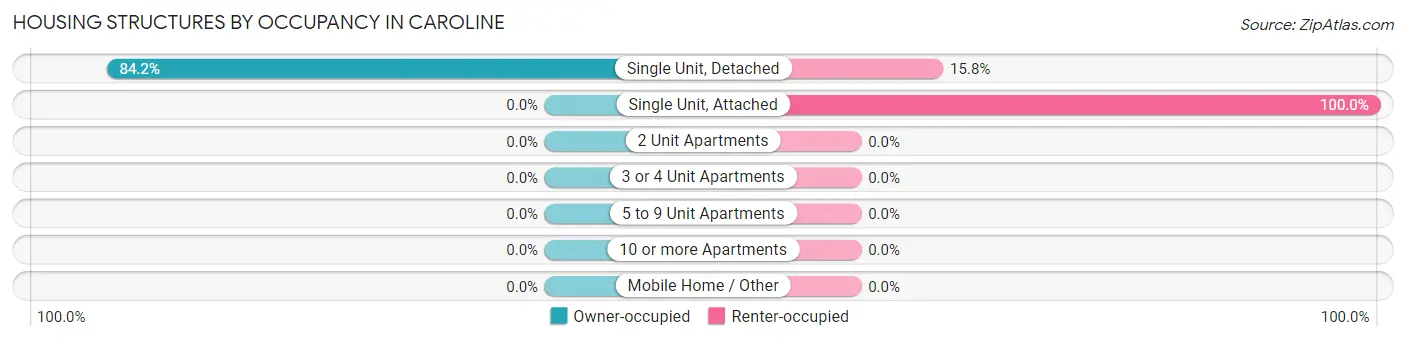
| Structure Type | Owner-occupied | Renter-occupied |
| Single Unit, Detached | 96 (84.2%) | 18 (15.8%) |
| Single Unit, Attached | 0 (0.0%) | 1 (100.0%) |
| 2 Unit Apartments | 0 (0.0%) | 0 (0.0%) |
| 3 or 4 Unit Apartments | 0 (0.0%) | 0 (0.0%) |
| 5 to 9 Unit Apartments | 0 (0.0%) | 0 (0.0%) |
| 10 or more Apartments | 0 (0.0%) | 0 (0.0%) |
| Mobile Home / Other | 0 (0.0%) | 0 (0.0%) |
| Total | 96 (83.5%) | 19 (16.5%) |
Housing Structures by Number of Rooms in Caroline
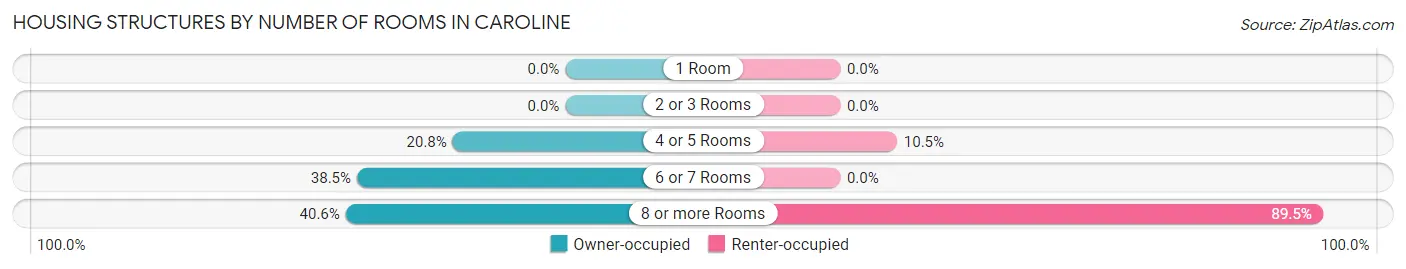
| Number of Rooms | Owner-occupied | Renter-occupied |
| 1 Room | 0 (0.0%) | 0 (0.0%) |
| 2 or 3 Rooms | 0 (0.0%) | 0 (0.0%) |
| 4 or 5 Rooms | 20 (20.8%) | 2 (10.5%) |
| 6 or 7 Rooms | 37 (38.5%) | 0 (0.0%) |
| 8 or more Rooms | 39 (40.6%) | 17 (89.5%) |
| Total | 96 (100.0%) | 19 (100.0%) |
Housing Structure by Heating Type in Caroline
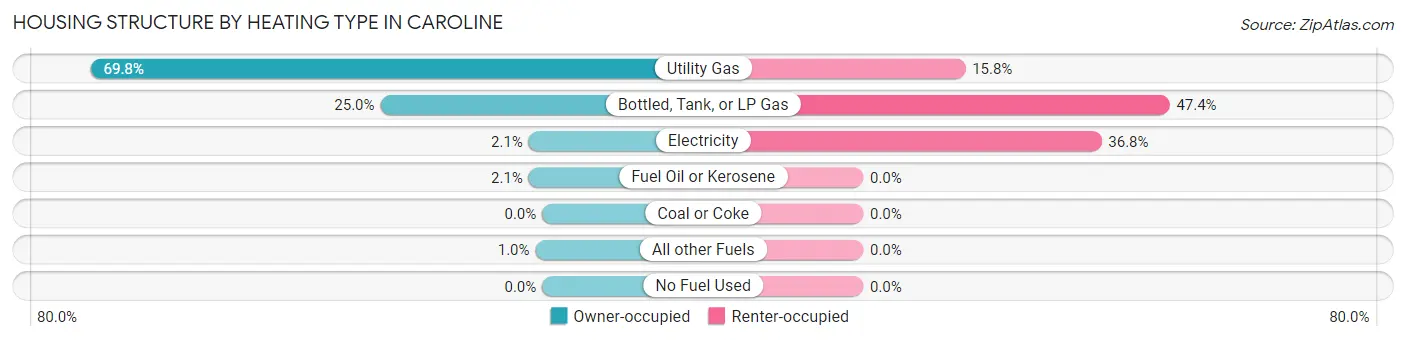
| Heating Type | Owner-occupied | Renter-occupied |
| Utility Gas | 67 (69.8%) | 3 (15.8%) |
| Bottled, Tank, or LP Gas | 24 (25.0%) | 9 (47.4%) |
| Electricity | 2 (2.1%) | 7 (36.8%) |
| Fuel Oil or Kerosene | 2 (2.1%) | 0 (0.0%) |
| Coal or Coke | 0 (0.0%) | 0 (0.0%) |
| All other Fuels | 1 (1.0%) | 0 (0.0%) |
| No Fuel Used | 0 (0.0%) | 0 (0.0%) |
| Total | 96 (100.0%) | 19 (100.0%) |
Household Vehicle Usage in Caroline
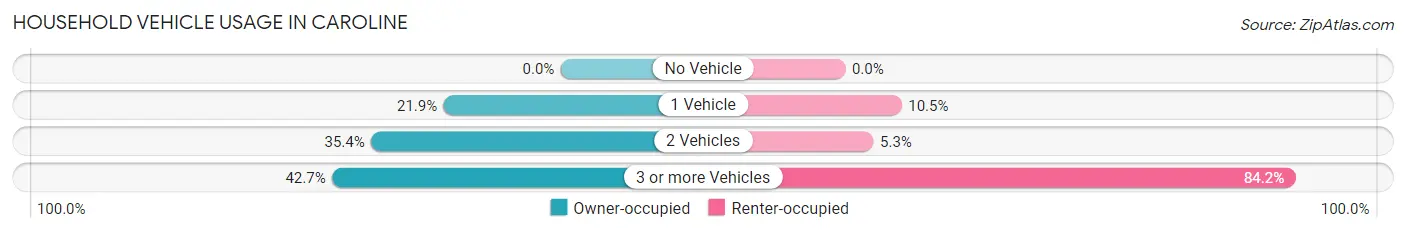
| Vehicles per Household | Owner-occupied | Renter-occupied |
| No Vehicle | 0 (0.0%) | 0 (0.0%) |
| 1 Vehicle | 21 (21.9%) | 2 (10.5%) |
| 2 Vehicles | 34 (35.4%) | 1 (5.3%) |
| 3 or more Vehicles | 41 (42.7%) | 16 (84.2%) |
| Total | 96 (100.0%) | 19 (100.0%) |
Real Estate & Mortgages in Caroline
Real Estate and Mortgage Overview in Caroline
| Characteristic | Without Mortgage | With Mortgage |
| Housing Units | 44 | 52 |
| Median Property Value | - | - |
| Median Household Income | $68,088 | $1 |
| Monthly Housing Costs | $392 | $0 |
| Real Estate Taxes | $1,796 | $1 |
Property Value by Mortgage Status in Caroline
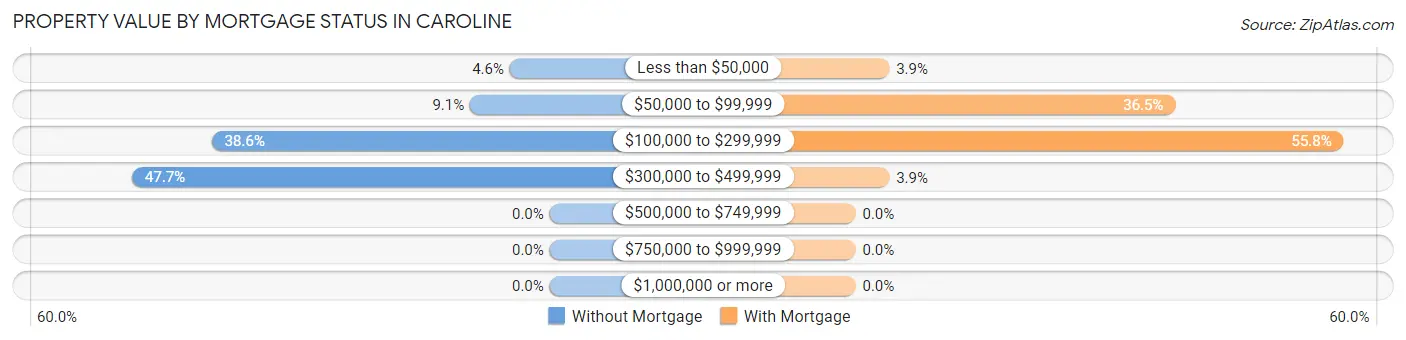
| Property Value | Without Mortgage | With Mortgage |
| Less than $50,000 | 2 (4.5%) | 2 (3.8%) |
| $50,000 to $99,999 | 4 (9.1%) | 19 (36.5%) |
| $100,000 to $299,999 | 17 (38.6%) | 29 (55.8%) |
| $300,000 to $499,999 | 21 (47.7%) | 2 (3.8%) |
| $500,000 to $749,999 | 0 (0.0%) | 0 (0.0%) |
| $750,000 to $999,999 | 0 (0.0%) | 0 (0.0%) |
| $1,000,000 or more | 0 (0.0%) | 0 (0.0%) |
| Total | 44 (100.0%) | 52 (100.0%) |
Household Income by Mortgage Status in Caroline
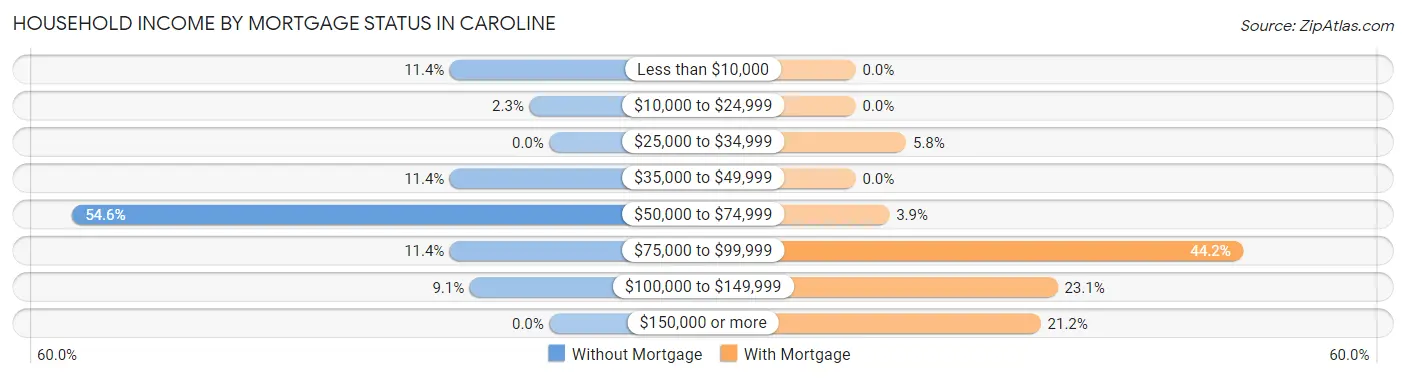
| Household Income | Without Mortgage | With Mortgage |
| Less than $10,000 | 5 (11.4%) | 0 (0.0%) |
| $10,000 to $24,999 | 1 (2.3%) | 0 (0.0%) |
| $25,000 to $34,999 | 0 (0.0%) | 3 (5.8%) |
| $35,000 to $49,999 | 5 (11.4%) | 0 (0.0%) |
| $50,000 to $74,999 | 24 (54.5%) | 2 (3.8%) |
| $75,000 to $99,999 | 5 (11.4%) | 23 (44.2%) |
| $100,000 to $149,999 | 4 (9.1%) | 12 (23.1%) |
| $150,000 or more | 0 (0.0%) | 11 (21.1%) |
| Total | 44 (100.0%) | 52 (100.0%) |
Property Value to Household Income Ratio in Caroline
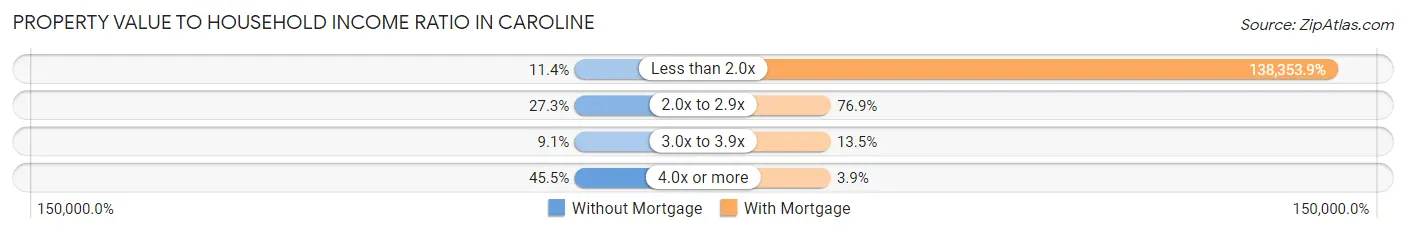
| Value-to-Income Ratio | Without Mortgage | With Mortgage |
| Less than 2.0x | 5 (11.4%) | 71,944 (138,353.9%) |
| 2.0x to 2.9x | 12 (27.3%) | 40 (76.9%) |
| 3.0x to 3.9x | 4 (9.1%) | 7 (13.5%) |
| 4.0x or more | 20 (45.5%) | 2 (3.8%) |
| Total | 44 (100.0%) | 52 (100.0%) |
Real Estate Taxes by Mortgage Status in Caroline
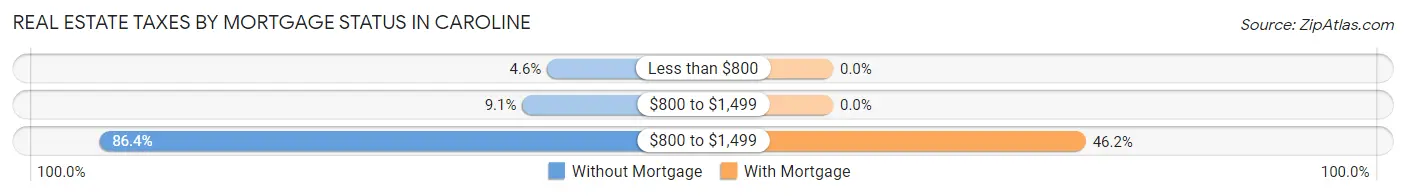
| Property Taxes | Without Mortgage | With Mortgage |
| Less than $800 | 2 (4.5%) | 0 (0.0%) |
| $800 to $1,499 | 4 (9.1%) | 0 (0.0%) |
| $800 to $1,499 | 38 (86.4%) | 24 (46.2%) |
| Total | 44 (100.0%) | 52 (100.0%) |
Health & Disability in Caroline
Health Insurance Coverage by Age in Caroline
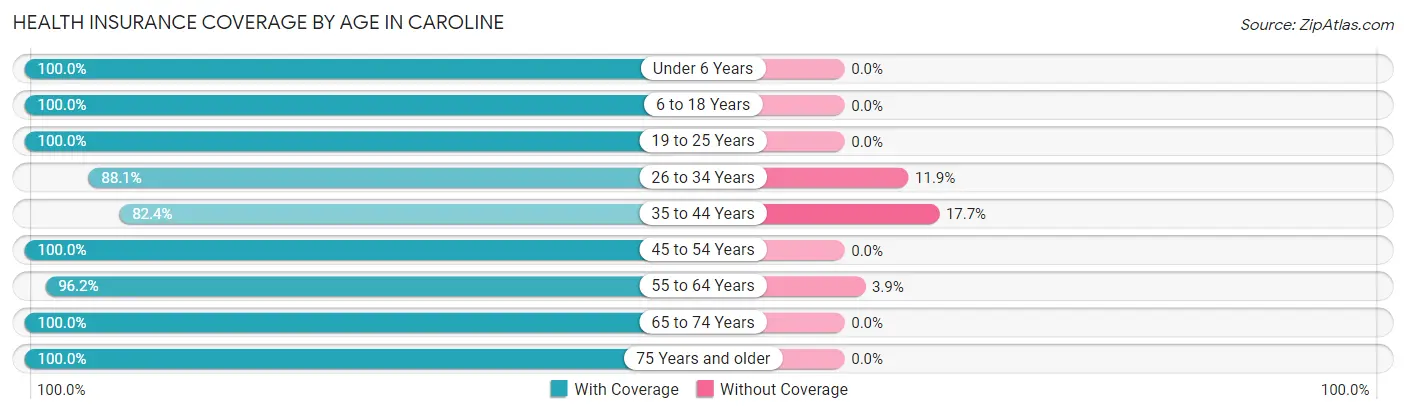
| Age Bracket | With Coverage | Without Coverage |
| Under 6 Years | 55 (100.0%) | 0 (0.0%) |
| 6 to 18 Years | 119 (100.0%) | 0 (0.0%) |
| 19 to 25 Years | 7 (100.0%) | 0 (0.0%) |
| 26 to 34 Years | 37 (88.1%) | 5 (11.9%) |
| 35 to 44 Years | 42 (82.4%) | 9 (17.6%) |
| 45 to 54 Years | 33 (100.0%) | 0 (0.0%) |
| 55 to 64 Years | 50 (96.2%) | 2 (3.8%) |
| 65 to 74 Years | 36 (100.0%) | 0 (0.0%) |
| 75 Years and older | 11 (100.0%) | 0 (0.0%) |
| Total | 390 (96.1%) | 16 (3.9%) |
Health Insurance Coverage by Citizenship Status in Caroline
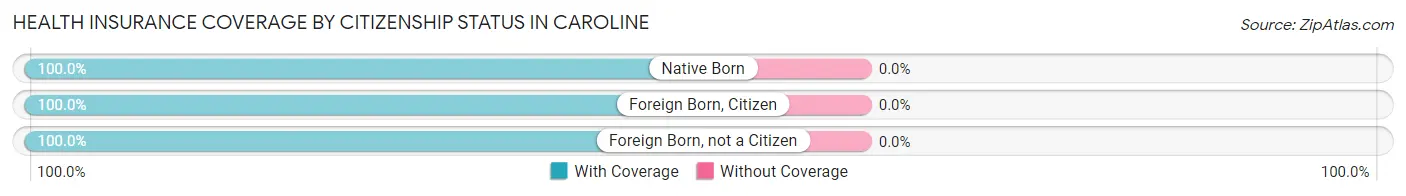
| Citizenship Status | With Coverage | Without Coverage |
| Native Born | 55 (100.0%) | 0 (0.0%) |
| Foreign Born, Citizen | 119 (100.0%) | 0 (0.0%) |
| Foreign Born, not a Citizen | 7 (100.0%) | 0 (0.0%) |
Health Insurance Coverage by Household Income in Caroline
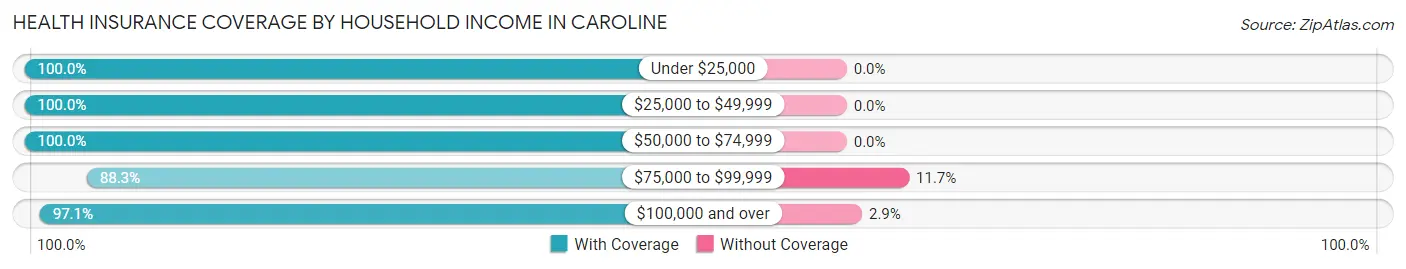
| Household Income | With Coverage | Without Coverage |
| Under $25,000 | 9 (100.0%) | 0 (0.0%) |
| $25,000 to $49,999 | 13 (100.0%) | 0 (0.0%) |
| $50,000 to $74,999 | 194 (100.0%) | 0 (0.0%) |
| $75,000 to $99,999 | 106 (88.3%) | 14 (11.7%) |
| $100,000 and over | 68 (97.1%) | 2 (2.9%) |
Public vs Private Health Insurance Coverage by Age in Caroline
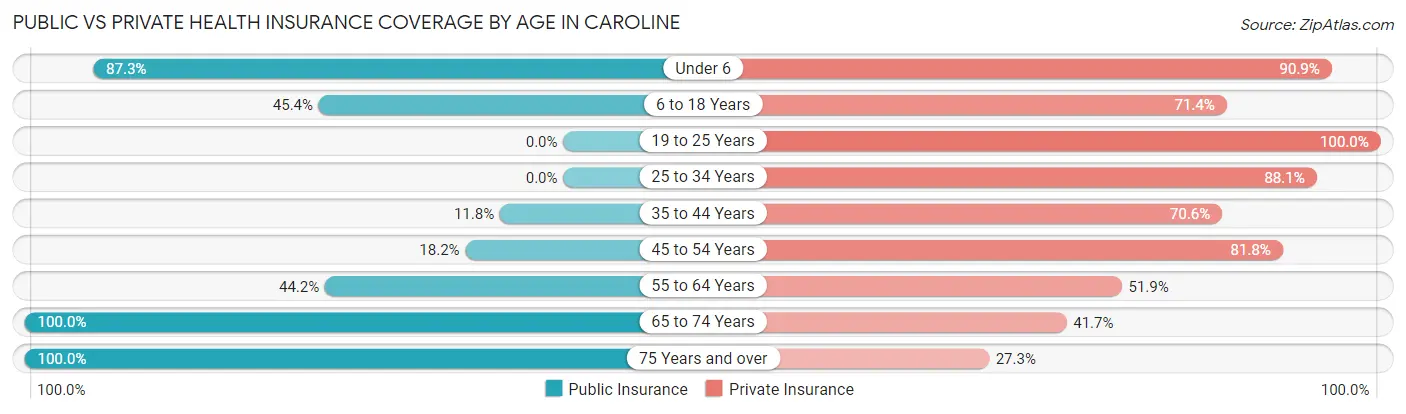
| Age Bracket | Public Insurance | Private Insurance |
| Under 6 | 48 (87.3%) | 50 (90.9%) |
| 6 to 18 Years | 54 (45.4%) | 85 (71.4%) |
| 19 to 25 Years | 0 (0.0%) | 7 (100.0%) |
| 25 to 34 Years | 0 (0.0%) | 37 (88.1%) |
| 35 to 44 Years | 6 (11.8%) | 36 (70.6%) |
| 45 to 54 Years | 6 (18.2%) | 27 (81.8%) |
| 55 to 64 Years | 23 (44.2%) | 27 (51.9%) |
| 65 to 74 Years | 36 (100.0%) | 15 (41.7%) |
| 75 Years and over | 11 (100.0%) | 3 (27.3%) |
| Total | 184 (45.3%) | 287 (70.7%) |
Disability Status by Sex by Age in Caroline
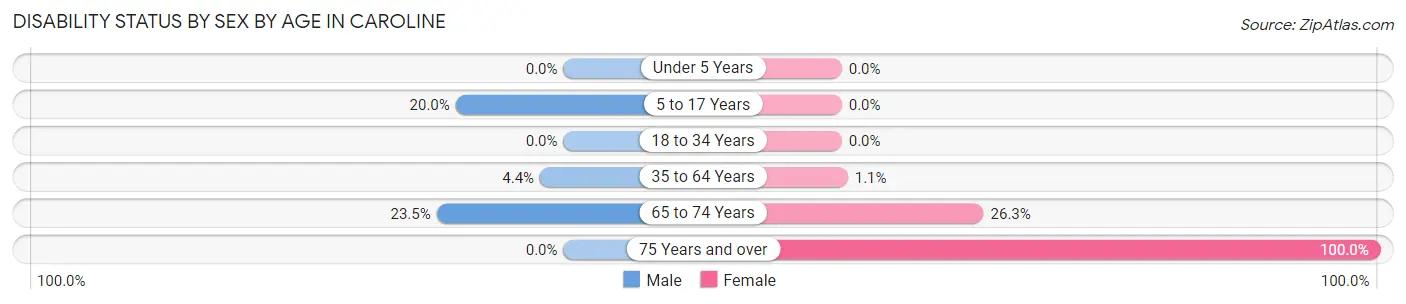
| Age Bracket | Male | Female |
| Under 5 Years | 0 (0.0%) | 0 (0.0%) |
| 5 to 17 Years | 10 (20.0%) | 0 (0.0%) |
| 18 to 34 Years | 0 (0.0%) | 0 (0.0%) |
| 35 to 64 Years | 2 (4.3%) | 1 (1.1%) |
| 65 to 74 Years | 4 (23.5%) | 5 (26.3%) |
| 75 Years and over | 0 (0.0%) | 4 (100.0%) |
Disability Class by Sex by Age in Caroline
Disability Class: Hearing Difficulty
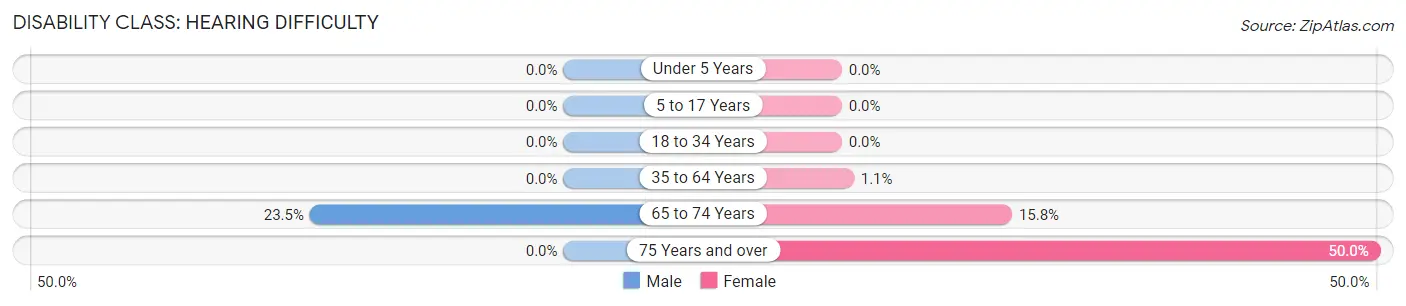
| Age Bracket | Male | Female |
| Under 5 Years | 0 (0.0%) | 0 (0.0%) |
| 5 to 17 Years | 0 (0.0%) | 0 (0.0%) |
| 18 to 34 Years | 0 (0.0%) | 0 (0.0%) |
| 35 to 64 Years | 0 (0.0%) | 1 (1.1%) |
| 65 to 74 Years | 4 (23.5%) | 3 (15.8%) |
| 75 Years and over | 0 (0.0%) | 2 (50.0%) |
Disability Class: Vision Difficulty
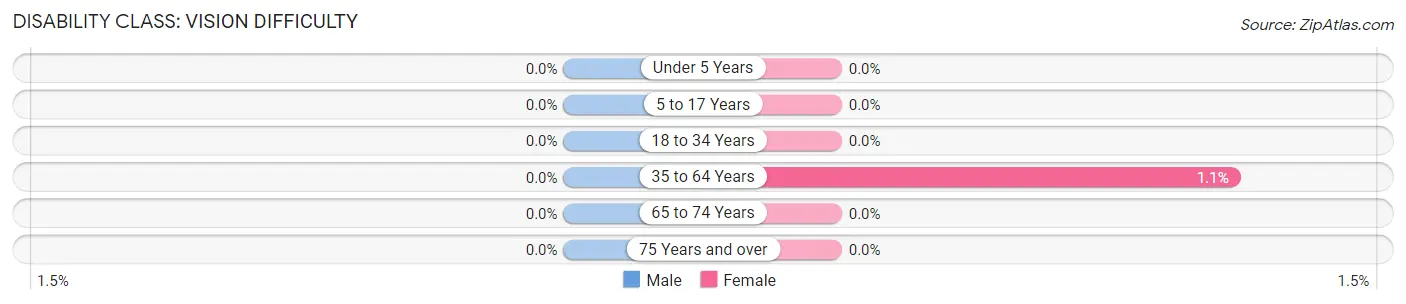
| Age Bracket | Male | Female |
| Under 5 Years | 0 (0.0%) | 0 (0.0%) |
| 5 to 17 Years | 0 (0.0%) | 0 (0.0%) |
| 18 to 34 Years | 0 (0.0%) | 0 (0.0%) |
| 35 to 64 Years | 0 (0.0%) | 1 (1.1%) |
| 65 to 74 Years | 0 (0.0%) | 0 (0.0%) |
| 75 Years and over | 0 (0.0%) | 0 (0.0%) |
Disability Class: Cognitive Difficulty
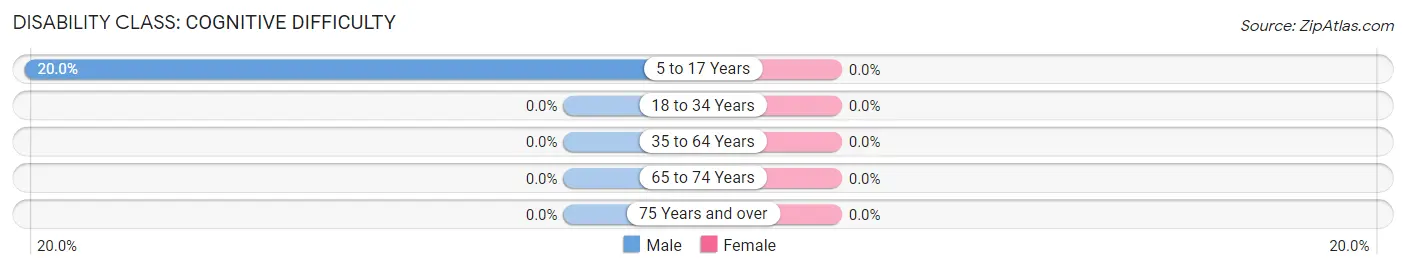
| Age Bracket | Male | Female |
| 5 to 17 Years | 10 (20.0%) | 0 (0.0%) |
| 18 to 34 Years | 0 (0.0%) | 0 (0.0%) |
| 35 to 64 Years | 0 (0.0%) | 0 (0.0%) |
| 65 to 74 Years | 0 (0.0%) | 0 (0.0%) |
| 75 Years and over | 0 (0.0%) | 0 (0.0%) |
Disability Class: Ambulatory Difficulty
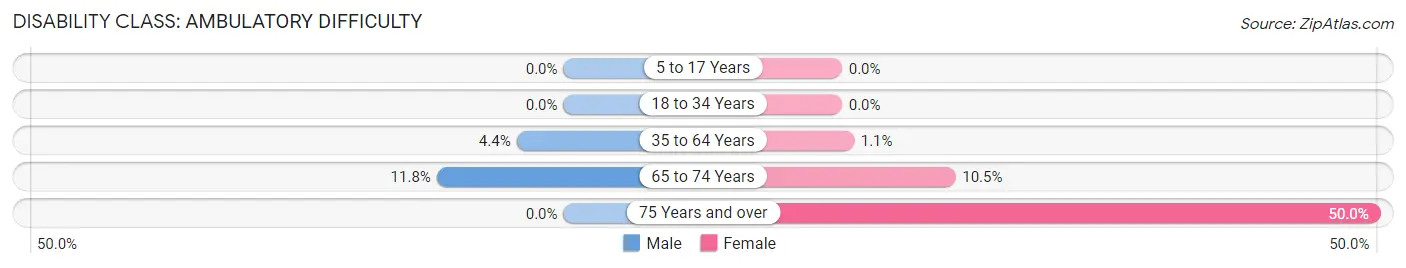
| Age Bracket | Male | Female |
| 5 to 17 Years | 0 (0.0%) | 0 (0.0%) |
| 18 to 34 Years | 0 (0.0%) | 0 (0.0%) |
| 35 to 64 Years | 2 (4.3%) | 1 (1.1%) |
| 65 to 74 Years | 2 (11.8%) | 2 (10.5%) |
| 75 Years and over | 0 (0.0%) | 2 (50.0%) |
Disability Class: Self-Care Difficulty
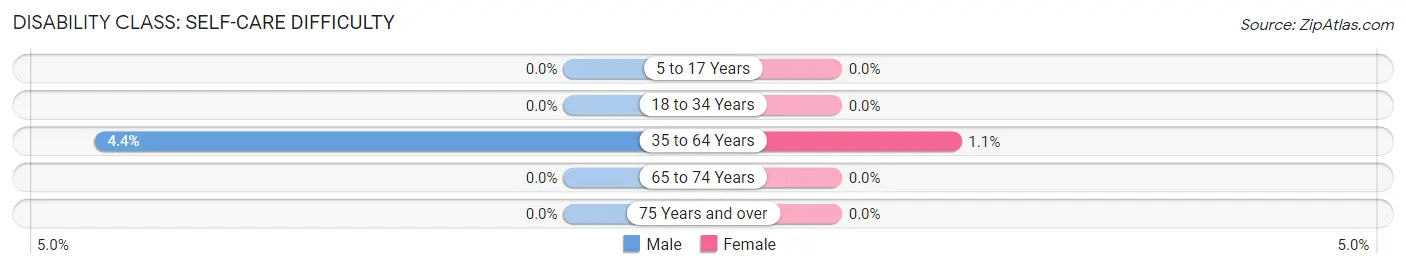
| Age Bracket | Male | Female |
| 5 to 17 Years | 0 (0.0%) | 0 (0.0%) |
| 18 to 34 Years | 0 (0.0%) | 0 (0.0%) |
| 35 to 64 Years | 2 (4.3%) | 1 (1.1%) |
| 65 to 74 Years | 0 (0.0%) | 0 (0.0%) |
| 75 Years and over | 0 (0.0%) | 0 (0.0%) |
Technology Access in Caroline
Computing Device Access in Caroline
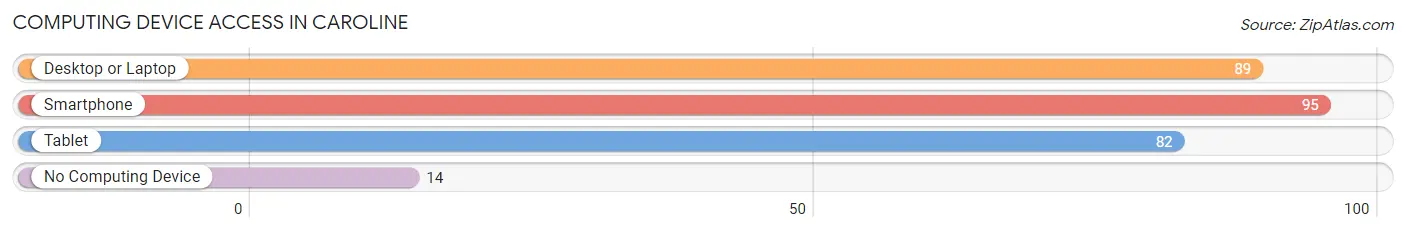
| Device Type | # Households | % Households |
| Desktop or Laptop | 89 | 77.4% |
| Smartphone | 95 | 82.6% |
| Tablet | 82 | 71.3% |
| No Computing Device | 14 | 12.2% |
| Total | 115 | 100.0% |
Internet Access in Caroline
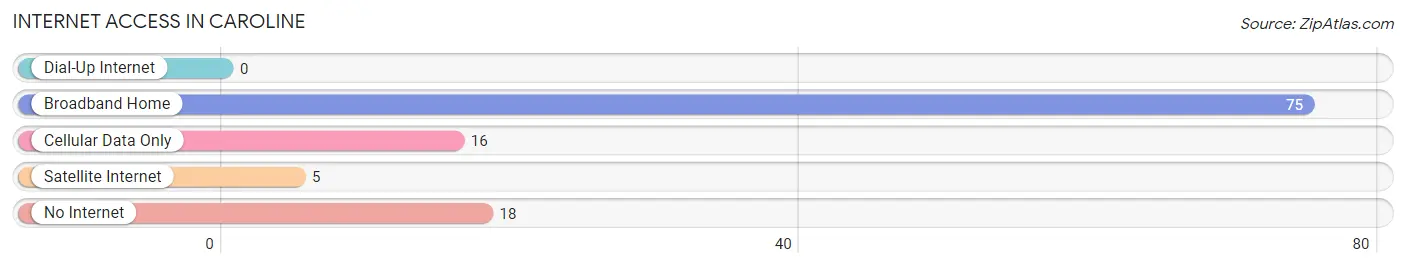
| Internet Type | # Households | % Households |
| Dial-Up Internet | 0 | 0.0% |
| Broadband Home | 75 | 65.2% |
| Cellular Data Only | 16 | 13.9% |
| Satellite Internet | 5 | 4.3% |
| No Internet | 18 | 15.7% |
| Total | 115 | 100.0% |
Caroline Summary
Caroline, Wisconsin is a small town located in the northern part of the state, in Marinette County. It is situated on the banks of the Peshtigo River, and is surrounded by the Nicolet National Forest. The town was founded in 1876, and has a population of just over 500 people.
Geography
Caroline is located in the northern part of Wisconsin, in Marinette County. It is situated on the banks of the Peshtigo River, and is surrounded by the Nicolet National Forest. The town is located in a rural area, and is surrounded by forests and lakes. The nearest major city is Green Bay, which is about an hour away.
The town is located in a temperate climate, with warm summers and cold winters. The average temperature in the summer is around 70 degrees Fahrenheit, and in the winter it is around 20 degrees Fahrenheit. The town receives an average of 40 inches of precipitation each year, with most of it falling in the form of snow.
Economy
The economy of Caroline is largely based on agriculture and forestry. The town is home to several farms, which produce a variety of crops, including corn, soybeans, and hay. The town also has a sawmill, which produces lumber for the local market.
The town also has a few small businesses, including a grocery store, a hardware store, and a few restaurants. The town also has a few tourist attractions, including a museum and a historic site.
Demographics
As of the 2010 census, the population of Caroline was 514 people. The town is predominantly white, with 95.3% of the population being white. The median household income is $41,250, and the median age is 44.7 years.
The town is served by the Marinette County School District, which has one elementary school and one high school. The town also has a public library, which offers a variety of services to the community.
Conclusion
Caroline, Wisconsin is a small town located in the northern part of the state, in Marinette County. It is situated on the banks of the Peshtigo River, and is surrounded by the Nicolet National Forest. The town was founded in 1876, and has a population of just over 500 people. The economy of Caroline is largely based on agriculture and forestry, and the town is served by the Marinette County School District. The town is predominantly white, with 95.3% of the population being white, and the median household income is $41,250. Caroline is a small town with a rich history and a strong sense of community.
Common Questions
What is Per Capita Income in Caroline?
Per Capita income in Caroline is $23,524.
What is the Median Family Income in Caroline?
Median Family Income in Caroline is $72,222.
What is the Median Household income in Caroline?
Median Household Income in Caroline is $70,972.
What is Inequality or Gini Index in Caroline?
Inequality or Gini Index in Caroline is 0.25.
What is the Total Population of Caroline?
Total Population of Caroline is 406.
What is the Total Male Population of Caroline?
Total Male Population of Caroline is 176.
What is the Total Female Population of Caroline?
Total Female Population of Caroline is 230.
What is the Ratio of Males per 100 Females in Caroline?
There are 76.52 Males per 100 Females in Caroline.
What is the Ratio of Females per 100 Males in Caroline?
There are 130.68 Females per 100 Males in Caroline.
What is the Median Population Age in Caroline?
Median Population Age in Caroline is 33.2 Years.
What is the Average Family Size in Caroline
Average Family Size in Caroline is 4.1 People.
What is the Average Household Size in Caroline
Average Household Size in Caroline is 3.5 People.
How Large is the Labor Force in Caroline?
There are 133 People in the Labor Forcein in Caroline.
What is the Percentage of People in the Labor Force in Caroline?
55.6% of People are in the Labor Force in Caroline.
What is the Unemployment Rate in Caroline?
Unemployment Rate in Caroline is 3.8%.