Cameron, WI Map & Demographics
Cameron Map
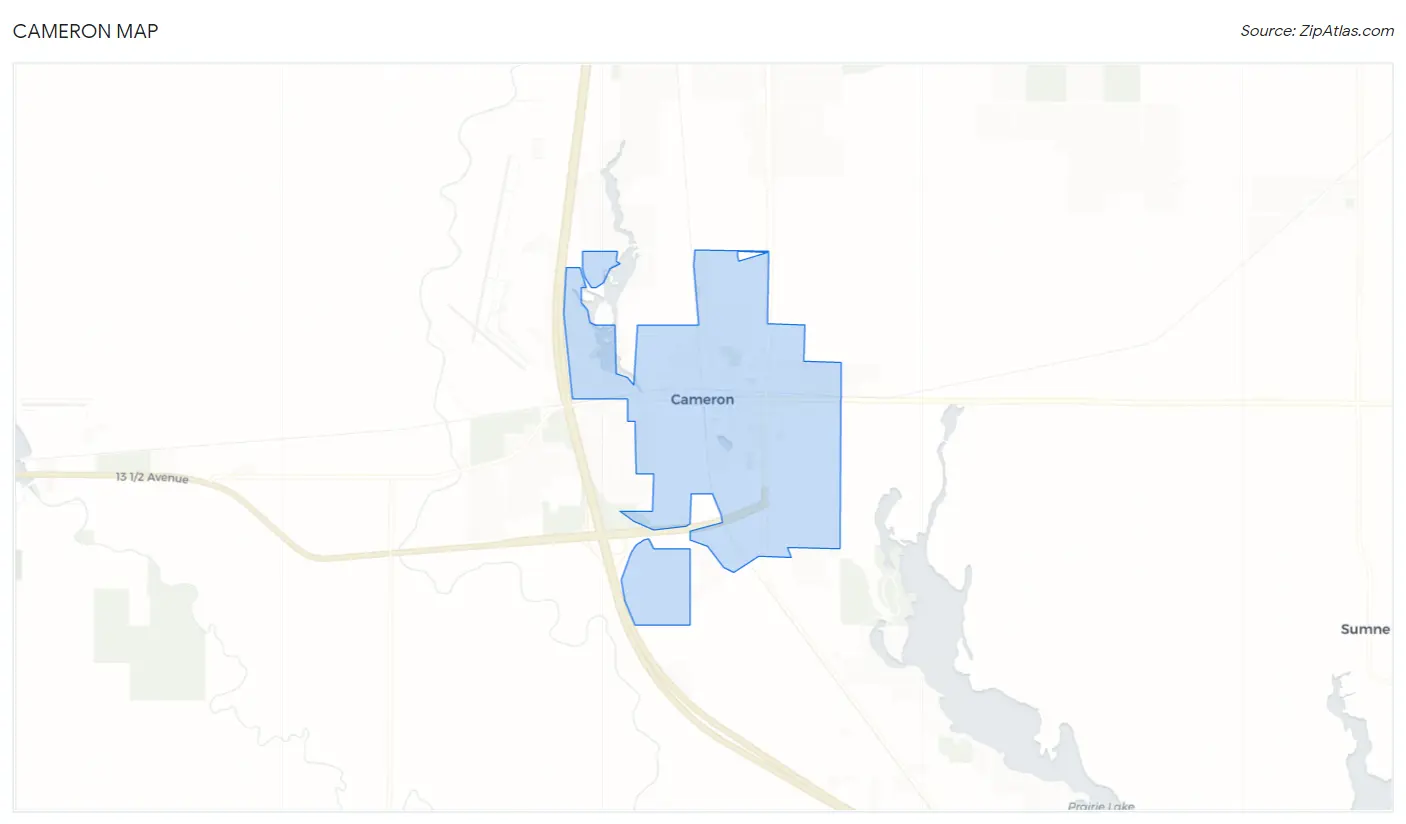
Cameron Overview
$27,954
PER CAPITA INCOME
$79,643
AVG FAMILY INCOME
$65,132
AVG HOUSEHOLD INCOME
34.2%
WAGE / INCOME GAP [ % ]
65.8¢/ $1
WAGE / INCOME GAP [ $ ]
$7,072
FAMILY INCOME DEFICIT
0.39
INEQUALITY / GINI INDEX
1,800
TOTAL POPULATION
860
MALE POPULATION
940
FEMALE POPULATION
91.49
MALES / 100 FEMALES
109.30
FEMALES / 100 MALES
32.9
MEDIAN AGE
3.4
AVG FAMILY SIZE
2.6
AVG HOUSEHOLD SIZE
961
LABOR FORCE [ PEOPLE ]
71.1%
PERCENT IN LABOR FORCE
2.1%
UNEMPLOYMENT RATE
Cameron Zip Codes
Cameron Area Codes
Income in Cameron
Income Overview in Cameron
Per Capita Income in Cameron is $27,954, while median incomes of families and households are $79,643 and $65,132 respectively.
| Characteristic | Number | Measure |
| Per Capita Income | 1,800 | $27,954 |
| Median Family Income | 416 | $79,643 |
| Mean Family Income | 416 | $92,987 |
| Median Household Income | 700 | $65,132 |
| Mean Household Income | 700 | $73,891 |
| Income Deficit | 416 | $7,072 |
| Wage / Income Gap (%) | 1,800 | 34.25% |
| Wage / Income Gap ($) | 1,800 | 65.75¢ per $1 |
| Gini / Inequality Index | 1,800 | 0.39 |
Earnings by Sex in Cameron
Average Earnings in Cameron are $34,397, $43,056 for men and $28,311 for women, a difference of 34.3%.
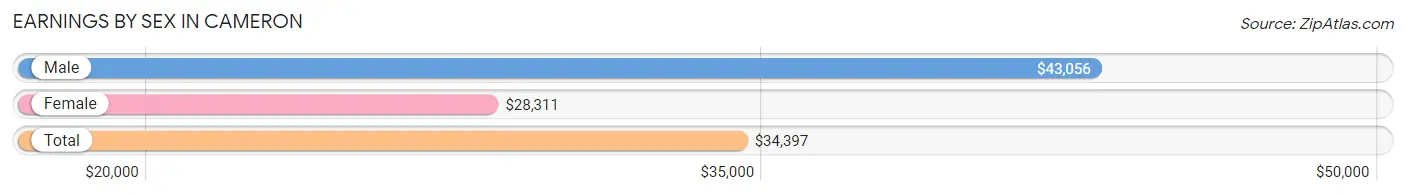
| Sex | Number | Average Earnings |
| Male | 536 (53.6%) | $43,056 |
| Female | 464 (46.4%) | $28,311 |
| Total | 1,000 (100.0%) | $34,397 |
Earnings by Sex by Income Bracket in Cameron
The most common earnings brackets in Cameron are $55,000 to $64,999 for men (80 | 14.9%) and $45,000 to $49,999 for women (67 | 14.4%).
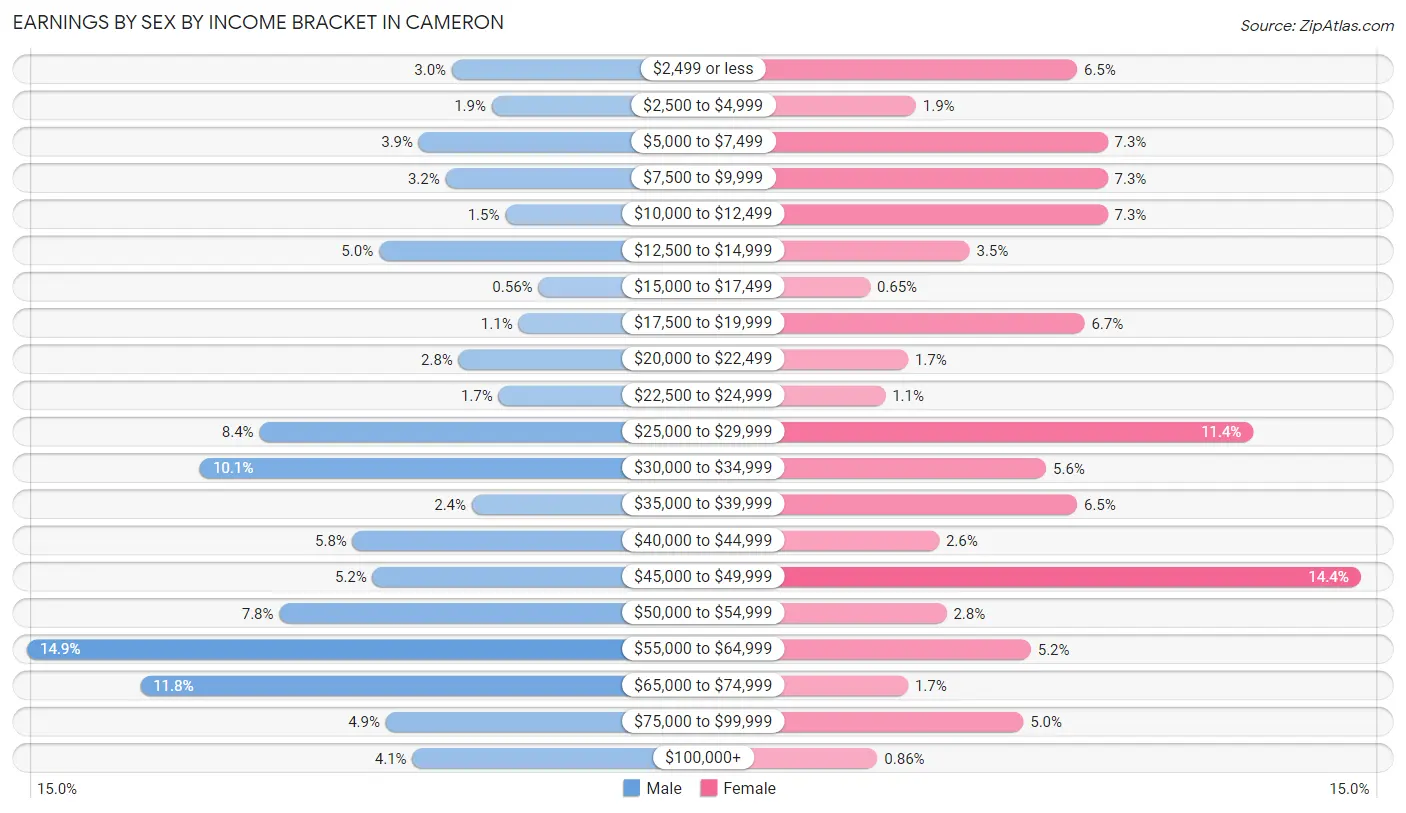
| Income | Male | Female |
| $2,499 or less | 16 (3.0%) | 30 (6.5%) |
| $2,500 to $4,999 | 10 (1.9%) | 9 (1.9%) |
| $5,000 to $7,499 | 21 (3.9%) | 34 (7.3%) |
| $7,500 to $9,999 | 17 (3.2%) | 34 (7.3%) |
| $10,000 to $12,499 | 8 (1.5%) | 34 (7.3%) |
| $12,500 to $14,999 | 27 (5.0%) | 16 (3.5%) |
| $15,000 to $17,499 | 3 (0.6%) | 3 (0.6%) |
| $17,500 to $19,999 | 6 (1.1%) | 31 (6.7%) |
| $20,000 to $22,499 | 15 (2.8%) | 8 (1.7%) |
| $22,500 to $24,999 | 9 (1.7%) | 5 (1.1%) |
| $25,000 to $29,999 | 45 (8.4%) | 53 (11.4%) |
| $30,000 to $34,999 | 54 (10.1%) | 26 (5.6%) |
| $35,000 to $39,999 | 13 (2.4%) | 30 (6.5%) |
| $40,000 to $44,999 | 31 (5.8%) | 12 (2.6%) |
| $45,000 to $49,999 | 28 (5.2%) | 67 (14.4%) |
| $50,000 to $54,999 | 42 (7.8%) | 13 (2.8%) |
| $55,000 to $64,999 | 80 (14.9%) | 24 (5.2%) |
| $65,000 to $74,999 | 63 (11.7%) | 8 (1.7%) |
| $75,000 to $99,999 | 26 (4.9%) | 23 (5.0%) |
| $100,000+ | 22 (4.1%) | 4 (0.9%) |
| Total | 536 (100.0%) | 464 (100.0%) |
Earnings by Sex by Educational Attainment in Cameron
Average earnings in Cameron are $51,296 for men and $35,043 for women, a difference of 31.7%. Men with an educational attainment of college or associate's degree enjoy the highest average annual earnings of $55,662, while those with high school diploma education earn the least with $34,539. Women with an educational attainment of bachelor's degree earn the most with the average annual earnings of $49,688, while those with college or associate's degree education have the smallest earnings of $35,000.
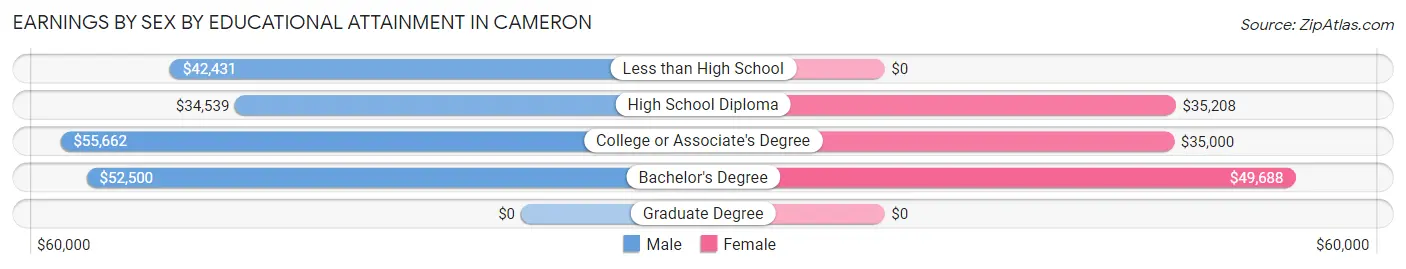
| Educational Attainment | Male Income | Female Income |
| Less than High School | $42,431 | $0 |
| High School Diploma | $34,539 | $35,208 |
| College or Associate's Degree | $55,662 | $35,000 |
| Bachelor's Degree | $52,500 | $49,688 |
| Graduate Degree | - | - |
| Total | $51,296 | $35,043 |
Family Income in Cameron
Family Income Brackets in Cameron
According to the Cameron family income data, there are 101 families falling into the $100,000 to $149,999 income range, which is the most common income bracket and makes up 24.3% of all families. Conversely, the $10,000 to $14,999 income bracket is the least frequent group with only 3 families (0.7%) belonging to this category.
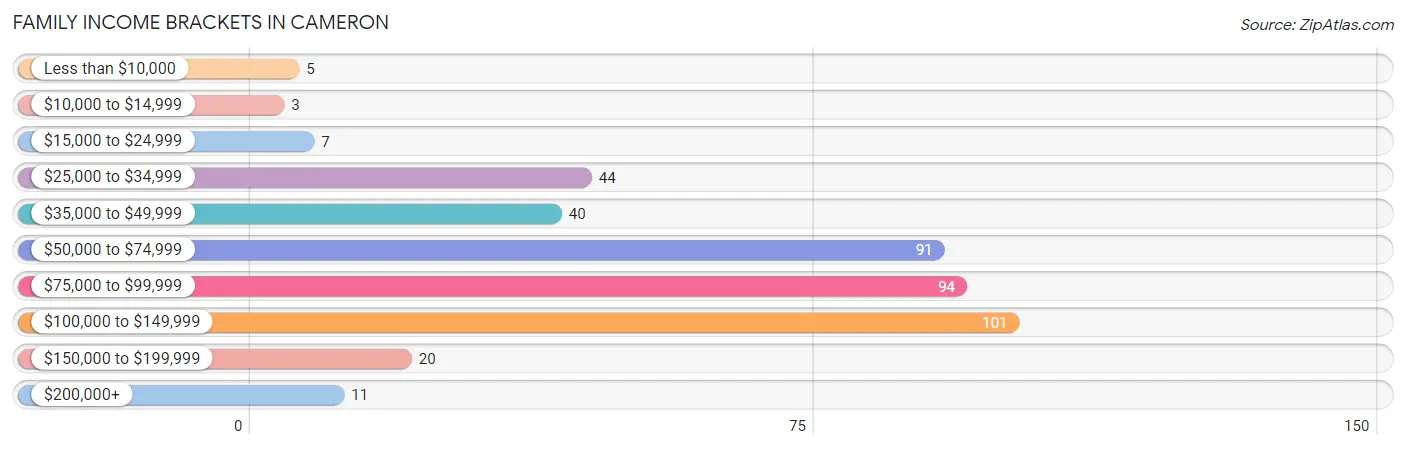
| Income Bracket | # Families | % Families |
| Less than $10,000 | 5 | 1.2% |
| $10,000 to $14,999 | 3 | 0.7% |
| $15,000 to $24,999 | 7 | 1.7% |
| $25,000 to $34,999 | 44 | 10.6% |
| $35,000 to $49,999 | 40 | 9.6% |
| $50,000 to $74,999 | 91 | 21.9% |
| $75,000 to $99,999 | 94 | 22.6% |
| $100,000 to $149,999 | 101 | 24.3% |
| $150,000 to $199,999 | 20 | 4.8% |
| $200,000+ | 11 | 2.6% |
Family Income by Famaliy Size in Cameron
5-person families (100 | 24.0%) account for the highest median family income in Cameron with $98,125 per family, while 2-person families (135 | 32.5%) have the highest median income of $29,196 per family member.
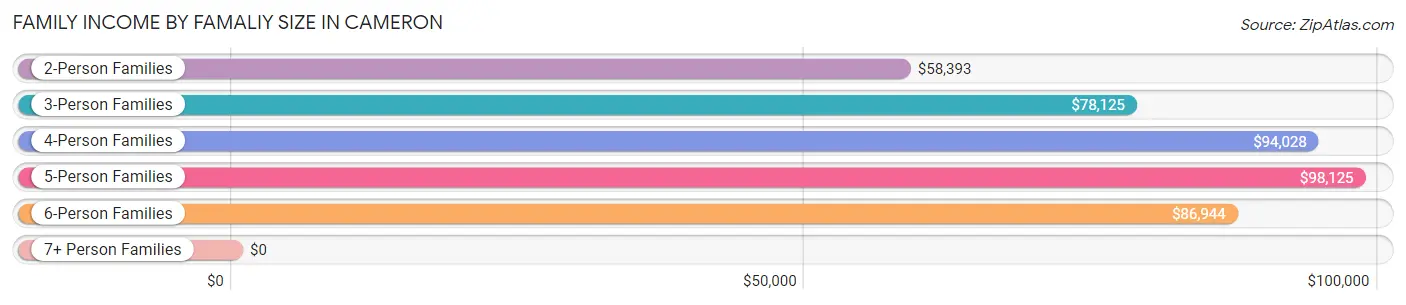
| Income Bracket | # Families | Median Income |
| 2-Person Families | 135 (32.5%) | $58,393 |
| 3-Person Families | 64 (15.4%) | $78,125 |
| 4-Person Families | 100 (24.0%) | $94,028 |
| 5-Person Families | 100 (24.0%) | $98,125 |
| 6-Person Families | 14 (3.4%) | $86,944 |
| 7+ Person Families | 3 (0.7%) | $0 |
| Total | 416 (100.0%) | $79,643 |
Family Income by Number of Earners in Cameron
The median family income in Cameron is $79,643, with families comprising 3+ earners (97) having the highest median family income of $117,917, while families with no earners (35) have the lowest median family income of $37,875, accounting for 23.3% and 8.4% of families, respectively.
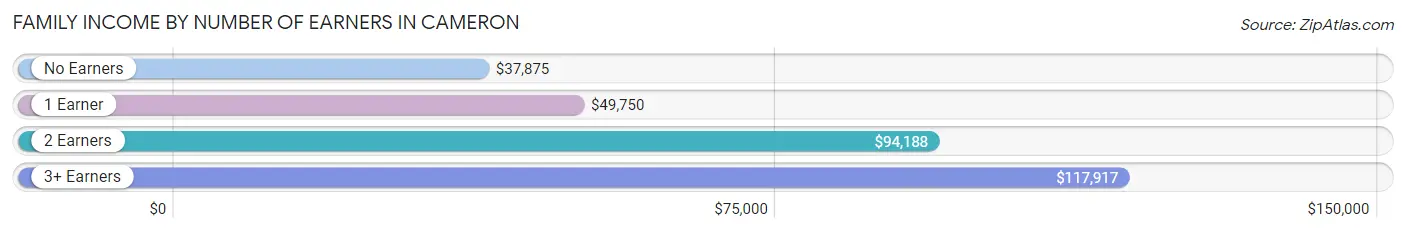
| Number of Earners | # Families | Median Income |
| No Earners | 35 (8.4%) | $37,875 |
| 1 Earner | 111 (26.7%) | $49,750 |
| 2 Earners | 173 (41.6%) | $94,188 |
| 3+ Earners | 97 (23.3%) | $117,917 |
| Total | 416 (100.0%) | $79,643 |
Household Income in Cameron
Household Income Brackets in Cameron
With 153 households falling in the category, the $50,000 to $74,999 income range is the most frequent in Cameron, accounting for 21.9% of all households. In contrast, only 11 households (1.6%) fall into the $200,000+ income bracket, making it the least populous group.
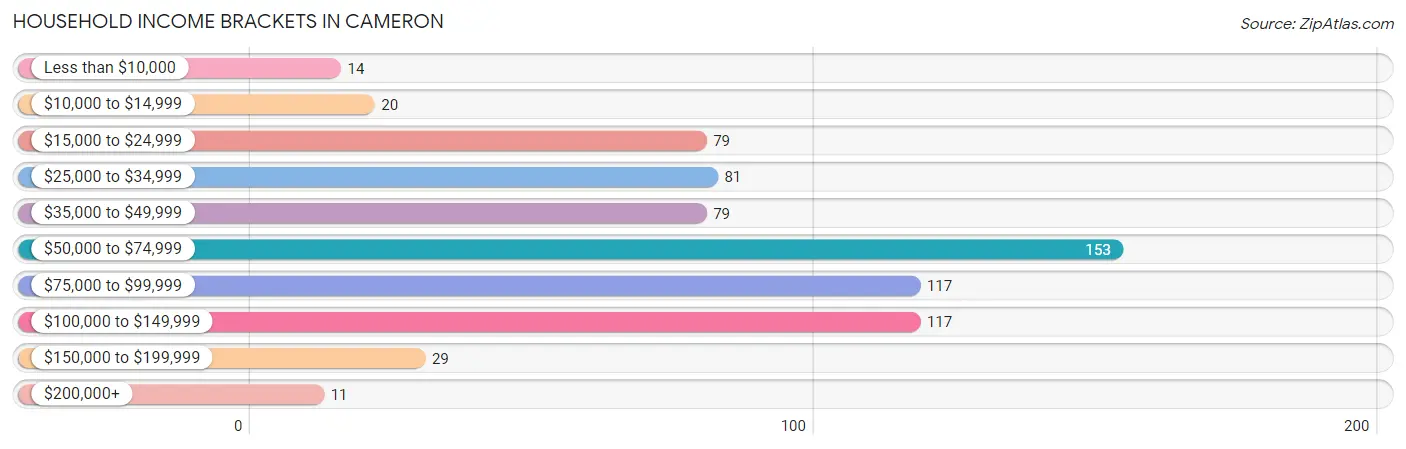
| Income Bracket | # Households | % Households |
| Less than $10,000 | 14 | 2.0% |
| $10,000 to $14,999 | 20 | 2.9% |
| $15,000 to $24,999 | 79 | 11.3% |
| $25,000 to $34,999 | 81 | 11.6% |
| $35,000 to $49,999 | 79 | 11.3% |
| $50,000 to $74,999 | 153 | 21.9% |
| $75,000 to $99,999 | 117 | 16.7% |
| $100,000 to $149,999 | 117 | 16.7% |
| $150,000 to $199,999 | 29 | 4.1% |
| $200,000+ | 11 | 1.6% |
Household Income by Householder Age in Cameron
The median household income in Cameron is $65,132, with the highest median household income of $73,309 found in the 25 to 44 years age bracket for the primary householder. A total of 275 households (39.3%) fall into this category. Meanwhile, the 65+ years age bracket for the primary householder has the lowest median household income of $32,500, with 156 households (22.3%) in this group.
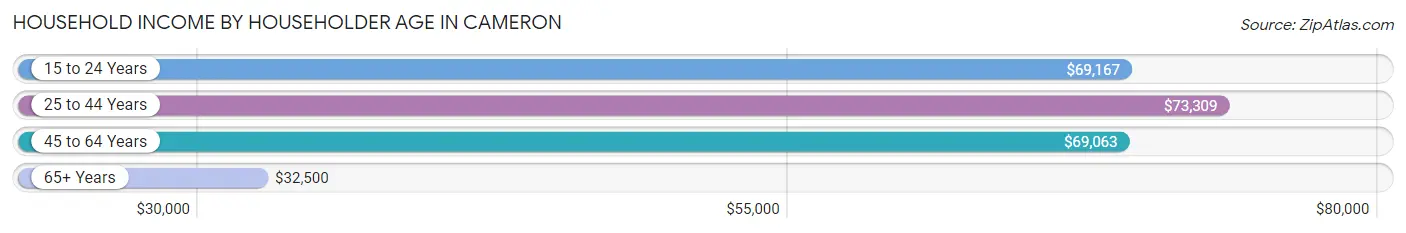
| Income Bracket | # Households | Median Income |
| 15 to 24 Years | 42 (6.0%) | $69,167 |
| 25 to 44 Years | 275 (39.3%) | $73,309 |
| 45 to 64 Years | 227 (32.4%) | $69,063 |
| 65+ Years | 156 (22.3%) | $32,500 |
| Total | 700 (100.0%) | $65,132 |
Poverty in Cameron
Income Below Poverty by Sex and Age in Cameron
With 10.6% poverty level for males and 6.9% for females among the residents of Cameron, 5 year old males and 6 to 11 year old females are the most vulnerable to poverty, with 3 males (30.0%) and 20 females (17.4%) in their respective age groups living below the poverty level.
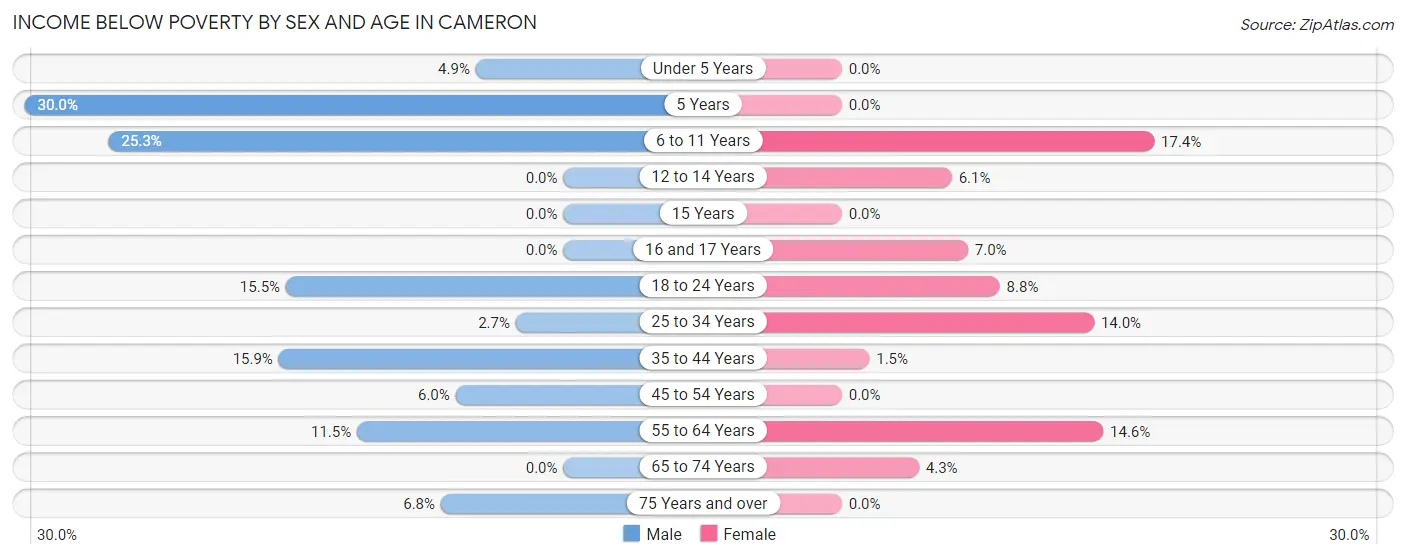
| Age Bracket | Male | Female |
| Under 5 Years | 4 (4.9%) | 0 (0.0%) |
| 5 Years | 3 (30.0%) | 0 (0.0%) |
| 6 to 11 Years | 19 (25.3%) | 20 (17.4%) |
| 12 to 14 Years | 0 (0.0%) | 3 (6.1%) |
| 15 Years | 0 (0.0%) | 0 (0.0%) |
| 16 and 17 Years | 0 (0.0%) | 4 (7.0%) |
| 18 to 24 Years | 17 (15.4%) | 8 (8.8%) |
| 25 to 34 Years | 3 (2.6%) | 16 (14.0%) |
| 35 to 44 Years | 26 (15.9%) | 2 (1.5%) |
| 45 to 54 Years | 6 (6.0%) | 0 (0.0%) |
| 55 to 64 Years | 10 (11.5%) | 8 (14.5%) |
| 65 to 74 Years | 0 (0.0%) | 3 (4.3%) |
| 75 Years and over | 3 (6.8%) | 0 (0.0%) |
| Total | 91 (10.6%) | 64 (6.9%) |
Income Above Poverty by Sex and Age in Cameron
According to the poverty statistics in Cameron, males aged 12 to 14 years and females aged under 5 years are the age groups that are most secure financially, with 100.0% of males and 100.0% of females in these age groups living above the poverty line.
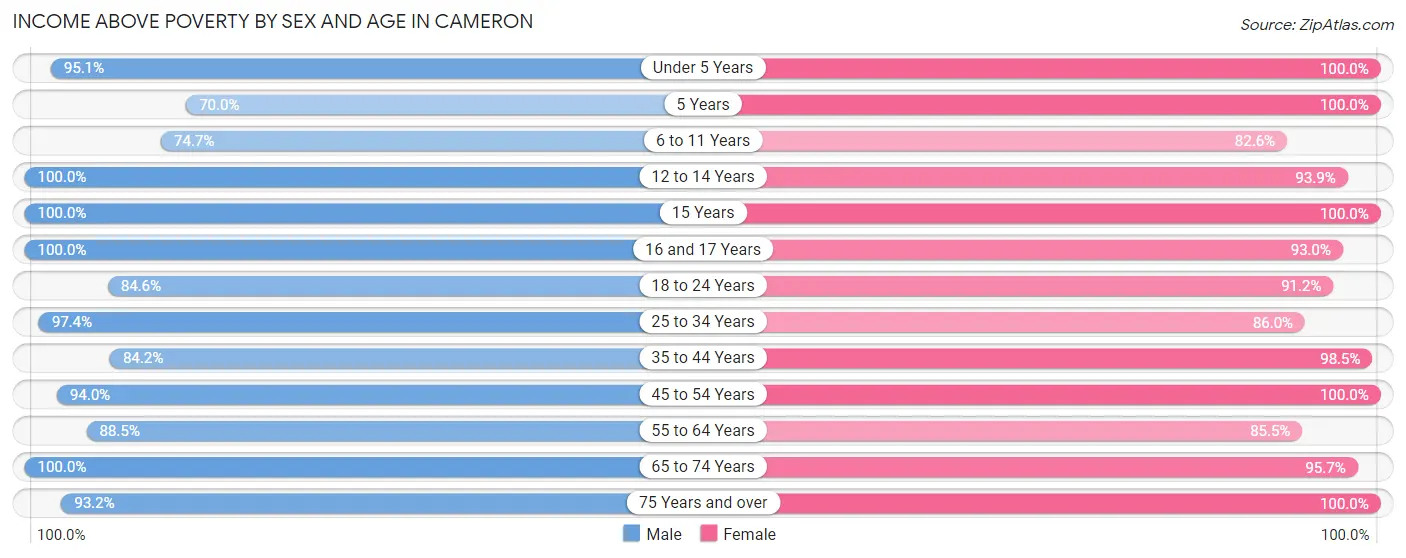
| Age Bracket | Male | Female |
| Under 5 Years | 78 (95.1%) | 47 (100.0%) |
| 5 Years | 7 (70.0%) | 15 (100.0%) |
| 6 to 11 Years | 56 (74.7%) | 95 (82.6%) |
| 12 to 14 Years | 13 (100.0%) | 46 (93.9%) |
| 15 Years | 5 (100.0%) | 24 (100.0%) |
| 16 and 17 Years | 10 (100.0%) | 53 (93.0%) |
| 18 to 24 Years | 93 (84.6%) | 83 (91.2%) |
| 25 to 34 Years | 110 (97.4%) | 98 (86.0%) |
| 35 to 44 Years | 138 (84.2%) | 129 (98.5%) |
| 45 to 54 Years | 94 (94.0%) | 97 (100.0%) |
| 55 to 64 Years | 77 (88.5%) | 47 (85.5%) |
| 65 to 74 Years | 47 (100.0%) | 67 (95.7%) |
| 75 Years and over | 41 (93.2%) | 62 (100.0%) |
| Total | 769 (89.4%) | 863 (93.1%) |
Income Below Poverty Among Married-Couple Families in Cameron
The poverty statistics for married-couple families in Cameron show that 5.4% or 18 of the total 335 families live below the poverty line. Families with 3 or 4 children have the highest poverty rate of 9.1%, comprising of 6 families. On the other hand, families with no children have the lowest poverty rate of 2.5%, which includes 3 families.
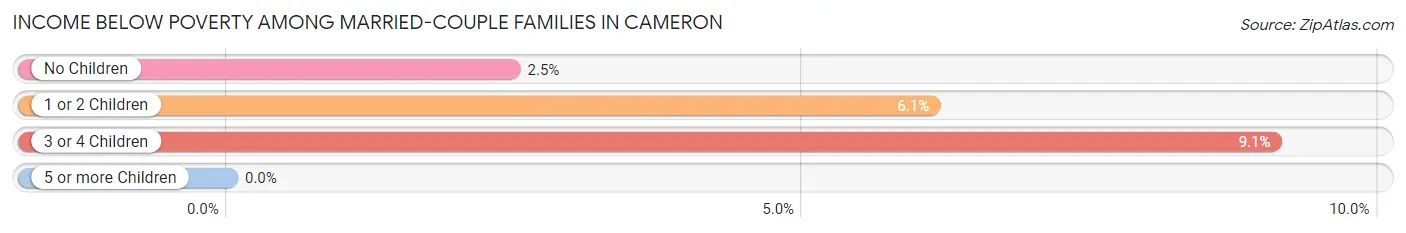
| Children | Above Poverty | Below Poverty |
| No Children | 119 (97.5%) | 3 (2.5%) |
| 1 or 2 Children | 138 (93.9%) | 9 (6.1%) |
| 3 or 4 Children | 60 (90.9%) | 6 (9.1%) |
| 5 or more Children | 0 (0.0%) | 0 (0.0%) |
| Total | 317 (94.6%) | 18 (5.4%) |
Income Below Poverty Among Single-Parent Households in Cameron
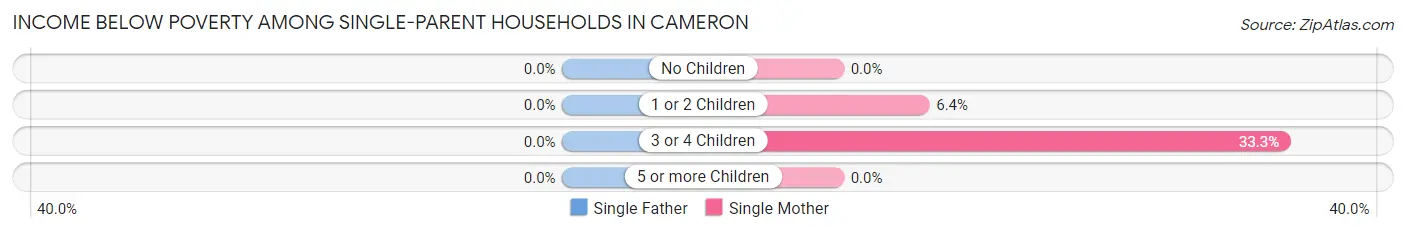
| Children | Single Father | Single Mother |
| No Children | 0 (0.0%) | 0 (0.0%) |
| 1 or 2 Children | 0 (0.0%) | 3 (6.4%) |
| 3 or 4 Children | 0 (0.0%) | 4 (33.3%) |
| 5 or more Children | 0 (0.0%) | 0 (0.0%) |
| Total | 0 (0.0%) | 7 (9.0%) |
Income Below Poverty Among Married-Couple vs Single-Parent Households in Cameron
The poverty data for Cameron shows that 18 of the married-couple family households (5.4%) and 7 of the single-parent households (8.6%) are living below the poverty level. Within the married-couple family households, those with 3 or 4 children have the highest poverty rate, with 6 households (9.1%) falling below the poverty line. Among the single-parent households, those with 3 or 4 children have the highest poverty rate, with 4 household (33.3%) living below poverty.
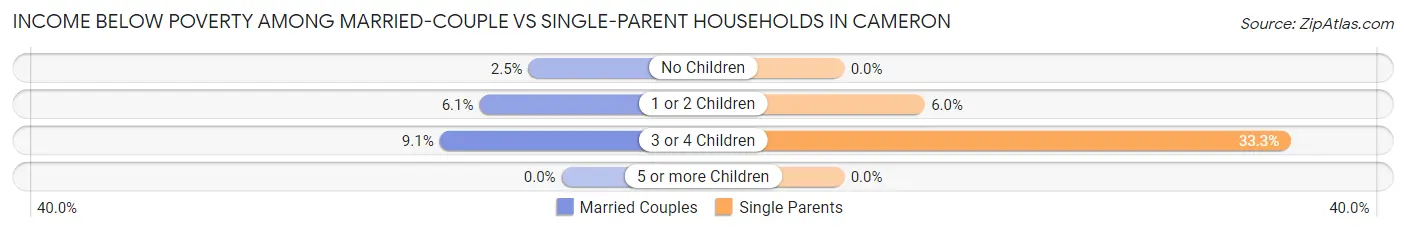
| Children | Married-Couple Families | Single-Parent Households |
| No Children | 3 (2.5%) | 0 (0.0%) |
| 1 or 2 Children | 9 (6.1%) | 3 (6.0%) |
| 3 or 4 Children | 6 (9.1%) | 4 (33.3%) |
| 5 or more Children | 0 (0.0%) | 0 (0.0%) |
| Total | 18 (5.4%) | 7 (8.6%) |
Race in Cameron
The most populous races in Cameron are White / Caucasian (1,629 | 90.5%), Two or more Races (56 | 3.1%), and Black / African American (45 | 2.5%).
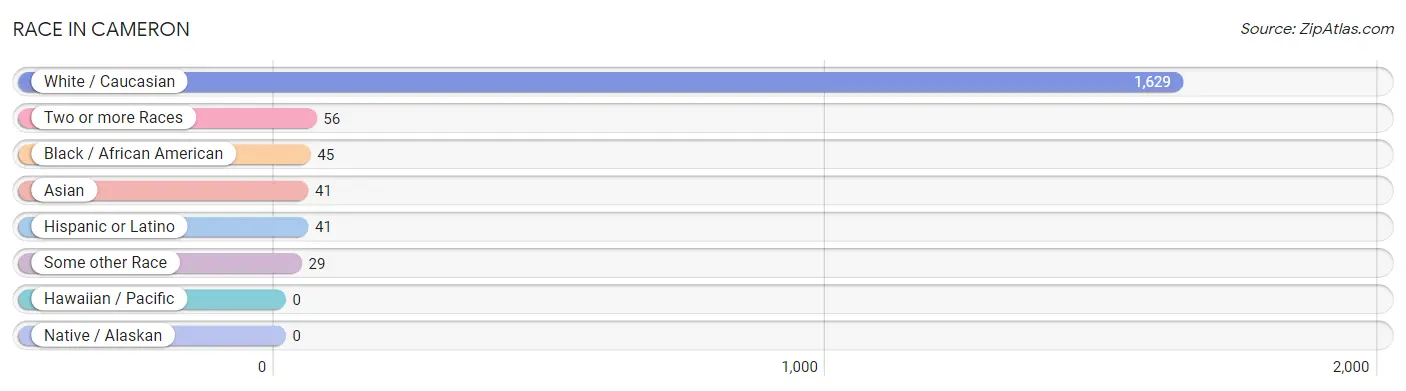
| Race | # Population | % Population |
| Asian | 41 | 2.3% |
| Black / African American | 45 | 2.5% |
| Hawaiian / Pacific | 0 | 0.0% |
| Hispanic or Latino | 41 | 2.3% |
| Native / Alaskan | 0 | 0.0% |
| White / Caucasian | 1,629 | 90.5% |
| Two or more Races | 56 | 3.1% |
| Some other Race | 29 | 1.6% |
| Total | 1,800 | 100.0% |
Ancestry in Cameron
The most populous ancestries reported in Cameron are German (596 | 33.1%), Norwegian (280 | 15.6%), Irish (121 | 6.7%), English (118 | 6.6%), and Polish (97 | 5.4%), together accounting for 67.3% of all Cameron residents.
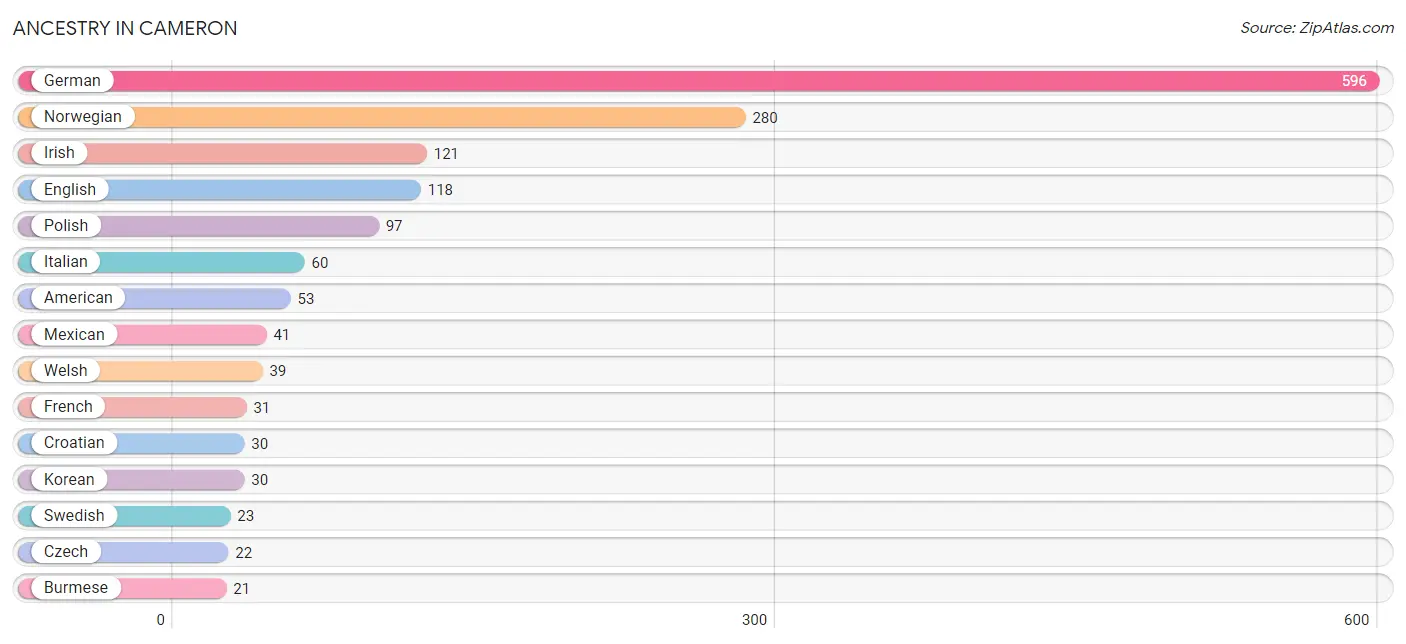
| Ancestry | # Population | % Population |
| African | 9 | 0.5% |
| American | 53 | 2.9% |
| Belgian | 6 | 0.3% |
| Bhutanese | 1 | 0.1% |
| Burmese | 21 | 1.2% |
| Chippewa | 3 | 0.2% |
| Croatian | 30 | 1.7% |
| Czech | 22 | 1.2% |
| Danish | 2 | 0.1% |
| Dutch | 6 | 0.3% |
| English | 118 | 6.6% |
| European | 1 | 0.1% |
| French | 31 | 1.7% |
| French Canadian | 21 | 1.2% |
| German | 596 | 33.1% |
| Greek | 3 | 0.2% |
| Irish | 121 | 6.7% |
| Italian | 60 | 3.3% |
| Japanese | 10 | 0.6% |
| Korean | 30 | 1.7% |
| Luxembourger | 6 | 0.3% |
| Mexican | 41 | 2.3% |
| Norwegian | 280 | 15.6% |
| Pakistani | 12 | 0.7% |
| Polish | 97 | 5.4% |
| Russian | 6 | 0.3% |
| Scandinavian | 7 | 0.4% |
| Scotch-Irish | 15 | 0.8% |
| Scottish | 19 | 1.1% |
| Subsaharan African | 9 | 0.5% |
| Swedish | 23 | 1.3% |
| Swiss | 4 | 0.2% |
| Welsh | 39 | 2.2% | View All 33 Rows |
Immigrants in Cameron
The most numerous immigrant groups reported in Cameron came from Asia (37 | 2.1%), Eastern Asia (19 | 1.1%), Korea (19 | 1.1%), South Eastern Asia (18 | 1.0%), and Thailand (11 | 0.6%), together accounting for 5.8% of all Cameron residents.
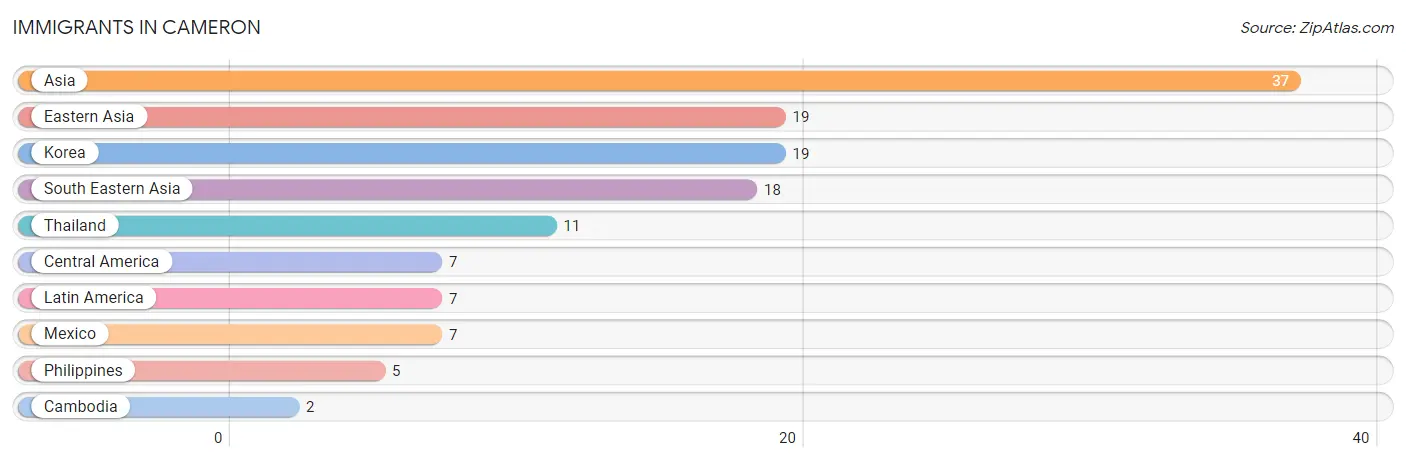
| Immigration Origin | # Population | % Population |
| Asia | 37 | 2.1% |
| Cambodia | 2 | 0.1% |
| Central America | 7 | 0.4% |
| Eastern Asia | 19 | 1.1% |
| Korea | 19 | 1.1% |
| Latin America | 7 | 0.4% |
| Mexico | 7 | 0.4% |
| Philippines | 5 | 0.3% |
| South Eastern Asia | 18 | 1.0% |
| Thailand | 11 | 0.6% | View All 10 Rows |
Sex and Age in Cameron
Sex and Age in Cameron
The most populous age groups in Cameron are 35 to 39 Years (105 | 12.2%) for men and 15 to 19 Years (124 | 13.2%) for women.
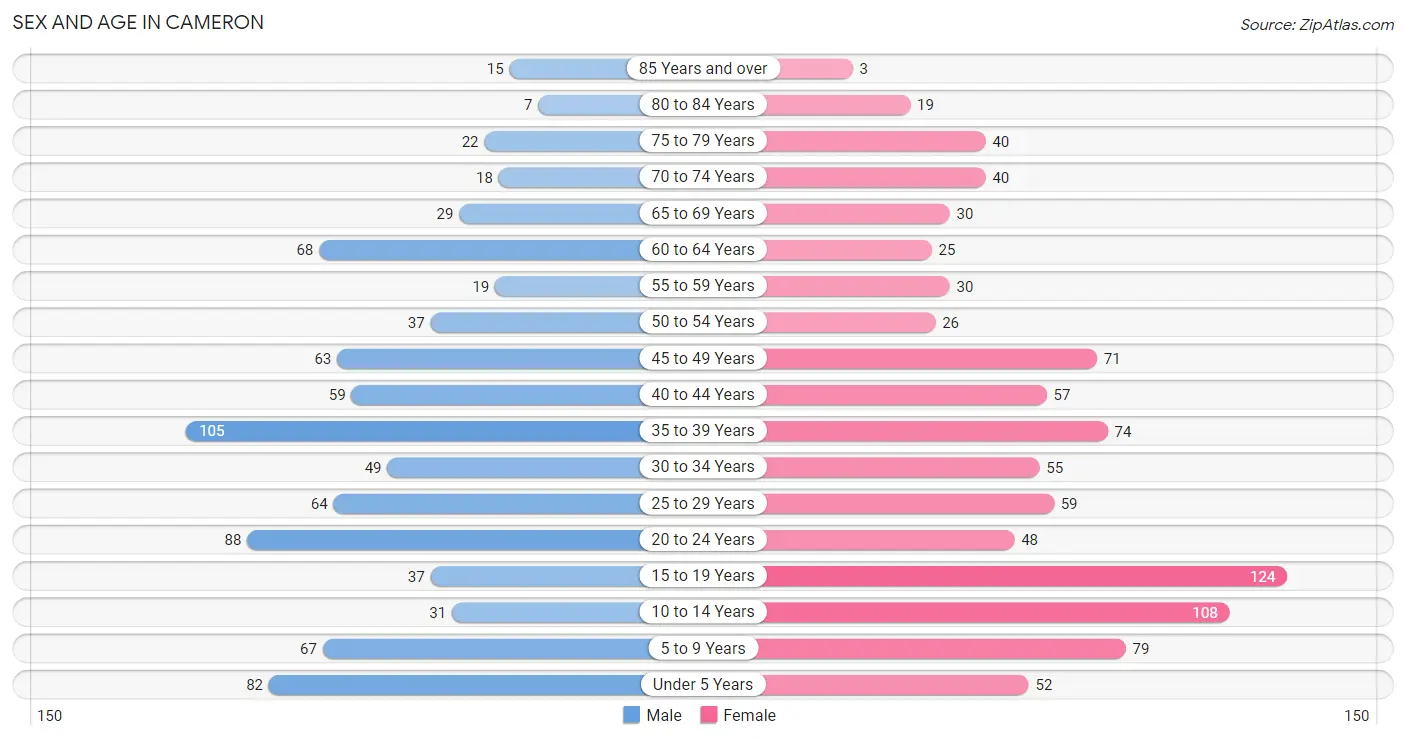
| Age Bracket | Male | Female |
| Under 5 Years | 82 (9.5%) | 52 (5.5%) |
| 5 to 9 Years | 67 (7.8%) | 79 (8.4%) |
| 10 to 14 Years | 31 (3.6%) | 108 (11.5%) |
| 15 to 19 Years | 37 (4.3%) | 124 (13.2%) |
| 20 to 24 Years | 88 (10.2%) | 48 (5.1%) |
| 25 to 29 Years | 64 (7.4%) | 59 (6.3%) |
| 30 to 34 Years | 49 (5.7%) | 55 (5.9%) |
| 35 to 39 Years | 105 (12.2%) | 74 (7.9%) |
| 40 to 44 Years | 59 (6.9%) | 57 (6.1%) |
| 45 to 49 Years | 63 (7.3%) | 71 (7.5%) |
| 50 to 54 Years | 37 (4.3%) | 26 (2.8%) |
| 55 to 59 Years | 19 (2.2%) | 30 (3.2%) |
| 60 to 64 Years | 68 (7.9%) | 25 (2.7%) |
| 65 to 69 Years | 29 (3.4%) | 30 (3.2%) |
| 70 to 74 Years | 18 (2.1%) | 40 (4.3%) |
| 75 to 79 Years | 22 (2.6%) | 40 (4.3%) |
| 80 to 84 Years | 7 (0.8%) | 19 (2.0%) |
| 85 Years and over | 15 (1.7%) | 3 (0.3%) |
| Total | 860 (100.0%) | 940 (100.0%) |
Families and Households in Cameron
Median Family Size in Cameron
The median family size in Cameron is 3.43 persons per family, with married-couple families (335 | 80.5%) accounting for the largest median family size of 3.5 persons per family. On the other hand, single male/father families (3 | 0.7%) represent the smallest median family size with 1.67 persons per family.
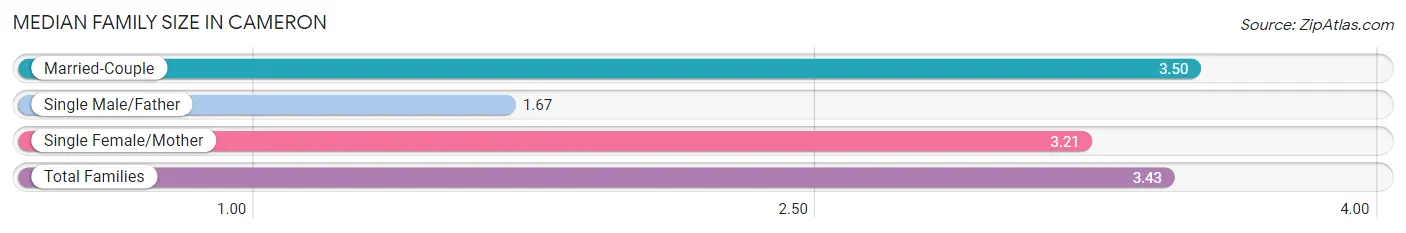
| Family Type | # Families | Family Size |
| Married-Couple | 335 (80.5%) | 3.50 |
| Single Male/Father | 3 (0.7%) | 1.67 |
| Single Female/Mother | 78 (18.8%) | 3.21 |
| Total Families | 416 (100.0%) | 3.43 |
Median Household Size in Cameron
The median household size in Cameron is 2.57 persons per household, with single female/mother households (78 | 11.1%) accounting for the largest median household size of 3.73 persons per household. non-family households (284 | 40.6%) represent the smallest median household size with 1.14 persons per household.
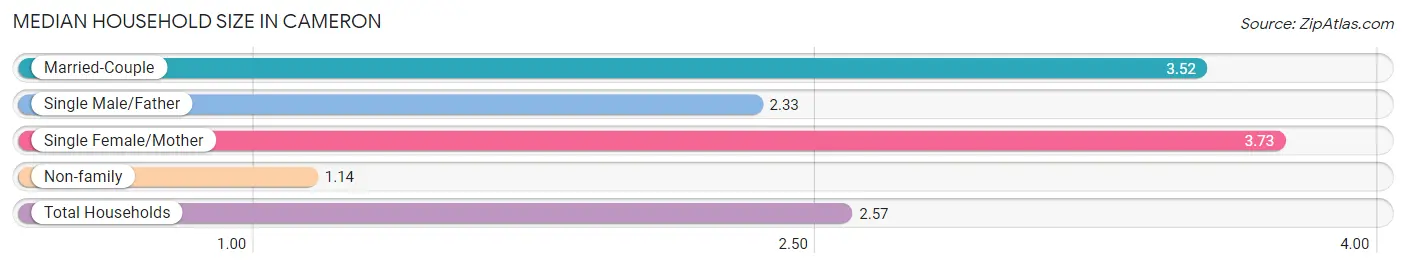
| Household Type | # Households | Household Size |
| Married-Couple | 335 (47.9%) | 3.52 |
| Single Male/Father | 3 (0.4%) | 2.33 |
| Single Female/Mother | 78 (11.1%) | 3.73 |
| Non-family | 284 (40.6%) | 1.14 |
| Total Households | 700 (100.0%) | 2.57 |
Household Size by Marriage Status in Cameron
Out of a total of 700 households in Cameron, 416 (59.4%) are family households, while 284 (40.6%) are nonfamily households. The most numerous type of family households are 2-person households, comprising 132, and the most common type of nonfamily households are 1-person households, comprising 248.
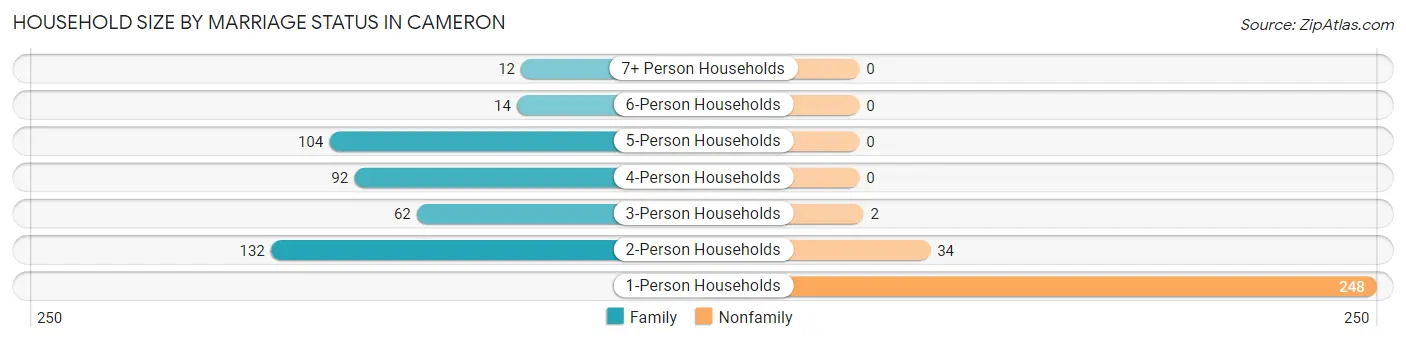
| Household Size | Family Households | Nonfamily Households |
| 1-Person Households | - | 248 (35.4%) |
| 2-Person Households | 132 (18.9%) | 34 (4.9%) |
| 3-Person Households | 62 (8.9%) | 2 (0.3%) |
| 4-Person Households | 92 (13.1%) | 0 (0.0%) |
| 5-Person Households | 104 (14.9%) | 0 (0.0%) |
| 6-Person Households | 14 (2.0%) | 0 (0.0%) |
| 7+ Person Households | 12 (1.7%) | 0 (0.0%) |
| Total | 416 (59.4%) | 284 (40.6%) |
Female Fertility in Cameron
Fertility by Age in Cameron
Average fertility rate in Cameron is 49.0 births per 1,000 women. Women in the age bracket of 20 to 34 years have the highest fertility rate with 68.0 births per 1,000 women. Women in the age bracket of 35 to 50 years acount for 54.2% of all women with births.
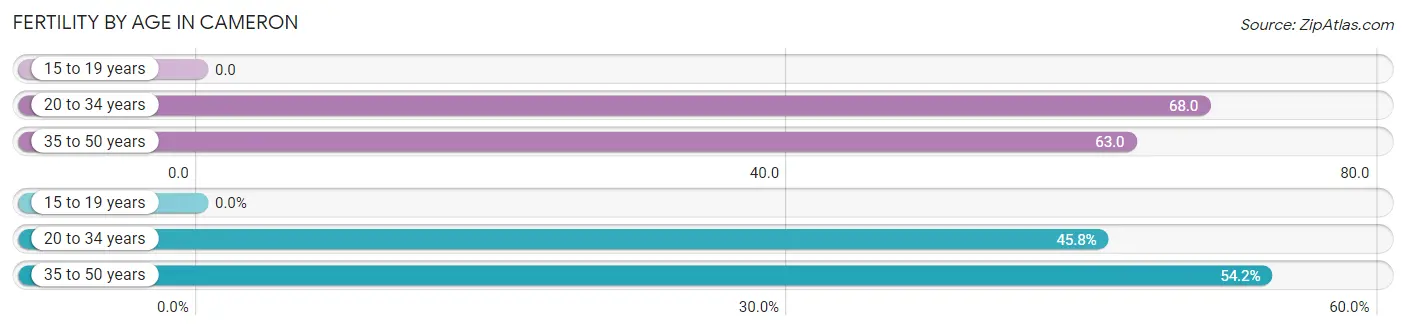
| Age Bracket | Women with Births | Births / 1,000 Women |
| 15 to 19 years | 0 (0.0%) | 0.0 |
| 20 to 34 years | 11 (45.8%) | 68.0 |
| 35 to 50 years | 13 (54.2%) | 63.0 |
| Total | 24 (100.0%) | 49.0 |
Fertility by Age by Marriage Status in Cameron
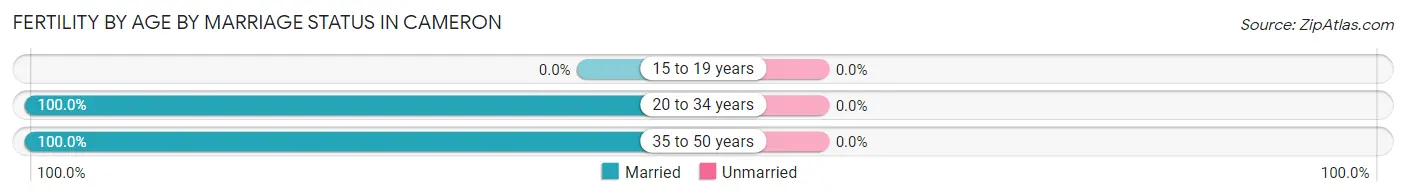
| Age Bracket | Married | Unmarried |
| 15 to 19 years | 0 (0.0%) | 0 (0.0%) |
| 20 to 34 years | 11 (100.0%) | 0 (0.0%) |
| 35 to 50 years | 13 (100.0%) | 0 (0.0%) |
| Total | 24 (100.0%) | 0 (0.0%) |
Fertility by Education in Cameron
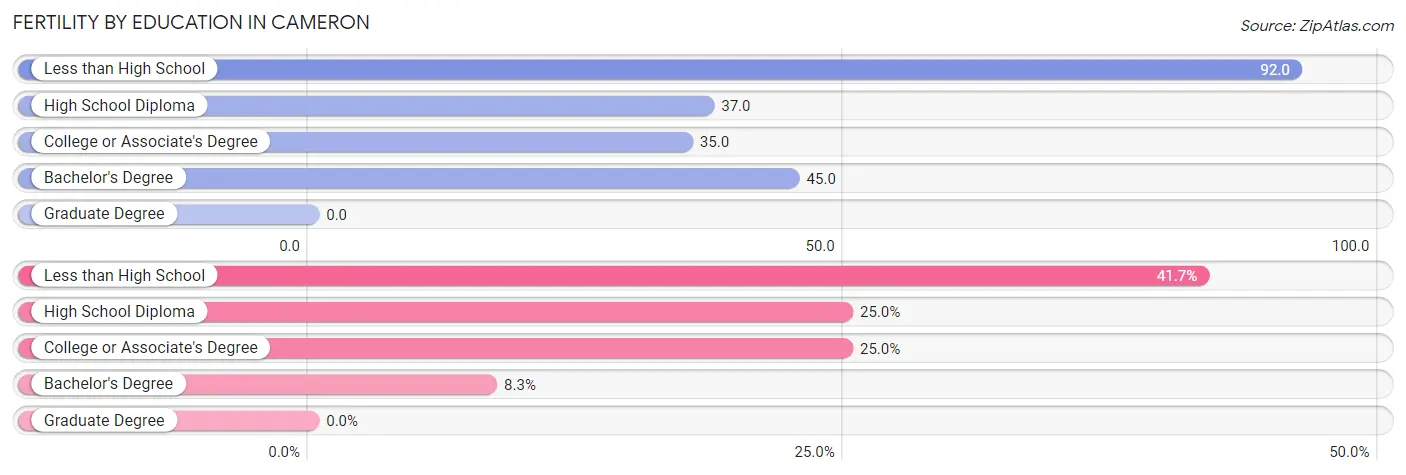
| Educational Attainment | Women with Births | Births / 1,000 Women |
| Less than High School | 10 (41.7%) | 92.0 |
| High School Diploma | 6 (25.0%) | 37.0 |
| College or Associate's Degree | 6 (25.0%) | 35.0 |
| Bachelor's Degree | 2 (8.3%) | 45.0 |
| Graduate Degree | 0 (0.0%) | 0.0 |
| Total | 24 (100.0%) | 49.0 |
Fertility by Education by Marriage Status in Cameron
| Educational Attainment | Married | Unmarried |
| Less than High School | 10 (100.0%) | 0 (0.0%) |
| High School Diploma | 6 (100.0%) | 0 (0.0%) |
| College or Associate's Degree | 6 (100.0%) | 0 (0.0%) |
| Bachelor's Degree | 2 (100.0%) | 0 (0.0%) |
| Graduate Degree | 0 (0.0%) | 0 (0.0%) |
| Total | 24 (100.0%) | 0 (0.0%) |
Employment Characteristics in Cameron
Employment by Class of Employer in Cameron
Among the 937 employed individuals in Cameron, private company employees (759 | 81.0%), not-for-profit organizations (61 | 6.5%), and self-employed (not incorporated) (43 | 4.6%) make up the most common classes of employment.
| Employer Class | # Employees | % Employees |
| Private Company Employees | 759 | 81.0% |
| Self-Employed (Incorporated) | 18 | 1.9% |
| Self-Employed (Not Incorporated) | 43 | 4.6% |
| Not-for-profit Organizations | 61 | 6.5% |
| Local Government Employees | 39 | 4.2% |
| State Government Employees | 12 | 1.3% |
| Federal Government Employees | 3 | 0.3% |
| Unpaid Family Workers | 2 | 0.2% |
| Total | 937 | 100.0% |
Employment Status by Age in Cameron
According to the labor force statistics for Cameron, out of the total population over 16 years of age (1,352), 71.1% or 961 individuals are in the labor force, with 2.1% or 20 of them unemployed. The age group with the highest labor force participation rate is 25 to 29 years, with 97.6% or 120 individuals in the labor force. Within the labor force, the 16 to 19 years age range has the highest percentage of unemployed individuals, with 16.3% or 14 of them being unemployed.
| Age Bracket | In Labor Force | Unemployed |
| 16 to 19 Years | 86 (65.2%) | 14 (16.3%) |
| 20 to 24 Years | 111 (81.6%) | 5 (4.5%) |
| 25 to 29 Years | 120 (97.6%) | 0 (0.0%) |
| 30 to 34 Years | 83 (79.8%) | 0 (0.0%) |
| 35 to 44 Years | 248 (84.1%) | 1 (0.4%) |
| 45 to 54 Years | 181 (91.9%) | 0 (0.0%) |
| 55 to 59 Years | 25 (51.0%) | 0 (0.0%) |
| 60 to 64 Years | 70 (75.3%) | 0 (0.0%) |
| 65 to 74 Years | 21 (17.9%) | 0 (0.0%) |
| 75 Years and over | 16 (15.1%) | 0 (0.0%) |
| Total | 961 (71.1%) | 20 (2.1%) |
Employment Status by Educational Attainment in Cameron
According to labor force statistics for Cameron, 84.4% of individuals (727) out of the total population between 25 and 64 years of age (861) are in the labor force, with 0.1% or 1 of them being unemployed. The group with the highest labor force participation rate are those with the educational attainment of college / associate degree, with 88.5% or 323 individuals in the labor force. Within the labor force, individuals with high school diploma education have the highest percentage of unemployment, with 0.5% or 1 of them being unemployed.
| Educational Attainment | In Labor Force | Unemployed |
| Less than High School | 88 (77.2%) | 0 (0.0%) |
| High School Diploma | 221 (86.0%) | 1 (0.5%) |
| College / Associate Degree | 323 (88.5%) | 0 (0.0%) |
| Bachelor's Degree or higher | 95 (76.0%) | 0 (0.0%) |
| Total | 727 (84.4%) | 1 (0.1%) |
Employment Occupations by Sex in Cameron
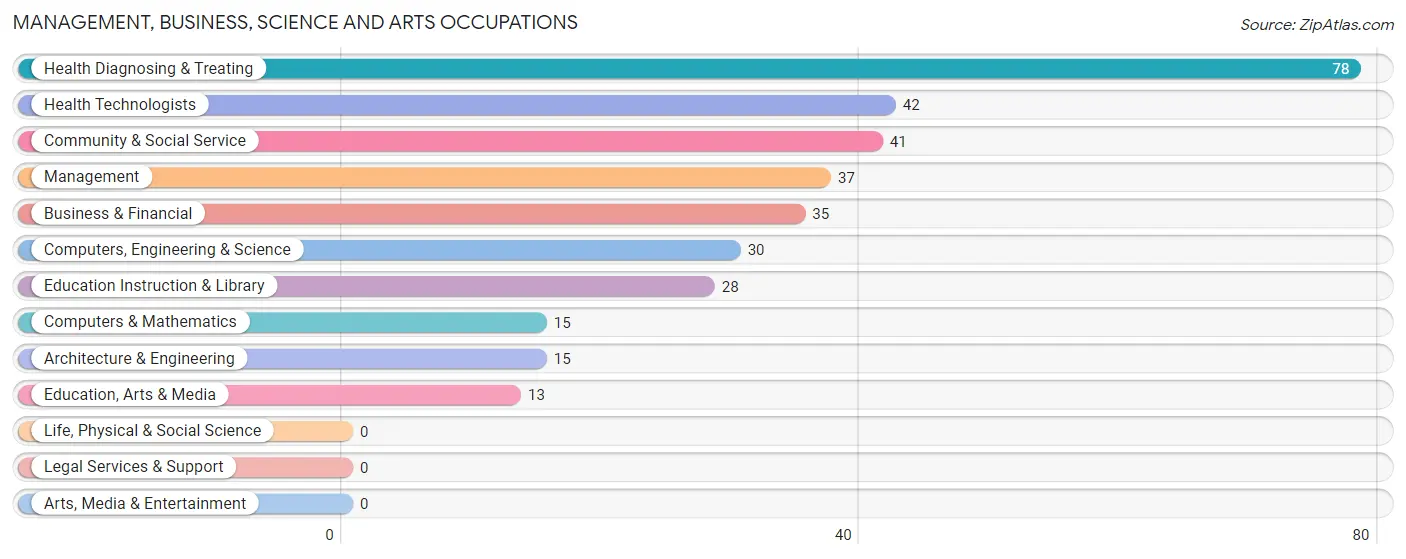
Management, Business, Science and Arts Occupations
The most common Management, Business, Science and Arts occupations in Cameron are Health Diagnosing & Treating (78 | 8.3%), Health Technologists (42 | 4.5%), Community & Social Service (41 | 4.4%), Management (37 | 3.9%), and Business & Financial (35 | 3.7%).
Management, Business, Science and Arts Occupations by Sex
Within the Management, Business, Science and Arts occupations in Cameron, the most male-oriented occupations are Computers & Mathematics (100.0%), Computers, Engineering & Science (90.0%), and Architecture & Engineering (80.0%), while the most female-oriented occupations are Health Technologists (85.7%), Health Diagnosing & Treating (80.8%), and Business & Financial (60.0%).
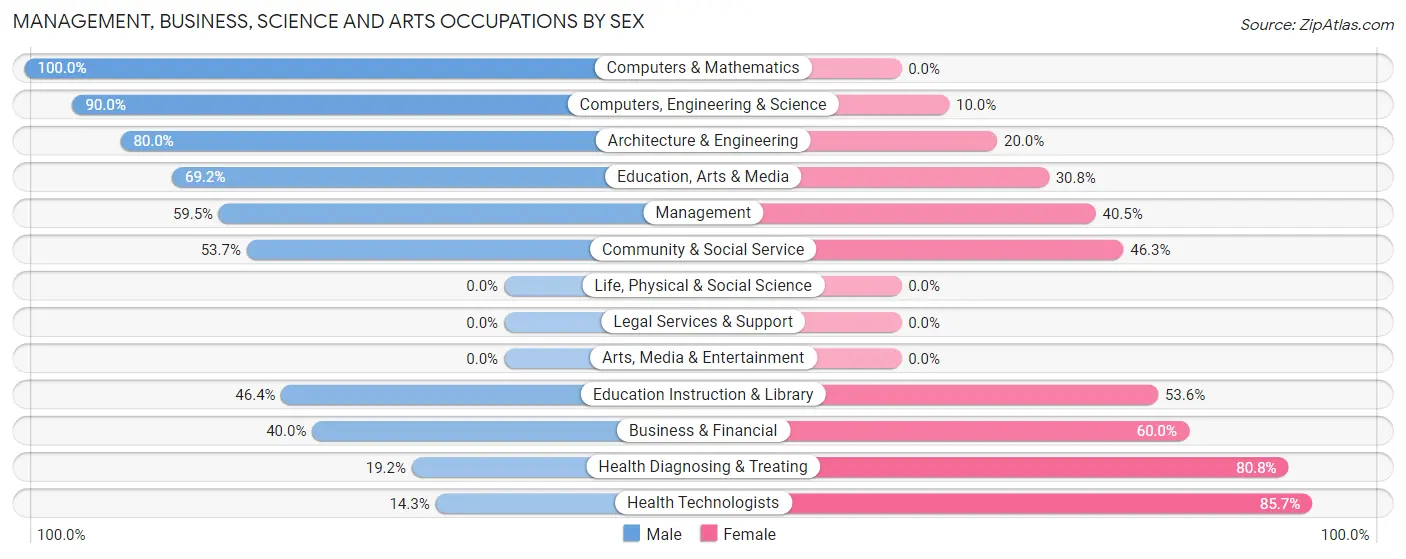
| Occupation | Male | Female |
| Management | 22 (59.5%) | 15 (40.5%) |
| Business & Financial | 14 (40.0%) | 21 (60.0%) |
| Computers, Engineering & Science | 27 (90.0%) | 3 (10.0%) |
| Computers & Mathematics | 15 (100.0%) | 0 (0.0%) |
| Architecture & Engineering | 12 (80.0%) | 3 (20.0%) |
| Life, Physical & Social Science | 0 (0.0%) | 0 (0.0%) |
| Community & Social Service | 22 (53.7%) | 19 (46.3%) |
| Education, Arts & Media | 9 (69.2%) | 4 (30.8%) |
| Legal Services & Support | 0 (0.0%) | 0 (0.0%) |
| Education Instruction & Library | 13 (46.4%) | 15 (53.6%) |
| Arts, Media & Entertainment | 0 (0.0%) | 0 (0.0%) |
| Health Diagnosing & Treating | 15 (19.2%) | 63 (80.8%) |
| Health Technologists | 6 (14.3%) | 36 (85.7%) |
| Total (Category) | 100 (45.3%) | 121 (54.7%) |
| Total (Overall) | 519 (55.3%) | 419 (44.7%) |
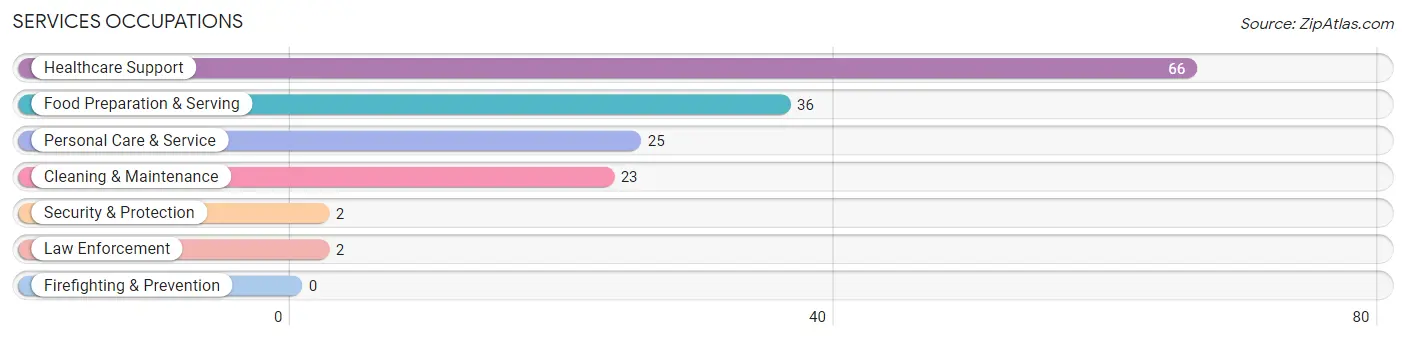
Services Occupations
The most common Services occupations in Cameron are Healthcare Support (66 | 7.0%), Food Preparation & Serving (36 | 3.8%), Personal Care & Service (25 | 2.7%), Cleaning & Maintenance (23 | 2.5%), and Security & Protection (2 | 0.2%).
Services Occupations by Sex
Within the Services occupations in Cameron, the most male-oriented occupations are Cleaning & Maintenance (100.0%), Personal Care & Service (16.0%), and Healthcare Support (15.1%), while the most female-oriented occupations are Security & Protection (100.0%), Law Enforcement (100.0%), and Food Preparation & Serving (100.0%).
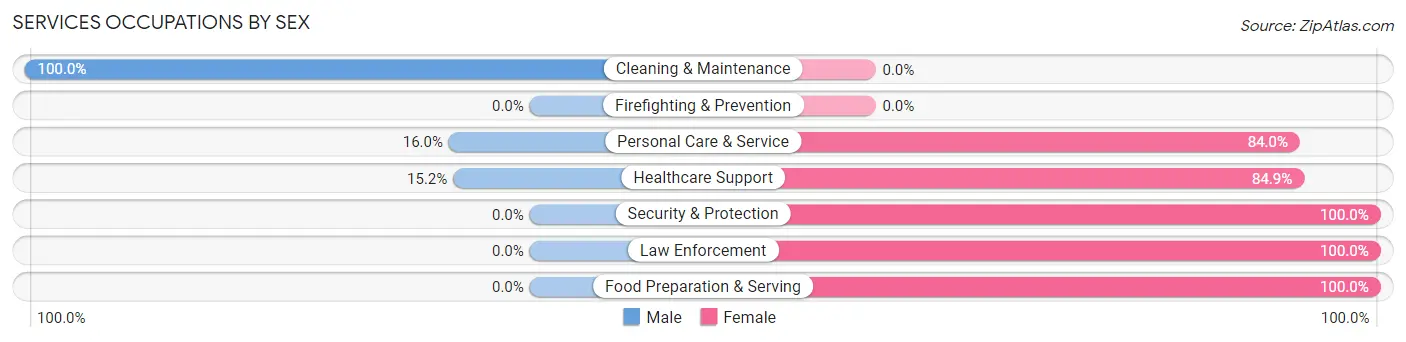
| Occupation | Male | Female |
| Healthcare Support | 10 (15.1%) | 56 (84.9%) |
| Security & Protection | 0 (0.0%) | 2 (100.0%) |
| Firefighting & Prevention | 0 (0.0%) | 0 (0.0%) |
| Law Enforcement | 0 (0.0%) | 2 (100.0%) |
| Food Preparation & Serving | 0 (0.0%) | 36 (100.0%) |
| Cleaning & Maintenance | 23 (100.0%) | 0 (0.0%) |
| Personal Care & Service | 4 (16.0%) | 21 (84.0%) |
| Total (Category) | 37 (24.3%) | 115 (75.7%) |
| Total (Overall) | 519 (55.3%) | 419 (44.7%) |
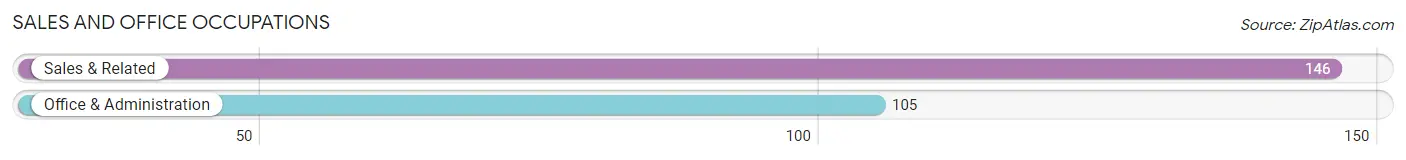
Sales and Office Occupations
The most common Sales and Office occupations in Cameron are Sales & Related (146 | 15.6%), and Office & Administration (105 | 11.2%).
Sales and Office Occupations by Sex
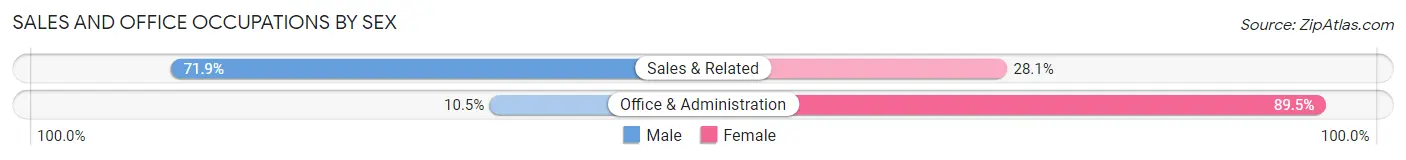
| Occupation | Male | Female |
| Sales & Related | 105 (71.9%) | 41 (28.1%) |
| Office & Administration | 11 (10.5%) | 94 (89.5%) |
| Total (Category) | 116 (46.2%) | 135 (53.8%) |
| Total (Overall) | 519 (55.3%) | 419 (44.7%) |
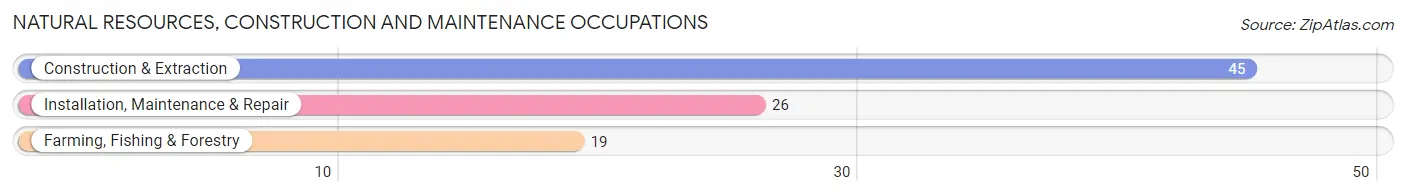
Natural Resources, Construction and Maintenance Occupations
The most common Natural Resources, Construction and Maintenance occupations in Cameron are Construction & Extraction (45 | 4.8%), Installation, Maintenance & Repair (26 | 2.8%), and Farming, Fishing & Forestry (19 | 2.0%).
Natural Resources, Construction and Maintenance Occupations by Sex
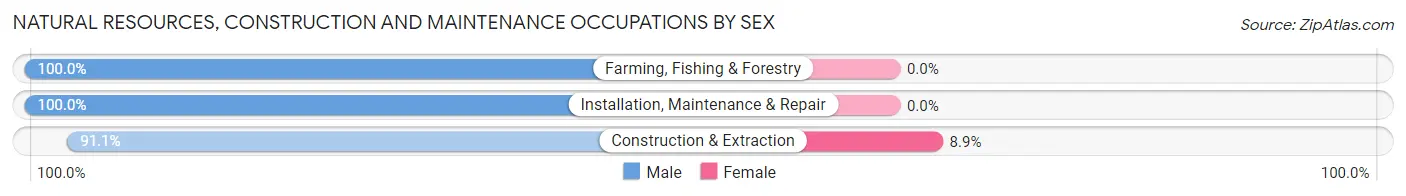
| Occupation | Male | Female |
| Farming, Fishing & Forestry | 19 (100.0%) | 0 (0.0%) |
| Construction & Extraction | 41 (91.1%) | 4 (8.9%) |
| Installation, Maintenance & Repair | 26 (100.0%) | 0 (0.0%) |
| Total (Category) | 86 (95.6%) | 4 (4.4%) |
| Total (Overall) | 519 (55.3%) | 419 (44.7%) |
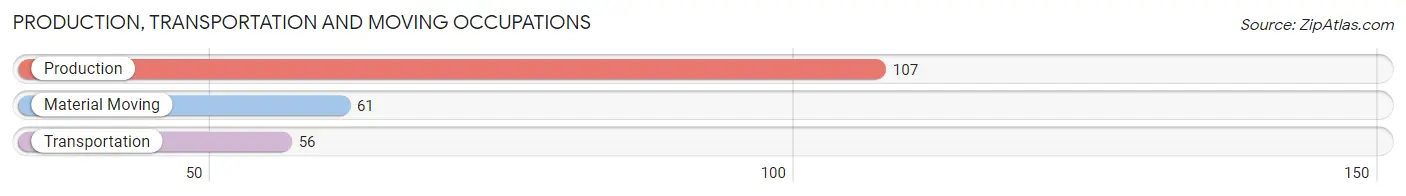
Production, Transportation and Moving Occupations
The most common Production, Transportation and Moving occupations in Cameron are Production (107 | 11.4%), Material Moving (61 | 6.5%), and Transportation (56 | 6.0%).
Production, Transportation and Moving Occupations by Sex
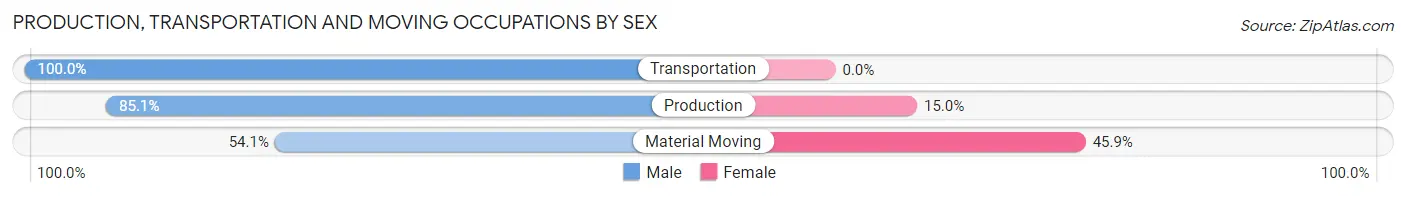
| Occupation | Male | Female |
| Production | 91 (85.1%) | 16 (14.9%) |
| Transportation | 56 (100.0%) | 0 (0.0%) |
| Material Moving | 33 (54.1%) | 28 (45.9%) |
| Total (Category) | 180 (80.4%) | 44 (19.6%) |
| Total (Overall) | 519 (55.3%) | 419 (44.7%) |
Employment Industries by Sex in Cameron
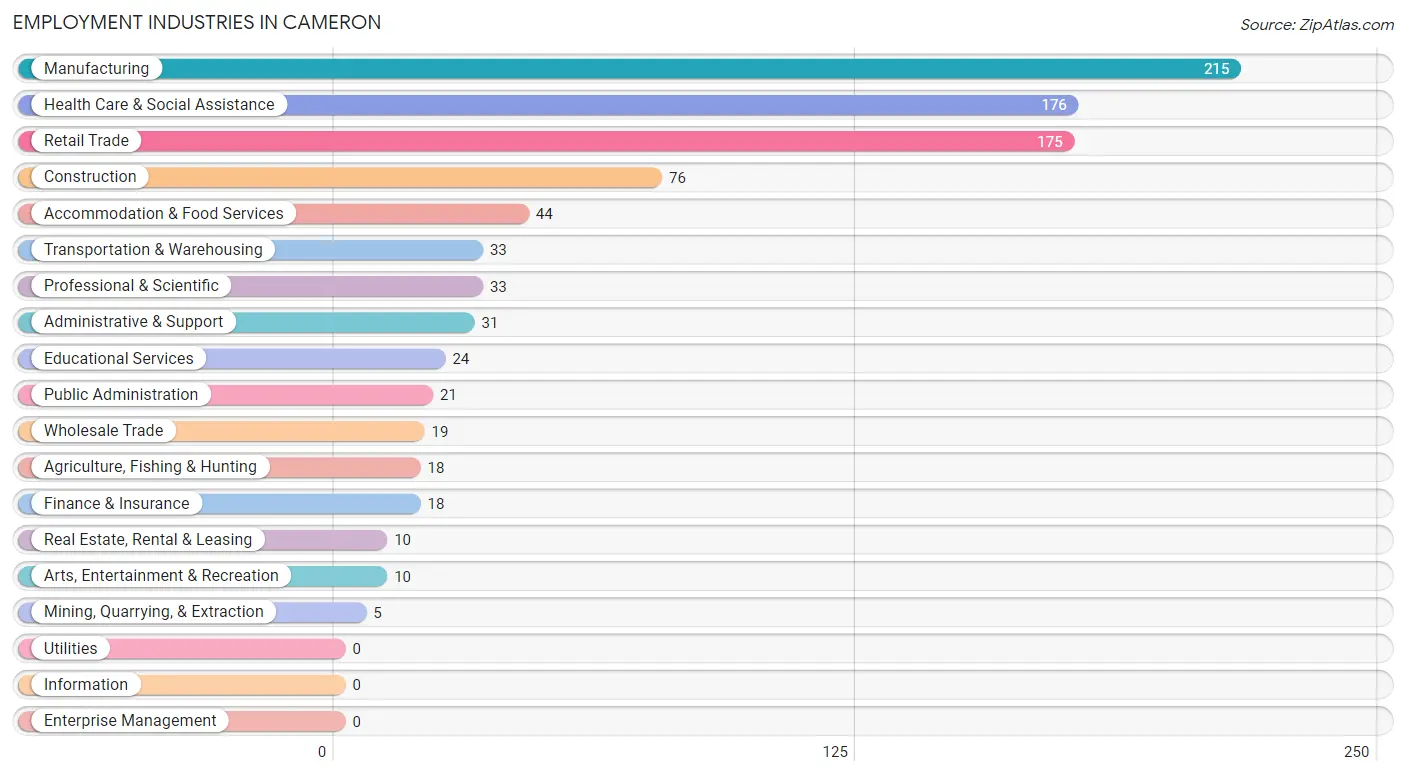
Employment Industries in Cameron
The major employment industries in Cameron include Manufacturing (215 | 22.9%), Health Care & Social Assistance (176 | 18.8%), Retail Trade (175 | 18.7%), Construction (76 | 8.1%), and Accommodation & Food Services (44 | 4.7%).
Employment Industries by Sex in Cameron
The Cameron industries that see more men than women are Agriculture, Fishing & Hunting (100.0%), Wholesale Trade (100.0%), and Transportation & Warehousing (87.9%), whereas the industries that tend to have a higher number of women are Mining, Quarrying, & Extraction (100.0%), Health Care & Social Assistance (88.1%), and Accommodation & Food Services (86.4%).
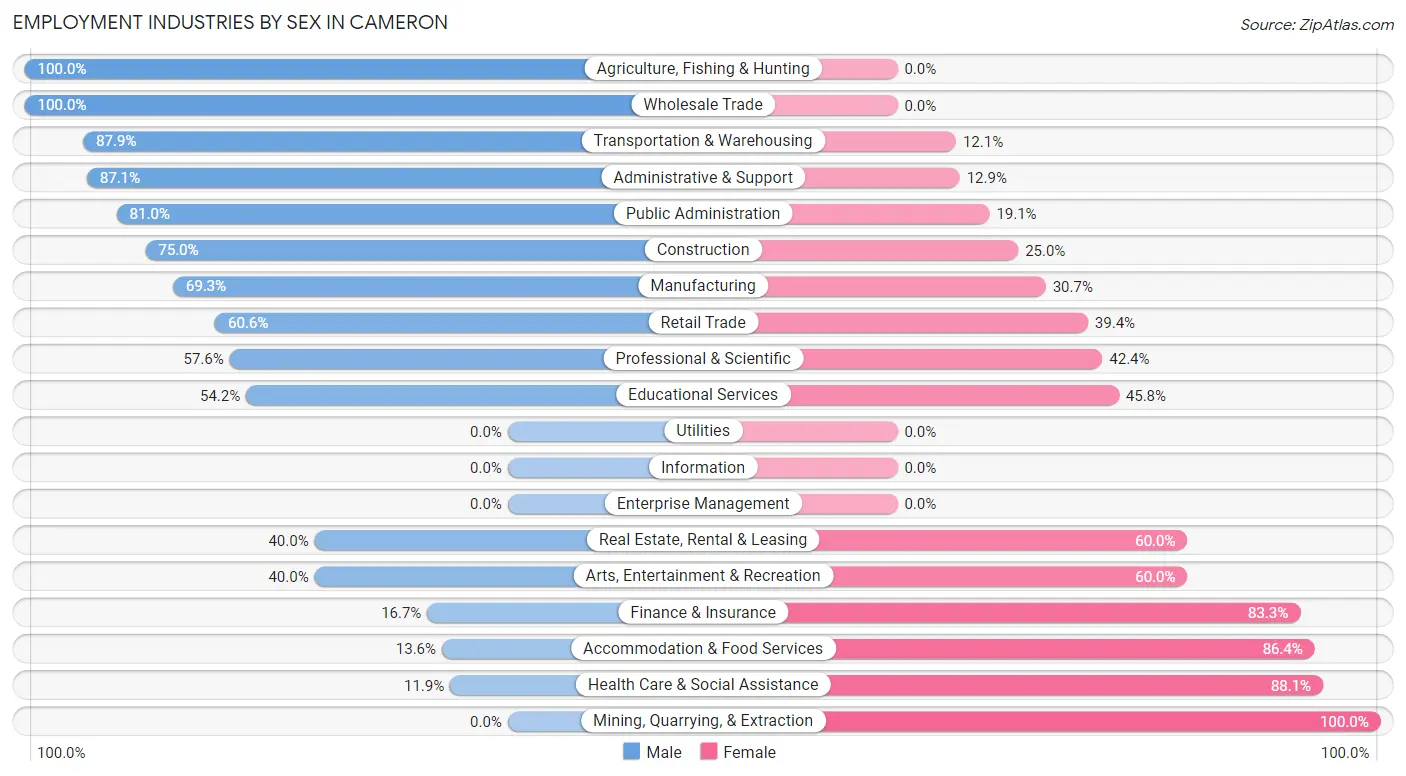
| Industry | Male | Female |
| Agriculture, Fishing & Hunting | 18 (100.0%) | 0 (0.0%) |
| Mining, Quarrying, & Extraction | 0 (0.0%) | 5 (100.0%) |
| Construction | 57 (75.0%) | 19 (25.0%) |
| Manufacturing | 149 (69.3%) | 66 (30.7%) |
| Wholesale Trade | 19 (100.0%) | 0 (0.0%) |
| Retail Trade | 106 (60.6%) | 69 (39.4%) |
| Transportation & Warehousing | 29 (87.9%) | 4 (12.1%) |
| Utilities | 0 (0.0%) | 0 (0.0%) |
| Information | 0 (0.0%) | 0 (0.0%) |
| Finance & Insurance | 3 (16.7%) | 15 (83.3%) |
| Real Estate, Rental & Leasing | 4 (40.0%) | 6 (60.0%) |
| Professional & Scientific | 19 (57.6%) | 14 (42.4%) |
| Enterprise Management | 0 (0.0%) | 0 (0.0%) |
| Administrative & Support | 27 (87.1%) | 4 (12.9%) |
| Educational Services | 13 (54.2%) | 11 (45.8%) |
| Health Care & Social Assistance | 21 (11.9%) | 155 (88.1%) |
| Arts, Entertainment & Recreation | 4 (40.0%) | 6 (60.0%) |
| Accommodation & Food Services | 6 (13.6%) | 38 (86.4%) |
| Public Administration | 17 (80.9%) | 4 (19.1%) |
| Total | 519 (55.3%) | 419 (44.7%) |
Education in Cameron
School Enrollment in Cameron
The most common levels of schooling among the 481 students in Cameron are elementary school (125 | 26.0%), middle school (111 | 23.1%), and high school (106 | 22.0%).
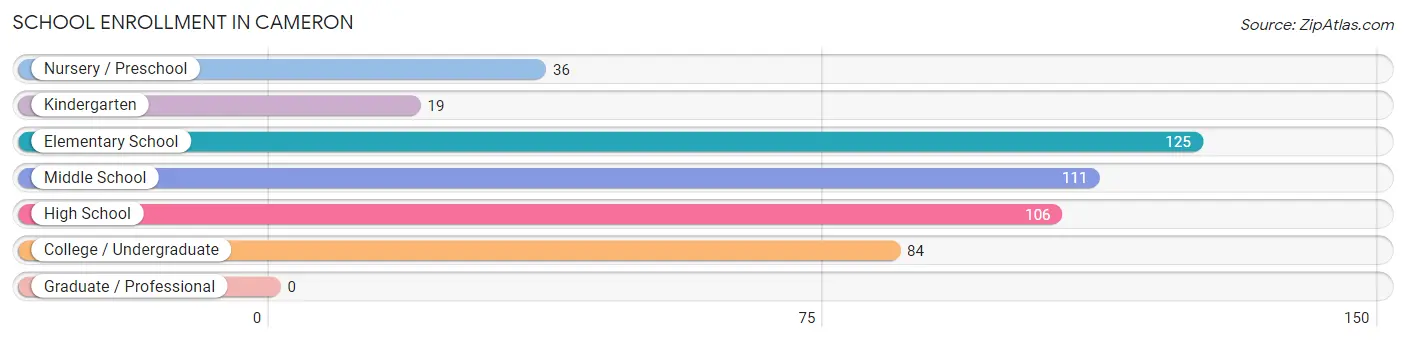
| School Level | # Students | % Students |
| Nursery / Preschool | 36 | 7.5% |
| Kindergarten | 19 | 4.0% |
| Elementary School | 125 | 26.0% |
| Middle School | 111 | 23.1% |
| High School | 106 | 22.0% |
| College / Undergraduate | 84 | 17.5% |
| Graduate / Professional | 0 | 0.0% |
| Total | 481 | 100.0% |
School Enrollment by Age by Funding Source in Cameron
Out of a total of 481 students who are enrolled in schools in Cameron, 10 (2.1%) attend a private institution, while the remaining 471 (97.9%) are enrolled in public schools. The age group of 3 to 4 year olds has the highest likelihood of being enrolled in private schools, with 5 (25.0% in the age bracket) enrolled. Conversely, the age group of 15 to 17 year olds has the lowest likelihood of being enrolled in a private school, with 93 (100.0% in the age bracket) attending a public institution.
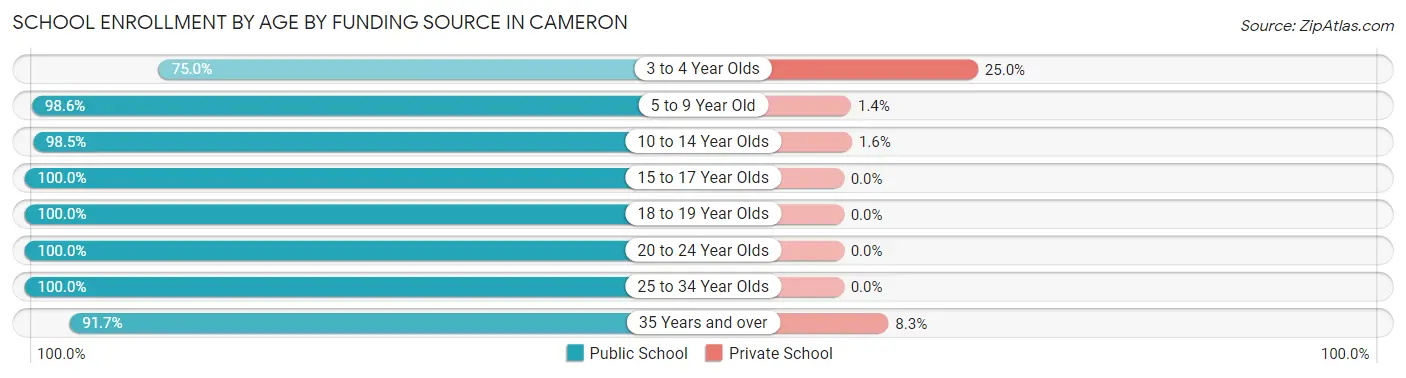
| Age Bracket | Public School | Private School |
| 3 to 4 Year Olds | 15 (75.0%) | 5 (25.0%) |
| 5 to 9 Year Old | 144 (98.6%) | 2 (1.4%) |
| 10 to 14 Year Olds | 127 (98.5%) | 2 (1.5%) |
| 15 to 17 Year Olds | 93 (100.0%) | 0 (0.0%) |
| 18 to 19 Year Olds | 38 (100.0%) | 0 (0.0%) |
| 20 to 24 Year Olds | 21 (100.0%) | 0 (0.0%) |
| 25 to 34 Year Olds | 22 (100.0%) | 0 (0.0%) |
| 35 Years and over | 11 (91.7%) | 1 (8.3%) |
| Total | 471 (97.9%) | 10 (2.1%) |
Educational Attainment by Field of Study in Cameron
Business (64 | 37.9%), bio, nature & agricultural (28 | 16.6%), education (28 | 16.6%), visual & performing arts (14 | 8.3%), and science & technology (11 | 6.5%) are the most common fields of study among 169 individuals in Cameron who have obtained a bachelor's degree or higher.
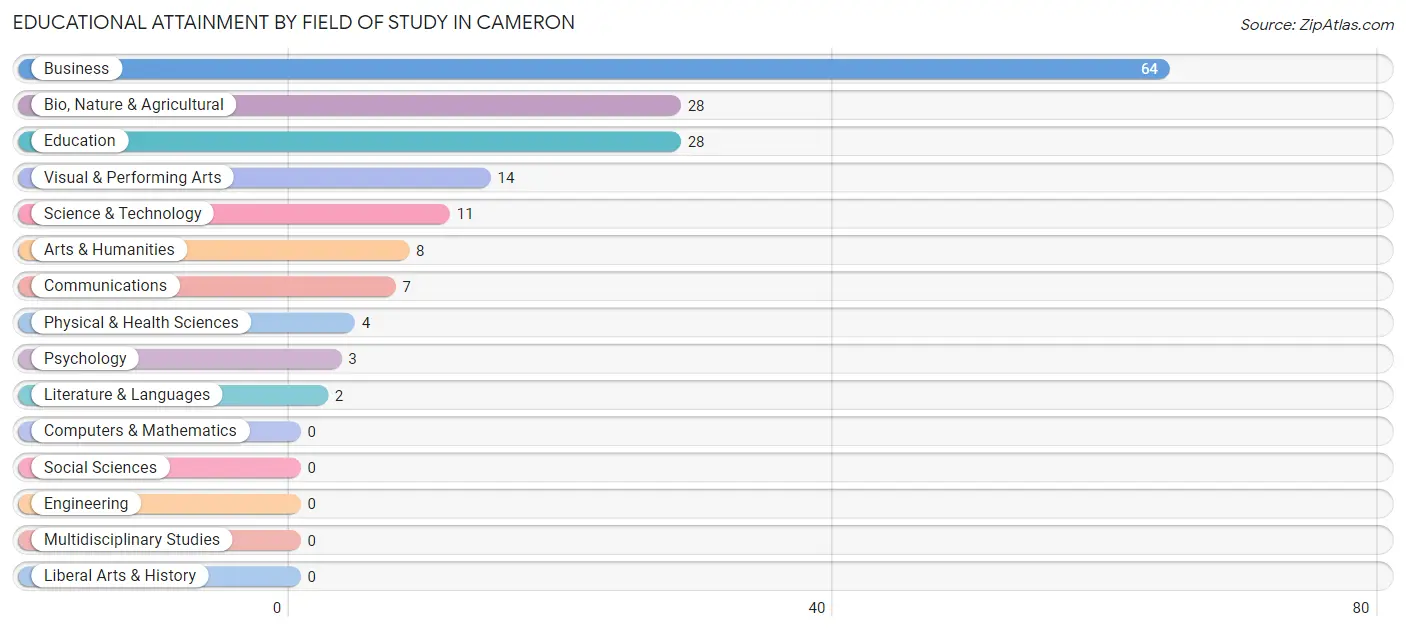
| Field of Study | # Graduates | % Graduates |
| Computers & Mathematics | 0 | 0.0% |
| Bio, Nature & Agricultural | 28 | 16.6% |
| Physical & Health Sciences | 4 | 2.4% |
| Psychology | 3 | 1.8% |
| Social Sciences | 0 | 0.0% |
| Engineering | 0 | 0.0% |
| Multidisciplinary Studies | 0 | 0.0% |
| Science & Technology | 11 | 6.5% |
| Business | 64 | 37.9% |
| Education | 28 | 16.6% |
| Literature & Languages | 2 | 1.2% |
| Liberal Arts & History | 0 | 0.0% |
| Visual & Performing Arts | 14 | 8.3% |
| Communications | 7 | 4.1% |
| Arts & Humanities | 8 | 4.7% |
| Total | 169 | 100.0% |
Transportation & Commute in Cameron
Vehicle Availability by Sex in Cameron
The most prevalent vehicle ownership categories in Cameron are males with 2 vehicles (264, accounting for 51.3%) and females with 2 vehicles (215, making up 62.6%).
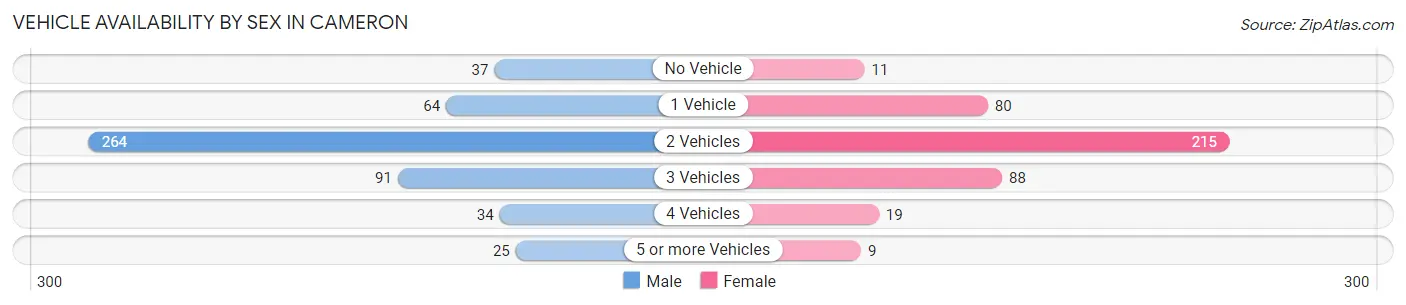
| Vehicles Available | Male | Female |
| No Vehicle | 37 (7.2%) | 11 (2.6%) |
| 1 Vehicle | 64 (12.4%) | 80 (19.0%) |
| 2 Vehicles | 264 (51.3%) | 215 (50.9%) |
| 3 Vehicles | 91 (17.7%) | 88 (20.8%) |
| 4 Vehicles | 34 (6.6%) | 19 (4.5%) |
| 5 or more Vehicles | 25 (4.9%) | 9 (2.1%) |
| Total | 515 (100.0%) | 422 (100.0%) |
Commute Time in Cameron
The most frequently occuring commute durations in Cameron are 10 to 14 minutes (265 commuters, 31.4%), 15 to 19 minutes (197 commuters, 23.4%), and 20 to 24 minutes (68 commuters, 8.1%).
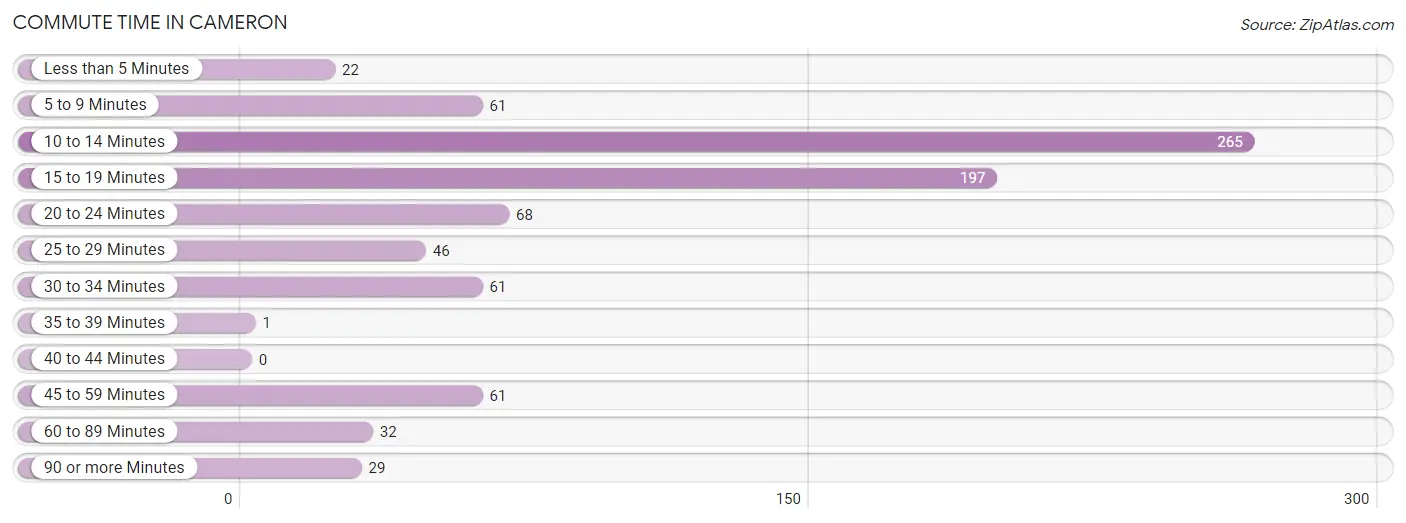
| Commute Time | # Commuters | % Commuters |
| Less than 5 Minutes | 22 | 2.6% |
| 5 to 9 Minutes | 61 | 7.2% |
| 10 to 14 Minutes | 265 | 31.4% |
| 15 to 19 Minutes | 197 | 23.4% |
| 20 to 24 Minutes | 68 | 8.1% |
| 25 to 29 Minutes | 46 | 5.5% |
| 30 to 34 Minutes | 61 | 7.2% |
| 35 to 39 Minutes | 1 | 0.1% |
| 40 to 44 Minutes | 0 | 0.0% |
| 45 to 59 Minutes | 61 | 7.2% |
| 60 to 89 Minutes | 32 | 3.8% |
| 90 or more Minutes | 29 | 3.4% |
Commute Time by Sex in Cameron
The most common commute times in Cameron are 10 to 14 minutes (126 commuters, 26.3%) for males and 10 to 14 minutes (139 commuters, 38.3%) for females.
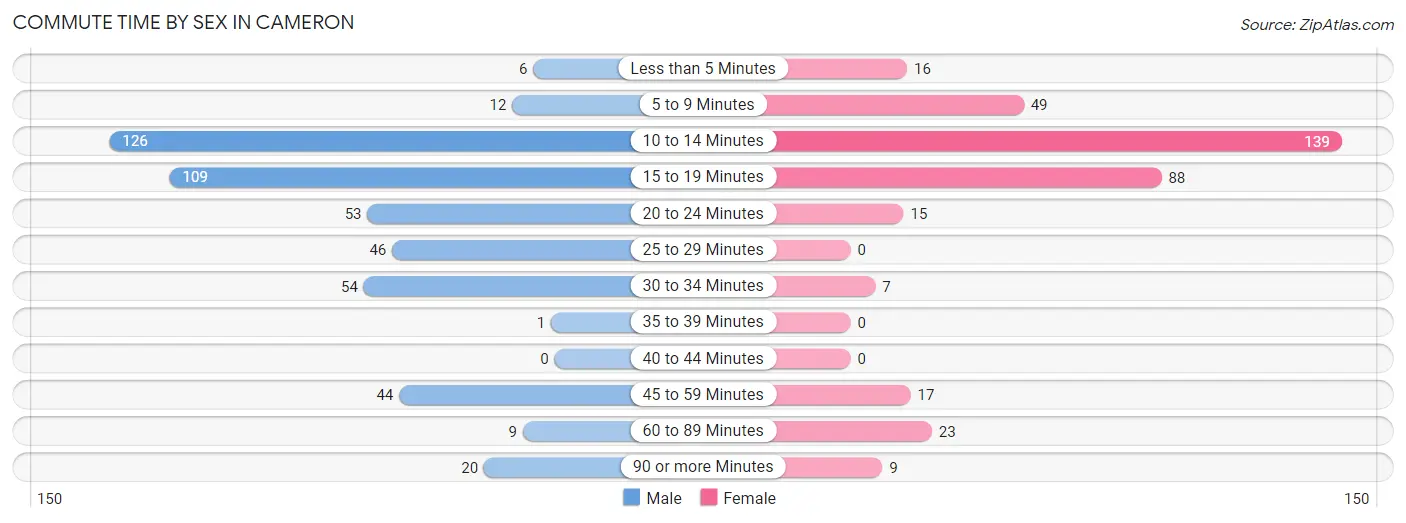
| Commute Time | Male | Female |
| Less than 5 Minutes | 6 (1.3%) | 16 (4.4%) |
| 5 to 9 Minutes | 12 (2.5%) | 49 (13.5%) |
| 10 to 14 Minutes | 126 (26.3%) | 139 (38.3%) |
| 15 to 19 Minutes | 109 (22.7%) | 88 (24.2%) |
| 20 to 24 Minutes | 53 (11.0%) | 15 (4.1%) |
| 25 to 29 Minutes | 46 (9.6%) | 0 (0.0%) |
| 30 to 34 Minutes | 54 (11.3%) | 7 (1.9%) |
| 35 to 39 Minutes | 1 (0.2%) | 0 (0.0%) |
| 40 to 44 Minutes | 0 (0.0%) | 0 (0.0%) |
| 45 to 59 Minutes | 44 (9.2%) | 17 (4.7%) |
| 60 to 89 Minutes | 9 (1.9%) | 23 (6.3%) |
| 90 or more Minutes | 20 (4.2%) | 9 (2.5%) |
Time of Departure to Work by Sex in Cameron
The most frequent times of departure to work in Cameron are 7:30 AM to 7:59 AM (66, 13.8%) for males and 7:30 AM to 7:59 AM (92, 25.3%) for females.
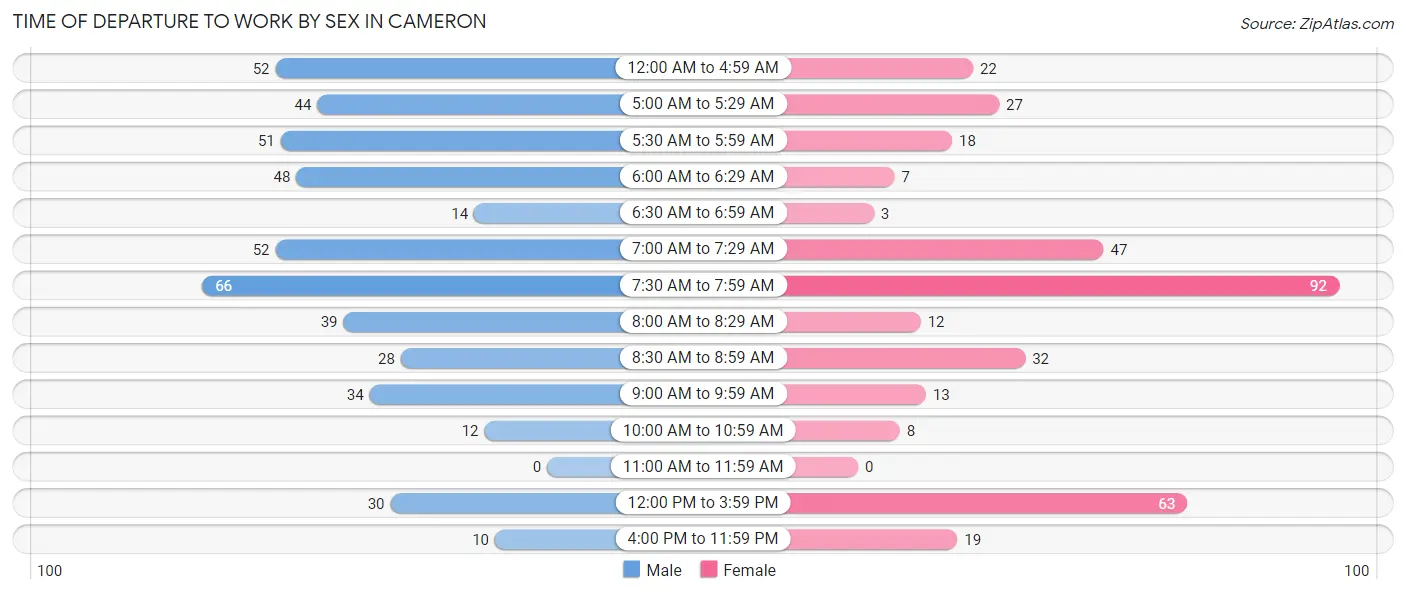
| Time of Departure | Male | Female |
| 12:00 AM to 4:59 AM | 52 (10.8%) | 22 (6.1%) |
| 5:00 AM to 5:29 AM | 44 (9.2%) | 27 (7.4%) |
| 5:30 AM to 5:59 AM | 51 (10.6%) | 18 (5.0%) |
| 6:00 AM to 6:29 AM | 48 (10.0%) | 7 (1.9%) |
| 6:30 AM to 6:59 AM | 14 (2.9%) | 3 (0.8%) |
| 7:00 AM to 7:29 AM | 52 (10.8%) | 47 (13.0%) |
| 7:30 AM to 7:59 AM | 66 (13.8%) | 92 (25.3%) |
| 8:00 AM to 8:29 AM | 39 (8.1%) | 12 (3.3%) |
| 8:30 AM to 8:59 AM | 28 (5.8%) | 32 (8.8%) |
| 9:00 AM to 9:59 AM | 34 (7.1%) | 13 (3.6%) |
| 10:00 AM to 10:59 AM | 12 (2.5%) | 8 (2.2%) |
| 11:00 AM to 11:59 AM | 0 (0.0%) | 0 (0.0%) |
| 12:00 PM to 3:59 PM | 30 (6.2%) | 63 (17.4%) |
| 4:00 PM to 11:59 PM | 10 (2.1%) | 19 (5.2%) |
| Total | 480 (100.0%) | 363 (100.0%) |
Housing Occupancy in Cameron
Occupancy by Ownership in Cameron
Of the total 700 dwellings in Cameron, owner-occupied units account for 386 (55.1%), while renter-occupied units make up 314 (44.9%).
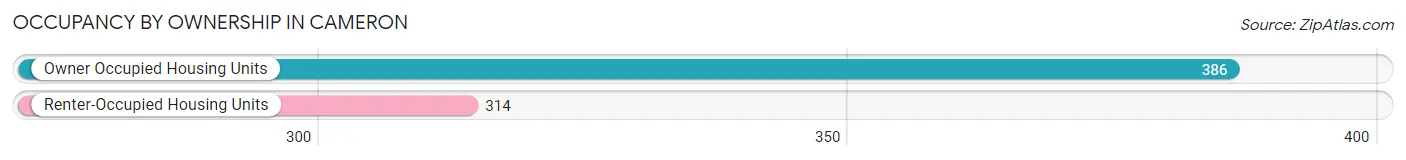
| Occupancy | # Housing Units | % Housing Units |
| Owner Occupied Housing Units | 386 | 55.1% |
| Renter-Occupied Housing Units | 314 | 44.9% |
| Total Occupied Housing Units | 700 | 100.0% |
Occupancy by Household Size in Cameron
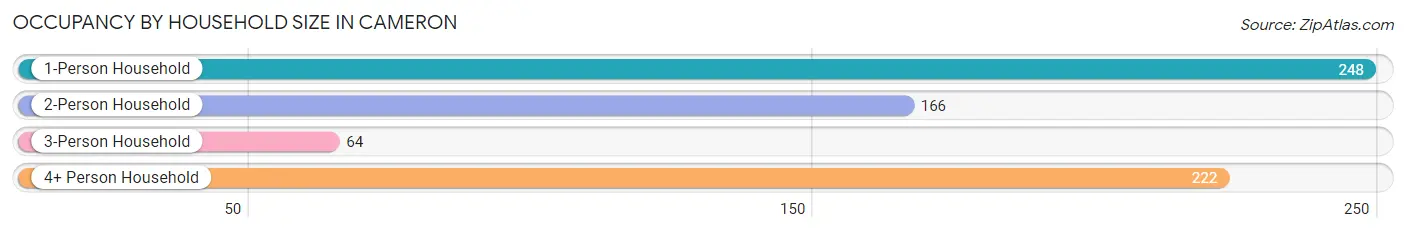
| Household Size | # Housing Units | % Housing Units |
| 1-Person Household | 248 | 35.4% |
| 2-Person Household | 166 | 23.7% |
| 3-Person Household | 64 | 9.1% |
| 4+ Person Household | 222 | 31.7% |
| Total Housing Units | 700 | 100.0% |
Occupancy by Ownership by Household Size in Cameron
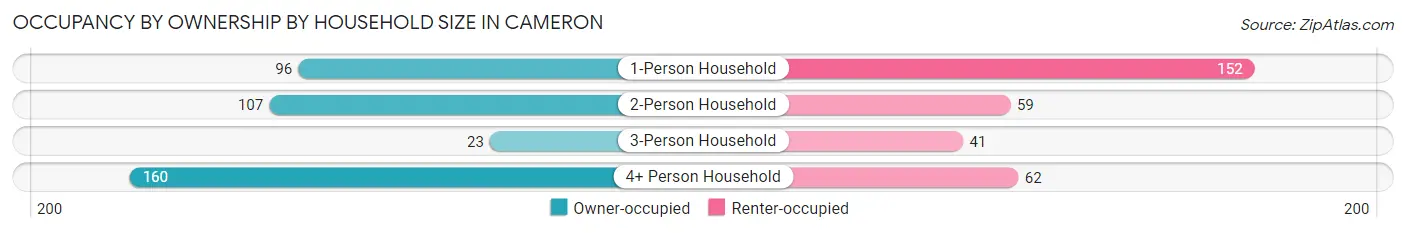
| Household Size | Owner-occupied | Renter-occupied |
| 1-Person Household | 96 (38.7%) | 152 (61.3%) |
| 2-Person Household | 107 (64.5%) | 59 (35.5%) |
| 3-Person Household | 23 (35.9%) | 41 (64.1%) |
| 4+ Person Household | 160 (72.1%) | 62 (27.9%) |
| Total Housing Units | 386 (55.1%) | 314 (44.9%) |
Occupancy by Educational Attainment in Cameron
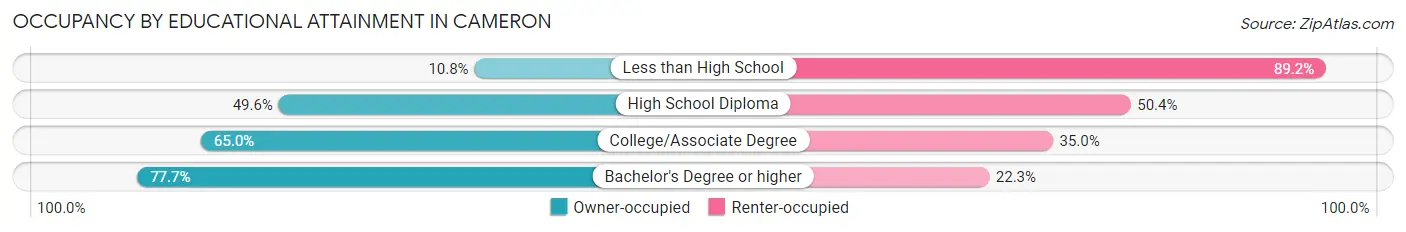
| Household Size | Owner-occupied | Renter-occupied |
| Less than High School | 8 (10.8%) | 66 (89.2%) |
| High School Diploma | 132 (49.6%) | 134 (50.4%) |
| College/Associate Degree | 173 (65.0%) | 93 (35.0%) |
| Bachelor's Degree or higher | 73 (77.7%) | 21 (22.3%) |
Occupancy by Age of Householder in Cameron
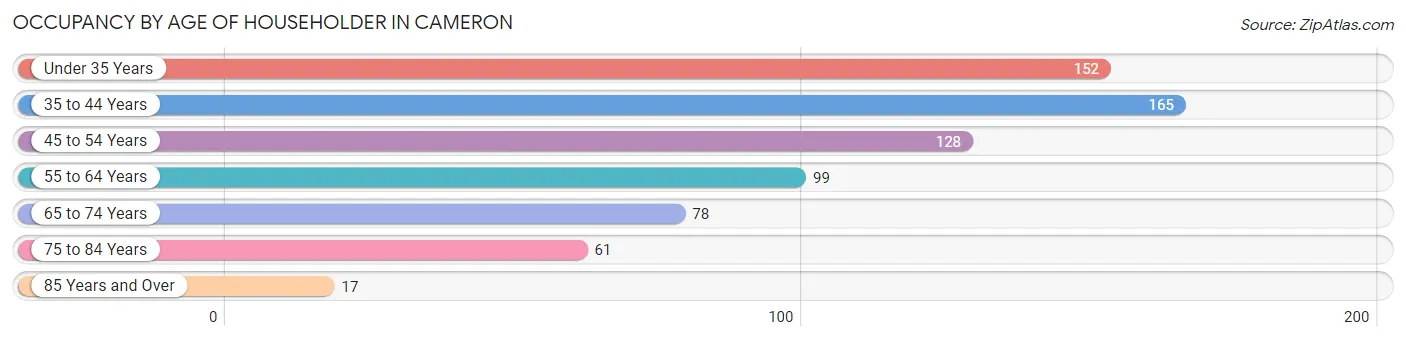
| Age Bracket | # Households | % Households |
| Under 35 Years | 152 | 21.7% |
| 35 to 44 Years | 165 | 23.6% |
| 45 to 54 Years | 128 | 18.3% |
| 55 to 64 Years | 99 | 14.1% |
| 65 to 74 Years | 78 | 11.1% |
| 75 to 84 Years | 61 | 8.7% |
| 85 Years and Over | 17 | 2.4% |
| Total | 700 | 100.0% |
Housing Finances in Cameron
Median Income by Occupancy in Cameron
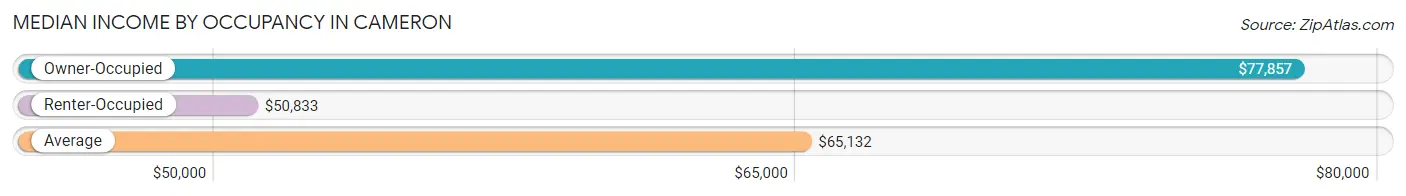
| Occupancy Type | # Households | Median Income |
| Owner-Occupied | 386 (55.1%) | $77,857 |
| Renter-Occupied | 314 (44.9%) | $50,833 |
| Average | 700 (100.0%) | $65,132 |
Occupancy by Householder Income Bracket in Cameron
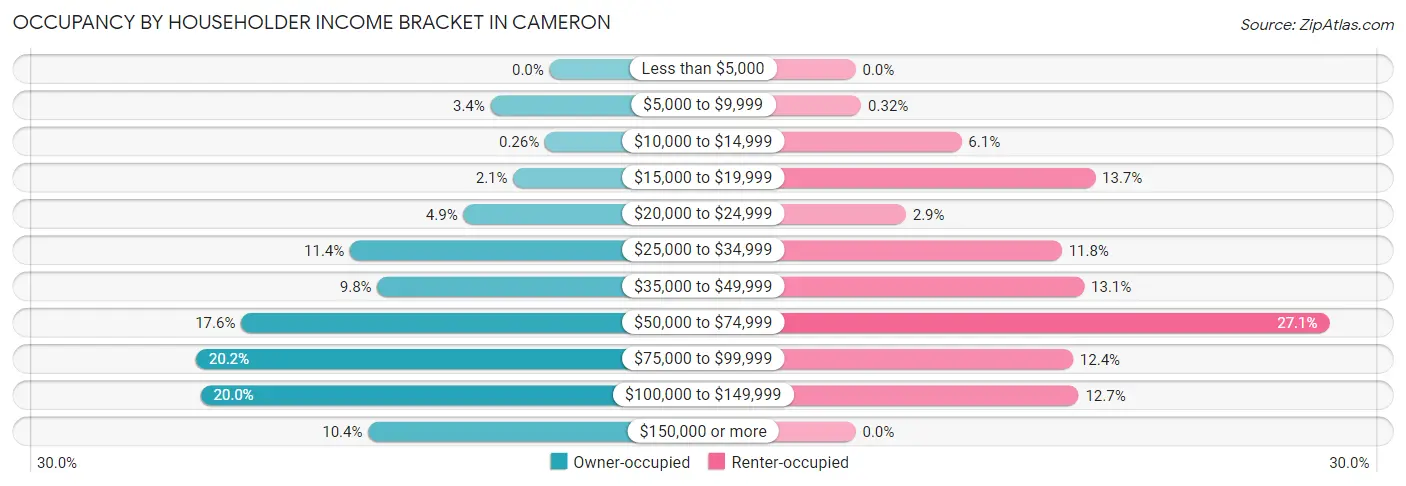
| Income Bracket | Owner-occupied | Renter-occupied |
| Less than $5,000 | 0 (0.0%) | 0 (0.0%) |
| $5,000 to $9,999 | 13 (3.4%) | 1 (0.3%) |
| $10,000 to $14,999 | 1 (0.3%) | 19 (6.0%) |
| $15,000 to $19,999 | 8 (2.1%) | 43 (13.7%) |
| $20,000 to $24,999 | 19 (4.9%) | 9 (2.9%) |
| $25,000 to $34,999 | 44 (11.4%) | 37 (11.8%) |
| $35,000 to $49,999 | 38 (9.8%) | 41 (13.1%) |
| $50,000 to $74,999 | 68 (17.6%) | 85 (27.1%) |
| $75,000 to $99,999 | 78 (20.2%) | 39 (12.4%) |
| $100,000 to $149,999 | 77 (20.0%) | 40 (12.7%) |
| $150,000 or more | 40 (10.4%) | 0 (0.0%) |
| Total | 386 (100.0%) | 314 (100.0%) |
Monthly Housing Cost Tiers in Cameron
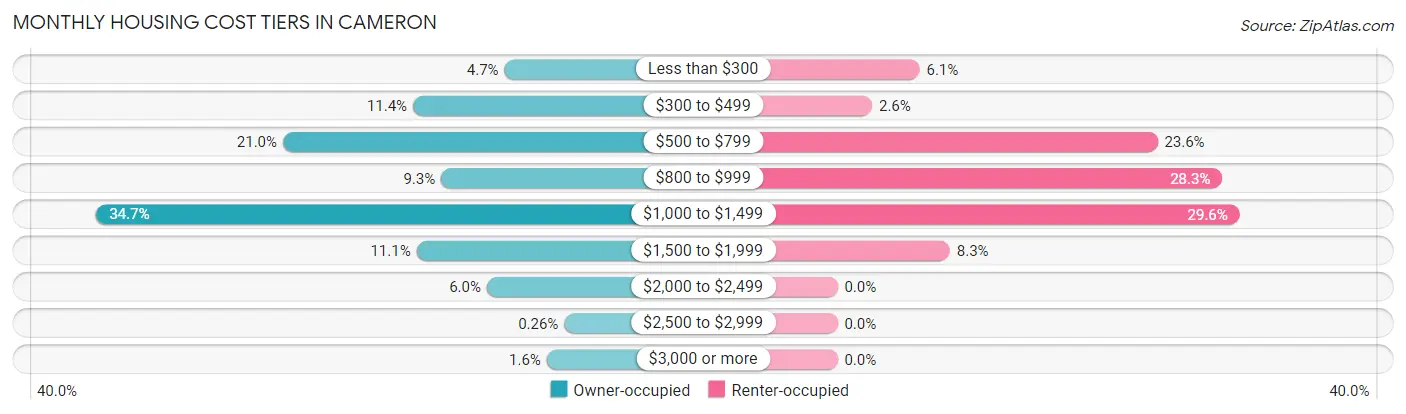
| Monthly Cost | Owner-occupied | Renter-occupied |
| Less than $300 | 18 (4.7%) | 19 (6.0%) |
| $300 to $499 | 44 (11.4%) | 8 (2.5%) |
| $500 to $799 | 81 (21.0%) | 74 (23.6%) |
| $800 to $999 | 36 (9.3%) | 89 (28.3%) |
| $1,000 to $1,499 | 134 (34.7%) | 93 (29.6%) |
| $1,500 to $1,999 | 43 (11.1%) | 26 (8.3%) |
| $2,000 to $2,499 | 23 (6.0%) | 0 (0.0%) |
| $2,500 to $2,999 | 1 (0.3%) | 0 (0.0%) |
| $3,000 or more | 6 (1.5%) | 0 (0.0%) |
| Total | 386 (100.0%) | 314 (100.0%) |
Physical Housing Characteristics in Cameron
Housing Structures in Cameron
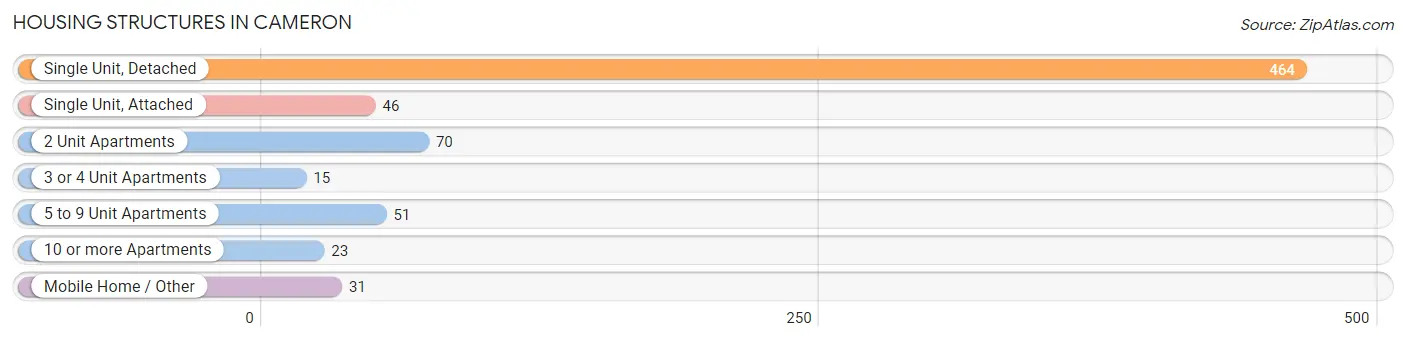
| Structure Type | # Housing Units | % Housing Units |
| Single Unit, Detached | 464 | 66.3% |
| Single Unit, Attached | 46 | 6.6% |
| 2 Unit Apartments | 70 | 10.0% |
| 3 or 4 Unit Apartments | 15 | 2.1% |
| 5 to 9 Unit Apartments | 51 | 7.3% |
| 10 or more Apartments | 23 | 3.3% |
| Mobile Home / Other | 31 | 4.4% |
| Total | 700 | 100.0% |
Housing Structures by Occupancy in Cameron
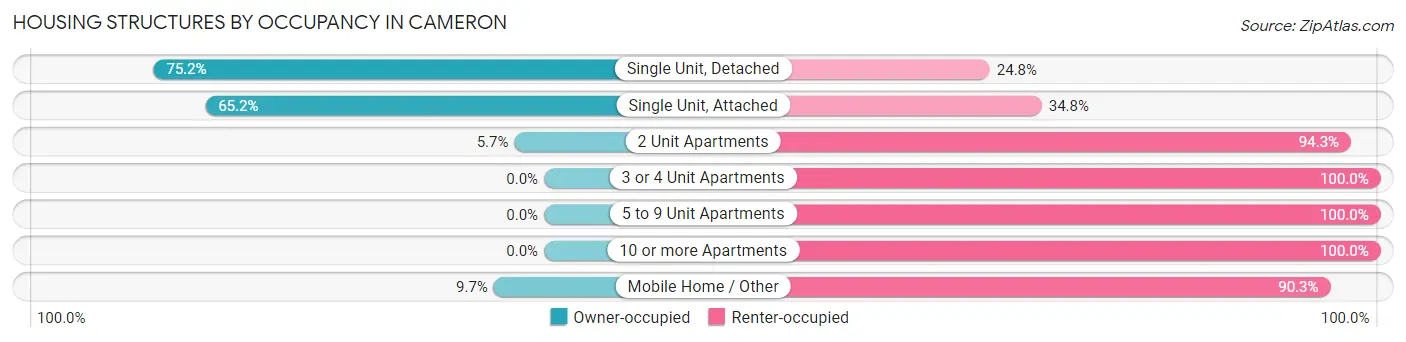
| Structure Type | Owner-occupied | Renter-occupied |
| Single Unit, Detached | 349 (75.2%) | 115 (24.8%) |
| Single Unit, Attached | 30 (65.2%) | 16 (34.8%) |
| 2 Unit Apartments | 4 (5.7%) | 66 (94.3%) |
| 3 or 4 Unit Apartments | 0 (0.0%) | 15 (100.0%) |
| 5 to 9 Unit Apartments | 0 (0.0%) | 51 (100.0%) |
| 10 or more Apartments | 0 (0.0%) | 23 (100.0%) |
| Mobile Home / Other | 3 (9.7%) | 28 (90.3%) |
| Total | 386 (55.1%) | 314 (44.9%) |
Housing Structures by Number of Rooms in Cameron
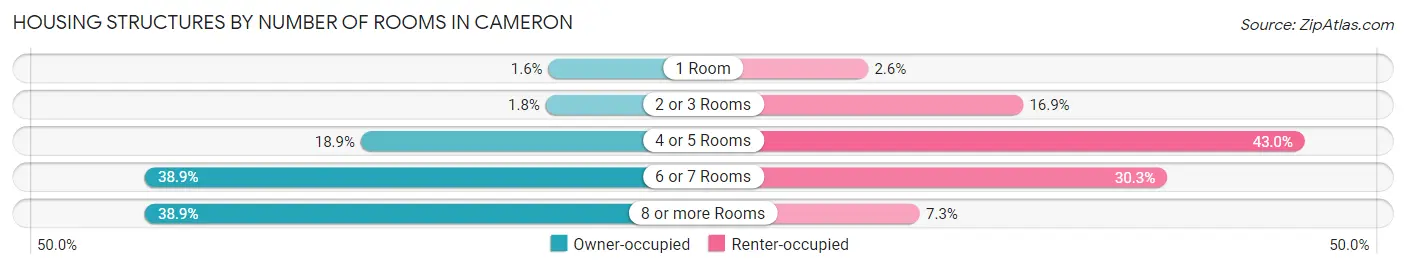
| Number of Rooms | Owner-occupied | Renter-occupied |
| 1 Room | 6 (1.5%) | 8 (2.5%) |
| 2 or 3 Rooms | 7 (1.8%) | 53 (16.9%) |
| 4 or 5 Rooms | 73 (18.9%) | 135 (43.0%) |
| 6 or 7 Rooms | 150 (38.9%) | 95 (30.2%) |
| 8 or more Rooms | 150 (38.9%) | 23 (7.3%) |
| Total | 386 (100.0%) | 314 (100.0%) |
Housing Structure by Heating Type in Cameron
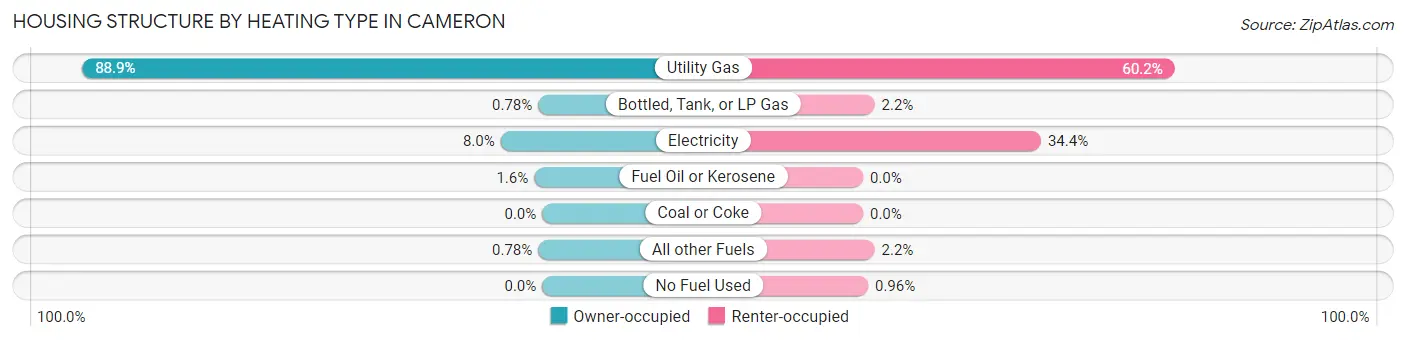
| Heating Type | Owner-occupied | Renter-occupied |
| Utility Gas | 343 (88.9%) | 189 (60.2%) |
| Bottled, Tank, or LP Gas | 3 (0.8%) | 7 (2.2%) |
| Electricity | 31 (8.0%) | 108 (34.4%) |
| Fuel Oil or Kerosene | 6 (1.5%) | 0 (0.0%) |
| Coal or Coke | 0 (0.0%) | 0 (0.0%) |
| All other Fuels | 3 (0.8%) | 7 (2.2%) |
| No Fuel Used | 0 (0.0%) | 3 (1.0%) |
| Total | 386 (100.0%) | 314 (100.0%) |
Household Vehicle Usage in Cameron
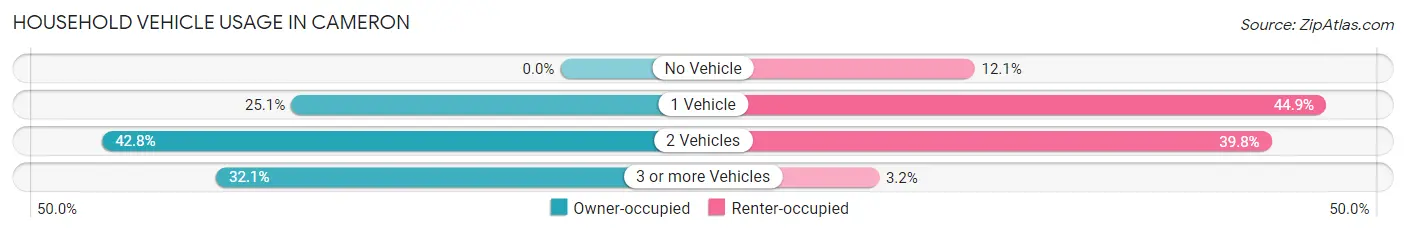
| Vehicles per Household | Owner-occupied | Renter-occupied |
| No Vehicle | 0 (0.0%) | 38 (12.1%) |
| 1 Vehicle | 97 (25.1%) | 141 (44.9%) |
| 2 Vehicles | 165 (42.7%) | 125 (39.8%) |
| 3 or more Vehicles | 124 (32.1%) | 10 (3.2%) |
| Total | 386 (100.0%) | 314 (100.0%) |
Real Estate & Mortgages in Cameron
Real Estate and Mortgage Overview in Cameron
| Characteristic | Without Mortgage | With Mortgage |
| Housing Units | 108 | 278 |
| Median Property Value | $176,400 | $159,100 |
| Median Household Income | $80,833 | $22 |
| Monthly Housing Costs | $473 | $0 |
| Real Estate Taxes | $2,429 | $0 |
Property Value by Mortgage Status in Cameron
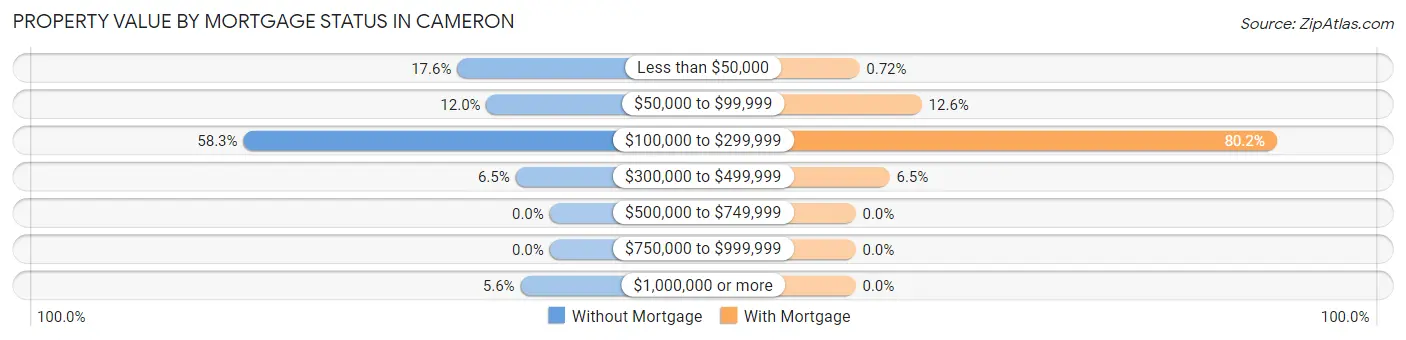
| Property Value | Without Mortgage | With Mortgage |
| Less than $50,000 | 19 (17.6%) | 2 (0.7%) |
| $50,000 to $99,999 | 13 (12.0%) | 35 (12.6%) |
| $100,000 to $299,999 | 63 (58.3%) | 223 (80.2%) |
| $300,000 to $499,999 | 7 (6.5%) | 18 (6.5%) |
| $500,000 to $749,999 | 0 (0.0%) | 0 (0.0%) |
| $750,000 to $999,999 | 0 (0.0%) | 0 (0.0%) |
| $1,000,000 or more | 6 (5.6%) | 0 (0.0%) |
| Total | 108 (100.0%) | 278 (100.0%) |
Household Income by Mortgage Status in Cameron
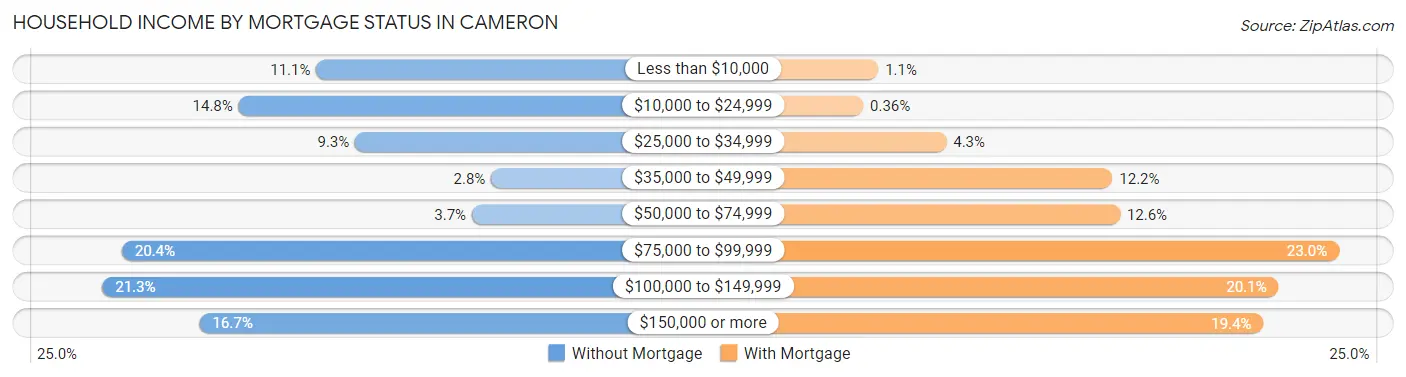
| Household Income | Without Mortgage | With Mortgage |
| Less than $10,000 | 12 (11.1%) | 3 (1.1%) |
| $10,000 to $24,999 | 16 (14.8%) | 1 (0.4%) |
| $25,000 to $34,999 | 10 (9.3%) | 12 (4.3%) |
| $35,000 to $49,999 | 3 (2.8%) | 34 (12.2%) |
| $50,000 to $74,999 | 4 (3.7%) | 35 (12.6%) |
| $75,000 to $99,999 | 22 (20.4%) | 64 (23.0%) |
| $100,000 to $149,999 | 23 (21.3%) | 56 (20.1%) |
| $150,000 or more | 18 (16.7%) | 54 (19.4%) |
| Total | 108 (100.0%) | 278 (100.0%) |
Property Value to Household Income Ratio in Cameron
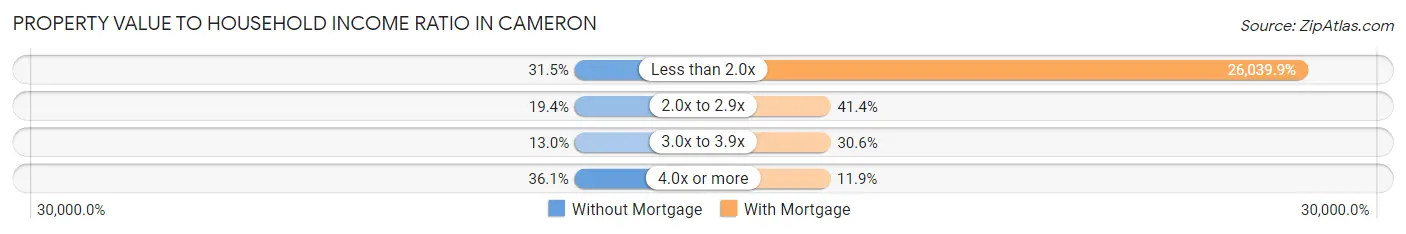
| Value-to-Income Ratio | Without Mortgage | With Mortgage |
| Less than 2.0x | 34 (31.5%) | 72,391 (26,039.9%) |
| 2.0x to 2.9x | 21 (19.4%) | 115 (41.4%) |
| 3.0x to 3.9x | 14 (13.0%) | 85 (30.6%) |
| 4.0x or more | 39 (36.1%) | 33 (11.9%) |
| Total | 108 (100.0%) | 278 (100.0%) |
Real Estate Taxes by Mortgage Status in Cameron
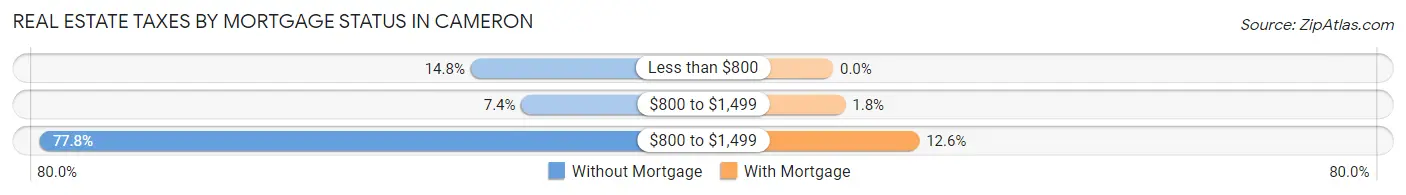
| Property Taxes | Without Mortgage | With Mortgage |
| Less than $800 | 16 (14.8%) | 0 (0.0%) |
| $800 to $1,499 | 8 (7.4%) | 5 (1.8%) |
| $800 to $1,499 | 84 (77.8%) | 35 (12.6%) |
| Total | 108 (100.0%) | 278 (100.0%) |
Health & Disability in Cameron
Health Insurance Coverage by Age in Cameron
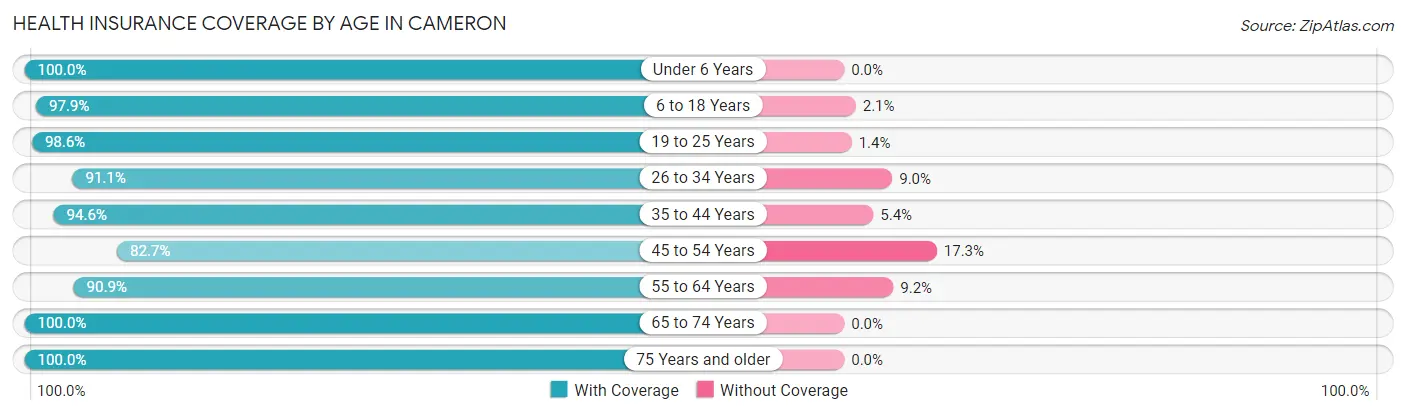
| Age Bracket | With Coverage | Without Coverage |
| Under 6 Years | 159 (100.0%) | 0 (0.0%) |
| 6 to 18 Years | 366 (97.9%) | 8 (2.1%) |
| 19 to 25 Years | 214 (98.6%) | 3 (1.4%) |
| 26 to 34 Years | 173 (91.0%) | 17 (8.9%) |
| 35 to 44 Years | 279 (94.6%) | 16 (5.4%) |
| 45 to 54 Years | 163 (82.7%) | 34 (17.3%) |
| 55 to 64 Years | 129 (90.8%) | 13 (9.1%) |
| 65 to 74 Years | 117 (100.0%) | 0 (0.0%) |
| 75 Years and older | 106 (100.0%) | 0 (0.0%) |
| Total | 1,706 (94.9%) | 91 (5.1%) |
Health Insurance Coverage by Citizenship Status in Cameron
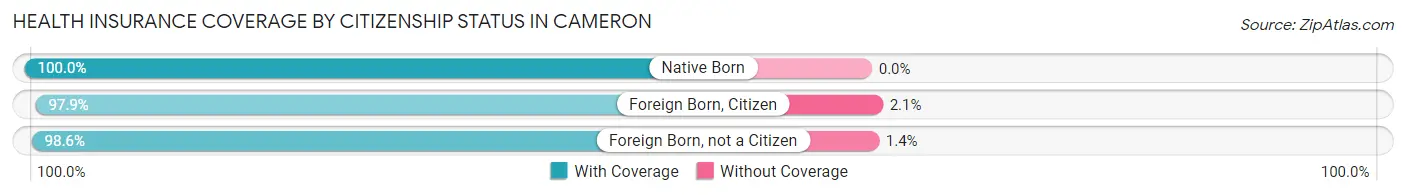
| Citizenship Status | With Coverage | Without Coverage |
| Native Born | 159 (100.0%) | 0 (0.0%) |
| Foreign Born, Citizen | 366 (97.9%) | 8 (2.1%) |
| Foreign Born, not a Citizen | 214 (98.6%) | 3 (1.4%) |
Health Insurance Coverage by Household Income in Cameron
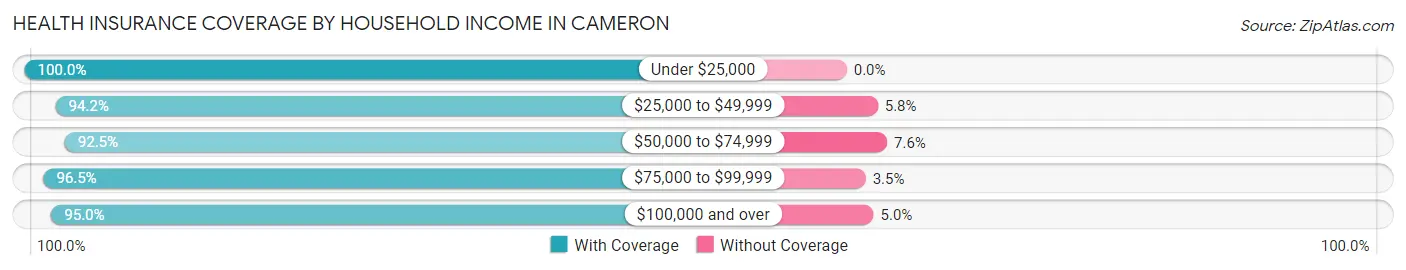
| Household Income | With Coverage | Without Coverage |
| Under $25,000 | 129 (100.0%) | 0 (0.0%) |
| $25,000 to $49,999 | 292 (94.2%) | 18 (5.8%) |
| $50,000 to $74,999 | 392 (92.4%) | 32 (7.5%) |
| $75,000 to $99,999 | 382 (96.5%) | 14 (3.5%) |
| $100,000 and over | 511 (95.0%) | 27 (5.0%) |
Public vs Private Health Insurance Coverage by Age in Cameron
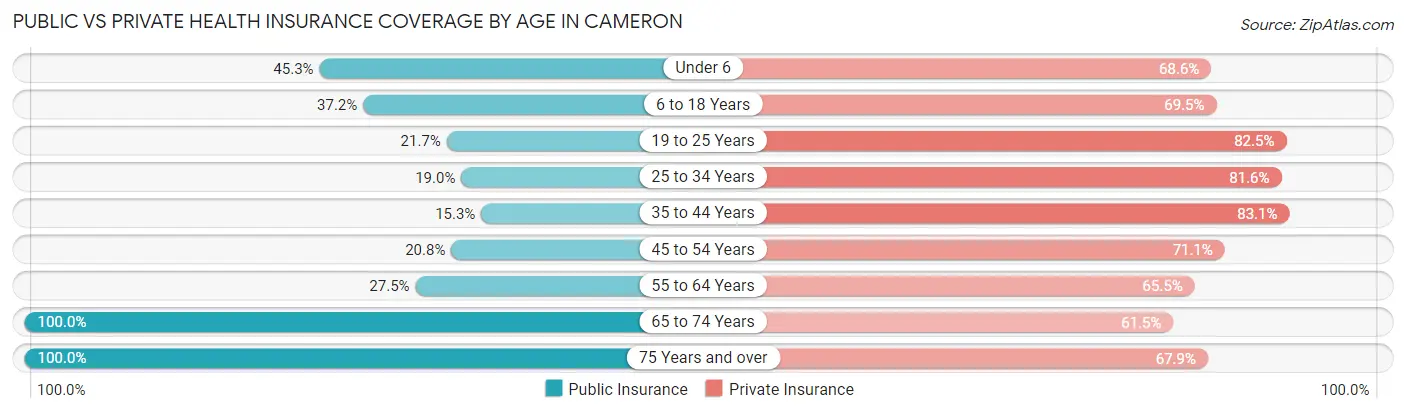
| Age Bracket | Public Insurance | Private Insurance |
| Under 6 | 72 (45.3%) | 109 (68.5%) |
| 6 to 18 Years | 139 (37.2%) | 260 (69.5%) |
| 19 to 25 Years | 47 (21.7%) | 179 (82.5%) |
| 25 to 34 Years | 36 (19.0%) | 155 (81.6%) |
| 35 to 44 Years | 45 (15.2%) | 245 (83.1%) |
| 45 to 54 Years | 41 (20.8%) | 140 (71.1%) |
| 55 to 64 Years | 39 (27.5%) | 93 (65.5%) |
| 65 to 74 Years | 117 (100.0%) | 72 (61.5%) |
| 75 Years and over | 106 (100.0%) | 72 (67.9%) |
| Total | 642 (35.7%) | 1,325 (73.7%) |
Disability Status by Sex by Age in Cameron
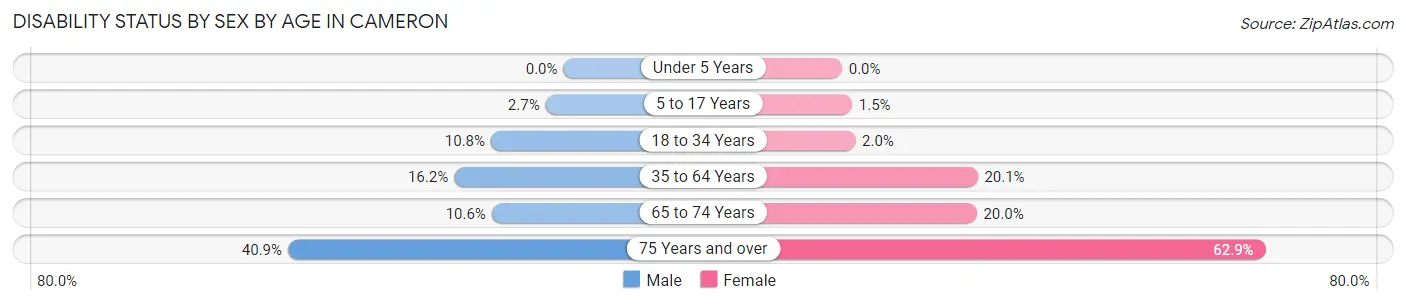
| Age Bracket | Male | Female |
| Under 5 Years | 0 (0.0%) | 0 (0.0%) |
| 5 to 17 Years | 3 (2.6%) | 4 (1.5%) |
| 18 to 34 Years | 24 (10.8%) | 4 (2.0%) |
| 35 to 64 Years | 57 (16.2%) | 57 (20.1%) |
| 65 to 74 Years | 5 (10.6%) | 14 (20.0%) |
| 75 Years and over | 18 (40.9%) | 39 (62.9%) |
Disability Class by Sex by Age in Cameron
Disability Class: Hearing Difficulty
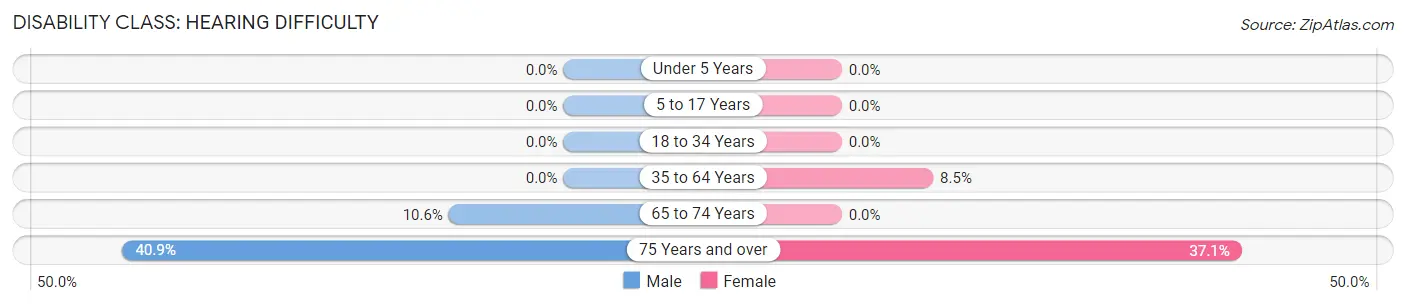
| Age Bracket | Male | Female |
| Under 5 Years | 0 (0.0%) | 0 (0.0%) |
| 5 to 17 Years | 0 (0.0%) | 0 (0.0%) |
| 18 to 34 Years | 0 (0.0%) | 0 (0.0%) |
| 35 to 64 Years | 0 (0.0%) | 24 (8.5%) |
| 65 to 74 Years | 5 (10.6%) | 0 (0.0%) |
| 75 Years and over | 18 (40.9%) | 23 (37.1%) |
Disability Class: Vision Difficulty
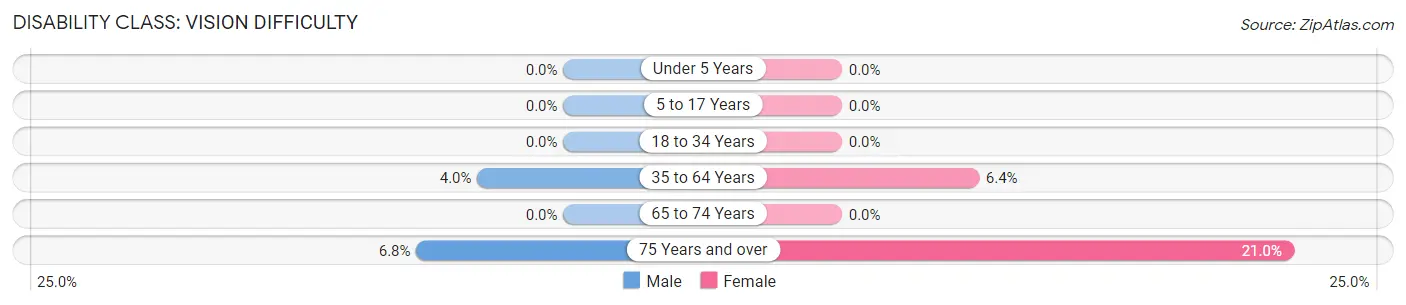
| Age Bracket | Male | Female |
| Under 5 Years | 0 (0.0%) | 0 (0.0%) |
| 5 to 17 Years | 0 (0.0%) | 0 (0.0%) |
| 18 to 34 Years | 0 (0.0%) | 0 (0.0%) |
| 35 to 64 Years | 14 (4.0%) | 18 (6.4%) |
| 65 to 74 Years | 0 (0.0%) | 0 (0.0%) |
| 75 Years and over | 3 (6.8%) | 13 (21.0%) |
Disability Class: Cognitive Difficulty
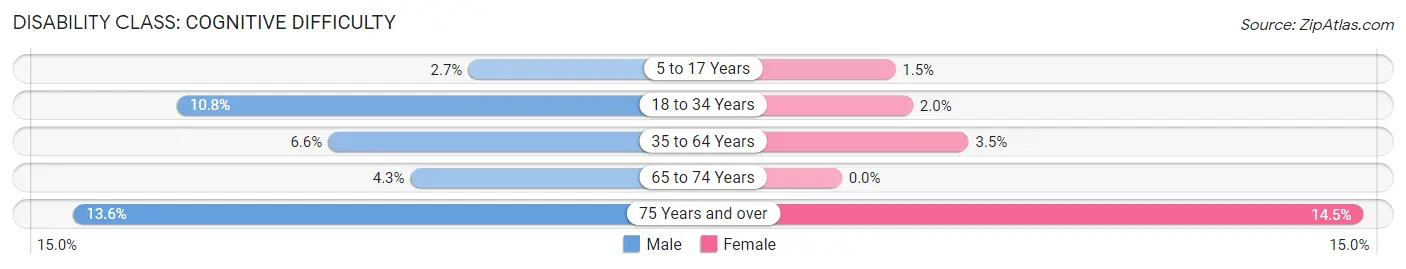
| Age Bracket | Male | Female |
| 5 to 17 Years | 3 (2.6%) | 4 (1.5%) |
| 18 to 34 Years | 24 (10.8%) | 4 (2.0%) |
| 35 to 64 Years | 23 (6.6%) | 10 (3.5%) |
| 65 to 74 Years | 2 (4.3%) | 0 (0.0%) |
| 75 Years and over | 6 (13.6%) | 9 (14.5%) |
Disability Class: Ambulatory Difficulty
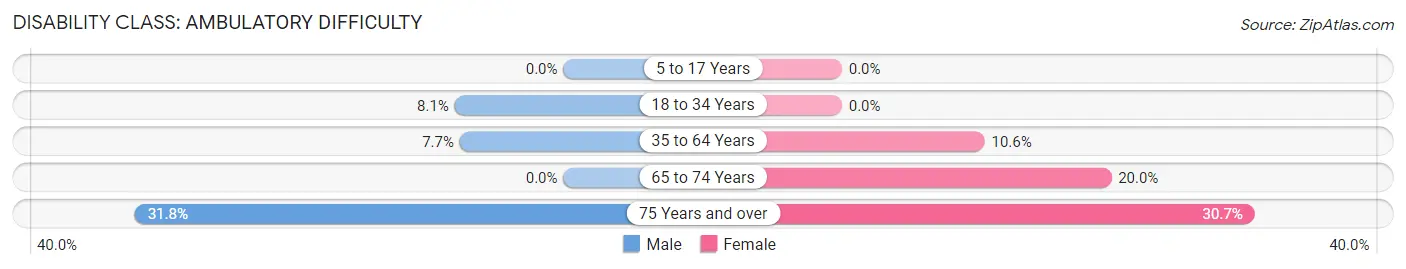
| Age Bracket | Male | Female |
| 5 to 17 Years | 0 (0.0%) | 0 (0.0%) |
| 18 to 34 Years | 18 (8.1%) | 0 (0.0%) |
| 35 to 64 Years | 27 (7.7%) | 30 (10.6%) |
| 65 to 74 Years | 0 (0.0%) | 14 (20.0%) |
| 75 Years and over | 14 (31.8%) | 19 (30.6%) |
Disability Class: Self-Care Difficulty
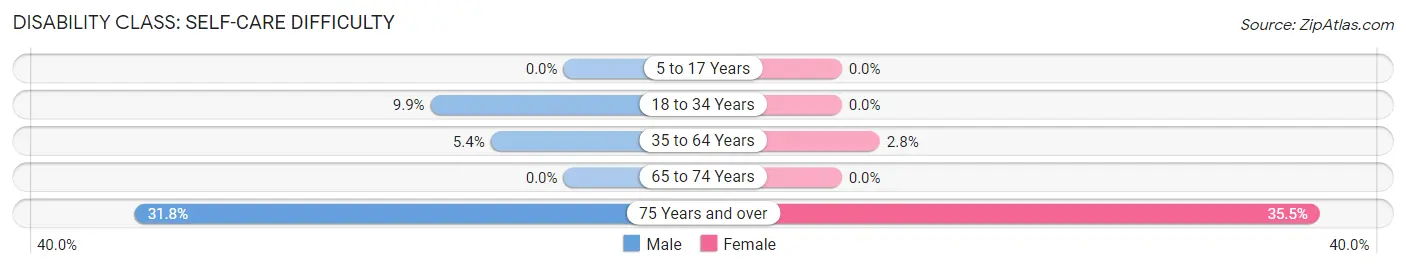
| Age Bracket | Male | Female |
| 5 to 17 Years | 0 (0.0%) | 0 (0.0%) |
| 18 to 34 Years | 22 (9.9%) | 0 (0.0%) |
| 35 to 64 Years | 19 (5.4%) | 8 (2.8%) |
| 65 to 74 Years | 0 (0.0%) | 0 (0.0%) |
| 75 Years and over | 14 (31.8%) | 22 (35.5%) |
Technology Access in Cameron
Computing Device Access in Cameron
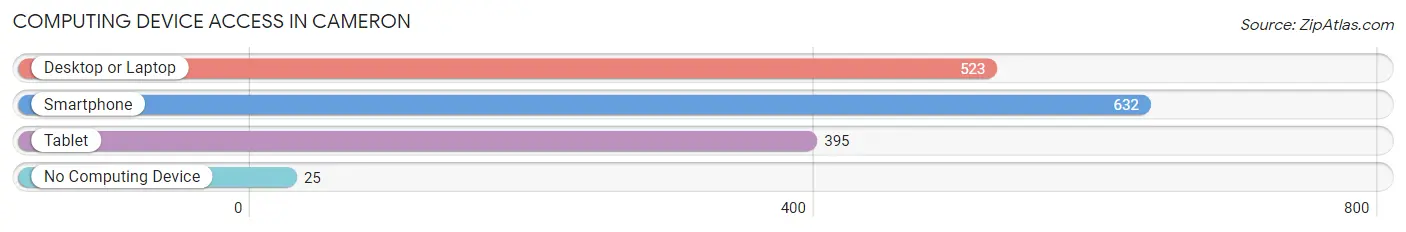
| Device Type | # Households | % Households |
| Desktop or Laptop | 523 | 74.7% |
| Smartphone | 632 | 90.3% |
| Tablet | 395 | 56.4% |
| No Computing Device | 25 | 3.6% |
| Total | 700 | 100.0% |
Internet Access in Cameron
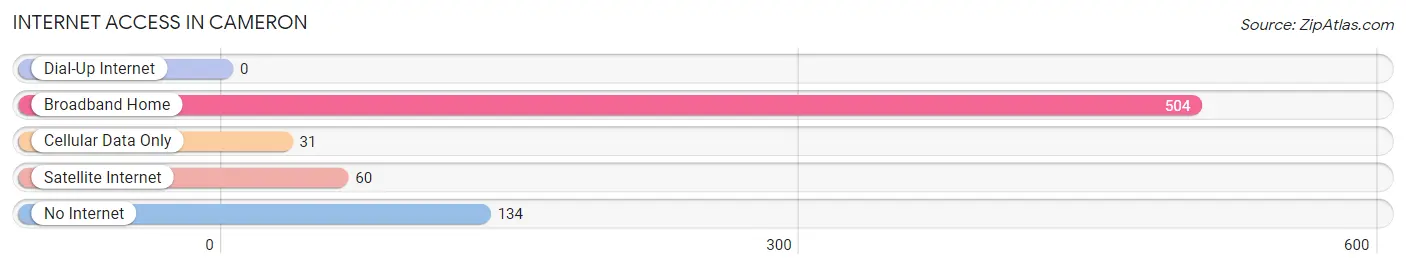
| Internet Type | # Households | % Households |
| Dial-Up Internet | 0 | 0.0% |
| Broadband Home | 504 | 72.0% |
| Cellular Data Only | 31 | 4.4% |
| Satellite Internet | 60 | 8.6% |
| No Internet | 134 | 19.1% |
| Total | 700 | 100.0% |
Cameron Summary
Cameron, Wisconsin is a small village located in Barron County, Wisconsin. It is situated on the banks of the Red Cedar River, and is home to a population of approximately 1,000 people. The village is located in the northwest corner of the state, and is bordered by the cities of Rice Lake, Barron, and Chetek.
History
Cameron was first settled in the late 1800s by a group of Norwegian immigrants. The village was originally known as “Cameron’s Crossing”, named after the first settler, John Cameron. The village was officially incorporated in 1891, and the first post office was established in 1892.
In the early 1900s, the village was a thriving lumber town, with several sawmills and a large paper mill. The paper mill was the largest employer in the area, and provided jobs for many of the residents. The paper mill closed in the 1950s, and the sawmills followed suit in the 1960s.
Since then, the village has become a quiet, rural community. The main industries in the area are agriculture and tourism. The village is home to several small businesses, including a grocery store, a hardware store, and a few restaurants.
Geography
Cameron is located in the northwest corner of Wisconsin, in Barron County. The village is situated on the banks of the Red Cedar River, and is surrounded by rolling hills and forests. The village is located approximately 30 miles from the city of Rice Lake, and is about an hour’s drive from the Twin Cities.
The village has a total area of 1.2 square miles, all of which is land. The village is located at an elevation of 1,068 feet above sea level. The climate in Cameron is classified as humid continental, with cold winters and warm summers.
Economy
The economy of Cameron is largely based on agriculture and tourism. The village is home to several small businesses, including a grocery store, a hardware store, and a few restaurants. The village also has a few small manufacturing companies, which produce a variety of products, including furniture and clothing.
The village is also home to a few small farms, which produce a variety of crops, including corn, soybeans, and hay. The village also has a few small wineries, which produce a variety of wines.
Demographics
As of the 2010 census, the population of Cameron was 1,000 people. The racial makeup of the village was 97.2% White, 0.7% African American, 0.2% Native American, 0.2% Asian, 0.2% from other races, and 1.7% from two or more races. Hispanic or Latino of any race were 0.7% of the population.
The median income for a household in the village was $41,250, and the median income for a family was $50,000. The per capita income for the village was $20,845. About 8.2% of families and 10.2% of the population were below the poverty line, including 11.2% of those under age 18 and 8.2% of those age 65 or over.
Common Questions
What is Per Capita Income in Cameron?
Per Capita income in Cameron is $27,954.
What is the Median Family Income in Cameron?
Median Family Income in Cameron is $79,643.
What is the Median Household income in Cameron?
Median Household Income in Cameron is $65,132.
What is Income or Wage Gap in Cameron?
Income or Wage Gap in Cameron is 34.2%.
Women in Cameron earn 65.8 cents for every dollar earned by a man.
What is Family Income Deficit in Cameron?
Family Income Deficit in Cameron is $7,072.
Families that are below poverty line in Cameron earn $7,072 less on average than the poverty threshold level.
What is Inequality or Gini Index in Cameron?
Inequality or Gini Index in Cameron is 0.39.
What is the Total Population of Cameron?
Total Population of Cameron is 1,800.
What is the Total Male Population of Cameron?
Total Male Population of Cameron is 860.
What is the Total Female Population of Cameron?
Total Female Population of Cameron is 940.
What is the Ratio of Males per 100 Females in Cameron?
There are 91.49 Males per 100 Females in Cameron.
What is the Ratio of Females per 100 Males in Cameron?
There are 109.30 Females per 100 Males in Cameron.
What is the Median Population Age in Cameron?
Median Population Age in Cameron is 32.9 Years.
What is the Average Family Size in Cameron
Average Family Size in Cameron is 3.4 People.
What is the Average Household Size in Cameron
Average Household Size in Cameron is 2.6 People.
How Large is the Labor Force in Cameron?
There are 961 People in the Labor Forcein in Cameron.
What is the Percentage of People in the Labor Force in Cameron?
71.1% of People are in the Labor Force in Cameron.
What is the Unemployment Rate in Cameron?
Unemployment Rate in Cameron is 2.1%.