Burnett, WI Map & Demographics
Burnett Map
Burnett Overview
$42,074
PER CAPITA INCOME
$85,500
AVG FAMILY INCOME
$69,375
AVG HOUSEHOLD INCOME
65.9%
WAGE / INCOME GAP [ % ]
34.1¢/ $1
WAGE / INCOME GAP [ $ ]
0.31
INEQUALITY / GINI INDEX
292
TOTAL POPULATION
175
MALE POPULATION
117
FEMALE POPULATION
149.57
MALES / 100 FEMALES
66.86
FEMALES / 100 MALES
40.1
MEDIAN AGE
3.4
AVG FAMILY SIZE
2.3
AVG HOUSEHOLD SIZE
216
LABOR FORCE [ PEOPLE ]
80.6%
PERCENT IN LABOR FORCE
16.2%
UNEMPLOYMENT RATE
Burnett Zip Codes
Burnett Area Codes
Income in Burnett
Income Overview in Burnett
Per Capita Income in Burnett is $42,074, while median incomes of families and households are $85,500 and $69,375 respectively.
| Characteristic | Number | Measure |
| Per Capita Income | 292 | $42,074 |
| Median Family Income | 50 | $85,500 |
| Mean Family Income | 50 | $82,712 |
| Median Household Income | 129 | $69,375 |
| Mean Household Income | 129 | $66,655 |
| Income Deficit | 50 | $0 |
| Wage / Income Gap (%) | 292 | 65.86% |
| Wage / Income Gap ($) | 292 | 34.14¢ per $1 |
| Gini / Inequality Index | 292 | 0.31 |
Earnings by Sex in Burnett
Average Earnings in Burnett are $59,000, $65,375 for men and $22,321 for women, a difference of 65.9%.
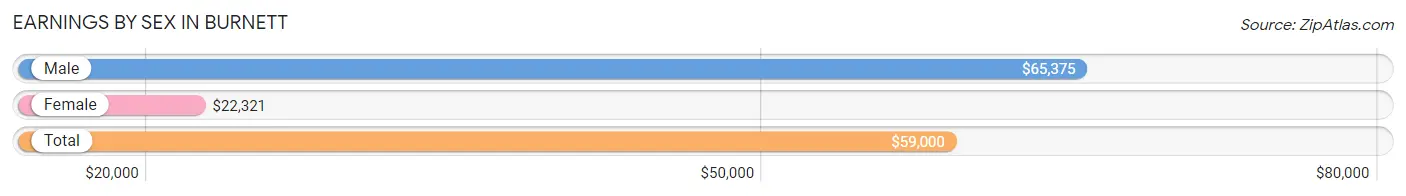
| Sex | Number | Average Earnings |
| Male | 135 (60.8%) | $65,375 |
| Female | 87 (39.2%) | $22,321 |
| Total | 222 (100.0%) | $59,000 |
Earnings by Sex by Income Bracket in Burnett
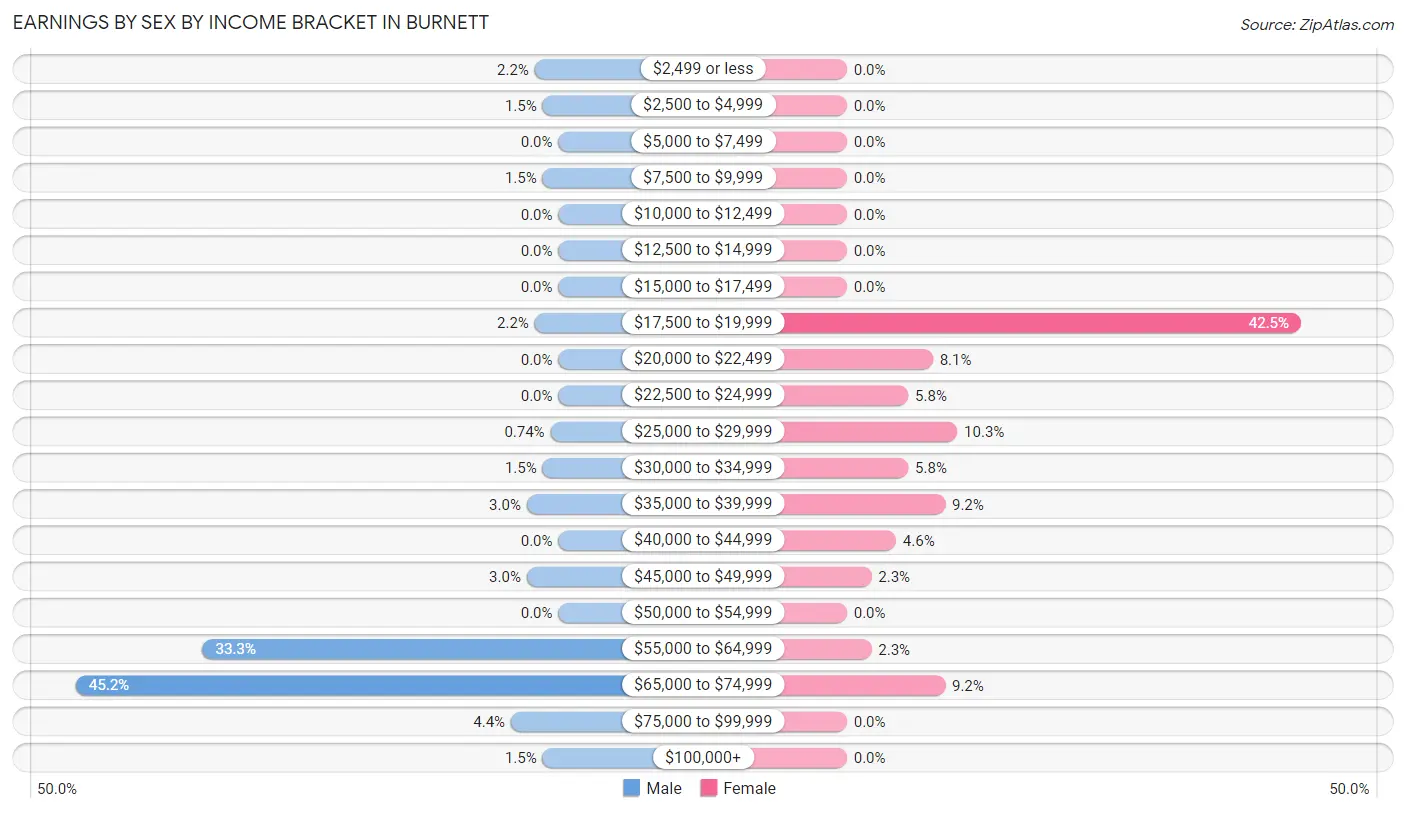
The most common earnings brackets in Burnett are $65,000 to $74,999 for men (61 | 45.2%) and $17,500 to $19,999 for women (37 | 42.5%).
| Income | Male | Female |
| $2,499 or less | 3 (2.2%) | 0 (0.0%) |
| $2,500 to $4,999 | 2 (1.5%) | 0 (0.0%) |
| $5,000 to $7,499 | 0 (0.0%) | 0 (0.0%) |
| $7,500 to $9,999 | 2 (1.5%) | 0 (0.0%) |
| $10,000 to $12,499 | 0 (0.0%) | 0 (0.0%) |
| $12,500 to $14,999 | 0 (0.0%) | 0 (0.0%) |
| $15,000 to $17,499 | 0 (0.0%) | 0 (0.0%) |
| $17,500 to $19,999 | 3 (2.2%) | 37 (42.5%) |
| $20,000 to $22,499 | 0 (0.0%) | 7 (8.1%) |
| $22,500 to $24,999 | 0 (0.0%) | 5 (5.8%) |
| $25,000 to $29,999 | 1 (0.7%) | 9 (10.3%) |
| $30,000 to $34,999 | 2 (1.5%) | 5 (5.8%) |
| $35,000 to $39,999 | 4 (3.0%) | 8 (9.2%) |
| $40,000 to $44,999 | 0 (0.0%) | 4 (4.6%) |
| $45,000 to $49,999 | 4 (3.0%) | 2 (2.3%) |
| $50,000 to $54,999 | 0 (0.0%) | 0 (0.0%) |
| $55,000 to $64,999 | 45 (33.3%) | 2 (2.3%) |
| $65,000 to $74,999 | 61 (45.2%) | 8 (9.2%) |
| $75,000 to $99,999 | 6 (4.4%) | 0 (0.0%) |
| $100,000+ | 2 (1.5%) | 0 (0.0%) |
| Total | 135 (100.0%) | 87 (100.0%) |
Earnings by Sex by Educational Attainment in Burnett
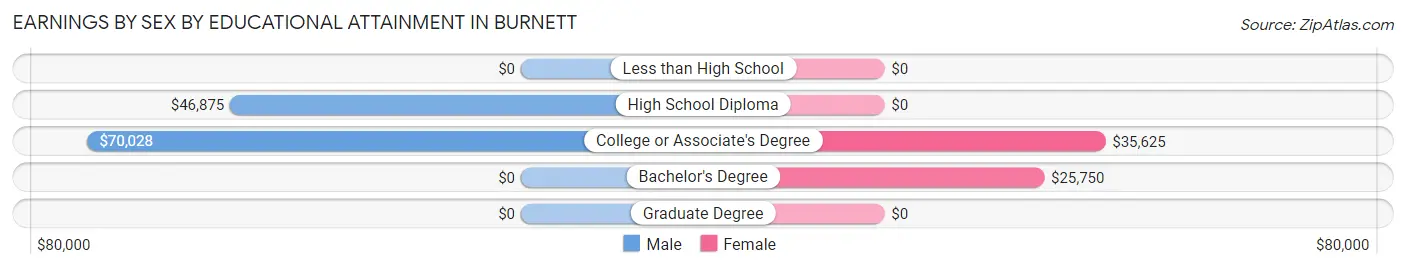
Average earnings in Burnett are $64,844 for men and $21,071 for women, a difference of 67.5%. Men with an educational attainment of college or associate's degree enjoy the highest average annual earnings of $70,028, while those with high school diploma education earn the least with $46,875. Women with an educational attainment of college or associate's degree earn the most with the average annual earnings of $35,625, while those with bachelor's degree education have the smallest earnings of $25,750.
| Educational Attainment | Male Income | Female Income |
| Less than High School | - | - |
| High School Diploma | $46,875 | $0 |
| College or Associate's Degree | $70,028 | $35,625 |
| Bachelor's Degree | - | - |
| Graduate Degree | - | - |
| Total | $64,844 | $21,071 |
Family Income in Burnett
Family Income Brackets in Burnett
According to the Burnett family income data, there are 13 families falling into the $50,000 to $74,999 income range, which is the most common income bracket and makes up 26.0% of all families.
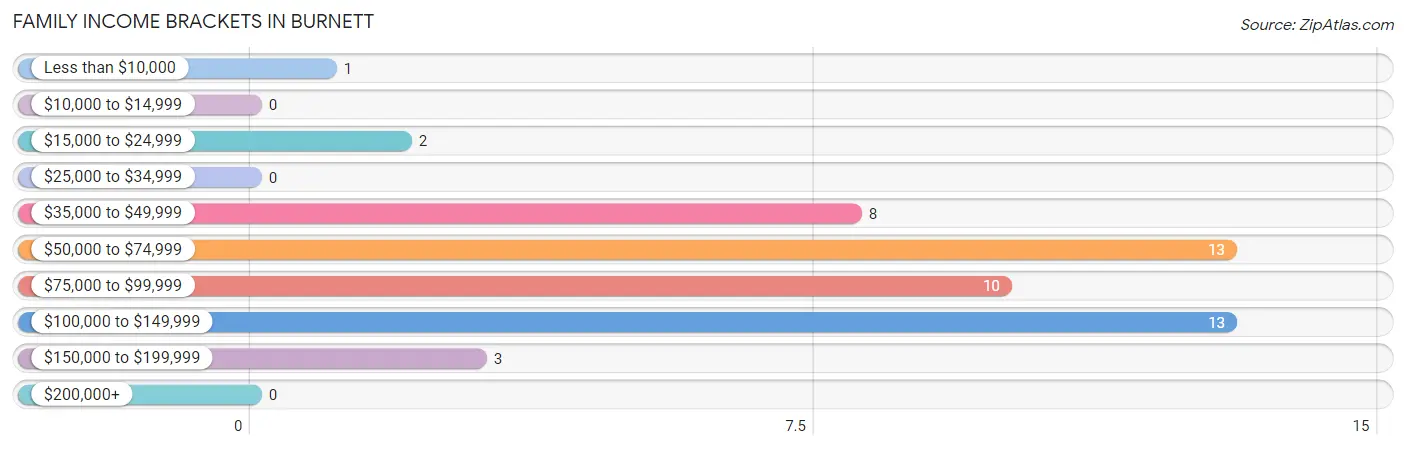
| Income Bracket | # Families | % Families |
| Less than $10,000 | 1 | 2.0% |
| $10,000 to $14,999 | 0 | 0.0% |
| $15,000 to $24,999 | 2 | 4.0% |
| $25,000 to $34,999 | 0 | 0.0% |
| $35,000 to $49,999 | 8 | 16.0% |
| $50,000 to $74,999 | 13 | 26.0% |
| $75,000 to $99,999 | 10 | 20.0% |
| $100,000 to $149,999 | 13 | 26.0% |
| $150,000 to $199,999 | 3 | 6.0% |
| $200,000+ | 0 | 0.0% |
Family Income by Famaliy Size in Burnett
2-person families (33 | 66.0%) account for the highest median family income in Burnett with $86,750 per family, while 2-person families (33 | 66.0%) have the highest median income of $43,375 per family member.
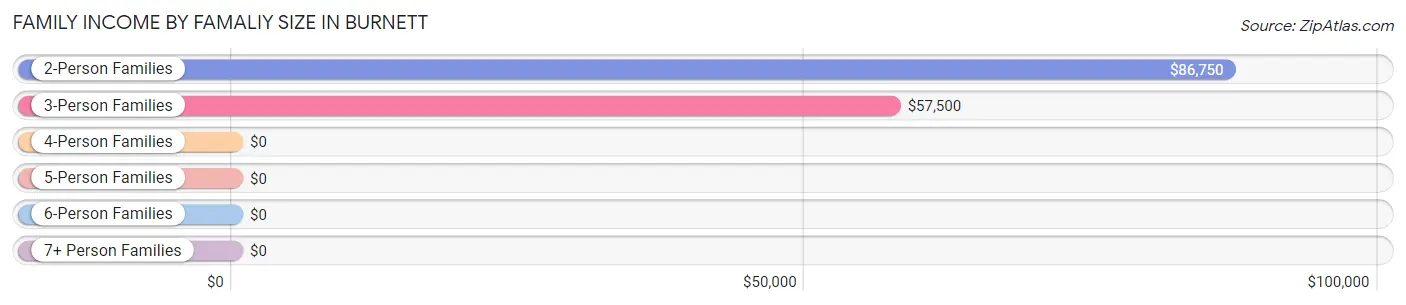
| Income Bracket | # Families | Median Income |
| 2-Person Families | 33 (66.0%) | $86,750 |
| 3-Person Families | 14 (28.0%) | $57,500 |
| 4-Person Families | 0 (0.0%) | $0 |
| 5-Person Families | 3 (6.0%) | $0 |
| 6-Person Families | 0 (0.0%) | $0 |
| 7+ Person Families | 0 (0.0%) | $0 |
| Total | 50 (100.0%) | $85,500 |
Family Income by Number of Earners in Burnett
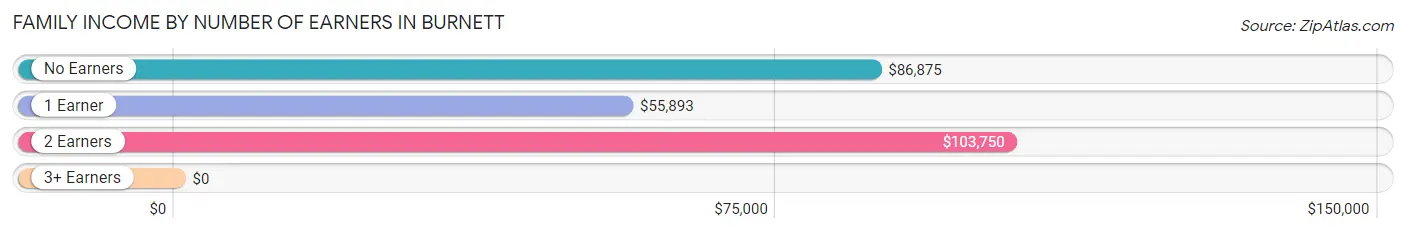
| Number of Earners | # Families | Median Income |
| No Earners | 5 (10.0%) | $86,875 |
| 1 Earner | 25 (50.0%) | $55,893 |
| 2 Earners | 18 (36.0%) | $103,750 |
| 3+ Earners | 2 (4.0%) | $0 |
| Total | 50 (100.0%) | $85,500 |
Household Income in Burnett
Household Income Brackets in Burnett
With 46 households falling in the category, the $75,000 to $99,999 income range is the most frequent in Burnett, accounting for 35.7% of all households.
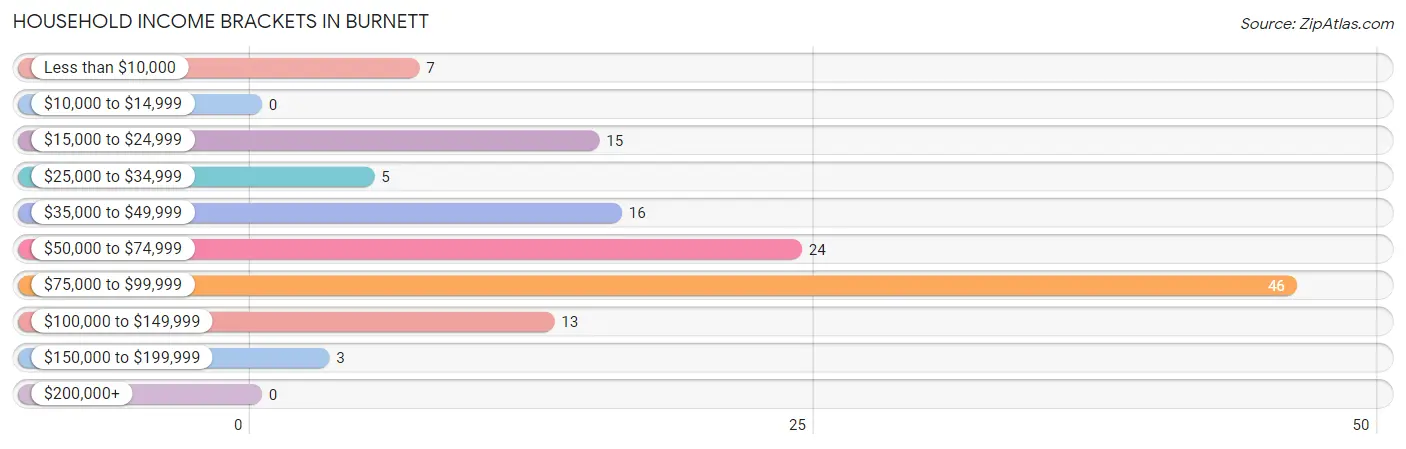
| Income Bracket | # Households | % Households |
| Less than $10,000 | 7 | 5.4% |
| $10,000 to $14,999 | 0 | 0.0% |
| $15,000 to $24,999 | 15 | 11.6% |
| $25,000 to $34,999 | 5 | 3.9% |
| $35,000 to $49,999 | 16 | 12.4% |
| $50,000 to $74,999 | 24 | 18.6% |
| $75,000 to $99,999 | 46 | 35.7% |
| $100,000 to $149,999 | 13 | 10.1% |
| $150,000 to $199,999 | 3 | 2.3% |
| $200,000+ | 0 | 0.0% |
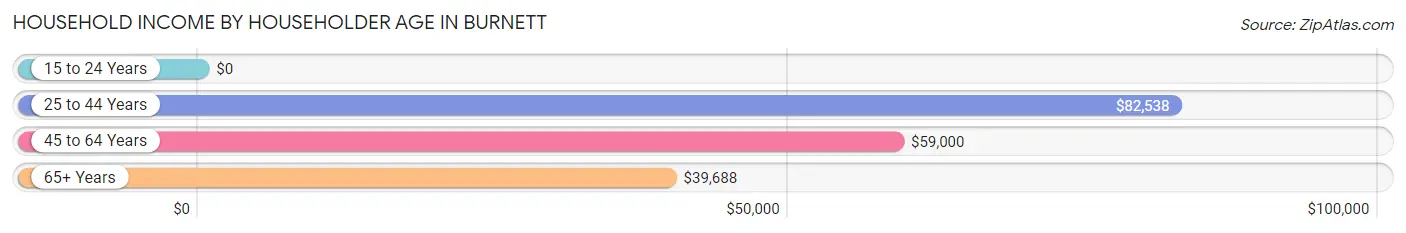
Household Income by Householder Age in Burnett
The median household income in Burnett is $69,375, with the highest median household income of $82,538 found in the 25 to 44 years age bracket for the primary householder. A total of 71 households (55.0%) fall into this category. Meanwhile, the 15 to 24 years age bracket for the primary householder has the lowest median household income of $0, with 3 households (2.3%) in this group.
| Income Bracket | # Households | Median Income |
| 15 to 24 Years | 3 (2.3%) | $0 |
| 25 to 44 Years | 71 (55.0%) | $82,538 |
| 45 to 64 Years | 32 (24.8%) | $59,000 |
| 65+ Years | 23 (17.8%) | $39,688 |
| Total | 129 (100.0%) | $69,375 |
Poverty in Burnett
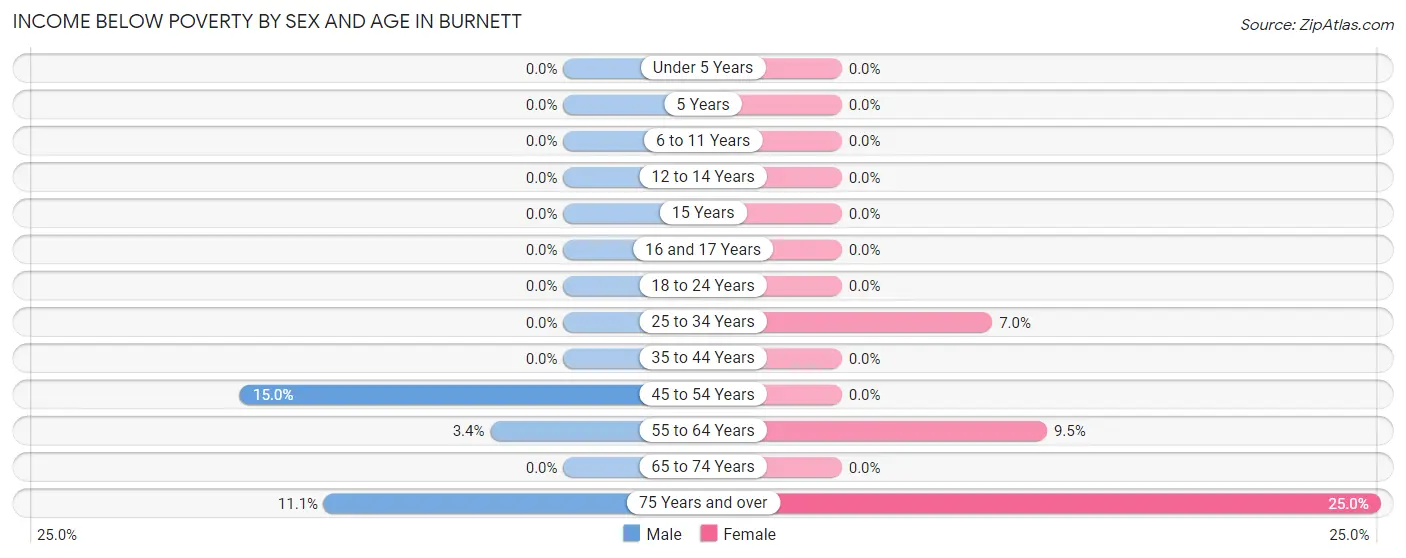
Income Below Poverty by Sex and Age in Burnett
With 3.4% poverty level for males and 5.1% for females among the residents of Burnett, 45 to 54 year old males and 75 year old and over females are the most vulnerable to poverty, with 3 males (15.0%) and 1 females (25.0%) in their respective age groups living below the poverty level.
| Age Bracket | Male | Female |
| Under 5 Years | 0 (0.0%) | 0 (0.0%) |
| 5 Years | 0 (0.0%) | 0 (0.0%) |
| 6 to 11 Years | 0 (0.0%) | 0 (0.0%) |
| 12 to 14 Years | 0 (0.0%) | 0 (0.0%) |
| 15 Years | 0 (0.0%) | 0 (0.0%) |
| 16 and 17 Years | 0 (0.0%) | 0 (0.0%) |
| 18 to 24 Years | 0 (0.0%) | 0 (0.0%) |
| 25 to 34 Years | 0 (0.0%) | 3 (7.0%) |
| 35 to 44 Years | 0 (0.0%) | 0 (0.0%) |
| 45 to 54 Years | 3 (15.0%) | 0 (0.0%) |
| 55 to 64 Years | 2 (3.4%) | 2 (9.5%) |
| 65 to 74 Years | 0 (0.0%) | 0 (0.0%) |
| 75 Years and over | 1 (11.1%) | 1 (25.0%) |
| Total | 6 (3.4%) | 6 (5.1%) |
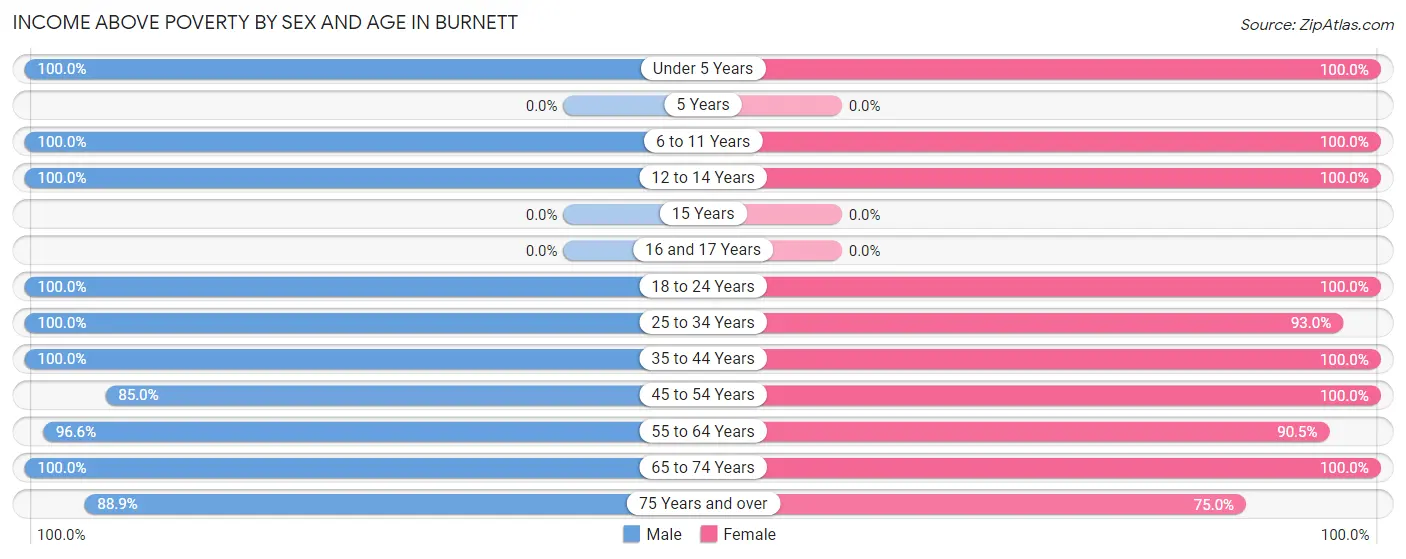
Income Above Poverty by Sex and Age in Burnett
According to the poverty statistics in Burnett, males aged under 5 years and females aged under 5 years are the age groups that are most secure financially, with 100.0% of males and 100.0% of females in these age groups living above the poverty line.
| Age Bracket | Male | Female |
| Under 5 Years | 2 (100.0%) | 2 (100.0%) |
| 5 Years | 0 (0.0%) | 0 (0.0%) |
| 6 to 11 Years | 10 (100.0%) | 2 (100.0%) |
| 12 to 14 Years | 6 (100.0%) | 2 (100.0%) |
| 15 Years | 0 (0.0%) | 0 (0.0%) |
| 16 and 17 Years | 0 (0.0%) | 0 (0.0%) |
| 18 to 24 Years | 7 (100.0%) | 7 (100.0%) |
| 25 to 34 Years | 36 (100.0%) | 40 (93.0%) |
| 35 to 44 Years | 14 (100.0%) | 24 (100.0%) |
| 45 to 54 Years | 17 (85.0%) | 10 (100.0%) |
| 55 to 64 Years | 57 (96.6%) | 19 (90.5%) |
| 65 to 74 Years | 12 (100.0%) | 2 (100.0%) |
| 75 Years and over | 8 (88.9%) | 3 (75.0%) |
| Total | 169 (96.6%) | 111 (94.9%) |
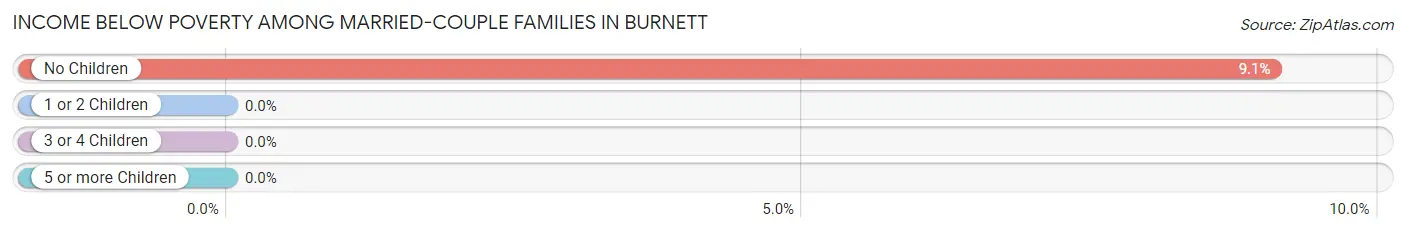
Income Below Poverty Among Married-Couple Families in Burnett
The poverty statistics for married-couple families in Burnett show that 7.5% or 3 of the total 40 families live below the poverty line. Families with no children have the highest poverty rate of 9.1%, comprising of 3 families. On the other hand, families with 1 or 2 children have the lowest poverty rate of 0.0%, which includes 0 families.
| Children | Above Poverty | Below Poverty |
| No Children | 30 (90.9%) | 3 (9.1%) |
| 1 or 2 Children | 4 (100.0%) | 0 (0.0%) |
| 3 or 4 Children | 3 (100.0%) | 0 (0.0%) |
| 5 or more Children | 0 (0.0%) | 0 (0.0%) |
| Total | 37 (92.5%) | 3 (7.5%) |
Income Below Poverty Among Single-Parent Households in Burnett
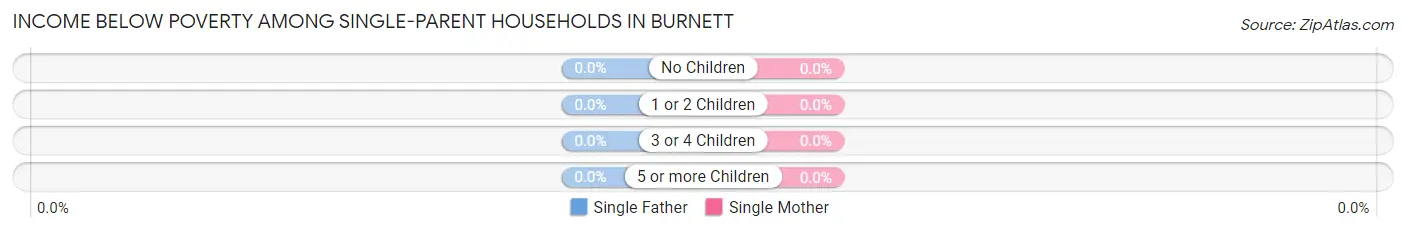
| Children | Single Father | Single Mother |
| No Children | 0 (0.0%) | 0 (0.0%) |
| 1 or 2 Children | 0 (0.0%) | 0 (0.0%) |
| 3 or 4 Children | 0 (0.0%) | 0 (0.0%) |
| 5 or more Children | 0 (0.0%) | 0 (0.0%) |
| Total | 0 (0.0%) | 0 (0.0%) |
Income Below Poverty Among Married-Couple vs Single-Parent Households in Burnett
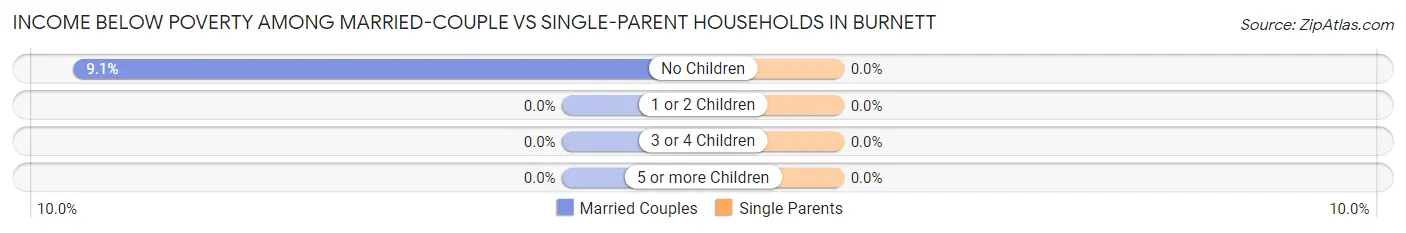
| Children | Married-Couple Families | Single-Parent Households |
| No Children | 3 (9.1%) | 0 (0.0%) |
| 1 or 2 Children | 0 (0.0%) | 0 (0.0%) |
| 3 or 4 Children | 0 (0.0%) | 0 (0.0%) |
| 5 or more Children | 0 (0.0%) | 0 (0.0%) |
| Total | 3 (7.5%) | 0 (0.0%) |
Race in Burnett
The most populous races in Burnett are White / Caucasian (286 | 98.0%), Hispanic or Latino (6 | 2.1%), and Two or more Races (6 | 2.1%).
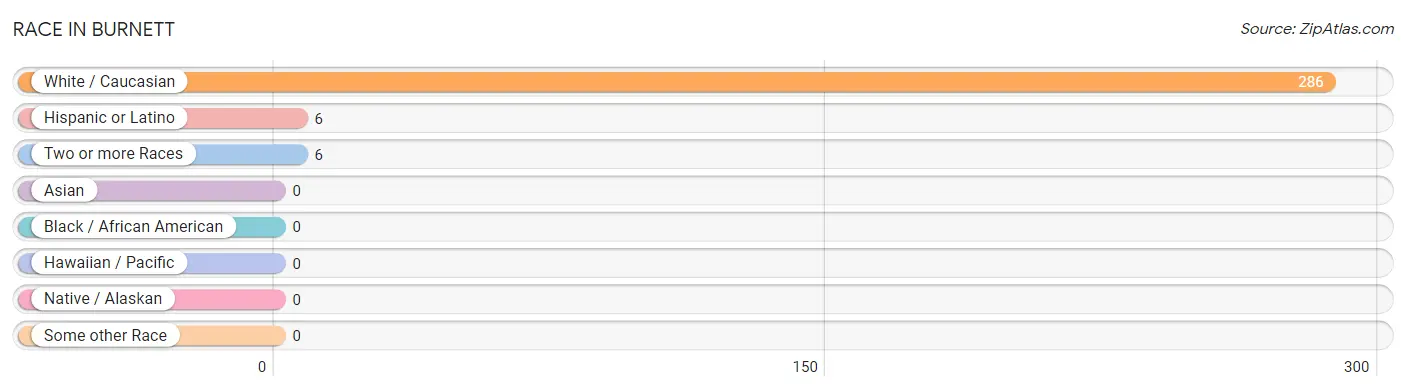
| Race | # Population | % Population |
| Asian | 0 | 0.0% |
| Black / African American | 0 | 0.0% |
| Hawaiian / Pacific | 0 | 0.0% |
| Hispanic or Latino | 6 | 2.1% |
| Native / Alaskan | 0 | 0.0% |
| White / Caucasian | 286 | 98.0% |
| Two or more Races | 6 | 2.1% |
| Some other Race | 0 | 0.0% |
| Total | 292 | 100.0% |
Ancestry in Burnett
The most populous ancestries reported in Burnett are German (183 | 62.7%), English (50 | 17.1%), Irish (41 | 14.0%), American (31 | 10.6%), and Dutch (10 | 3.4%), together accounting for 107.9% of all Burnett residents.
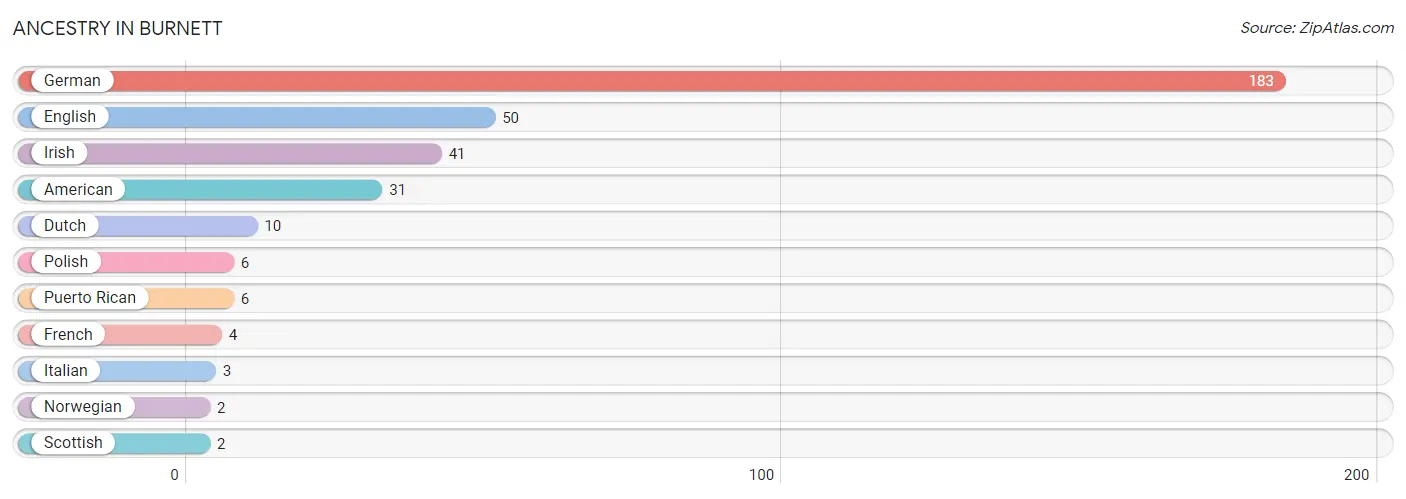
| Ancestry | # Population | % Population |
| American | 31 | 10.6% |
| Dutch | 10 | 3.4% |
| English | 50 | 17.1% |
| French | 4 | 1.4% |
| German | 183 | 62.7% |
| Irish | 41 | 14.0% |
| Italian | 3 | 1.0% |
| Norwegian | 2 | 0.7% |
| Polish | 6 | 2.1% |
| Puerto Rican | 6 | 2.1% |
| Scottish | 2 | 0.7% | View All 11 Rows |
Immigrants in Burnett

| Immigration Origin | # Population | % Population | View All 0 Rows |
Sex and Age in Burnett
Sex and Age in Burnett
The most populous age groups in Burnett are 55 to 59 Years (49 | 28.0%) for men and 25 to 29 Years (37 | 31.6%) for women.
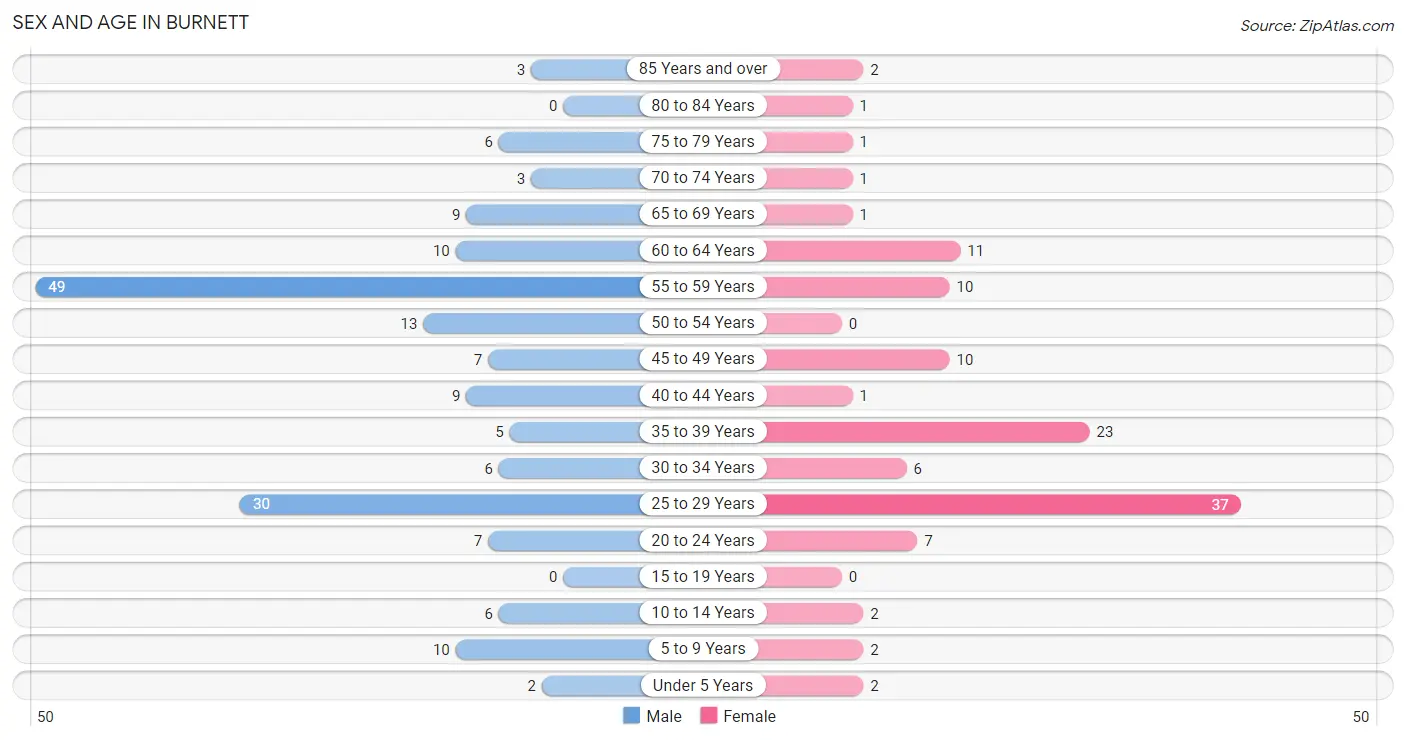
| Age Bracket | Male | Female |
| Under 5 Years | 2 (1.1%) | 2 (1.7%) |
| 5 to 9 Years | 10 (5.7%) | 2 (1.7%) |
| 10 to 14 Years | 6 (3.4%) | 2 (1.7%) |
| 15 to 19 Years | 0 (0.0%) | 0 (0.0%) |
| 20 to 24 Years | 7 (4.0%) | 7 (6.0%) |
| 25 to 29 Years | 30 (17.1%) | 37 (31.6%) |
| 30 to 34 Years | 6 (3.4%) | 6 (5.1%) |
| 35 to 39 Years | 5 (2.9%) | 23 (19.7%) |
| 40 to 44 Years | 9 (5.1%) | 1 (0.9%) |
| 45 to 49 Years | 7 (4.0%) | 10 (8.6%) |
| 50 to 54 Years | 13 (7.4%) | 0 (0.0%) |
| 55 to 59 Years | 49 (28.0%) | 10 (8.6%) |
| 60 to 64 Years | 10 (5.7%) | 11 (9.4%) |
| 65 to 69 Years | 9 (5.1%) | 1 (0.9%) |
| 70 to 74 Years | 3 (1.7%) | 1 (0.9%) |
| 75 to 79 Years | 6 (3.4%) | 1 (0.9%) |
| 80 to 84 Years | 0 (0.0%) | 1 (0.9%) |
| 85 Years and over | 3 (1.7%) | 2 (1.7%) |
| Total | 175 (100.0%) | 117 (100.0%) |
Families and Households in Burnett
Median Family Size in Burnett
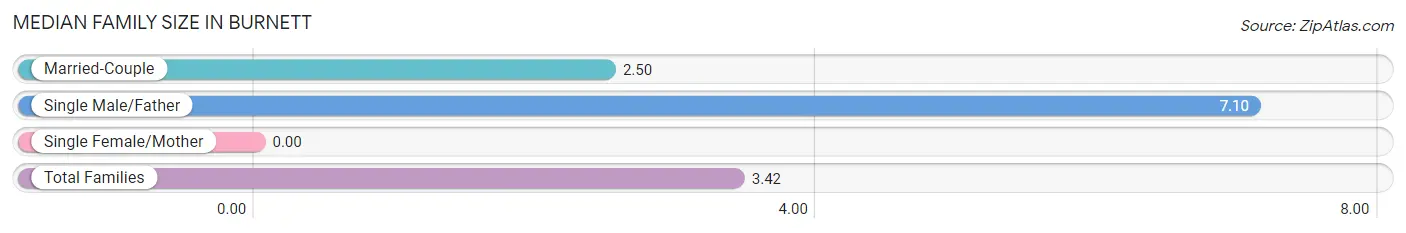
| Family Type | # Families | Family Size |
| Married-Couple | 40 (80.0%) | 2.50 |
| Single Male/Father | 10 (20.0%) | 7.10 |
| Single Female/Mother | 0 (0.0%) | - |
| Total Families | 50 (100.0%) | 3.42 |
Median Household Size in Burnett
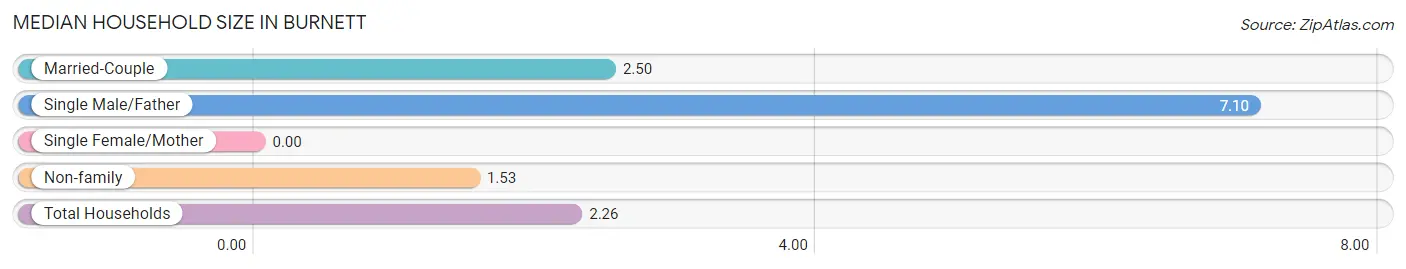
| Household Type | # Households | Household Size |
| Married-Couple | 40 (31.0%) | 2.50 |
| Single Male/Father | 10 (7.7%) | 7.10 |
| Single Female/Mother | 0 (0.0%) | - |
| Non-family | 79 (61.2%) | 1.53 |
| Total Households | 129 (100.0%) | 2.26 |
Household Size by Marriage Status in Burnett
Out of a total of 129 households in Burnett, 50 (38.8%) are family households, while 79 (61.2%) are nonfamily households. The most numerous type of family households are 2-person households, comprising 33, and the most common type of nonfamily households are 1-person households, comprising 44.
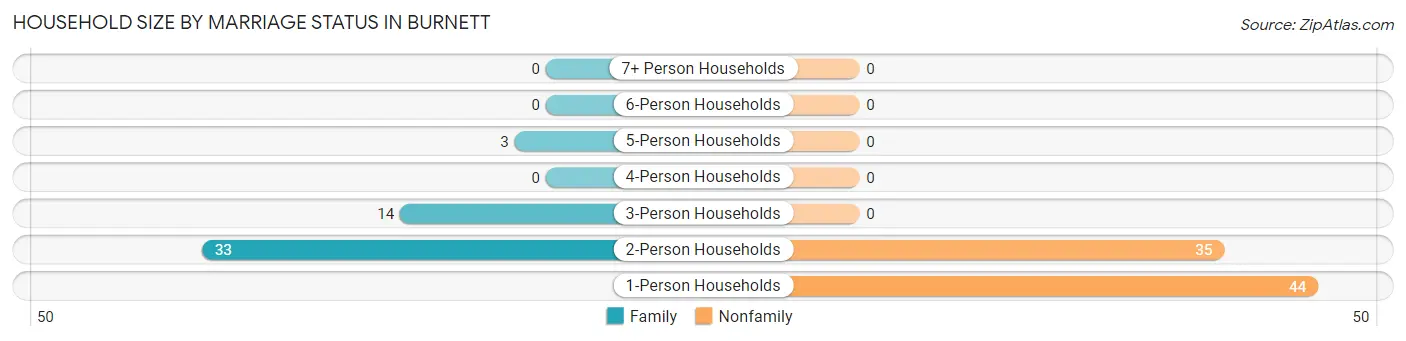
| Household Size | Family Households | Nonfamily Households |
| 1-Person Households | - | 44 (34.1%) |
| 2-Person Households | 33 (25.6%) | 35 (27.1%) |
| 3-Person Households | 14 (10.8%) | 0 (0.0%) |
| 4-Person Households | 0 (0.0%) | 0 (0.0%) |
| 5-Person Households | 3 (2.3%) | 0 (0.0%) |
| 6-Person Households | 0 (0.0%) | 0 (0.0%) |
| 7+ Person Households | 0 (0.0%) | 0 (0.0%) |
| Total | 50 (38.8%) | 79 (61.2%) |
Female Fertility in Burnett
Fertility by Age in Burnett
Average fertility rate in Burnett is 24.0 births per 1,000 women. Women in the age bracket of 20 to 34 years have the highest fertility rate with 40.0 births per 1,000 women. Women in the age bracket of 20 to 34 years acount for 100.0% of all women with births.
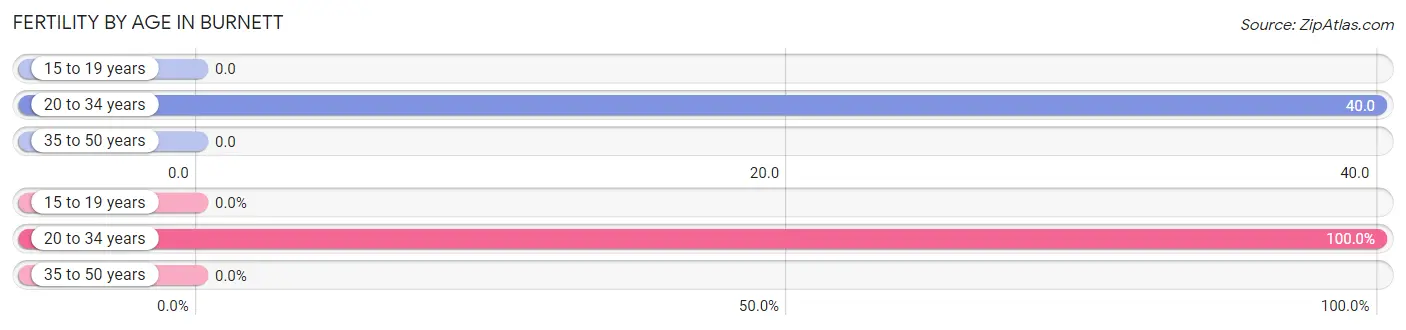
| Age Bracket | Women with Births | Births / 1,000 Women |
| 15 to 19 years | 0 (0.0%) | 0.0 |
| 20 to 34 years | 2 (100.0%) | 40.0 |
| 35 to 50 years | 0 (0.0%) | 0.0 |
| Total | 2 (100.0%) | 24.0 |
Fertility by Age by Marriage Status in Burnett
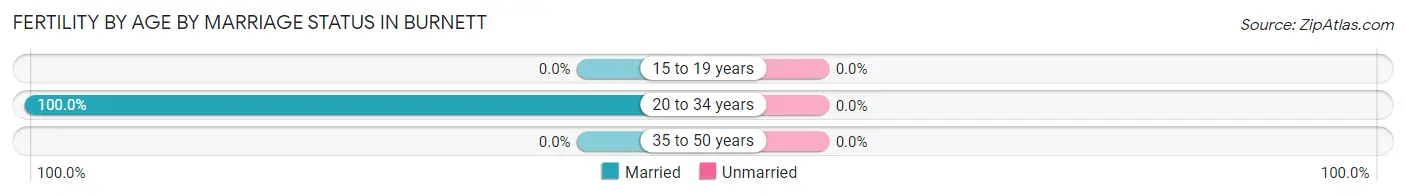
| Age Bracket | Married | Unmarried |
| 15 to 19 years | 0 (0.0%) | 0 (0.0%) |
| 20 to 34 years | 2 (100.0%) | 0 (0.0%) |
| 35 to 50 years | 0 (0.0%) | 0 (0.0%) |
| Total | 2 (100.0%) | 0 (0.0%) |
Fertility by Education in Burnett
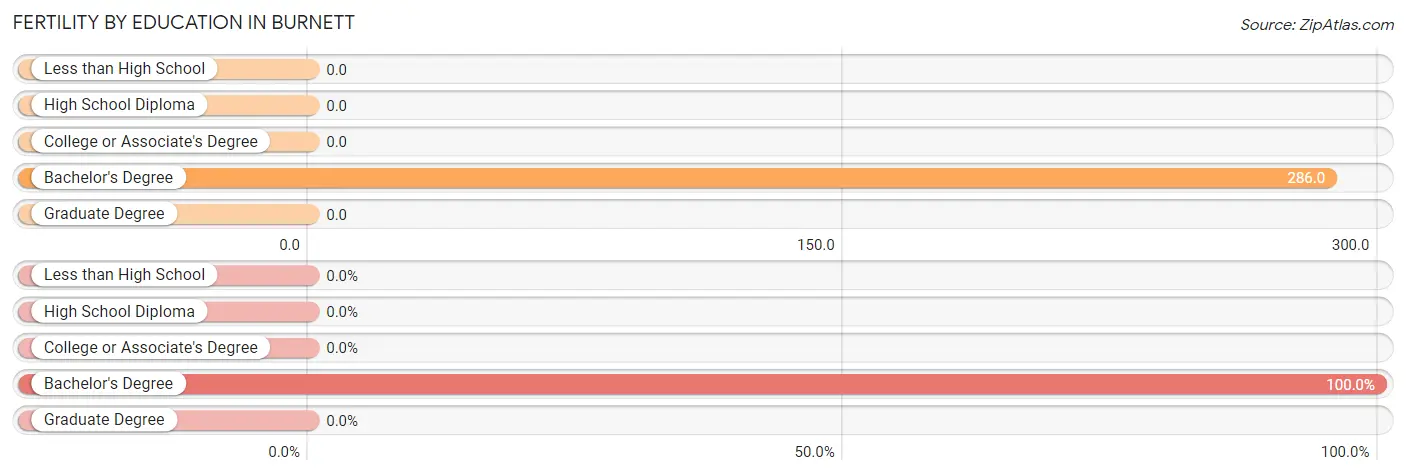
| Educational Attainment | Women with Births | Births / 1,000 Women |
| Less than High School | 0 (0.0%) | 0.0 |
| High School Diploma | 0 (0.0%) | 0.0 |
| College or Associate's Degree | 0 (0.0%) | 0.0 |
| Bachelor's Degree | 2 (100.0%) | 286.0 |
| Graduate Degree | 0 (0.0%) | 0.0 |
| Total | 2 (100.0%) | 24.0 |
Fertility by Education by Marriage Status in Burnett
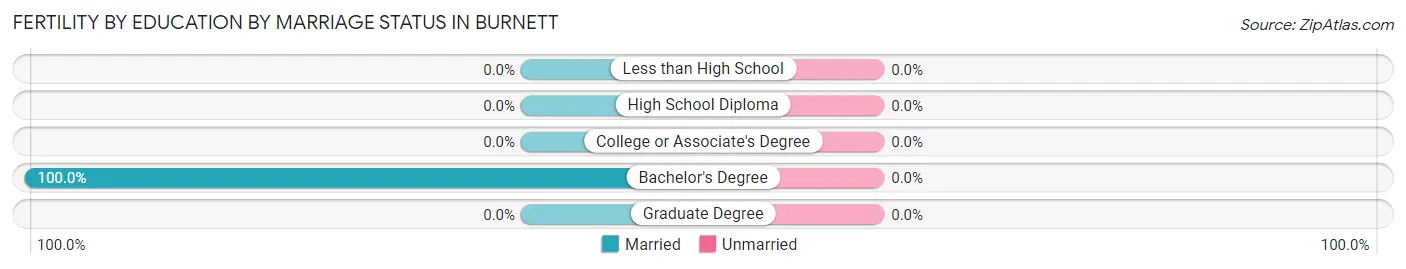
| Educational Attainment | Married | Unmarried |
| Less than High School | 0 (0.0%) | 0 (0.0%) |
| High School Diploma | 0 (0.0%) | 0 (0.0%) |
| College or Associate's Degree | 0 (0.0%) | 0 (0.0%) |
| Bachelor's Degree | 2 (100.0%) | 0 (0.0%) |
| Graduate Degree | 0 (0.0%) | 0 (0.0%) |
| Total | 2 (100.0%) | 0 (0.0%) |
Employment Characteristics in Burnett
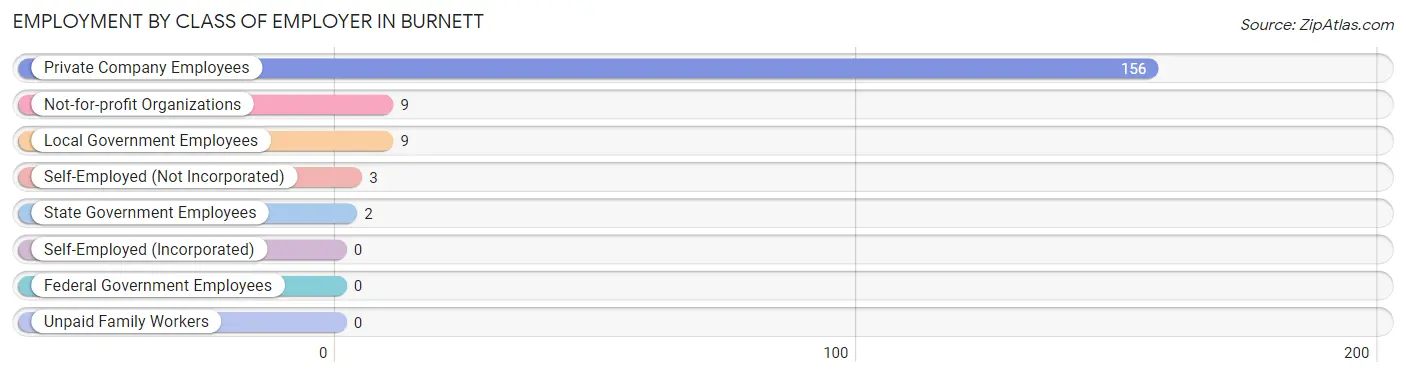
Employment by Class of Employer in Burnett
Among the 179 employed individuals in Burnett, private company employees (156 | 87.2%), not-for-profit organizations (9 | 5.0%), and local government employees (9 | 5.0%) make up the most common classes of employment.
| Employer Class | # Employees | % Employees |
| Private Company Employees | 156 | 87.2% |
| Self-Employed (Incorporated) | 0 | 0.0% |
| Self-Employed (Not Incorporated) | 3 | 1.7% |
| Not-for-profit Organizations | 9 | 5.0% |
| Local Government Employees | 9 | 5.0% |
| State Government Employees | 2 | 1.1% |
| Federal Government Employees | 0 | 0.0% |
| Unpaid Family Workers | 0 | 0.0% |
| Total | 179 | 100.0% |
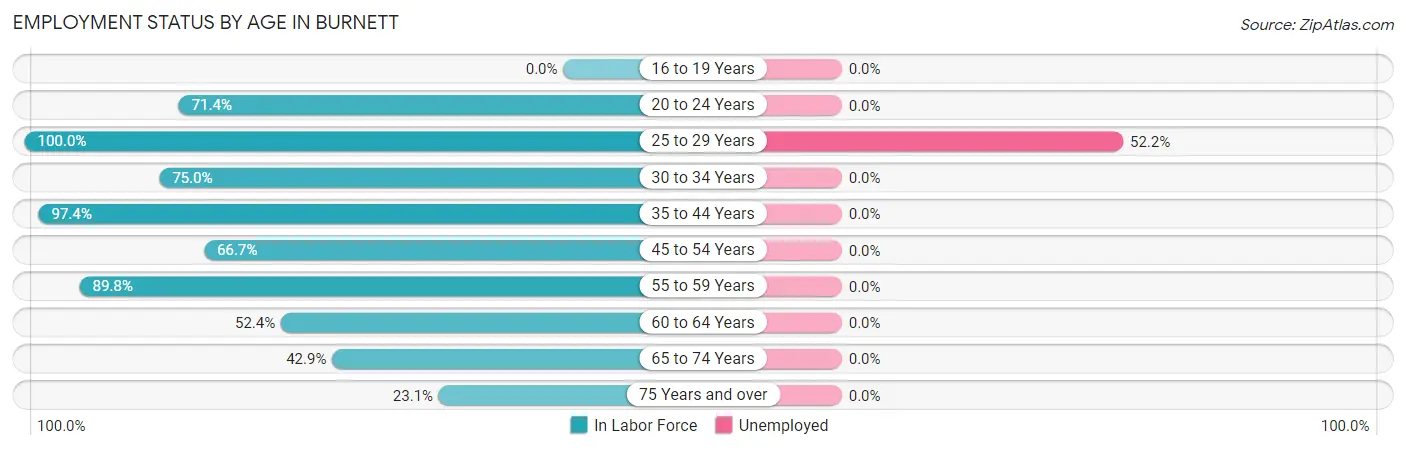
Employment Status by Age in Burnett
According to the labor force statistics for Burnett, out of the total population over 16 years of age (268), 80.6% or 216 individuals are in the labor force, with 16.2% or 35 of them unemployed. The age group with the highest labor force participation rate is 25 to 29 years, with 100.0% or 67 individuals in the labor force. Within the labor force, the 25 to 29 years age range has the highest percentage of unemployed individuals, with 52.2% or 35 of them being unemployed.
| Age Bracket | In Labor Force | Unemployed |
| 16 to 19 Years | 0 (0.0%) | 0 (0.0%) |
| 20 to 24 Years | 10 (71.4%) | 0 (0.0%) |
| 25 to 29 Years | 67 (100.0%) | 35 (52.2%) |
| 30 to 34 Years | 9 (75.0%) | 0 (0.0%) |
| 35 to 44 Years | 37 (97.4%) | 0 (0.0%) |
| 45 to 54 Years | 20 (66.7%) | 0 (0.0%) |
| 55 to 59 Years | 53 (89.8%) | 0 (0.0%) |
| 60 to 64 Years | 11 (52.4%) | 0 (0.0%) |
| 65 to 74 Years | 6 (42.9%) | 0 (0.0%) |
| 75 Years and over | 3 (23.1%) | 0 (0.0%) |
| Total | 216 (80.6%) | 35 (16.2%) |
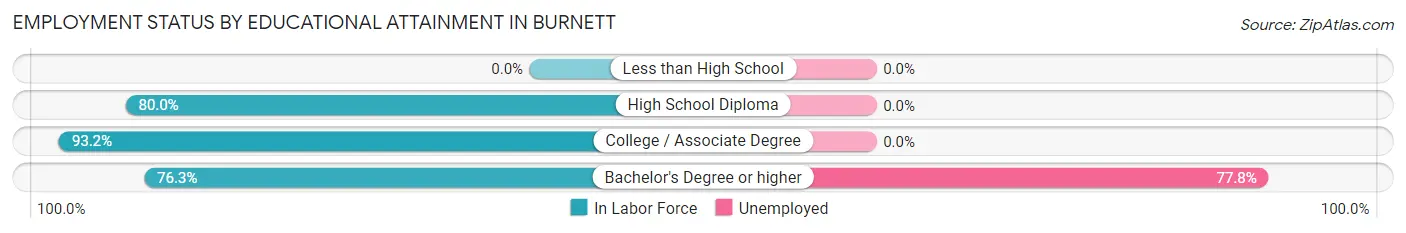
Employment Status by Educational Attainment in Burnett
According to labor force statistics for Burnett, 86.8% of individuals (197) out of the total population between 25 and 64 years of age (227) are in the labor force, with 17.8% or 35 of them being unemployed. The group with the highest labor force participation rate are those with the educational attainment of college / associate degree, with 93.2% or 124 individuals in the labor force. Within the labor force, individuals with bachelor's degree or higher education have the highest percentage of unemployment, with 77.8% or 35 of them being unemployed.
| Educational Attainment | In Labor Force | Unemployed |
| Less than High School | 0 (0.0%) | 0 (0.0%) |
| High School Diploma | 28 (80.0%) | 0 (0.0%) |
| College / Associate Degree | 124 (93.2%) | 0 (0.0%) |
| Bachelor's Degree or higher | 45 (76.3%) | 46 (77.8%) |
| Total | 197 (86.8%) | 40 (17.8%) |
Employment Occupations by Sex in Burnett
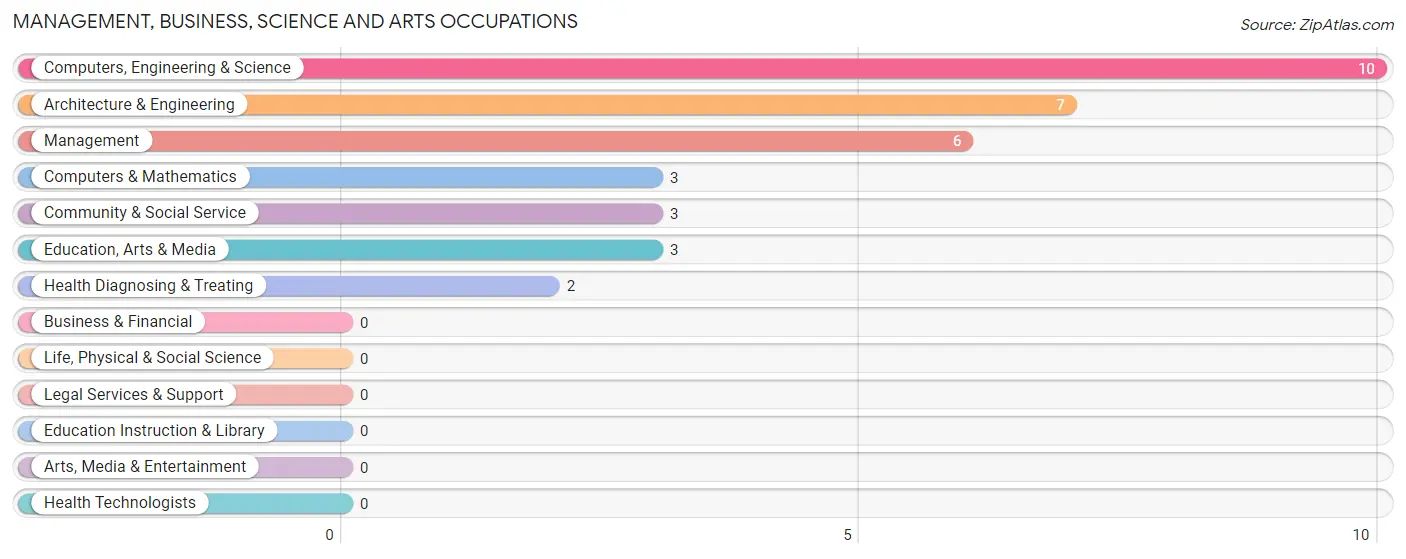
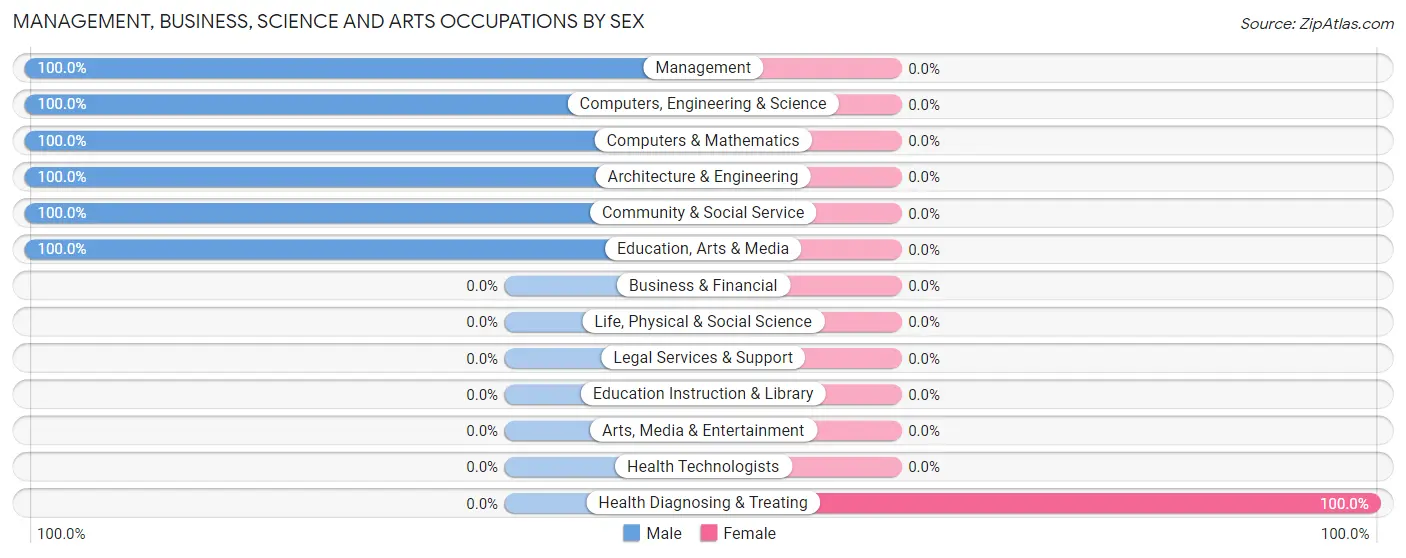
Management, Business, Science and Arts Occupations
The most common Management, Business, Science and Arts occupations in Burnett are Computers, Engineering & Science (10 | 5.5%), Architecture & Engineering (7 | 3.9%), Management (6 | 3.3%), Computers & Mathematics (3 | 1.7%), and Community & Social Service (3 | 1.7%).
Management, Business, Science and Arts Occupations by Sex
| Occupation | Male | Female |
| Management | 6 (100.0%) | 0 (0.0%) |
| Business & Financial | 0 (0.0%) | 0 (0.0%) |
| Computers, Engineering & Science | 10 (100.0%) | 0 (0.0%) |
| Computers & Mathematics | 3 (100.0%) | 0 (0.0%) |
| Architecture & Engineering | 7 (100.0%) | 0 (0.0%) |
| Life, Physical & Social Science | 0 (0.0%) | 0 (0.0%) |
| Community & Social Service | 3 (100.0%) | 0 (0.0%) |
| Education, Arts & Media | 3 (100.0%) | 0 (0.0%) |
| Legal Services & Support | 0 (0.0%) | 0 (0.0%) |
| Education Instruction & Library | 0 (0.0%) | 0 (0.0%) |
| Arts, Media & Entertainment | 0 (0.0%) | 0 (0.0%) |
| Health Diagnosing & Treating | 0 (0.0%) | 2 (100.0%) |
| Health Technologists | 0 (0.0%) | 0 (0.0%) |
| Total (Category) | 19 (90.5%) | 2 (9.5%) |
| Total (Overall) | 133 (73.5%) | 48 (26.5%) |
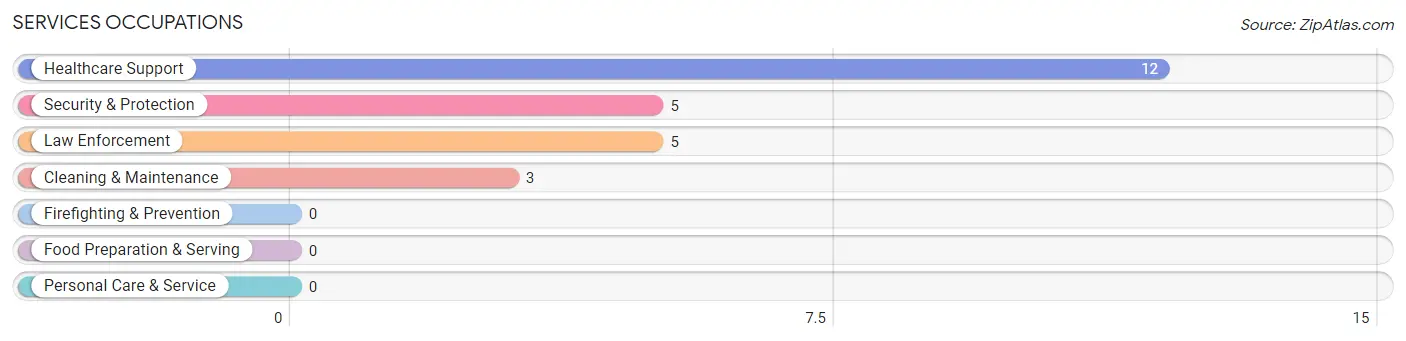
Services Occupations
The most common Services occupations in Burnett are Healthcare Support (12 | 6.6%), Security & Protection (5 | 2.8%), Law Enforcement (5 | 2.8%), and Cleaning & Maintenance (3 | 1.7%).
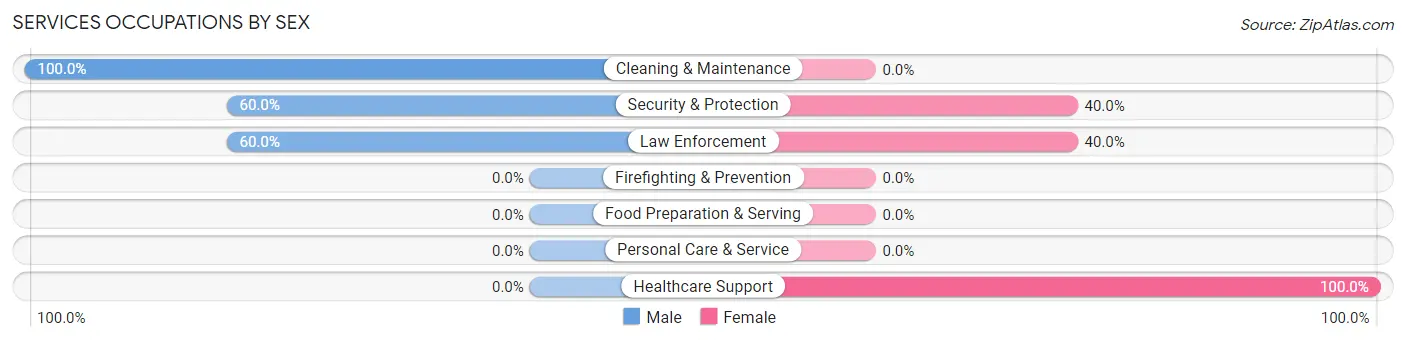
Services Occupations by Sex
Within the Services occupations in Burnett, the most male-oriented occupations are Cleaning & Maintenance (100.0%), Security & Protection (60.0%), and Law Enforcement (60.0%), while the most female-oriented occupations are Healthcare Support (100.0%), Security & Protection (40.0%), and Law Enforcement (40.0%).
| Occupation | Male | Female |
| Healthcare Support | 0 (0.0%) | 12 (100.0%) |
| Security & Protection | 3 (60.0%) | 2 (40.0%) |
| Firefighting & Prevention | 0 (0.0%) | 0 (0.0%) |
| Law Enforcement | 3 (60.0%) | 2 (40.0%) |
| Food Preparation & Serving | 0 (0.0%) | 0 (0.0%) |
| Cleaning & Maintenance | 3 (100.0%) | 0 (0.0%) |
| Personal Care & Service | 0 (0.0%) | 0 (0.0%) |
| Total (Category) | 6 (30.0%) | 14 (70.0%) |
| Total (Overall) | 133 (73.5%) | 48 (26.5%) |
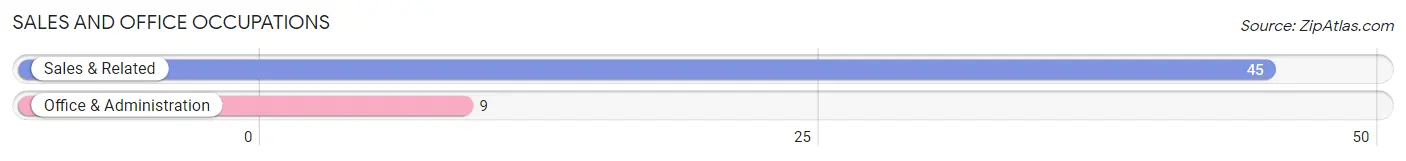
Sales and Office Occupations
The most common Sales and Office occupations in Burnett are Sales & Related (45 | 24.9%), and Office & Administration (9 | 5.0%).
Sales and Office Occupations by Sex
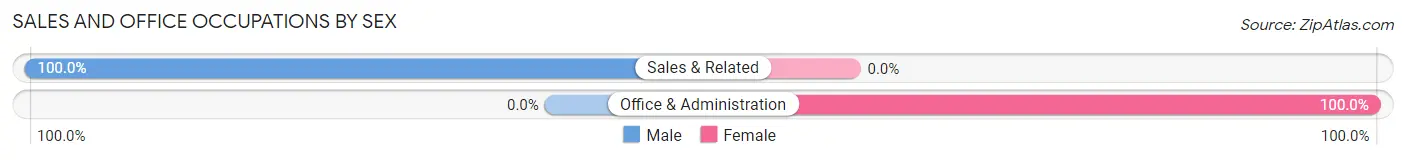
| Occupation | Male | Female |
| Sales & Related | 45 (100.0%) | 0 (0.0%) |
| Office & Administration | 0 (0.0%) | 9 (100.0%) |
| Total (Category) | 45 (83.3%) | 9 (16.7%) |
| Total (Overall) | 133 (73.5%) | 48 (26.5%) |
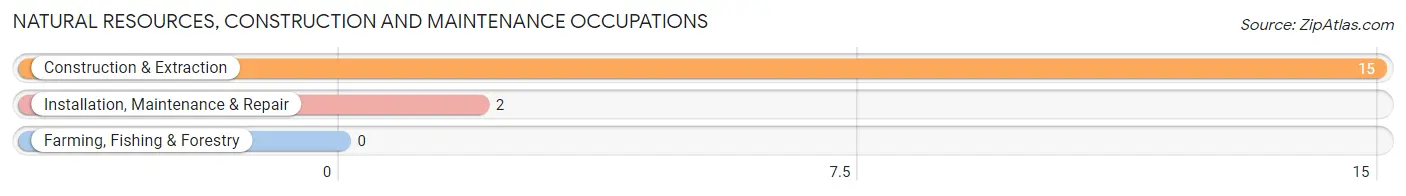
Natural Resources, Construction and Maintenance Occupations
The most common Natural Resources, Construction and Maintenance occupations in Burnett are Construction & Extraction (15 | 8.3%), and Installation, Maintenance & Repair (2 | 1.1%).
Natural Resources, Construction and Maintenance Occupations by Sex
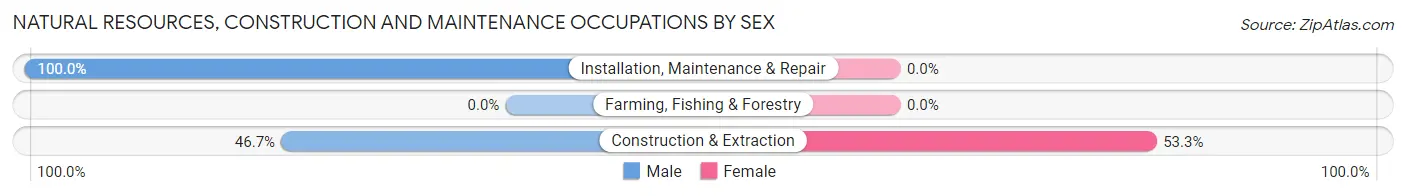
| Occupation | Male | Female |
| Farming, Fishing & Forestry | 0 (0.0%) | 0 (0.0%) |
| Construction & Extraction | 7 (46.7%) | 8 (53.3%) |
| Installation, Maintenance & Repair | 2 (100.0%) | 0 (0.0%) |
| Total (Category) | 9 (52.9%) | 8 (47.1%) |
| Total (Overall) | 133 (73.5%) | 48 (26.5%) |
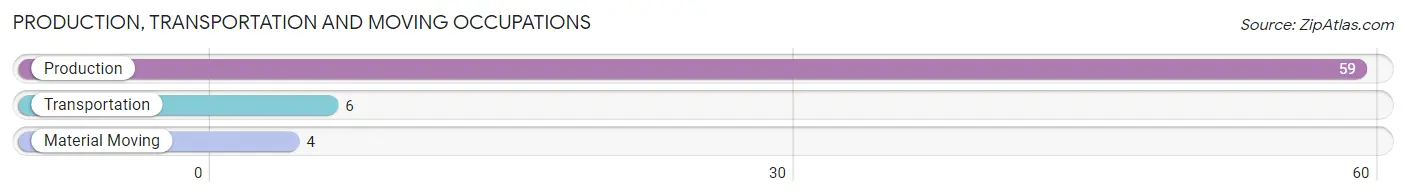
Production, Transportation and Moving Occupations
The most common Production, Transportation and Moving occupations in Burnett are Production (59 | 32.6%), Transportation (6 | 3.3%), and Material Moving (4 | 2.2%).
Production, Transportation and Moving Occupations by Sex
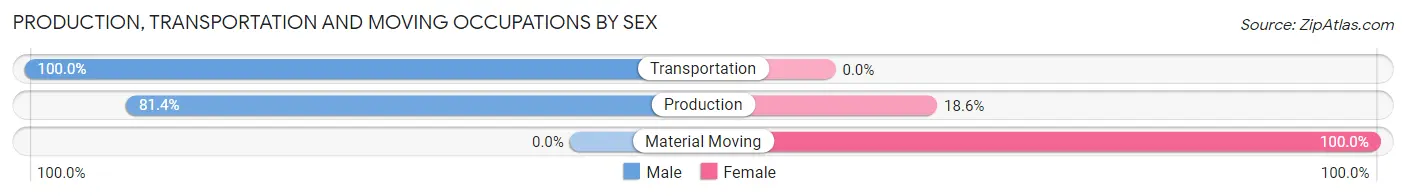
| Occupation | Male | Female |
| Production | 48 (81.4%) | 11 (18.6%) |
| Transportation | 6 (100.0%) | 0 (0.0%) |
| Material Moving | 0 (0.0%) | 4 (100.0%) |
| Total (Category) | 54 (78.3%) | 15 (21.7%) |
| Total (Overall) | 133 (73.5%) | 48 (26.5%) |
Employment Industries by Sex in Burnett
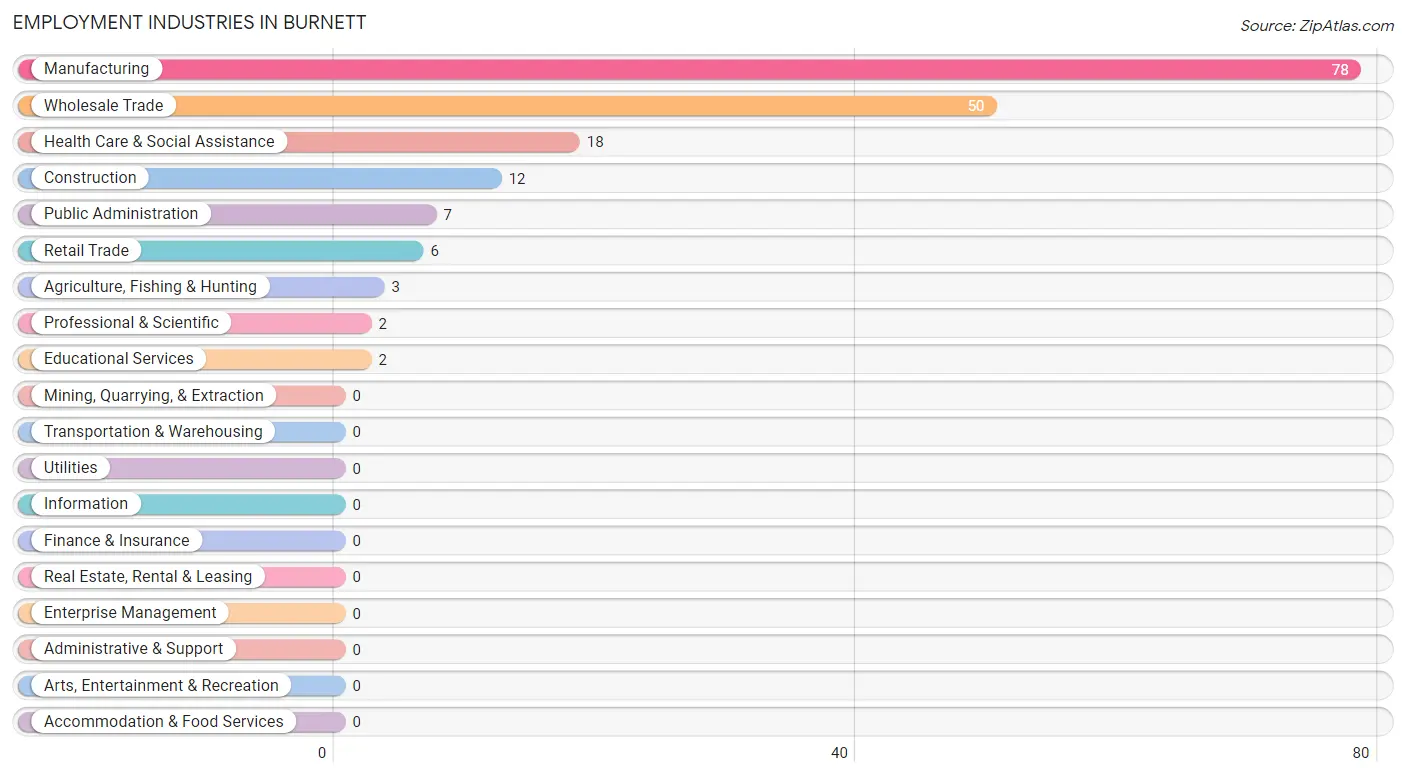
Employment Industries in Burnett
The major employment industries in Burnett include Manufacturing (78 | 43.1%), Wholesale Trade (50 | 27.6%), Health Care & Social Assistance (18 | 9.9%), Construction (12 | 6.6%), and Public Administration (7 | 3.9%).
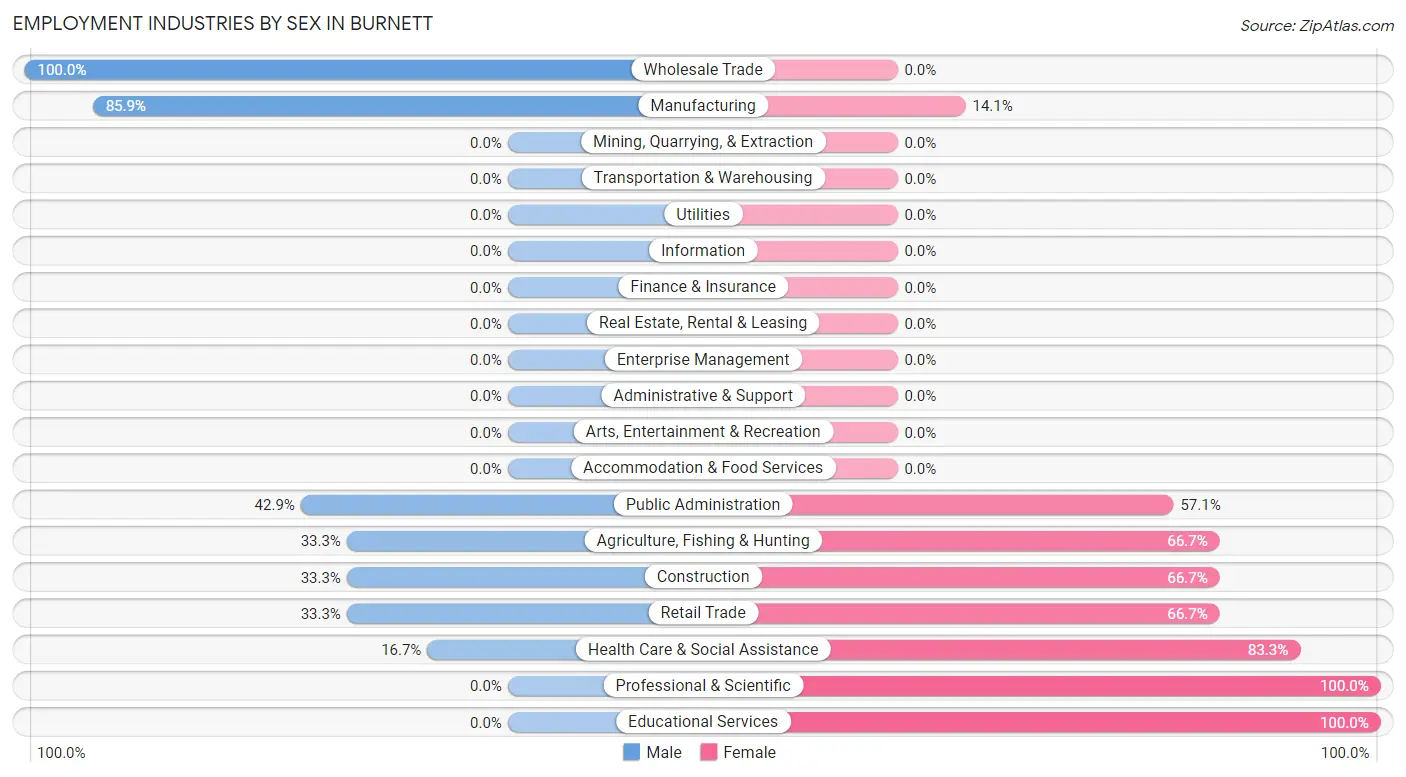
Employment Industries by Sex in Burnett
The Burnett industries that see more men than women are Wholesale Trade (100.0%), Manufacturing (85.9%), and Public Administration (42.9%), whereas the industries that tend to have a higher number of women are Professional & Scientific (100.0%), Educational Services (100.0%), and Health Care & Social Assistance (83.3%).
| Industry | Male | Female |
| Agriculture, Fishing & Hunting | 1 (33.3%) | 2 (66.7%) |
| Mining, Quarrying, & Extraction | 0 (0.0%) | 0 (0.0%) |
| Construction | 4 (33.3%) | 8 (66.7%) |
| Manufacturing | 67 (85.9%) | 11 (14.1%) |
| Wholesale Trade | 50 (100.0%) | 0 (0.0%) |
| Retail Trade | 2 (33.3%) | 4 (66.7%) |
| Transportation & Warehousing | 0 (0.0%) | 0 (0.0%) |
| Utilities | 0 (0.0%) | 0 (0.0%) |
| Information | 0 (0.0%) | 0 (0.0%) |
| Finance & Insurance | 0 (0.0%) | 0 (0.0%) |
| Real Estate, Rental & Leasing | 0 (0.0%) | 0 (0.0%) |
| Professional & Scientific | 0 (0.0%) | 2 (100.0%) |
| Enterprise Management | 0 (0.0%) | 0 (0.0%) |
| Administrative & Support | 0 (0.0%) | 0 (0.0%) |
| Educational Services | 0 (0.0%) | 2 (100.0%) |
| Health Care & Social Assistance | 3 (16.7%) | 15 (83.3%) |
| Arts, Entertainment & Recreation | 0 (0.0%) | 0 (0.0%) |
| Accommodation & Food Services | 0 (0.0%) | 0 (0.0%) |
| Public Administration | 3 (42.9%) | 4 (57.1%) |
| Total | 133 (73.5%) | 48 (26.5%) |
Education in Burnett
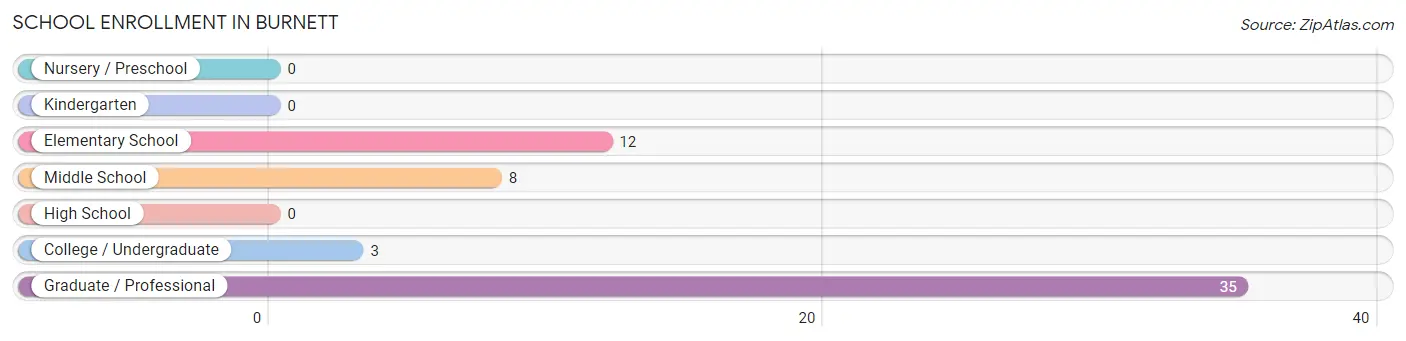
School Enrollment in Burnett
The most common levels of schooling among the 58 students in Burnett are graduate / professional (35 | 60.3%), elementary school (12 | 20.7%), and middle school (8 | 13.8%).
| School Level | # Students | % Students |
| Nursery / Preschool | 0 | 0.0% |
| Kindergarten | 0 | 0.0% |
| Elementary School | 12 | 20.7% |
| Middle School | 8 | 13.8% |
| High School | 0 | 0.0% |
| College / Undergraduate | 3 | 5.2% |
| Graduate / Professional | 35 | 60.3% |
| Total | 58 | 100.0% |
School Enrollment by Age by Funding Source in Burnett
Out of a total of 58 students who are enrolled in schools in Burnett, 37 (63.8%) attend a private institution, while the remaining 21 (36.2%) are enrolled in public schools. The age group of 25 to 34 year olds has the highest likelihood of being enrolled in private schools, with 35 (92.1% in the age bracket) enrolled. Conversely, the age group of 5 to 9 year old has the lowest likelihood of being enrolled in a private school, with 12 (100.0% in the age bracket) attending a public institution.
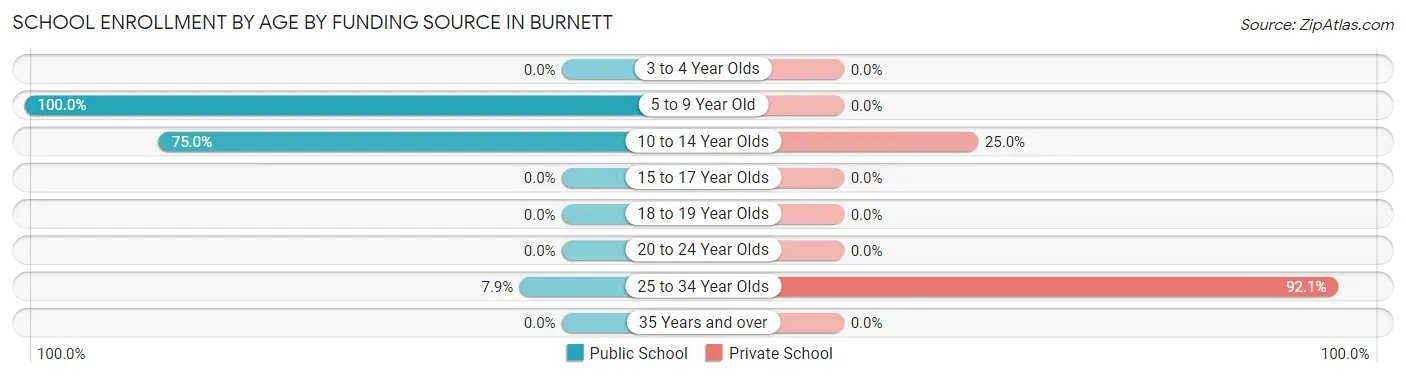
| Age Bracket | Public School | Private School |
| 3 to 4 Year Olds | 0 (0.0%) | 0 (0.0%) |
| 5 to 9 Year Old | 12 (100.0%) | 0 (0.0%) |
| 10 to 14 Year Olds | 6 (75.0%) | 2 (25.0%) |
| 15 to 17 Year Olds | 0 (0.0%) | 0 (0.0%) |
| 18 to 19 Year Olds | 0 (0.0%) | 0 (0.0%) |
| 20 to 24 Year Olds | 0 (0.0%) | 0 (0.0%) |
| 25 to 34 Year Olds | 3 (7.9%) | 35 (92.1%) |
| 35 Years and over | 0 (0.0%) | 0 (0.0%) |
| Total | 21 (36.2%) | 37 (63.8%) |
Educational Attainment by Field of Study in Burnett
Bio, nature & agricultural (35 | 56.5%), arts & humanities (8 | 12.9%), engineering (7 | 11.3%), business (4 | 6.5%), and social sciences (3 | 4.8%) are the most common fields of study among 62 individuals in Burnett who have obtained a bachelor's degree or higher.
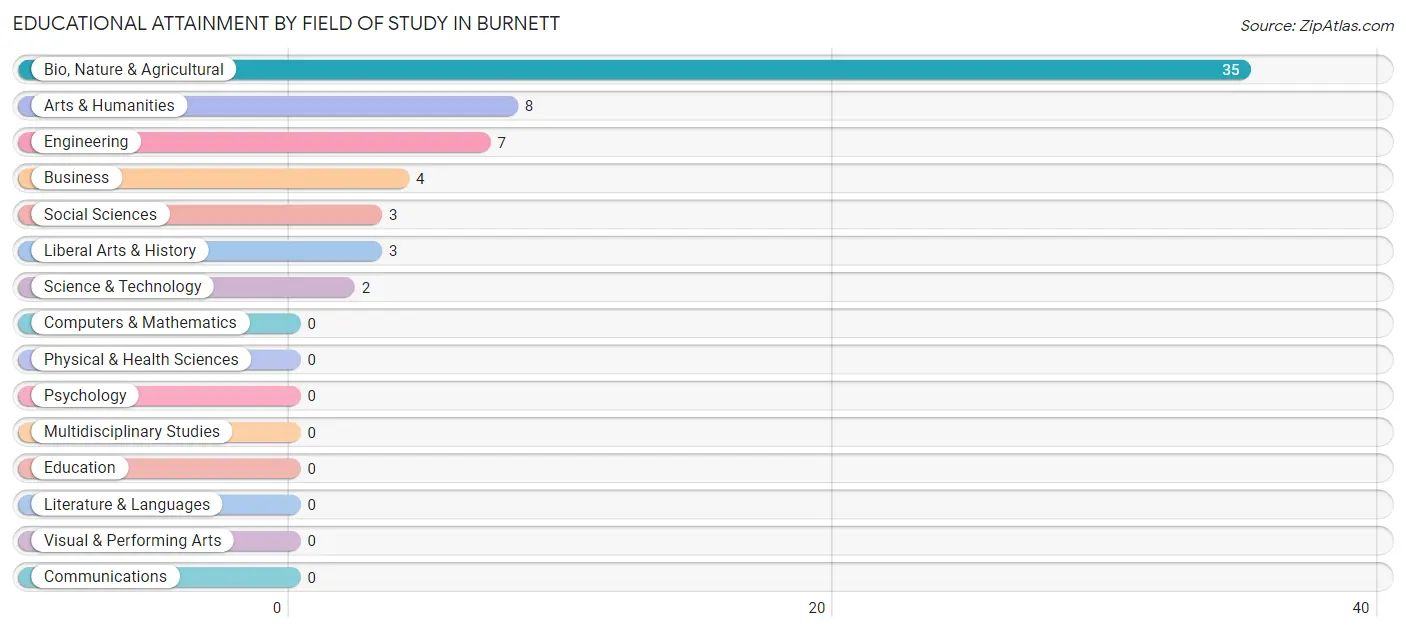
| Field of Study | # Graduates | % Graduates |
| Computers & Mathematics | 0 | 0.0% |
| Bio, Nature & Agricultural | 35 | 56.5% |
| Physical & Health Sciences | 0 | 0.0% |
| Psychology | 0 | 0.0% |
| Social Sciences | 3 | 4.8% |
| Engineering | 7 | 11.3% |
| Multidisciplinary Studies | 0 | 0.0% |
| Science & Technology | 2 | 3.2% |
| Business | 4 | 6.5% |
| Education | 0 | 0.0% |
| Literature & Languages | 0 | 0.0% |
| Liberal Arts & History | 3 | 4.8% |
| Visual & Performing Arts | 0 | 0.0% |
| Communications | 0 | 0.0% |
| Arts & Humanities | 8 | 12.9% |
| Total | 62 | 100.0% |
Transportation & Commute in Burnett
Vehicle Availability by Sex in Burnett
The most prevalent vehicle ownership categories in Burnett are males with no vehicle (46, accounting for 35.1%) and females with no vehicle (0, making up 95.8%).
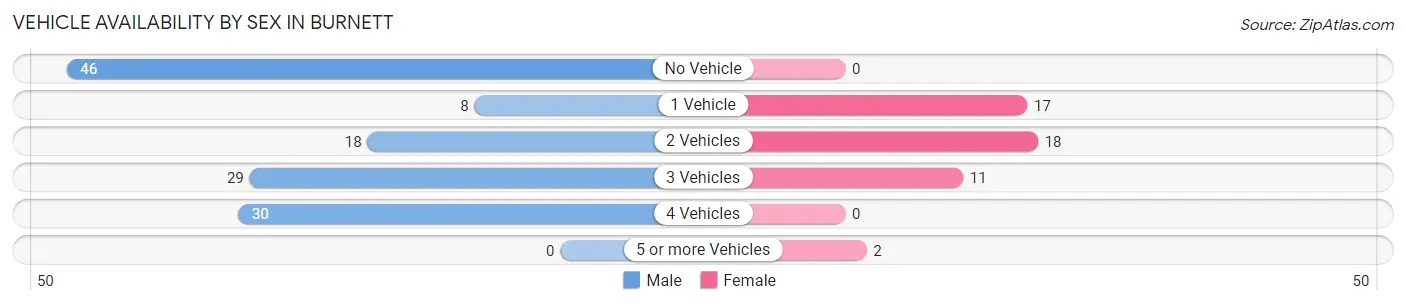
| Vehicles Available | Male | Female |
| No Vehicle | 46 (35.1%) | 0 (0.0%) |
| 1 Vehicle | 8 (6.1%) | 17 (35.4%) |
| 2 Vehicles | 18 (13.7%) | 18 (37.5%) |
| 3 Vehicles | 29 (22.1%) | 11 (22.9%) |
| 4 Vehicles | 30 (22.9%) | 0 (0.0%) |
| 5 or more Vehicles | 0 (0.0%) | 2 (4.2%) |
| Total | 131 (100.0%) | 48 (100.0%) |
Commute Time in Burnett
The most frequently occuring commute durations in Burnett are 5 to 9 minutes (55 commuters, 30.7%), 15 to 19 minutes (43 commuters, 24.0%), and 20 to 24 minutes (42 commuters, 23.5%).
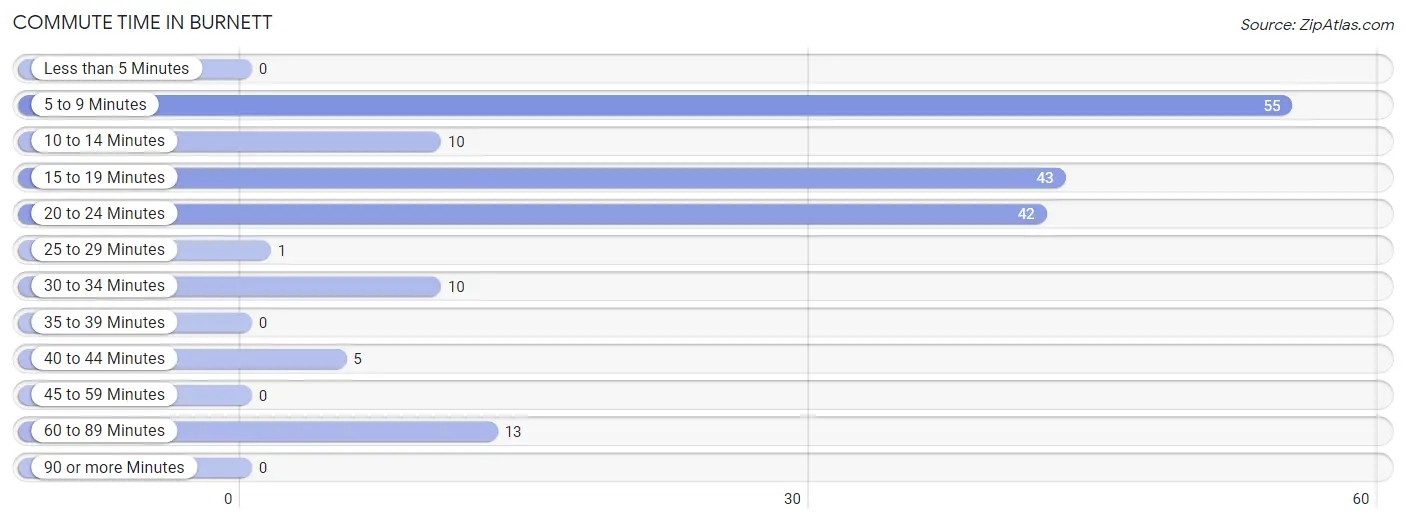
| Commute Time | # Commuters | % Commuters |
| Less than 5 Minutes | 0 | 0.0% |
| 5 to 9 Minutes | 55 | 30.7% |
| 10 to 14 Minutes | 10 | 5.6% |
| 15 to 19 Minutes | 43 | 24.0% |
| 20 to 24 Minutes | 42 | 23.5% |
| 25 to 29 Minutes | 1 | 0.6% |
| 30 to 34 Minutes | 10 | 5.6% |
| 35 to 39 Minutes | 0 | 0.0% |
| 40 to 44 Minutes | 5 | 2.8% |
| 45 to 59 Minutes | 0 | 0.0% |
| 60 to 89 Minutes | 13 | 7.3% |
| 90 or more Minutes | 0 | 0.0% |
Commute Time by Sex in Burnett
The most common commute times in Burnett are 5 to 9 minutes (55 commuters, 42.0%) for males and 15 to 19 minutes (21 commuters, 43.8%) for females.
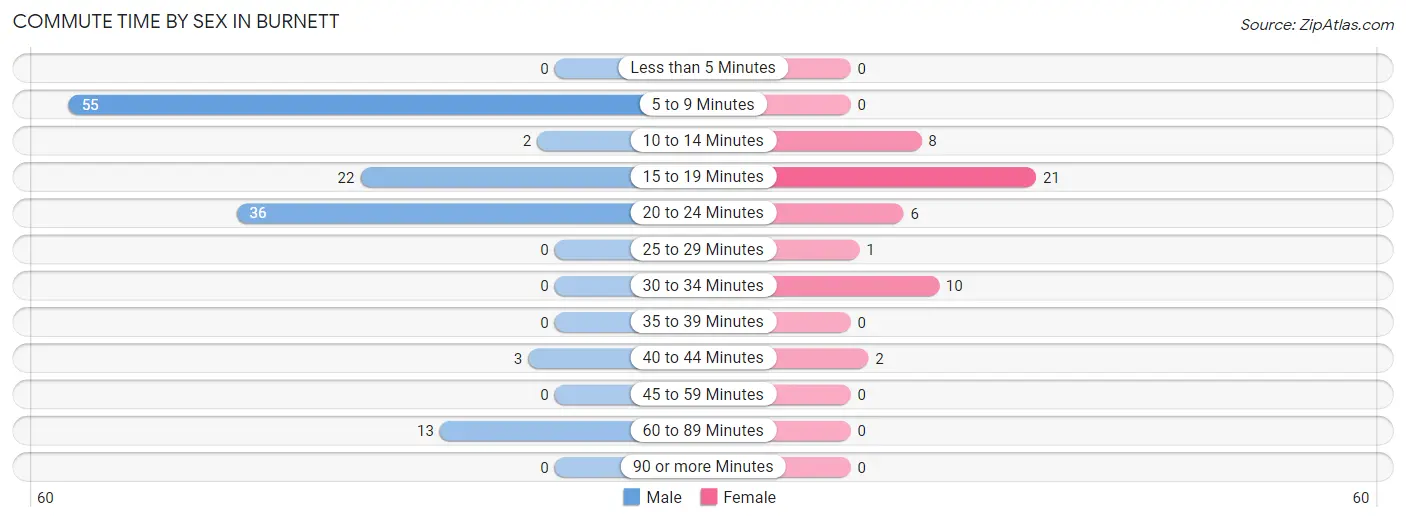
| Commute Time | Male | Female |
| Less than 5 Minutes | 0 (0.0%) | 0 (0.0%) |
| 5 to 9 Minutes | 55 (42.0%) | 0 (0.0%) |
| 10 to 14 Minutes | 2 (1.5%) | 8 (16.7%) |
| 15 to 19 Minutes | 22 (16.8%) | 21 (43.8%) |
| 20 to 24 Minutes | 36 (27.5%) | 6 (12.5%) |
| 25 to 29 Minutes | 0 (0.0%) | 1 (2.1%) |
| 30 to 34 Minutes | 0 (0.0%) | 10 (20.8%) |
| 35 to 39 Minutes | 0 (0.0%) | 0 (0.0%) |
| 40 to 44 Minutes | 3 (2.3%) | 2 (4.2%) |
| 45 to 59 Minutes | 0 (0.0%) | 0 (0.0%) |
| 60 to 89 Minutes | 13 (9.9%) | 0 (0.0%) |
| 90 or more Minutes | 0 (0.0%) | 0 (0.0%) |
Time of Departure to Work by Sex in Burnett
The most frequent times of departure to work in Burnett are 8:30 AM to 8:59 AM (48, 36.6%) for males and 6:00 AM to 6:29 AM (8, 16.7%) for females.
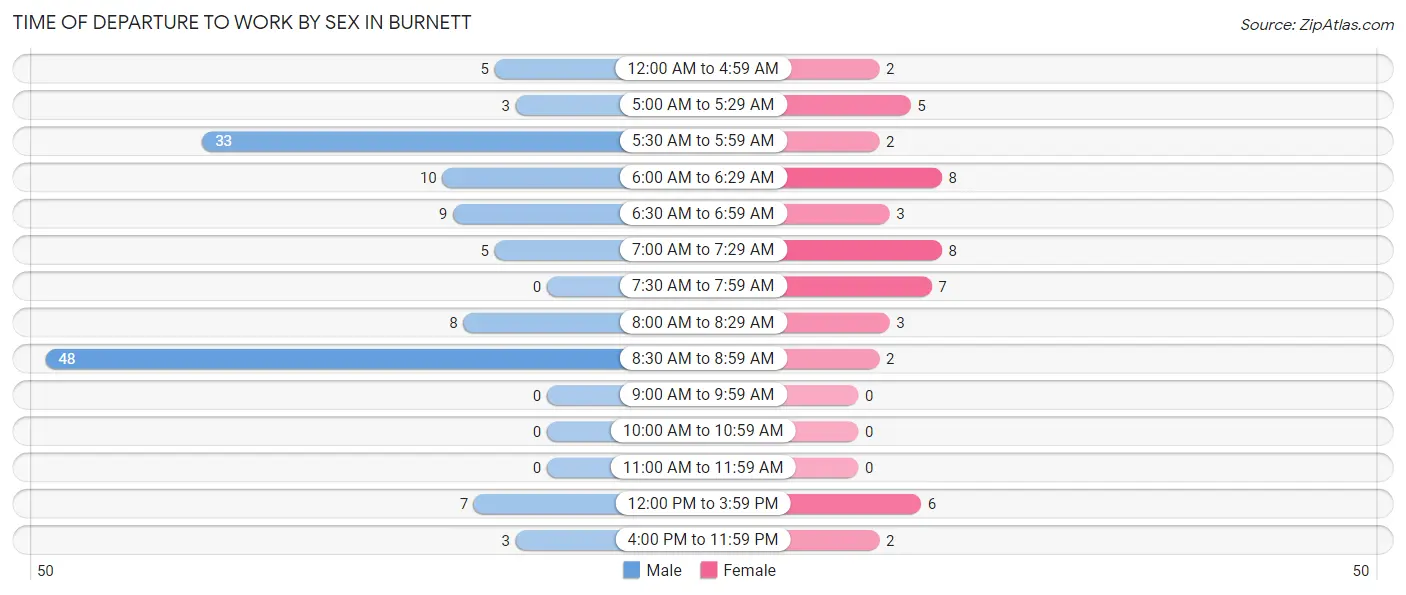
| Time of Departure | Male | Female |
| 12:00 AM to 4:59 AM | 5 (3.8%) | 2 (4.2%) |
| 5:00 AM to 5:29 AM | 3 (2.3%) | 5 (10.4%) |
| 5:30 AM to 5:59 AM | 33 (25.2%) | 2 (4.2%) |
| 6:00 AM to 6:29 AM | 10 (7.6%) | 8 (16.7%) |
| 6:30 AM to 6:59 AM | 9 (6.9%) | 3 (6.2%) |
| 7:00 AM to 7:29 AM | 5 (3.8%) | 8 (16.7%) |
| 7:30 AM to 7:59 AM | 0 (0.0%) | 7 (14.6%) |
| 8:00 AM to 8:29 AM | 8 (6.1%) | 3 (6.2%) |
| 8:30 AM to 8:59 AM | 48 (36.6%) | 2 (4.2%) |
| 9:00 AM to 9:59 AM | 0 (0.0%) | 0 (0.0%) |
| 10:00 AM to 10:59 AM | 0 (0.0%) | 0 (0.0%) |
| 11:00 AM to 11:59 AM | 0 (0.0%) | 0 (0.0%) |
| 12:00 PM to 3:59 PM | 7 (5.3%) | 6 (12.5%) |
| 4:00 PM to 11:59 PM | 3 (2.3%) | 2 (4.2%) |
| Total | 131 (100.0%) | 48 (100.0%) |
Housing Occupancy in Burnett
Occupancy by Ownership in Burnett
Of the total 129 dwellings in Burnett, owner-occupied units account for 97 (75.2%), while renter-occupied units make up 32 (24.8%).
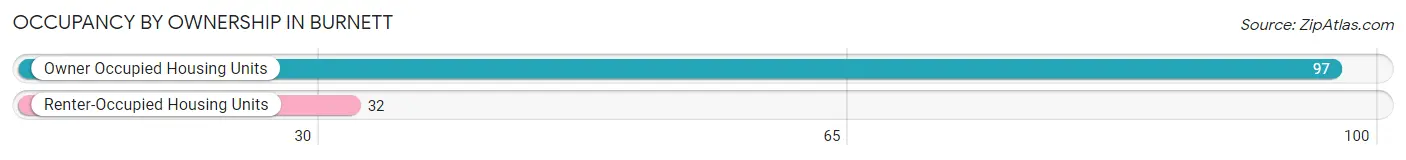
| Occupancy | # Housing Units | % Housing Units |
| Owner Occupied Housing Units | 97 | 75.2% |
| Renter-Occupied Housing Units | 32 | 24.8% |
| Total Occupied Housing Units | 129 | 100.0% |
Occupancy by Household Size in Burnett
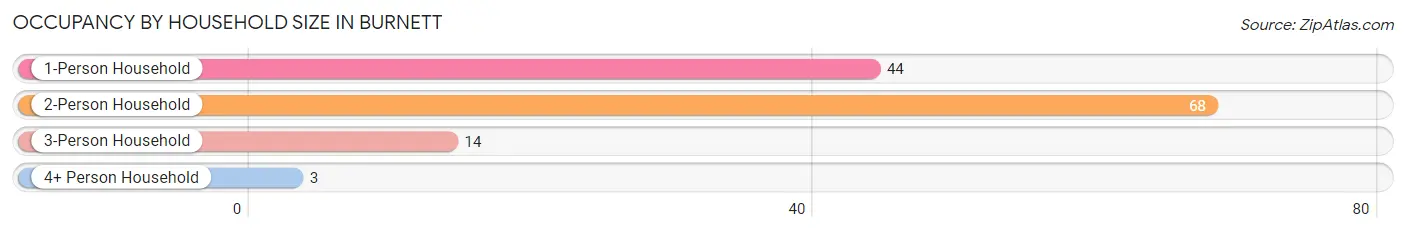
| Household Size | # Housing Units | % Housing Units |
| 1-Person Household | 44 | 34.1% |
| 2-Person Household | 68 | 52.7% |
| 3-Person Household | 14 | 10.8% |
| 4+ Person Household | 3 | 2.3% |
| Total Housing Units | 129 | 100.0% |
Occupancy by Ownership by Household Size in Burnett
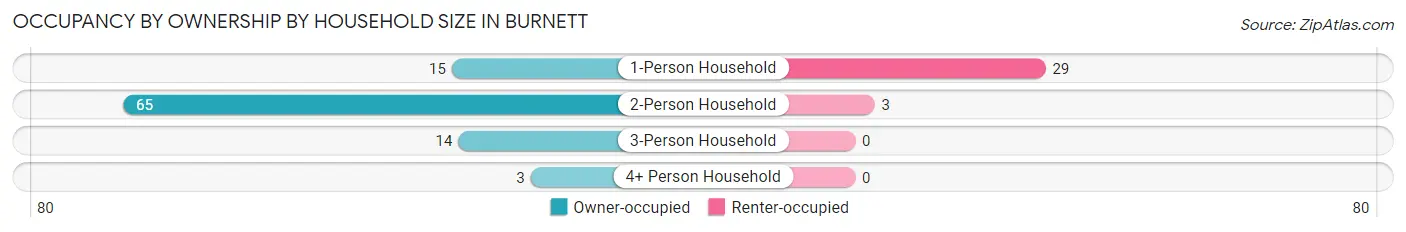
| Household Size | Owner-occupied | Renter-occupied |
| 1-Person Household | 15 (34.1%) | 29 (65.9%) |
| 2-Person Household | 65 (95.6%) | 3 (4.4%) |
| 3-Person Household | 14 (100.0%) | 0 (0.0%) |
| 4+ Person Household | 3 (100.0%) | 0 (0.0%) |
| Total Housing Units | 97 (75.2%) | 32 (24.8%) |
Occupancy by Educational Attainment in Burnett
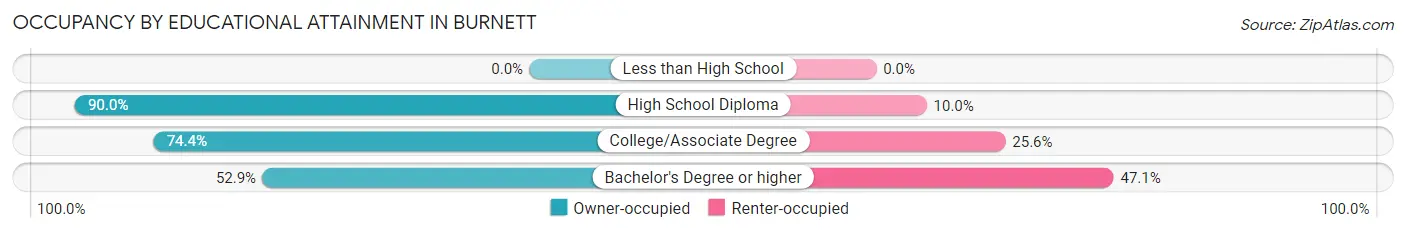
| Household Size | Owner-occupied | Renter-occupied |
| Less than High School | 0 (0.0%) | 0 (0.0%) |
| High School Diploma | 27 (90.0%) | 3 (10.0%) |
| College/Associate Degree | 61 (74.4%) | 21 (25.6%) |
| Bachelor's Degree or higher | 9 (52.9%) | 8 (47.1%) |
Occupancy by Age of Householder in Burnett
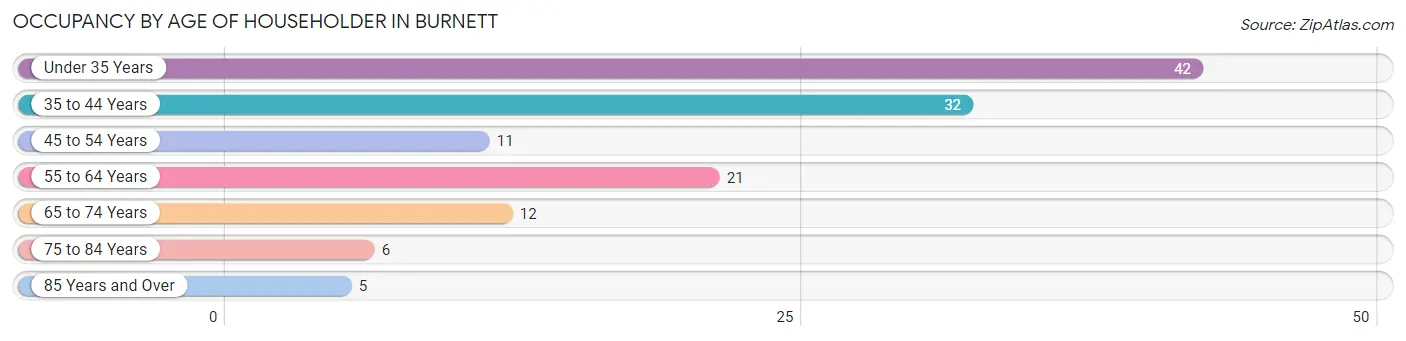
| Age Bracket | # Households | % Households |
| Under 35 Years | 42 | 32.6% |
| 35 to 44 Years | 32 | 24.8% |
| 45 to 54 Years | 11 | 8.5% |
| 55 to 64 Years | 21 | 16.3% |
| 65 to 74 Years | 12 | 9.3% |
| 75 to 84 Years | 6 | 4.6% |
| 85 Years and Over | 5 | 3.9% |
| Total | 129 | 100.0% |
Housing Finances in Burnett
Median Income by Occupancy in Burnett
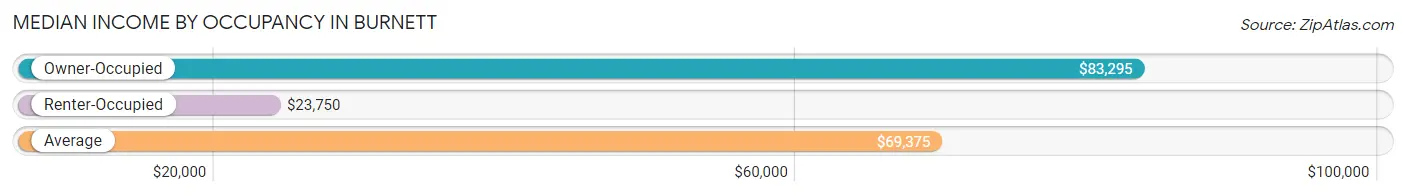
| Occupancy Type | # Households | Median Income |
| Owner-Occupied | 97 (75.2%) | $83,295 |
| Renter-Occupied | 32 (24.8%) | $23,750 |
| Average | 129 (100.0%) | $69,375 |
Occupancy by Householder Income Bracket in Burnett
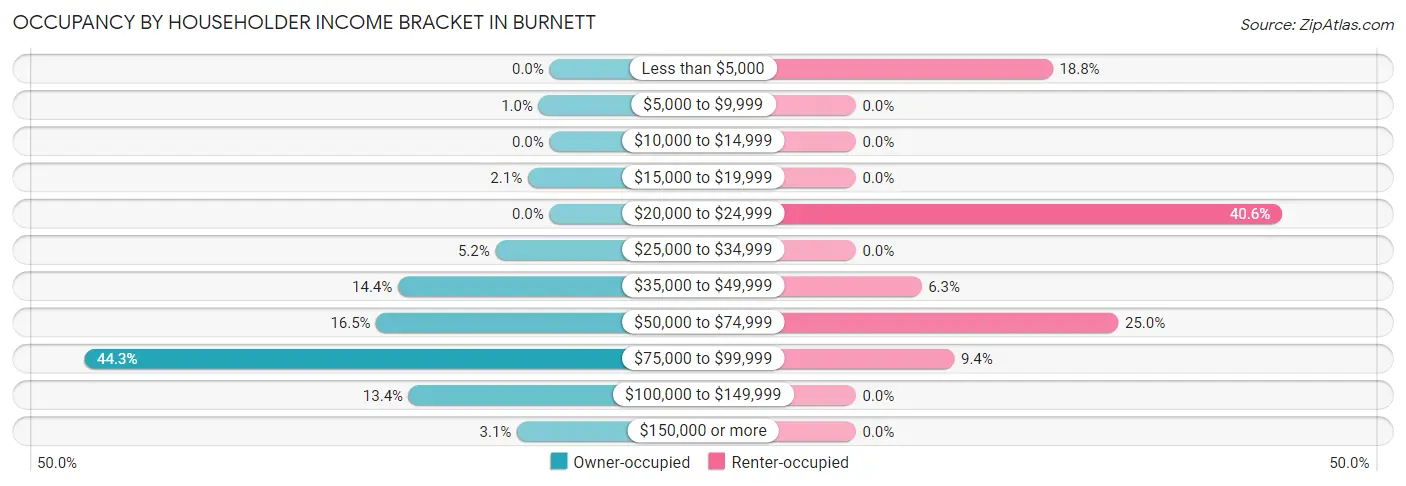
| Income Bracket | Owner-occupied | Renter-occupied |
| Less than $5,000 | 0 (0.0%) | 6 (18.8%) |
| $5,000 to $9,999 | 1 (1.0%) | 0 (0.0%) |
| $10,000 to $14,999 | 0 (0.0%) | 0 (0.0%) |
| $15,000 to $19,999 | 2 (2.1%) | 0 (0.0%) |
| $20,000 to $24,999 | 0 (0.0%) | 13 (40.6%) |
| $25,000 to $34,999 | 5 (5.1%) | 0 (0.0%) |
| $35,000 to $49,999 | 14 (14.4%) | 2 (6.2%) |
| $50,000 to $74,999 | 16 (16.5%) | 8 (25.0%) |
| $75,000 to $99,999 | 43 (44.3%) | 3 (9.4%) |
| $100,000 to $149,999 | 13 (13.4%) | 0 (0.0%) |
| $150,000 or more | 3 (3.1%) | 0 (0.0%) |
| Total | 97 (100.0%) | 32 (100.0%) |
Monthly Housing Cost Tiers in Burnett
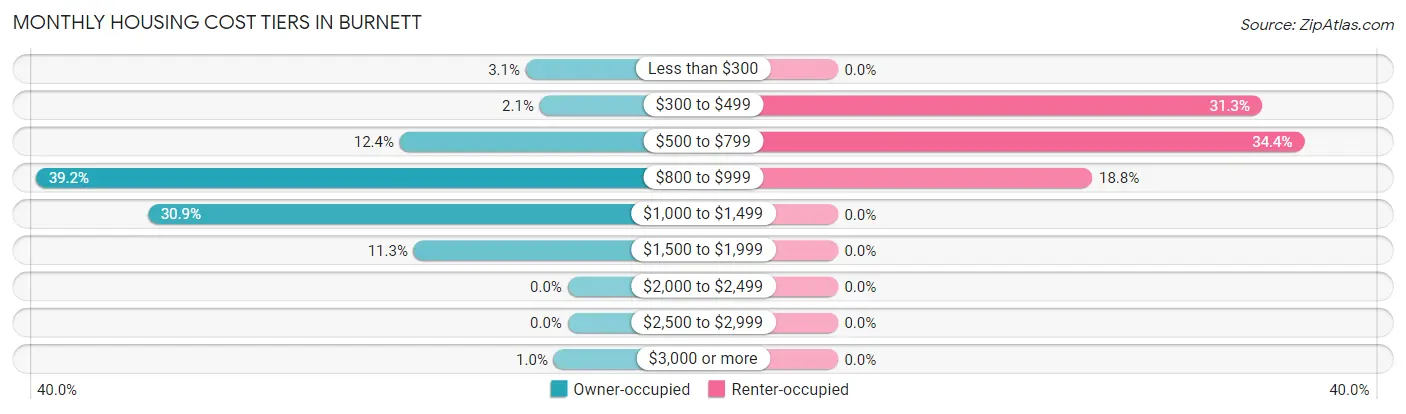
| Monthly Cost | Owner-occupied | Renter-occupied |
| Less than $300 | 3 (3.1%) | 0 (0.0%) |
| $300 to $499 | 2 (2.1%) | 10 (31.2%) |
| $500 to $799 | 12 (12.4%) | 11 (34.4%) |
| $800 to $999 | 38 (39.2%) | 6 (18.8%) |
| $1,000 to $1,499 | 30 (30.9%) | 0 (0.0%) |
| $1,500 to $1,999 | 11 (11.3%) | 0 (0.0%) |
| $2,000 to $2,499 | 0 (0.0%) | 0 (0.0%) |
| $2,500 to $2,999 | 0 (0.0%) | 0 (0.0%) |
| $3,000 or more | 1 (1.0%) | 0 (0.0%) |
| Total | 97 (100.0%) | 32 (100.0%) |
Physical Housing Characteristics in Burnett
Housing Structures in Burnett
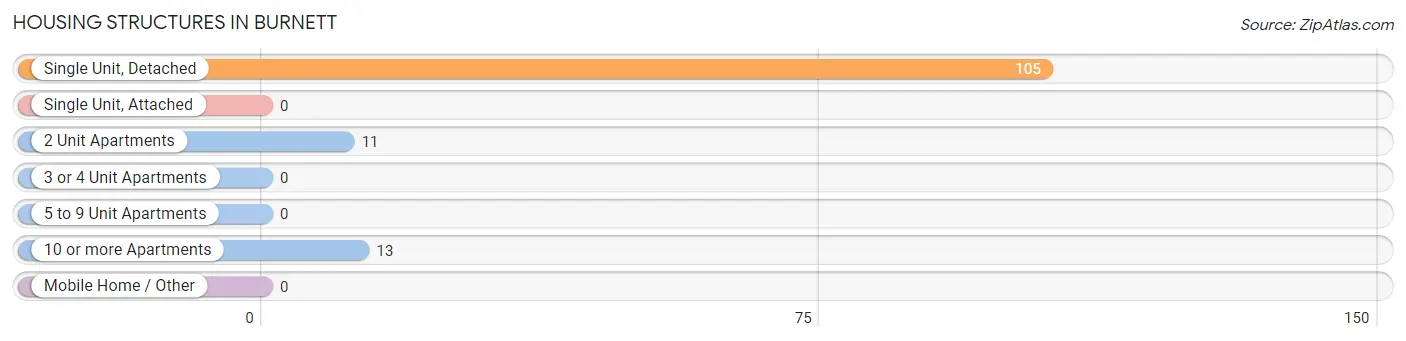
| Structure Type | # Housing Units | % Housing Units |
| Single Unit, Detached | 105 | 81.4% |
| Single Unit, Attached | 0 | 0.0% |
| 2 Unit Apartments | 11 | 8.5% |
| 3 or 4 Unit Apartments | 0 | 0.0% |
| 5 to 9 Unit Apartments | 0 | 0.0% |
| 10 or more Apartments | 13 | 10.1% |
| Mobile Home / Other | 0 | 0.0% |
| Total | 129 | 100.0% |
Housing Structures by Occupancy in Burnett
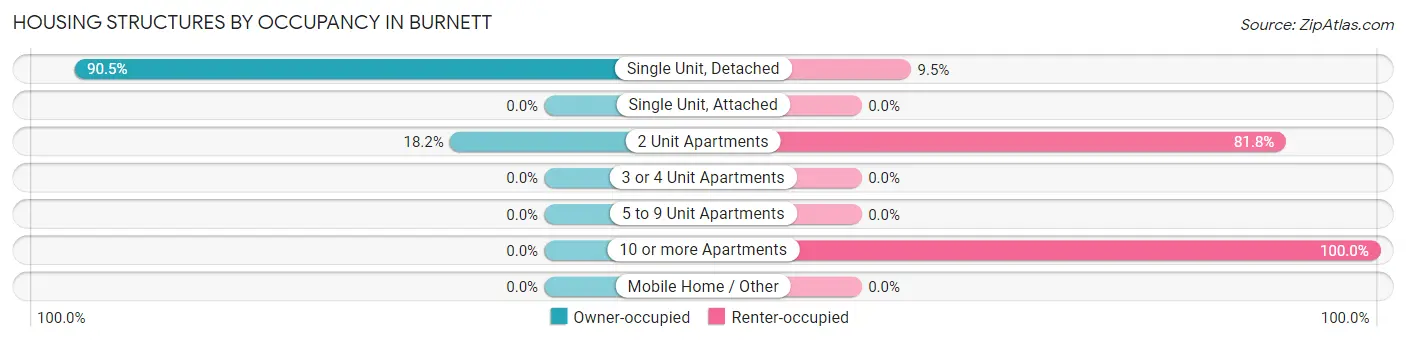
| Structure Type | Owner-occupied | Renter-occupied |
| Single Unit, Detached | 95 (90.5%) | 10 (9.5%) |
| Single Unit, Attached | 0 (0.0%) | 0 (0.0%) |
| 2 Unit Apartments | 2 (18.2%) | 9 (81.8%) |
| 3 or 4 Unit Apartments | 0 (0.0%) | 0 (0.0%) |
| 5 to 9 Unit Apartments | 0 (0.0%) | 0 (0.0%) |
| 10 or more Apartments | 0 (0.0%) | 13 (100.0%) |
| Mobile Home / Other | 0 (0.0%) | 0 (0.0%) |
| Total | 97 (75.2%) | 32 (24.8%) |
Housing Structures by Number of Rooms in Burnett
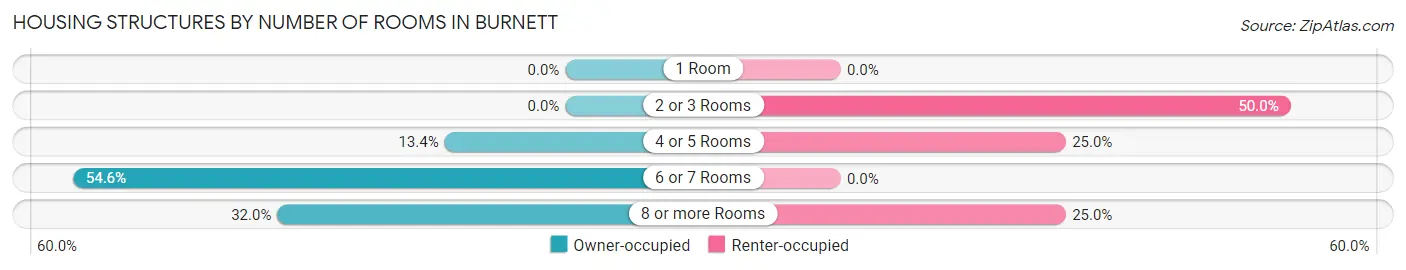
| Number of Rooms | Owner-occupied | Renter-occupied |
| 1 Room | 0 (0.0%) | 0 (0.0%) |
| 2 or 3 Rooms | 0 (0.0%) | 16 (50.0%) |
| 4 or 5 Rooms | 13 (13.4%) | 8 (25.0%) |
| 6 or 7 Rooms | 53 (54.6%) | 0 (0.0%) |
| 8 or more Rooms | 31 (32.0%) | 8 (25.0%) |
| Total | 97 (100.0%) | 32 (100.0%) |
Housing Structure by Heating Type in Burnett
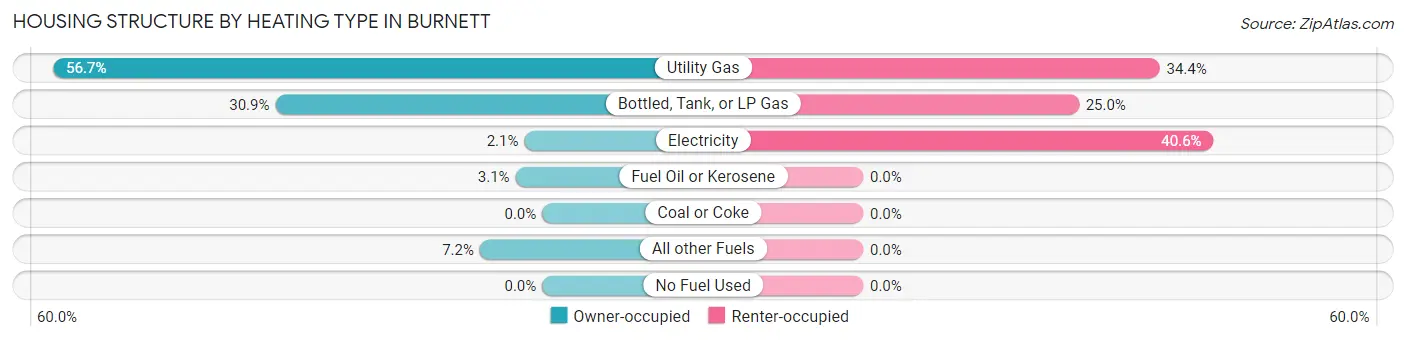
| Heating Type | Owner-occupied | Renter-occupied |
| Utility Gas | 55 (56.7%) | 11 (34.4%) |
| Bottled, Tank, or LP Gas | 30 (30.9%) | 8 (25.0%) |
| Electricity | 2 (2.1%) | 13 (40.6%) |
| Fuel Oil or Kerosene | 3 (3.1%) | 0 (0.0%) |
| Coal or Coke | 0 (0.0%) | 0 (0.0%) |
| All other Fuels | 7 (7.2%) | 0 (0.0%) |
| No Fuel Used | 0 (0.0%) | 0 (0.0%) |
| Total | 97 (100.0%) | 32 (100.0%) |
Household Vehicle Usage in Burnett
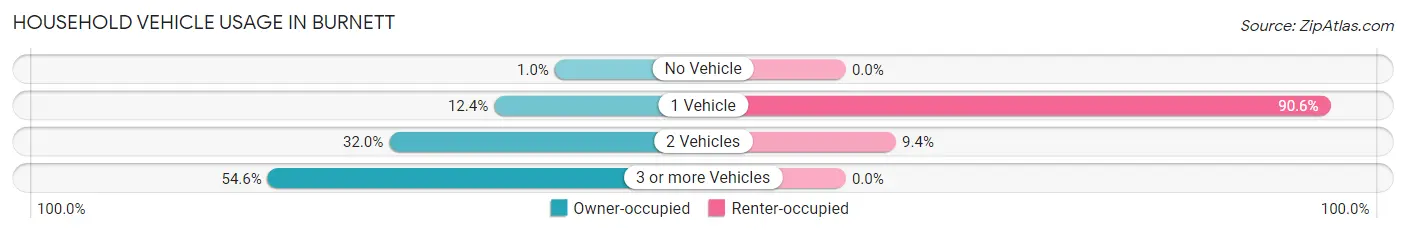
| Vehicles per Household | Owner-occupied | Renter-occupied |
| No Vehicle | 1 (1.0%) | 0 (0.0%) |
| 1 Vehicle | 12 (12.4%) | 29 (90.6%) |
| 2 Vehicles | 31 (32.0%) | 3 (9.4%) |
| 3 or more Vehicles | 53 (54.6%) | 0 (0.0%) |
| Total | 97 (100.0%) | 32 (100.0%) |
Real Estate & Mortgages in Burnett
Real Estate and Mortgage Overview in Burnett
| Characteristic | Without Mortgage | With Mortgage |
| Housing Units | 19 | 78 |
| Median Property Value | $165,600 | $137,500 |
| Median Household Income | $85,750 | $2 |
| Monthly Housing Costs | $564 | $1 |
| Real Estate Taxes | $3,200 | $0 |
Property Value by Mortgage Status in Burnett
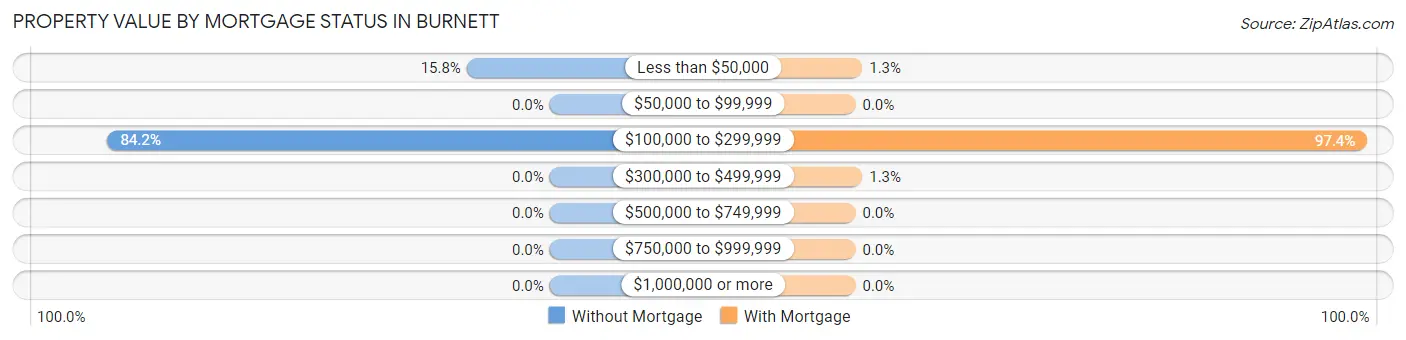
| Property Value | Without Mortgage | With Mortgage |
| Less than $50,000 | 3 (15.8%) | 1 (1.3%) |
| $50,000 to $99,999 | 0 (0.0%) | 0 (0.0%) |
| $100,000 to $299,999 | 16 (84.2%) | 76 (97.4%) |
| $300,000 to $499,999 | 0 (0.0%) | 1 (1.3%) |
| $500,000 to $749,999 | 0 (0.0%) | 0 (0.0%) |
| $750,000 to $999,999 | 0 (0.0%) | 0 (0.0%) |
| $1,000,000 or more | 0 (0.0%) | 0 (0.0%) |
| Total | 19 (100.0%) | 78 (100.0%) |
Household Income by Mortgage Status in Burnett
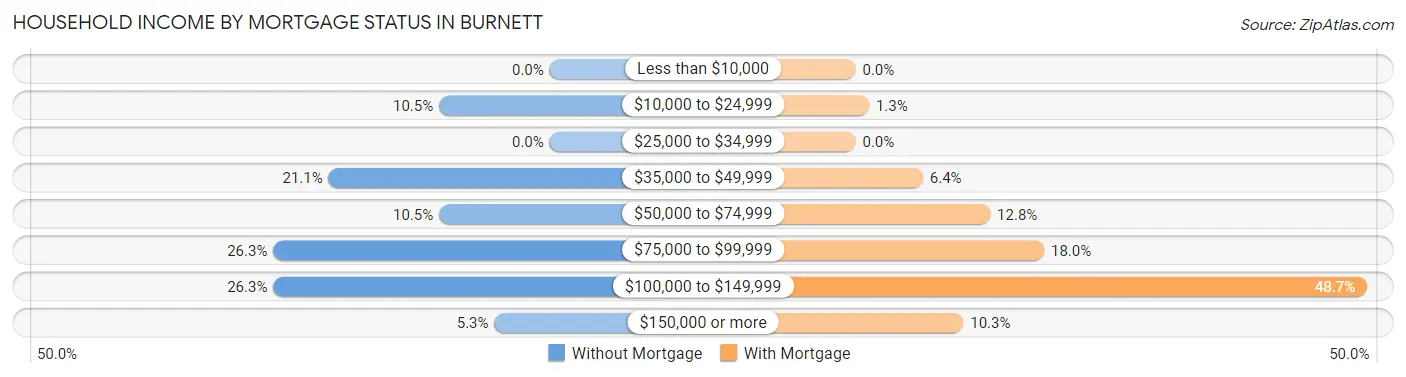
| Household Income | Without Mortgage | With Mortgage |
| Less than $10,000 | 0 (0.0%) | 0 (0.0%) |
| $10,000 to $24,999 | 2 (10.5%) | 1 (1.3%) |
| $25,000 to $34,999 | 0 (0.0%) | 0 (0.0%) |
| $35,000 to $49,999 | 4 (21.0%) | 5 (6.4%) |
| $50,000 to $74,999 | 2 (10.5%) | 10 (12.8%) |
| $75,000 to $99,999 | 5 (26.3%) | 14 (17.9%) |
| $100,000 to $149,999 | 5 (26.3%) | 38 (48.7%) |
| $150,000 or more | 1 (5.3%) | 8 (10.3%) |
| Total | 19 (100.0%) | 78 (100.0%) |
Property Value to Household Income Ratio in Burnett
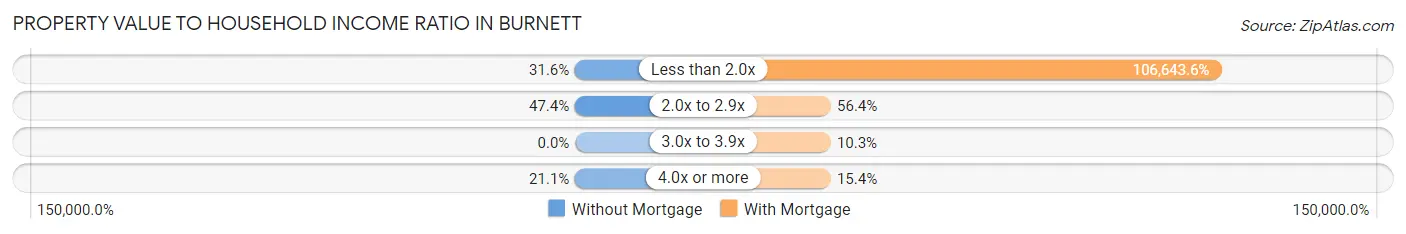
| Value-to-Income Ratio | Without Mortgage | With Mortgage |
| Less than 2.0x | 6 (31.6%) | 83,182 (106,643.6%) |
| 2.0x to 2.9x | 9 (47.4%) | 44 (56.4%) |
| 3.0x to 3.9x | 0 (0.0%) | 8 (10.3%) |
| 4.0x or more | 4 (21.0%) | 12 (15.4%) |
| Total | 19 (100.0%) | 78 (100.0%) |
Real Estate Taxes by Mortgage Status in Burnett
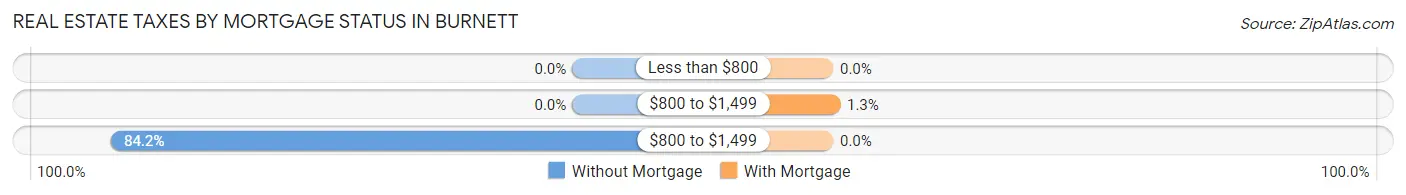
| Property Taxes | Without Mortgage | With Mortgage |
| Less than $800 | 0 (0.0%) | 0 (0.0%) |
| $800 to $1,499 | 0 (0.0%) | 1 (1.3%) |
| $800 to $1,499 | 16 (84.2%) | 0 (0.0%) |
| Total | 19 (100.0%) | 78 (100.0%) |
Health & Disability in Burnett
Health Insurance Coverage by Age in Burnett
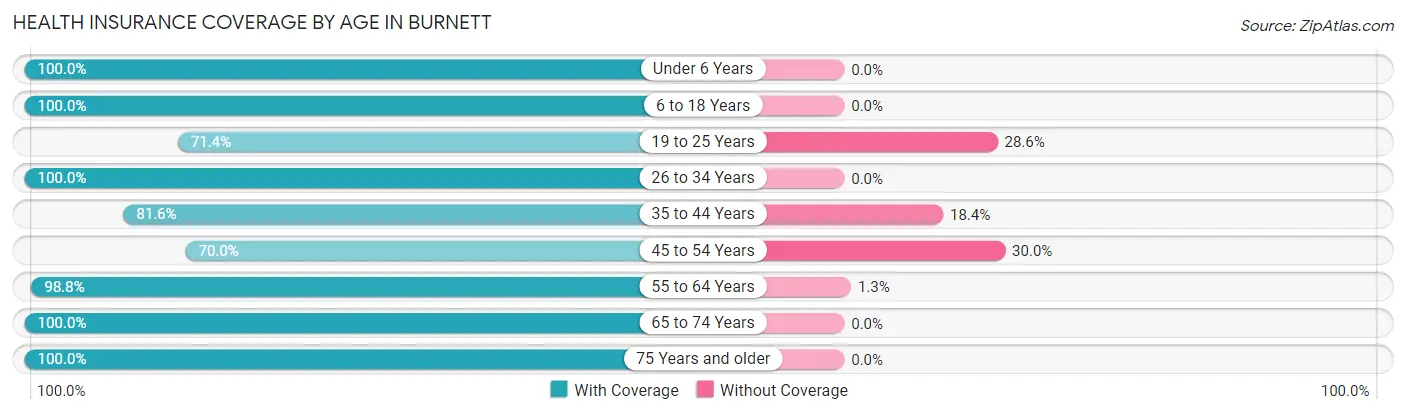
| Age Bracket | With Coverage | Without Coverage |
| Under 6 Years | 4 (100.0%) | 0 (0.0%) |
| 6 to 18 Years | 20 (100.0%) | 0 (0.0%) |
| 19 to 25 Years | 10 (71.4%) | 4 (28.6%) |
| 26 to 34 Years | 79 (100.0%) | 0 (0.0%) |
| 35 to 44 Years | 31 (81.6%) | 7 (18.4%) |
| 45 to 54 Years | 21 (70.0%) | 9 (30.0%) |
| 55 to 64 Years | 79 (98.8%) | 1 (1.3%) |
| 65 to 74 Years | 14 (100.0%) | 0 (0.0%) |
| 75 Years and older | 13 (100.0%) | 0 (0.0%) |
| Total | 271 (92.8%) | 21 (7.2%) |
Health Insurance Coverage by Citizenship Status in Burnett
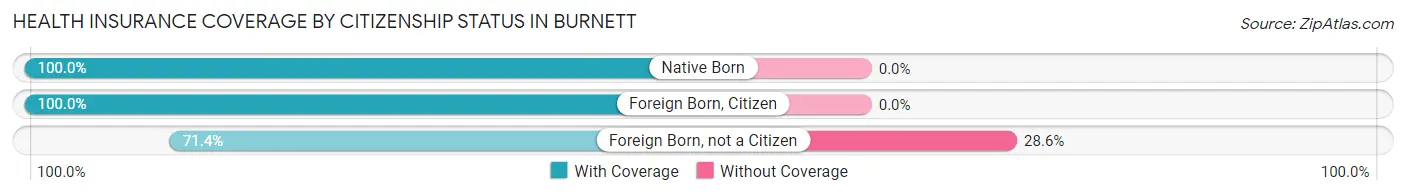
| Citizenship Status | With Coverage | Without Coverage |
| Native Born | 4 (100.0%) | 0 (0.0%) |
| Foreign Born, Citizen | 20 (100.0%) | 0 (0.0%) |
| Foreign Born, not a Citizen | 10 (71.4%) | 4 (28.6%) |
Health Insurance Coverage by Household Income in Burnett
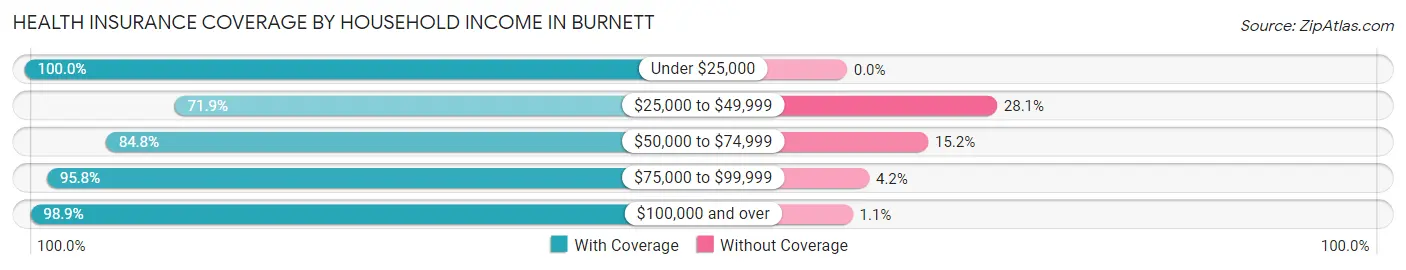
| Household Income | With Coverage | Without Coverage |
| Under $25,000 | 25 (100.0%) | 0 (0.0%) |
| $25,000 to $49,999 | 23 (71.9%) | 9 (28.1%) |
| $50,000 to $74,999 | 39 (84.8%) | 7 (15.2%) |
| $75,000 to $99,999 | 92 (95.8%) | 4 (4.2%) |
| $100,000 and over | 92 (98.9%) | 1 (1.1%) |
Public vs Private Health Insurance Coverage by Age in Burnett
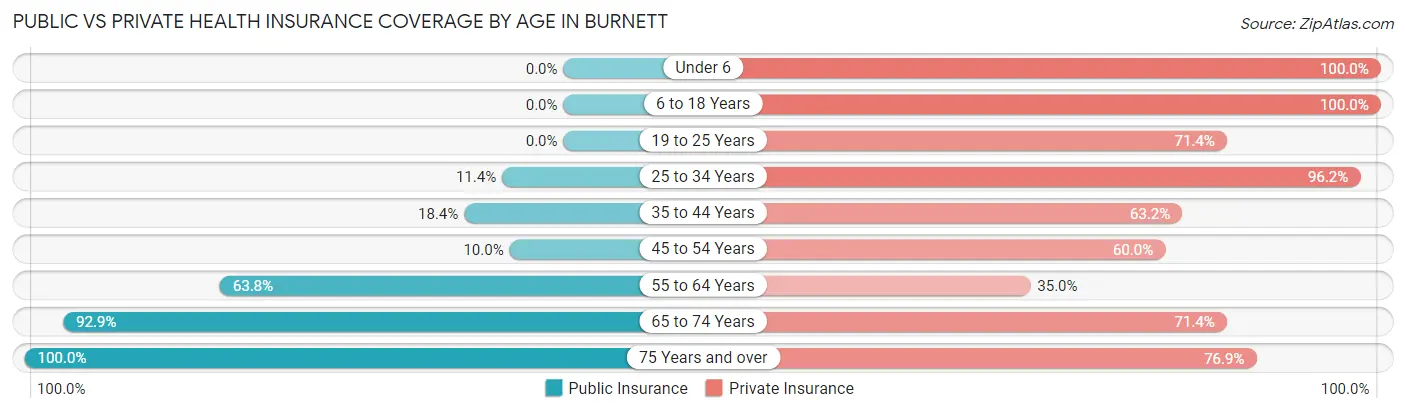
| Age Bracket | Public Insurance | Private Insurance |
| Under 6 | 0 (0.0%) | 4 (100.0%) |
| 6 to 18 Years | 0 (0.0%) | 20 (100.0%) |
| 19 to 25 Years | 0 (0.0%) | 10 (71.4%) |
| 25 to 34 Years | 9 (11.4%) | 76 (96.2%) |
| 35 to 44 Years | 7 (18.4%) | 24 (63.2%) |
| 45 to 54 Years | 3 (10.0%) | 18 (60.0%) |
| 55 to 64 Years | 51 (63.7%) | 28 (35.0%) |
| 65 to 74 Years | 13 (92.9%) | 10 (71.4%) |
| 75 Years and over | 13 (100.0%) | 10 (76.9%) |
| Total | 96 (32.9%) | 200 (68.5%) |
Disability Status by Sex by Age in Burnett
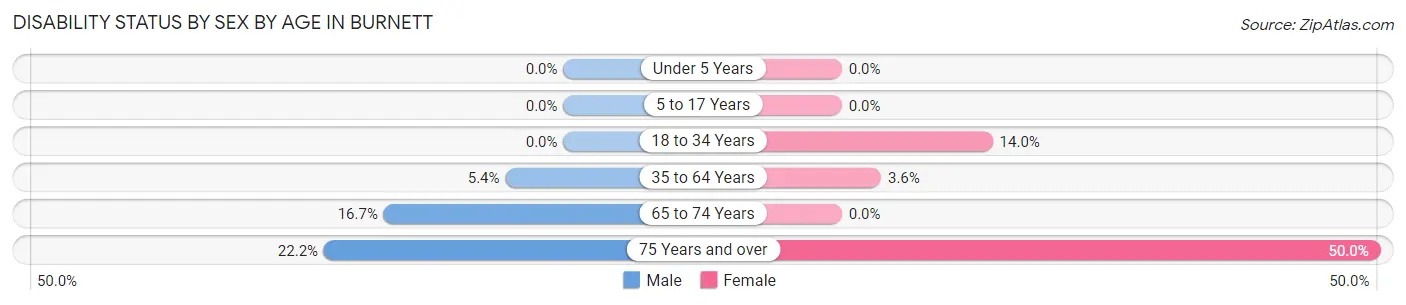
| Age Bracket | Male | Female |
| Under 5 Years | 0 (0.0%) | 0 (0.0%) |
| 5 to 17 Years | 0 (0.0%) | 0 (0.0%) |
| 18 to 34 Years | 0 (0.0%) | 7 (14.0%) |
| 35 to 64 Years | 5 (5.4%) | 2 (3.6%) |
| 65 to 74 Years | 2 (16.7%) | 0 (0.0%) |
| 75 Years and over | 2 (22.2%) | 2 (50.0%) |
Disability Class by Sex by Age in Burnett
Disability Class: Hearing Difficulty
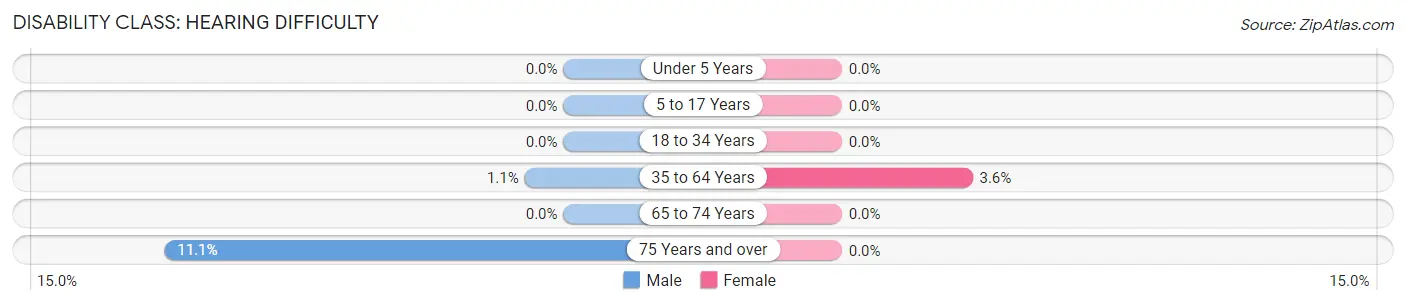
| Age Bracket | Male | Female |
| Under 5 Years | 0 (0.0%) | 0 (0.0%) |
| 5 to 17 Years | 0 (0.0%) | 0 (0.0%) |
| 18 to 34 Years | 0 (0.0%) | 0 (0.0%) |
| 35 to 64 Years | 1 (1.1%) | 2 (3.6%) |
| 65 to 74 Years | 0 (0.0%) | 0 (0.0%) |
| 75 Years and over | 1 (11.1%) | 0 (0.0%) |
Disability Class: Vision Difficulty
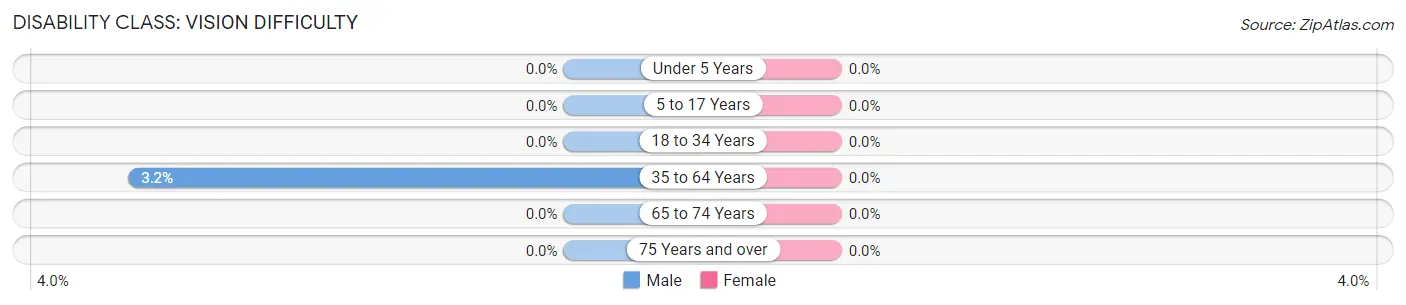
| Age Bracket | Male | Female |
| Under 5 Years | 0 (0.0%) | 0 (0.0%) |
| 5 to 17 Years | 0 (0.0%) | 0 (0.0%) |
| 18 to 34 Years | 0 (0.0%) | 0 (0.0%) |
| 35 to 64 Years | 3 (3.2%) | 0 (0.0%) |
| 65 to 74 Years | 0 (0.0%) | 0 (0.0%) |
| 75 Years and over | 0 (0.0%) | 0 (0.0%) |
Disability Class: Cognitive Difficulty
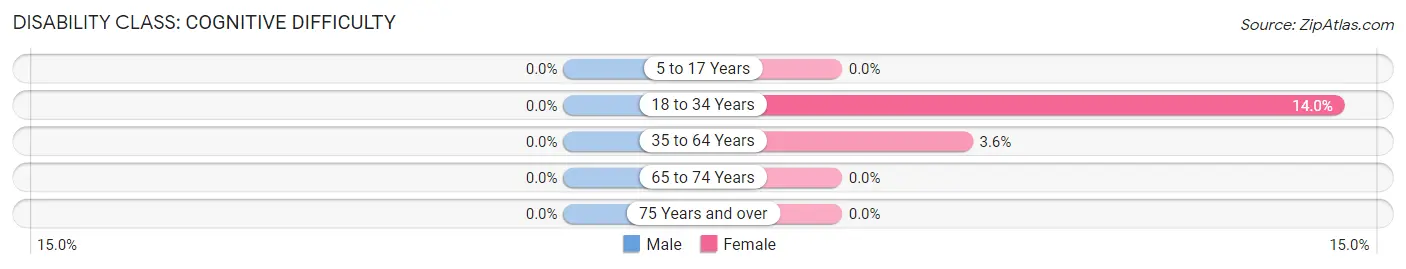
| Age Bracket | Male | Female |
| 5 to 17 Years | 0 (0.0%) | 0 (0.0%) |
| 18 to 34 Years | 0 (0.0%) | 7 (14.0%) |
| 35 to 64 Years | 0 (0.0%) | 2 (3.6%) |
| 65 to 74 Years | 0 (0.0%) | 0 (0.0%) |
| 75 Years and over | 0 (0.0%) | 0 (0.0%) |
Disability Class: Ambulatory Difficulty
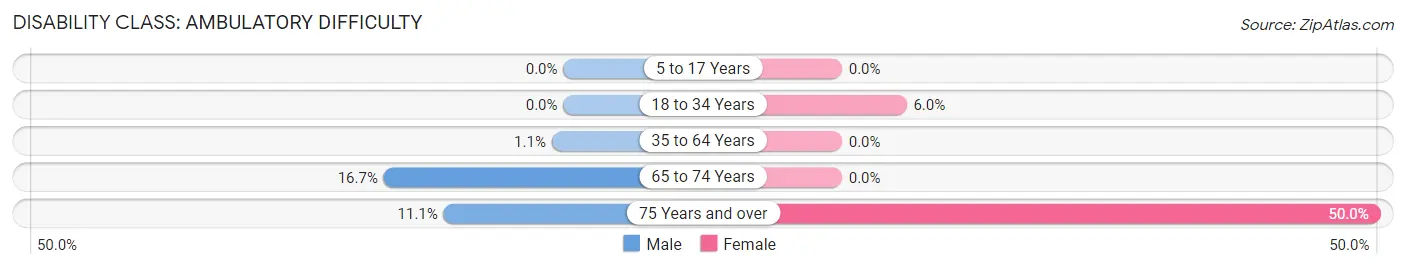
| Age Bracket | Male | Female |
| 5 to 17 Years | 0 (0.0%) | 0 (0.0%) |
| 18 to 34 Years | 0 (0.0%) | 3 (6.0%) |
| 35 to 64 Years | 1 (1.1%) | 0 (0.0%) |
| 65 to 74 Years | 2 (16.7%) | 0 (0.0%) |
| 75 Years and over | 1 (11.1%) | 2 (50.0%) |
Disability Class: Self-Care Difficulty
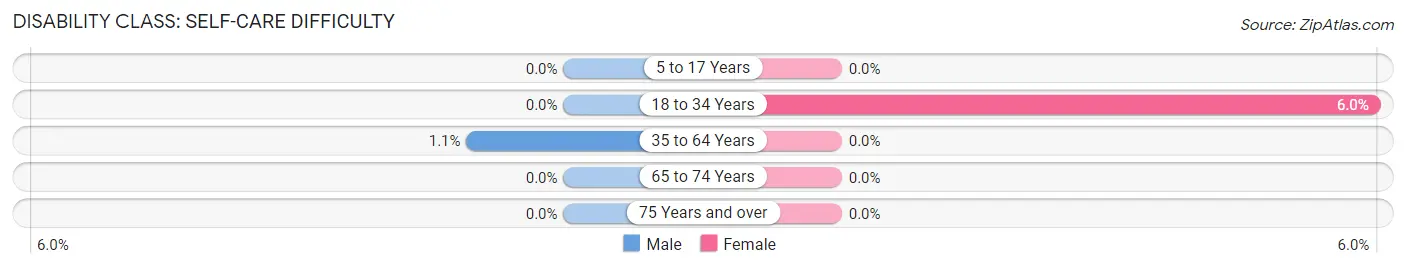
| Age Bracket | Male | Female |
| 5 to 17 Years | 0 (0.0%) | 0 (0.0%) |
| 18 to 34 Years | 0 (0.0%) | 3 (6.0%) |
| 35 to 64 Years | 1 (1.1%) | 0 (0.0%) |
| 65 to 74 Years | 0 (0.0%) | 0 (0.0%) |
| 75 Years and over | 0 (0.0%) | 0 (0.0%) |
Technology Access in Burnett
Computing Device Access in Burnett
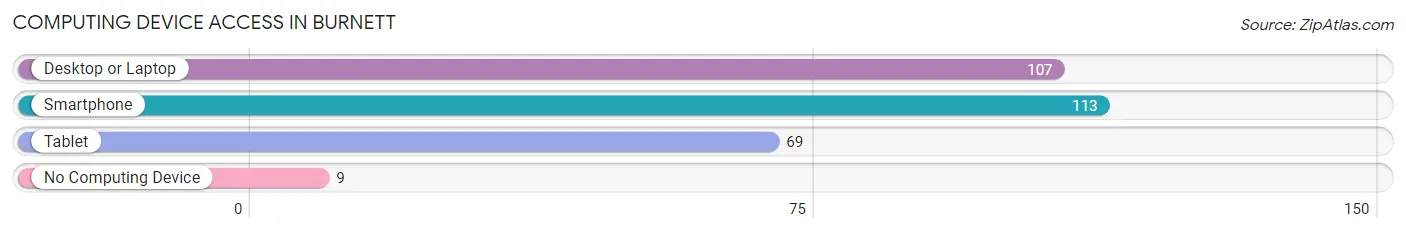
| Device Type | # Households | % Households |
| Desktop or Laptop | 107 | 83.0% |
| Smartphone | 113 | 87.6% |
| Tablet | 69 | 53.5% |
| No Computing Device | 9 | 7.0% |
| Total | 129 | 100.0% |
Internet Access in Burnett
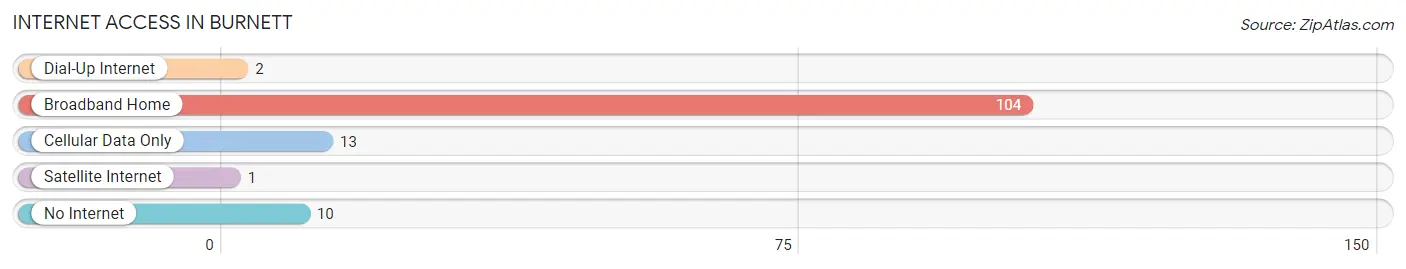
| Internet Type | # Households | % Households |
| Dial-Up Internet | 2 | 1.5% |
| Broadband Home | 104 | 80.6% |
| Cellular Data Only | 13 | 10.1% |
| Satellite Internet | 1 | 0.8% |
| No Internet | 10 | 7.7% |
| Total | 129 | 100.0% |
Burnett Summary
Burnett, Wisconsin is a small town located in the northwest corner of the state, near the Minnesota border. It is part of the Burnett County, which is home to a population of 15,000 people. The town of Burnett is located on the banks of the St. Croix River, and is surrounded by rolling hills and forests.
History
The area that is now Burnett was first settled in the early 1800s by French-Canadian fur traders. The town was officially founded in 1856, and was named after the Burnett family, who were among the first settlers. The town was originally a logging and farming community, and the first sawmill was built in 1858.
In the late 1800s, the town began to grow and develop. The first school was built in 1876, and the first church was built in 1877. The first post office was established in 1878, and the first newspaper was published in 1881.
The town continued to grow and develop throughout the 20th century. In the 1950s, the town was connected to the rest of the state by the construction of a bridge over the St. Croix River. In the 1960s, the town was connected to the rest of the country by the construction of an interstate highway.
Geography
Burnett is located in the northwest corner of Wisconsin, near the Minnesota border. It is part of Burnett County, which is home to a population of 15,000 people. The town is located on the banks of the St. Croix River, and is surrounded by rolling hills and forests.
The town is located in a temperate climate, with warm summers and cold winters. The average temperature in the summer is around 75 degrees Fahrenheit, and the average temperature in the winter is around 25 degrees Fahrenheit.
Economy
The economy of Burnett is largely based on agriculture and tourism. The town is home to several farms, which produce a variety of crops, including corn, soybeans, and hay. The town is also home to several tourist attractions, including a golf course, a ski resort, and a state park.
The town is also home to several small businesses, including restaurants, shops, and a movie theater. The town is also home to several manufacturing companies, which produce a variety of products, including furniture, clothing, and electronics.
Demographics
As of the 2010 census, the population of Burnett was 1,845. The town is predominantly white, with a population that is 97.3% white and 2.7% other races. The median household income is $45,000, and the median age is 44.
Conclusion
Burnett, Wisconsin is a small town located in the northwest corner of the state, near the Minnesota border. It is part of the Burnett County, which is home to a population of 15,000 people. The town is located on the banks of the St. Croix River, and is surrounded by rolling hills and forests. The economy of Burnett is largely based on agriculture and tourism, and the town is home to several small businesses. The population of Burnett is predominantly white, with a median household income of $45,000 and a median age of 44.
Common Questions
What is Per Capita Income in Burnett?
Per Capita income in Burnett is $42,074.
What is the Median Family Income in Burnett?
Median Family Income in Burnett is $85,500.
What is the Median Household income in Burnett?
Median Household Income in Burnett is $69,375.
What is Income or Wage Gap in Burnett?
Income or Wage Gap in Burnett is 65.9%.
Women in Burnett earn 34.1 cents for every dollar earned by a man.
What is Inequality or Gini Index in Burnett?
Inequality or Gini Index in Burnett is 0.31.
What is the Total Population of Burnett?
Total Population of Burnett is 292.
What is the Total Male Population of Burnett?
Total Male Population of Burnett is 175.
What is the Total Female Population of Burnett?
Total Female Population of Burnett is 117.
What is the Ratio of Males per 100 Females in Burnett?
There are 149.57 Males per 100 Females in Burnett.
What is the Ratio of Females per 100 Males in Burnett?
There are 66.86 Females per 100 Males in Burnett.
What is the Median Population Age in Burnett?
Median Population Age in Burnett is 40.1 Years.
What is the Average Family Size in Burnett
Average Family Size in Burnett is 3.4 People.
What is the Average Household Size in Burnett
Average Household Size in Burnett is 2.3 People.
How Large is the Labor Force in Burnett?
There are 216 People in the Labor Forcein in Burnett.
What is the Percentage of People in the Labor Force in Burnett?
80.6% of People are in the Labor Force in Burnett.
What is the Unemployment Rate in Burnett?
Unemployment Rate in Burnett is 16.2%.