Bruce, WI
Bruce Map
Bruce Overview
739
TOTAL POPULATION
343
MALE POPULATION
396
FEMALE POPULATION
86.62
MALES / 100 FEMALES
115.45
FEMALES / 100 MALES
34.8
MEDIAN AGE
3.4
AVG FAMILY SIZE
2.6
AVG HOUSEHOLD SIZE
$21,170
PER CAPITA INCOME
$54,792
AVG FAMILY INCOME
$45,938
AVG HOUSEHOLD INCOME
35.6%
WAGE / INCOME GAP [ % ]
64.4¢/ $1
WAGE / INCOME GAP [ $ ]
0.37
INEQUALITY / GINI INDEX
289
LABOR FORCE [ PEOPLE ]
54.1%
PERCENT IN LABOR FORCE
2.8%
UNEMPLOYMENT RATE
Bruce Zip Codes
Bruce Area Codes
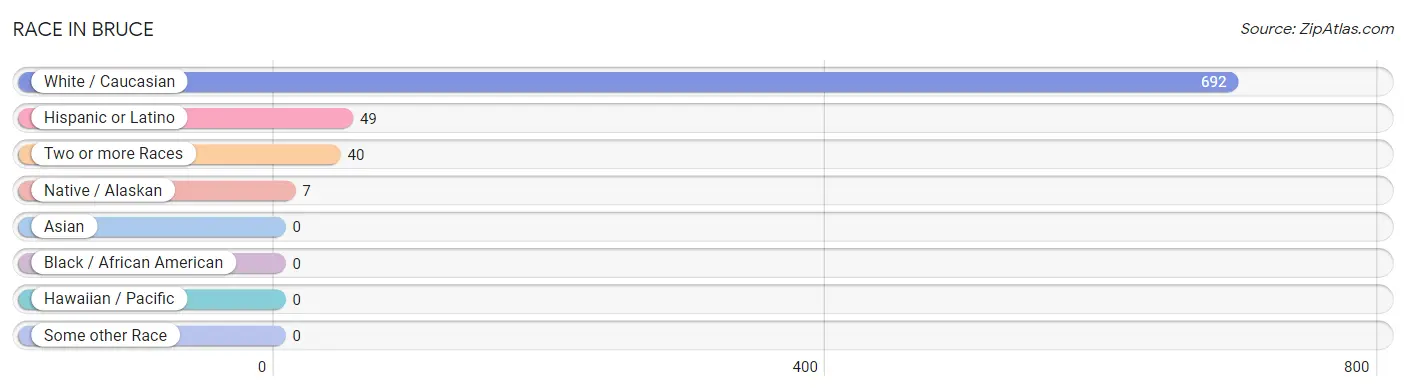
Race in Bruce
The most populous races in Bruce are White / Caucasian (692 | 93.6%), Hispanic or Latino (49 | 6.6%), and Two or more Races (40 | 5.4%).
| Race | # Population | % Population |
| Asian | 0 | 0.0% |
| Black / African American | 0 | 0.0% |
| Hawaiian / Pacific | 0 | 0.0% |
| Hispanic or Latino | 49 | 6.6% |
| Native / Alaskan | 7 | 0.9% |
| White / Caucasian | 692 | 93.6% |
| Two or more Races | 40 | 5.4% |
| Some other Race | 0 | 0.0% |
| Total | 739 | 100.0% |
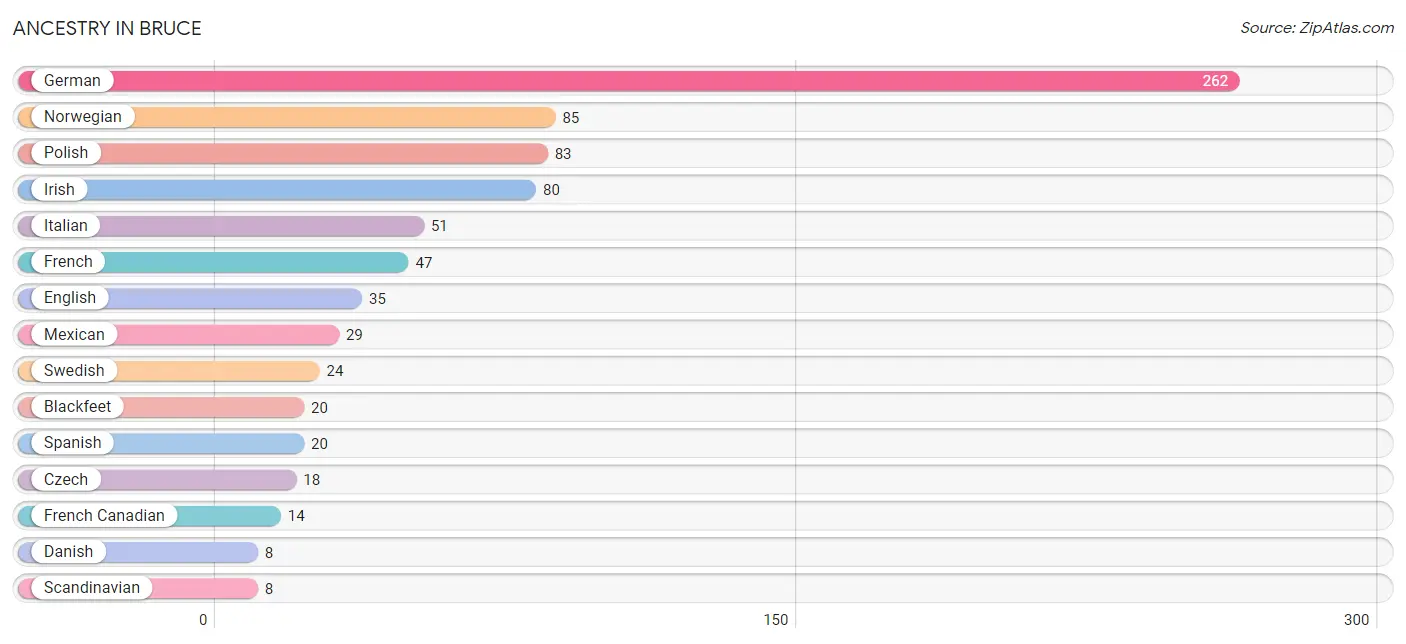
Ancestry in Bruce
The most populous ancestries reported in Bruce are German (262 | 35.4%), Norwegian (85 | 11.5%), Polish (83 | 11.2%), Irish (80 | 10.8%), and Italian (51 | 6.9%), together accounting for 75.9% of all Bruce residents.
| Ancestry | # Population | % Population |
| American | 7 | 0.9% |
| Bhutanese | 2 | 0.3% |
| Blackfeet | 20 | 2.7% |
| Chippewa | 4 | 0.5% |
| Czech | 18 | 2.4% |
| Czechoslovakian | 5 | 0.7% |
| Danish | 8 | 1.1% |
| Dutch | 4 | 0.5% |
| English | 35 | 4.7% |
| European | 6 | 0.8% |
| French | 47 | 6.4% |
| French Canadian | 14 | 1.9% |
| German | 262 | 35.4% |
| Indian (Asian) | 2 | 0.3% |
| Irish | 80 | 10.8% |
| Italian | 51 | 6.9% |
| Korean | 2 | 0.3% |
| Mexican | 29 | 3.9% |
| Native Hawaiian | 1 | 0.1% |
| Norwegian | 85 | 11.5% |
| Polish | 83 | 11.2% |
| Scandinavian | 8 | 1.1% |
| Scottish | 3 | 0.4% |
| Serbian | 4 | 0.5% |
| Spanish | 20 | 2.7% |
| Swedish | 24 | 3.3% |
| Swiss | 4 | 0.5% |
| Ukrainian | 1 | 0.1% | View All 28 Rows |
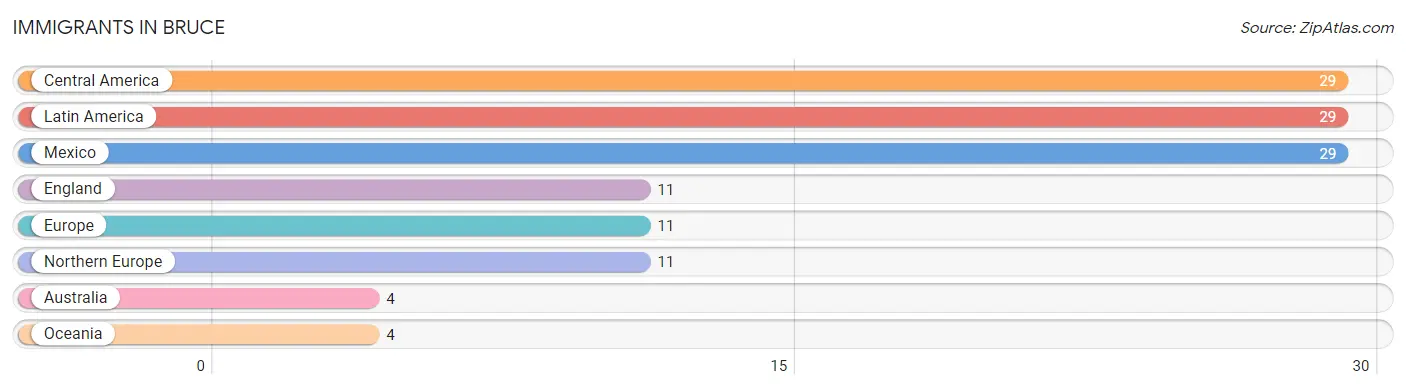
Immigrants in Bruce
The most numerous immigrant groups reported in Bruce came from Central America (29 | 3.9%), Latin America (29 | 3.9%), Mexico (29 | 3.9%), England (11 | 1.5%), and Europe (11 | 1.5%), together accounting for 14.7% of all Bruce residents.
| Immigration Origin | # Population | % Population |
| Australia | 4 | 0.5% |
| Central America | 29 | 3.9% |
| England | 11 | 1.5% |
| Europe | 11 | 1.5% |
| Latin America | 29 | 3.9% |
| Mexico | 29 | 3.9% |
| Northern Europe | 11 | 1.5% |
| Oceania | 4 | 0.5% | View All 8 Rows |
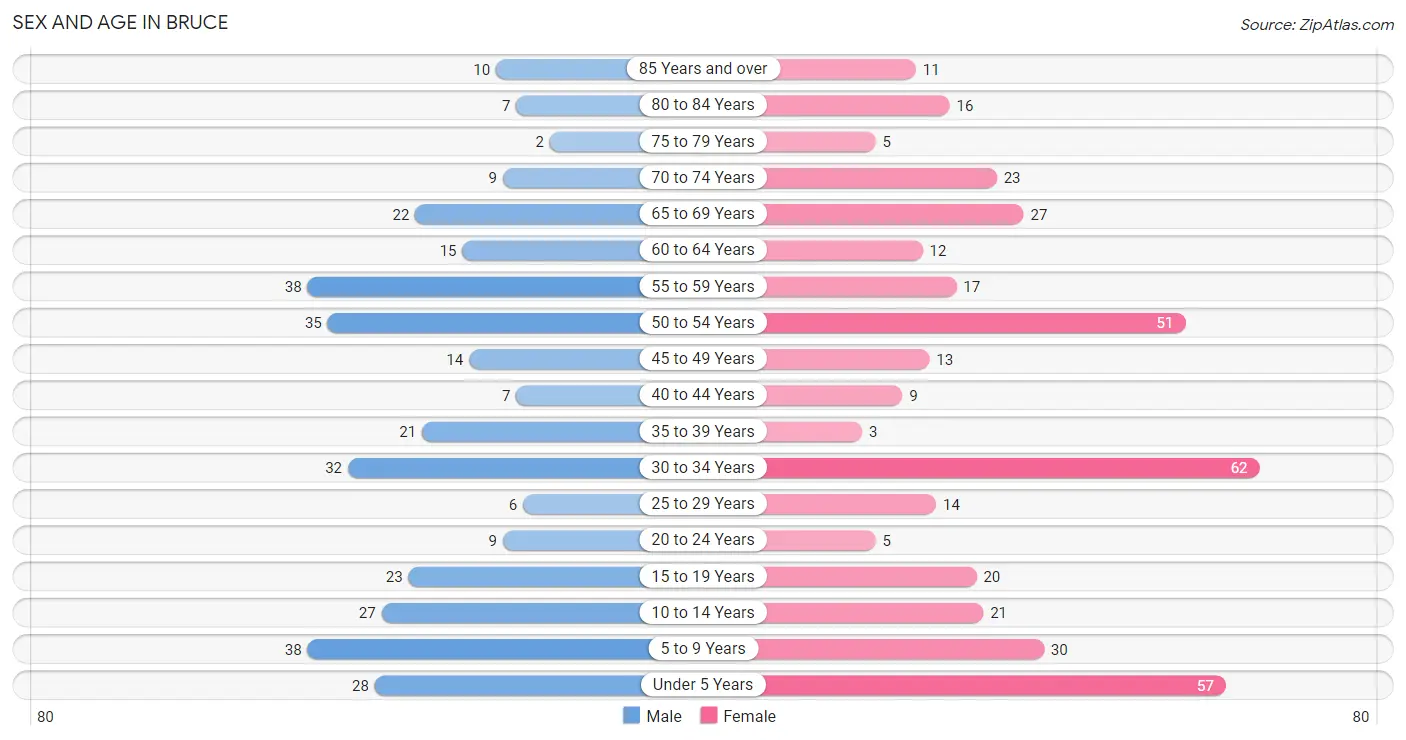
Sex and Age in Bruce
Sex and Age in Bruce
The most populous age groups in Bruce are 5 to 9 Years (38 | 11.1%) for men and 30 to 34 Years (62 | 15.7%) for women.
| Age Bracket | Male | Female |
| Under 5 Years | 28 (8.2%) | 57 (14.4%) |
| 5 to 9 Years | 38 (11.1%) | 30 (7.6%) |
| 10 to 14 Years | 27 (7.9%) | 21 (5.3%) |
| 15 to 19 Years | 23 (6.7%) | 20 (5.1%) |
| 20 to 24 Years | 9 (2.6%) | 5 (1.3%) |
| 25 to 29 Years | 6 (1.8%) | 14 (3.5%) |
| 30 to 34 Years | 32 (9.3%) | 62 (15.7%) |
| 35 to 39 Years | 21 (6.1%) | 3 (0.8%) |
| 40 to 44 Years | 7 (2.0%) | 9 (2.3%) |
| 45 to 49 Years | 14 (4.1%) | 13 (3.3%) |
| 50 to 54 Years | 35 (10.2%) | 51 (12.9%) |
| 55 to 59 Years | 38 (11.1%) | 17 (4.3%) |
| 60 to 64 Years | 15 (4.4%) | 12 (3.0%) |
| 65 to 69 Years | 22 (6.4%) | 27 (6.8%) |
| 70 to 74 Years | 9 (2.6%) | 23 (5.8%) |
| 75 to 79 Years | 2 (0.6%) | 5 (1.3%) |
| 80 to 84 Years | 7 (2.0%) | 16 (4.0%) |
| 85 Years and over | 10 (2.9%) | 11 (2.8%) |
| Total | 343 (100.0%) | 396 (100.0%) |
Families and Households in Bruce
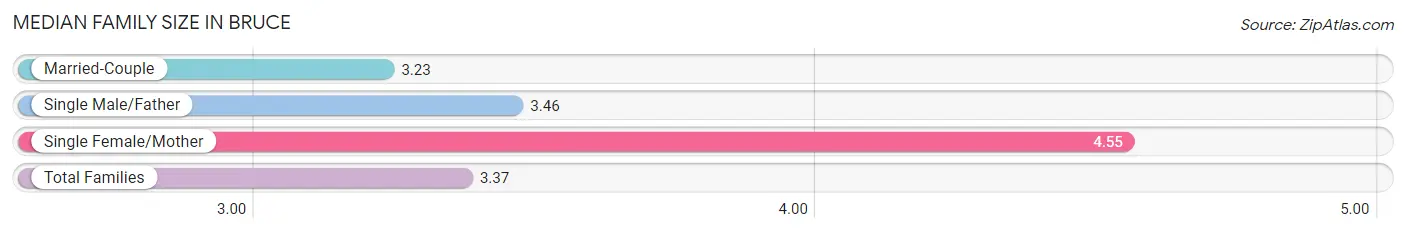
Median Family Size in Bruce
The median family size in Bruce is 3.37 persons per family, with single female/mother families (11 | 7.3%) accounting for the largest median family size of 4.55 persons per family. On the other hand, married-couple families (112 | 74.2%) represent the smallest median family size with 3.23 persons per family.
| Family Type | # Families | Family Size |
| Married-Couple | 112 (74.2%) | 3.23 |
| Single Male/Father | 28 (18.5%) | 3.46 |
| Single Female/Mother | 11 (7.3%) | 4.55 |
| Total Families | 151 (100.0%) | 3.37 |
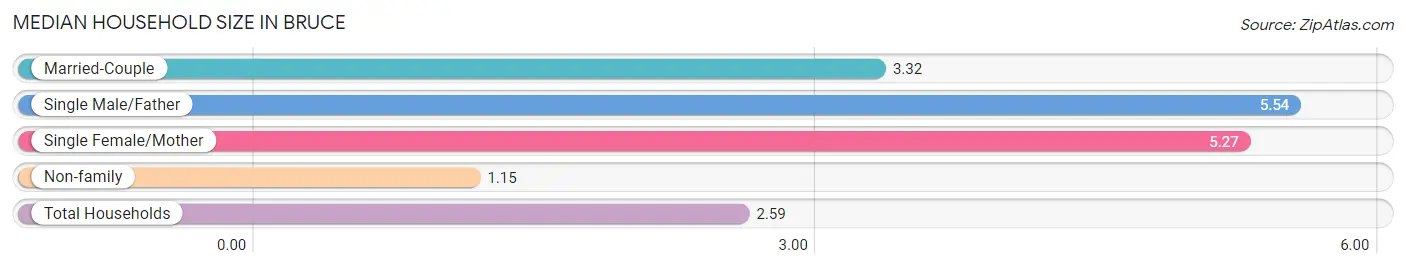
Median Household Size in Bruce
The median household size in Bruce is 2.59 persons per household, with single male/father households (28 | 9.8%) accounting for the largest median household size of 5.54 persons per household. non-family households (134 | 47.0%) represent the smallest median household size with 1.15 persons per household.
| Household Type | # Households | Household Size |
| Married-Couple | 112 (39.3%) | 3.32 |
| Single Male/Father | 28 (9.8%) | 5.54 |
| Single Female/Mother | 11 (3.9%) | 5.27 |
| Non-family | 134 (47.0%) | 1.15 |
| Total Households | 285 (100.0%) | 2.59 |
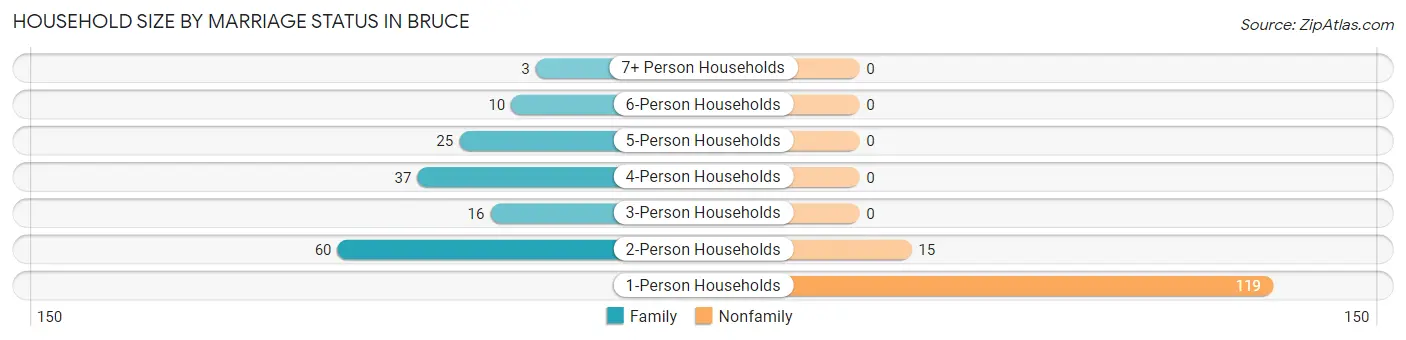
Household Size by Marriage Status in Bruce
Out of a total of 285 households in Bruce, 151 (53.0%) are family households, while 134 (47.0%) are nonfamily households. The most numerous type of family households are 2-person households, comprising 60, and the most common type of nonfamily households are 1-person households, comprising 119.
| Household Size | Family Households | Nonfamily Households |
| 1-Person Households | - | 119 (41.7%) |
| 2-Person Households | 60 (21.0%) | 15 (5.3%) |
| 3-Person Households | 16 (5.6%) | 0 (0.0%) |
| 4-Person Households | 37 (13.0%) | 0 (0.0%) |
| 5-Person Households | 25 (8.8%) | 0 (0.0%) |
| 6-Person Households | 10 (3.5%) | 0 (0.0%) |
| 7+ Person Households | 3 (1.1%) | 0 (0.0%) |
| Total | 151 (53.0%) | 134 (47.0%) |
Female Fertility in Bruce
Fertility by Age in Bruce
Average fertility rate in Bruce is 114.0 births per 1,000 women. Women in the age bracket of 20 to 34 years have the highest fertility rate with 148.0 births per 1,000 women. Women in the age bracket of 20 to 34 years acount for 80.0% of all women with births.
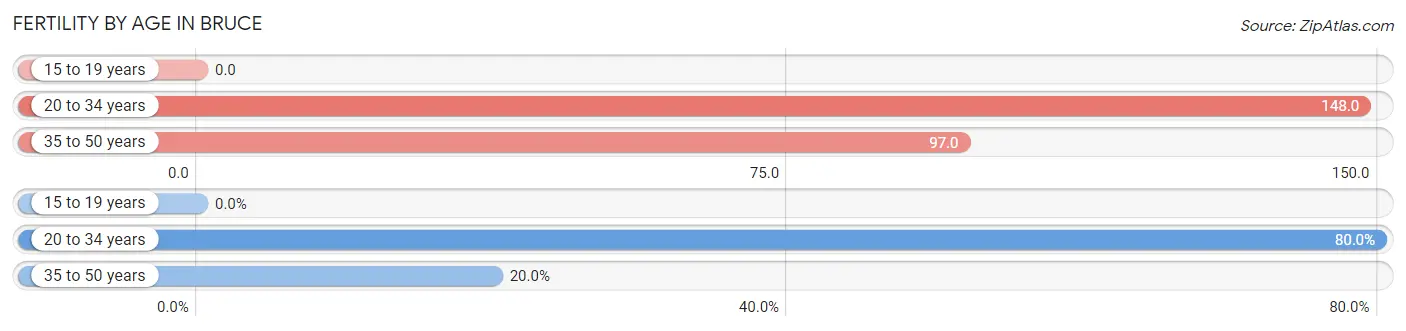
| Age Bracket | Women with Births | Births / 1,000 Women |
| 15 to 19 years | 0 (0.0%) | 0.0 |
| 20 to 34 years | 12 (80.0%) | 148.0 |
| 35 to 50 years | 3 (20.0%) | 97.0 |
| Total | 15 (100.0%) | 114.0 |
Fertility by Age by Marriage Status in Bruce
86.7% of women with births (15) in Bruce are married. The highest percentage of unmarried women with births falls into 20 to 34 years age bracket with 16.7% of them unmarried at the time of birth, while the lowest percentage of unmarried women with births belong to 35 to 50 years age bracket with 0.0% of them unmarried.
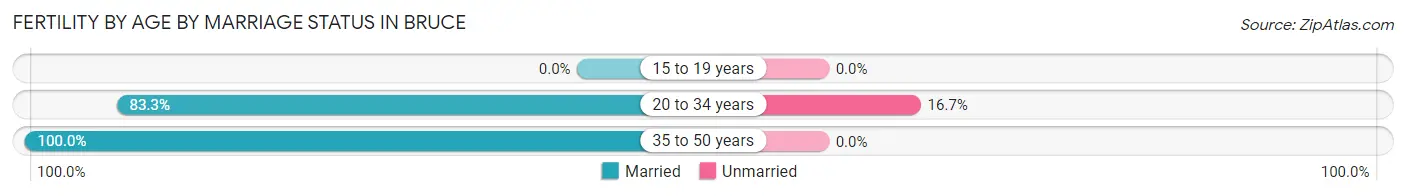
| Age Bracket | Married | Unmarried |
| 15 to 19 years | 0 (0.0%) | 0 (0.0%) |
| 20 to 34 years | 10 (83.3%) | 2 (16.7%) |
| 35 to 50 years | 3 (100.0%) | 0 (0.0%) |
| Total | 13 (86.7%) | 2 (13.3%) |
Fertility by Education in Bruce
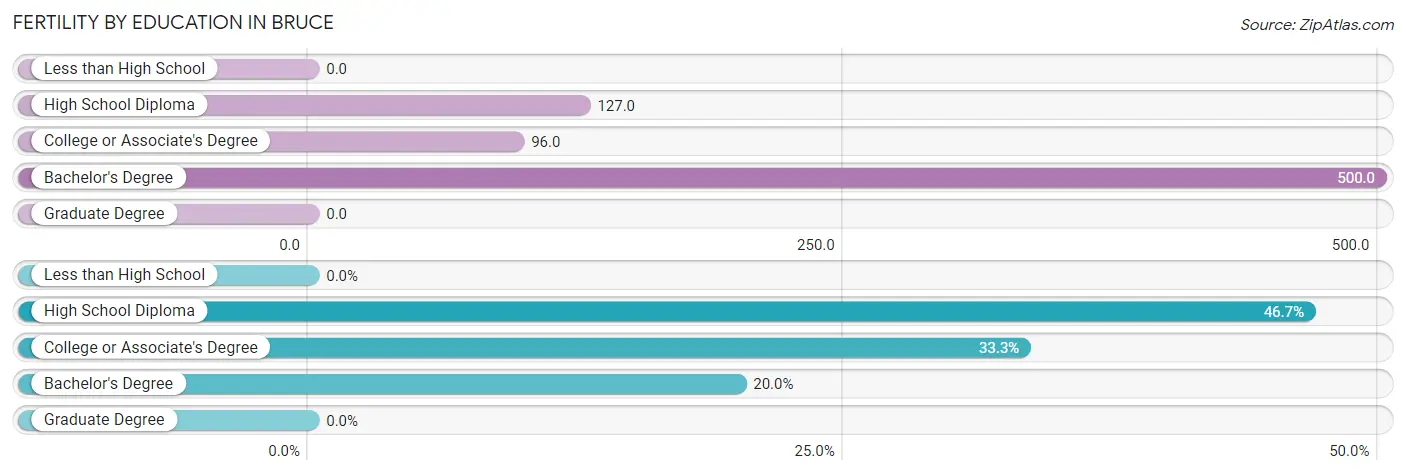
| Educational Attainment | Women with Births | Births / 1,000 Women |
| Less than High School | 0 (0.0%) | 0.0 |
| High School Diploma | 7 (46.7%) | 127.0 |
| College or Associate's Degree | 5 (33.3%) | 96.0 |
| Bachelor's Degree | 3 (20.0%) | 500.0 |
| Graduate Degree | 0 (0.0%) | 0.0 |
| Total | 15 (100.0%) | 114.0 |
Fertility by Education by Marriage Status in Bruce
13.3% of women with births in Bruce are unmarried. Women with the educational attainment of high school diploma are most likely to be married with 100.0% of them married at childbirth, while women with the educational attainment of college or associate's degree are least likely to be married with 40.0% of them unmarried at childbirth.
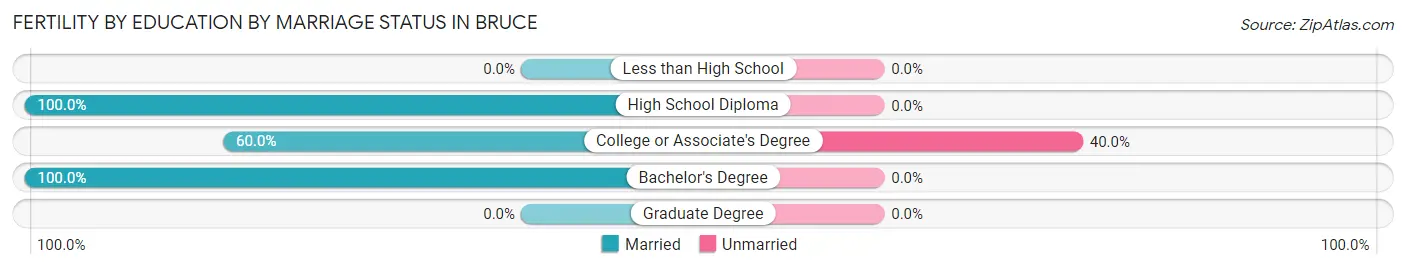
| Educational Attainment | Married | Unmarried |
| Less than High School | 0 (0.0%) | 0 (0.0%) |
| High School Diploma | 7 (100.0%) | 0 (0.0%) |
| College or Associate's Degree | 3 (60.0%) | 2 (40.0%) |
| Bachelor's Degree | 3 (100.0%) | 0 (0.0%) |
| Graduate Degree | 0 (0.0%) | 0 (0.0%) |
| Total | 13 (86.7%) | 2 (13.3%) |
Income in Bruce
Income Overview in Bruce
Per Capita Income in Bruce is $21,170, while median incomes of families and households are $54,792 and $45,938 respectively.
| Characteristic | Number | Measure |
| Per Capita Income | 739 | $21,170 |
| Median Family Income | 151 | $54,792 |
| Mean Family Income | 151 | $60,974 |
| Median Household Income | 285 | $45,938 |
| Mean Household Income | 285 | $51,632 |
| Income Deficit | 151 | $0 |
| Wage / Income Gap (%) | 739 | 35.61% |
| Wage / Income Gap ($) | 739 | 64.39¢ per $1 |
| Gini / Inequality Index | 739 | 0.37 |
Earnings by Sex in Bruce
Average Earnings in Bruce are $35,086, $42,708 for men and $27,500 for women, a difference of 35.6%.
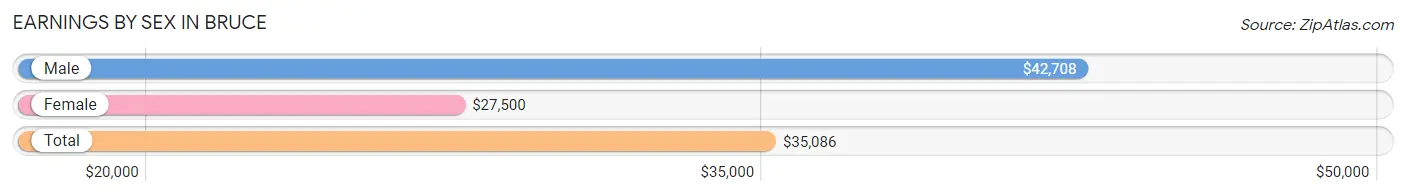
| Sex | Number | Average Earnings |
| Male | 154 (50.3%) | $42,708 |
| Female | 152 (49.7%) | $27,500 |
| Total | 306 (100.0%) | $35,086 |
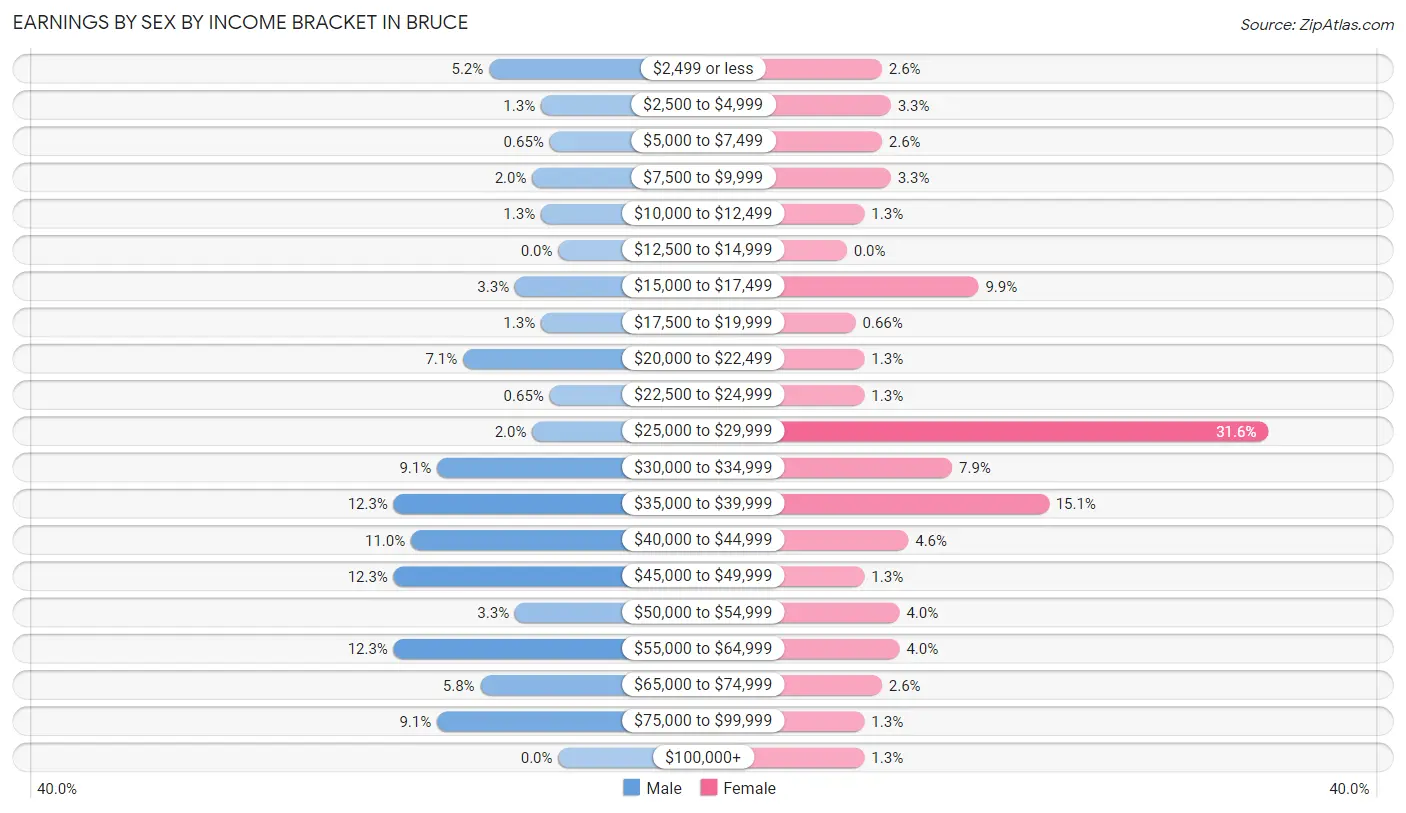
Earnings by Sex by Income Bracket in Bruce
The most common earnings brackets in Bruce are $35,000 to $39,999 for men (19 | 12.3%) and $25,000 to $29,999 for women (48 | 31.6%).
| Income | Male | Female |
| $2,499 or less | 8 (5.2%) | 4 (2.6%) |
| $2,500 to $4,999 | 2 (1.3%) | 5 (3.3%) |
| $5,000 to $7,499 | 1 (0.6%) | 4 (2.6%) |
| $7,500 to $9,999 | 3 (1.9%) | 5 (3.3%) |
| $10,000 to $12,499 | 2 (1.3%) | 2 (1.3%) |
| $12,500 to $14,999 | 0 (0.0%) | 0 (0.0%) |
| $15,000 to $17,499 | 5 (3.3%) | 15 (9.9%) |
| $17,500 to $19,999 | 2 (1.3%) | 1 (0.7%) |
| $20,000 to $22,499 | 11 (7.1%) | 2 (1.3%) |
| $22,500 to $24,999 | 1 (0.6%) | 2 (1.3%) |
| $25,000 to $29,999 | 3 (1.9%) | 48 (31.6%) |
| $30,000 to $34,999 | 14 (9.1%) | 12 (7.9%) |
| $35,000 to $39,999 | 19 (12.3%) | 23 (15.1%) |
| $40,000 to $44,999 | 17 (11.0%) | 7 (4.6%) |
| $45,000 to $49,999 | 19 (12.3%) | 2 (1.3%) |
| $50,000 to $54,999 | 5 (3.3%) | 6 (4.0%) |
| $55,000 to $64,999 | 19 (12.3%) | 6 (4.0%) |
| $65,000 to $74,999 | 9 (5.8%) | 4 (2.6%) |
| $75,000 to $99,999 | 14 (9.1%) | 2 (1.3%) |
| $100,000+ | 0 (0.0%) | 2 (1.3%) |
| Total | 154 (100.0%) | 152 (100.0%) |
Earnings by Sex by Educational Attainment in Bruce
Average earnings in Bruce are $44,792 for men and $28,542 for women, a difference of 36.3%. Men with an educational attainment of high school diploma enjoy the highest average annual earnings of $49,375, while those with bachelor's degree education earn the least with $36,000. Women with an educational attainment of bachelor's degree earn the most with the average annual earnings of $36,667, while those with high school diploma education have the smallest earnings of $26,914.
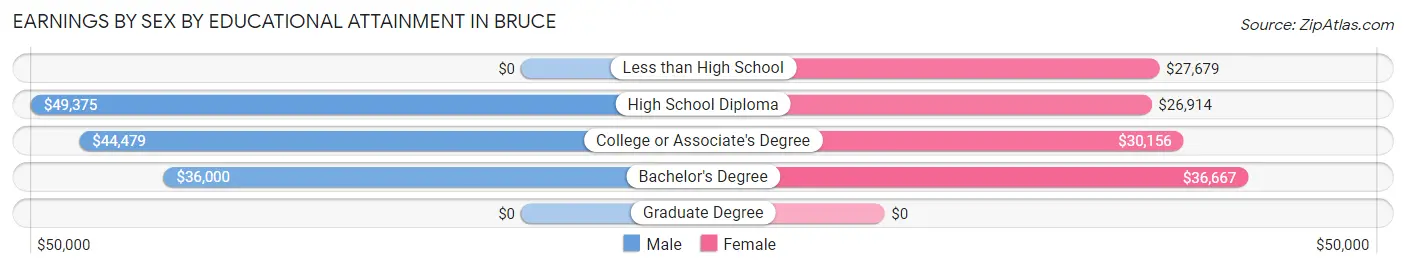
| Educational Attainment | Male Income | Female Income |
| Less than High School | - | - |
| High School Diploma | $49,375 | $26,914 |
| College or Associate's Degree | $44,479 | $30,156 |
| Bachelor's Degree | $36,000 | $36,667 |
| Graduate Degree | - | - |
| Total | $44,792 | $28,542 |
Family Income in Bruce
Family Income Brackets in Bruce
According to the Bruce family income data, there are 43 families falling into the $75,000 to $99,999 income range, which is the most common income bracket and makes up 28.5% of all families.
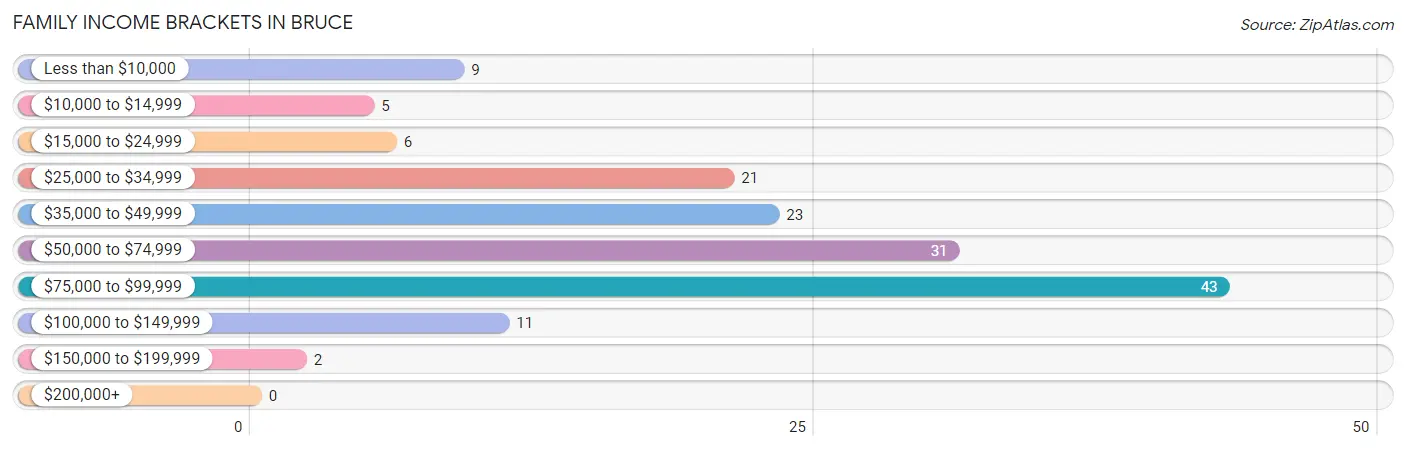
| Income Bracket | # Families | % Families |
| Less than $10,000 | 9 | 6.0% |
| $10,000 to $14,999 | 5 | 3.3% |
| $15,000 to $24,999 | 6 | 4.0% |
| $25,000 to $34,999 | 21 | 13.9% |
| $35,000 to $49,999 | 23 | 15.2% |
| $50,000 to $74,999 | 31 | 20.5% |
| $75,000 to $99,999 | 43 | 28.5% |
| $100,000 to $149,999 | 11 | 7.3% |
| $150,000 to $199,999 | 2 | 1.3% |
| $200,000+ | 0 | 0.0% |
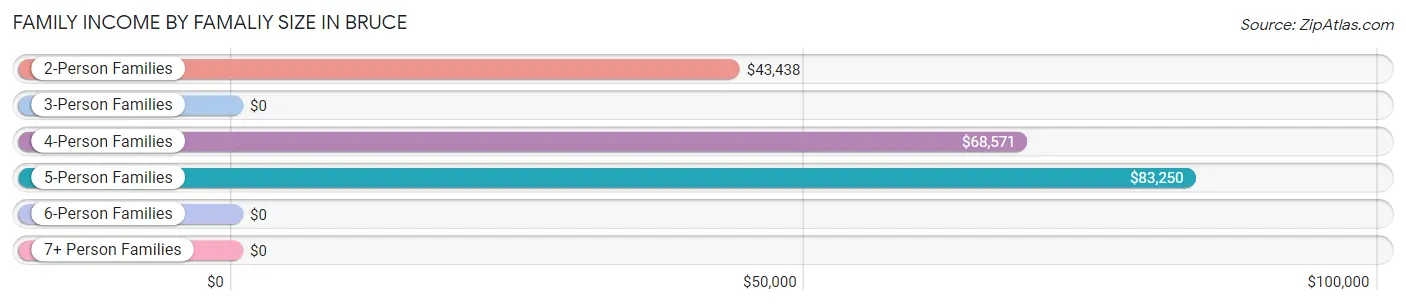
Family Income by Famaliy Size in Bruce
5-person families (14 | 9.3%) account for the highest median family income in Bruce with $83,250 per family, while 2-person families (65 | 43.0%) have the highest median income of $21,719 per family member.
| Income Bracket | # Families | Median Income |
| 2-Person Families | 65 (43.0%) | $43,438 |
| 3-Person Families | 26 (17.2%) | $0 |
| 4-Person Families | 38 (25.2%) | $68,571 |
| 5-Person Families | 14 (9.3%) | $83,250 |
| 6-Person Families | 8 (5.3%) | $0 |
| 7+ Person Families | 0 (0.0%) | $0 |
| Total | 151 (100.0%) | $54,792 |
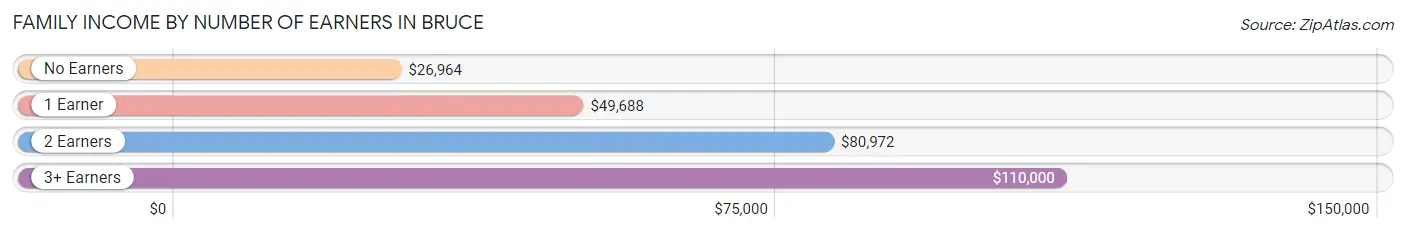
Family Income by Number of Earners in Bruce
The median family income in Bruce is $54,792, with families comprising 3+ earners (6) having the highest median family income of $110,000, while families with no earners (45) have the lowest median family income of $26,964, accounting for 4.0% and 29.8% of families, respectively.
| Number of Earners | # Families | Median Income |
| No Earners | 45 (29.8%) | $26,964 |
| 1 Earner | 57 (37.8%) | $49,688 |
| 2 Earners | 43 (28.5%) | $80,972 |
| 3+ Earners | 6 (4.0%) | $110,000 |
| Total | 151 (100.0%) | $54,792 |
Household Income in Bruce
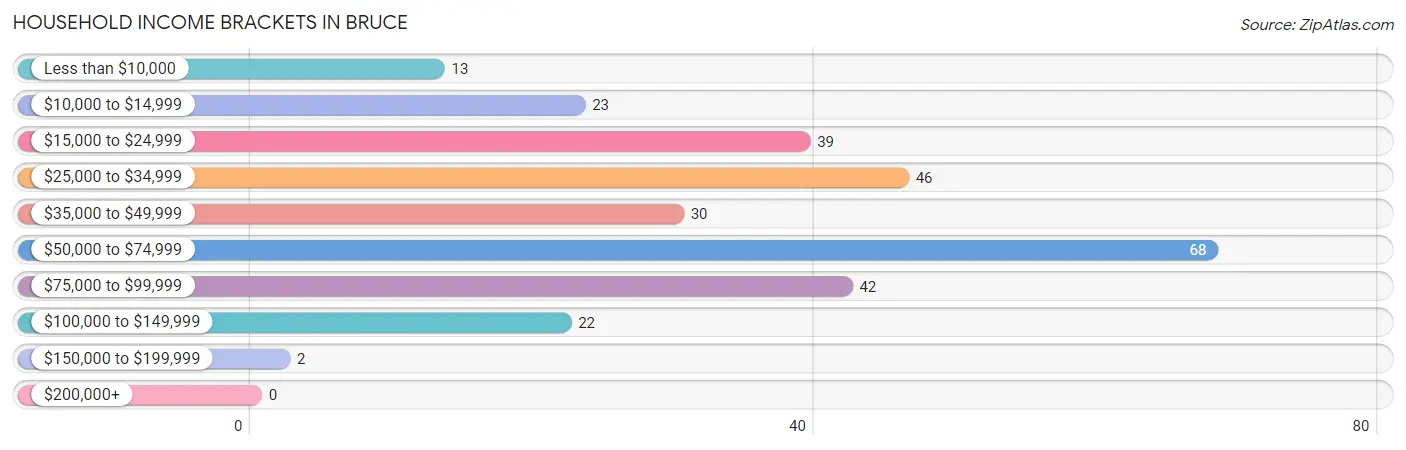
Household Income Brackets in Bruce
With 68 households falling in the category, the $50,000 to $74,999 income range is the most frequent in Bruce, accounting for 23.9% of all households.
| Income Bracket | # Households | % Households |
| Less than $10,000 | 13 | 4.6% |
| $10,000 to $14,999 | 23 | 8.1% |
| $15,000 to $24,999 | 39 | 13.7% |
| $25,000 to $34,999 | 46 | 16.1% |
| $35,000 to $49,999 | 30 | 10.5% |
| $50,000 to $74,999 | 68 | 23.9% |
| $75,000 to $99,999 | 42 | 14.7% |
| $100,000 to $149,999 | 22 | 7.7% |
| $150,000 to $199,999 | 2 | 0.7% |
| $200,000+ | 0 | 0.0% |
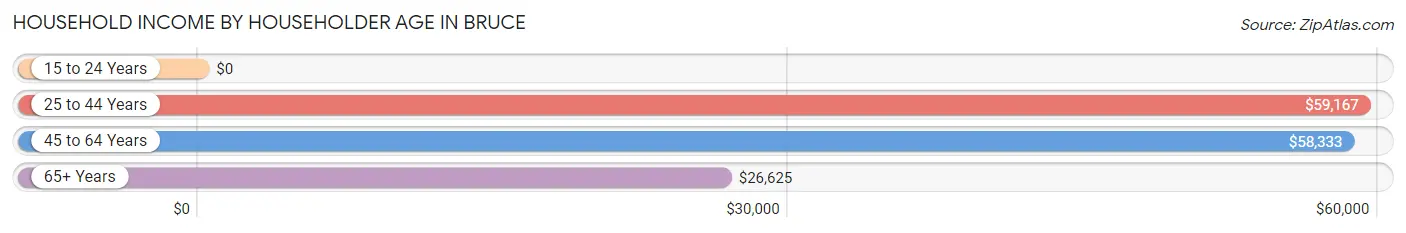
Household Income by Householder Age in Bruce
The median household income in Bruce is $45,938, with the highest median household income of $59,167 found in the 25 to 44 years age bracket for the primary householder. A total of 72 households (25.3%) fall into this category.
| Income Bracket | # Households | Median Income |
| 15 to 24 Years | 0 (0.0%) | $0 |
| 25 to 44 Years | 72 (25.3%) | $59,167 |
| 45 to 64 Years | 116 (40.7%) | $58,333 |
| 65+ Years | 97 (34.0%) | $26,625 |
| Total | 285 (100.0%) | $45,938 |
Poverty in Bruce
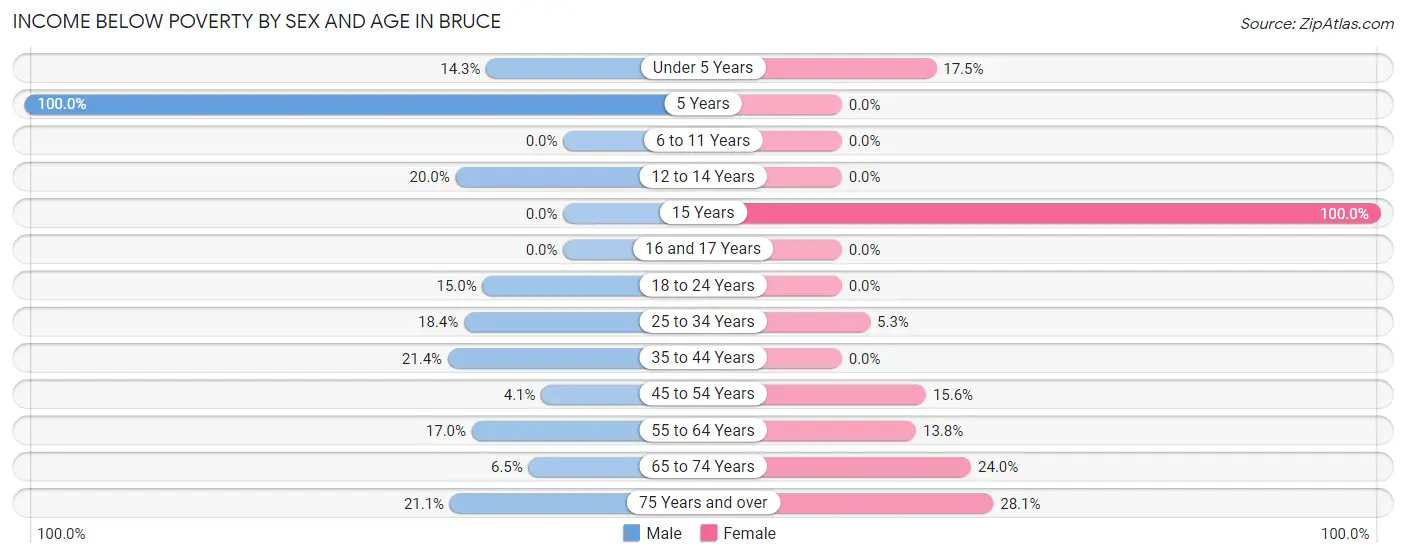
Income Below Poverty by Sex and Age in Bruce
With 13.4% poverty level for males and 13.6% for females among the residents of Bruce, 5 year old males and 15 year old females are the most vulnerable to poverty, with 5 males (100.0%) and 4 females (100.0%) in their respective age groups living below the poverty level.
| Age Bracket | Male | Female |
| Under 5 Years | 4 (14.3%) | 10 (17.5%) |
| 5 Years | 5 (100.0%) | 0 (0.0%) |
| 6 to 11 Years | 0 (0.0%) | 0 (0.0%) |
| 12 to 14 Years | 3 (20.0%) | 0 (0.0%) |
| 15 Years | 0 (0.0%) | 4 (100.0%) |
| 16 and 17 Years | 0 (0.0%) | 0 (0.0%) |
| 18 to 24 Years | 3 (15.0%) | 0 (0.0%) |
| 25 to 34 Years | 7 (18.4%) | 4 (5.3%) |
| 35 to 44 Years | 6 (21.4%) | 0 (0.0%) |
| 45 to 54 Years | 2 (4.1%) | 10 (15.6%) |
| 55 to 64 Years | 9 (17.0%) | 4 (13.8%) |
| 65 to 74 Years | 2 (6.5%) | 12 (24.0%) |
| 75 Years and over | 4 (21.0%) | 9 (28.1%) |
| Total | 45 (13.4%) | 53 (13.6%) |
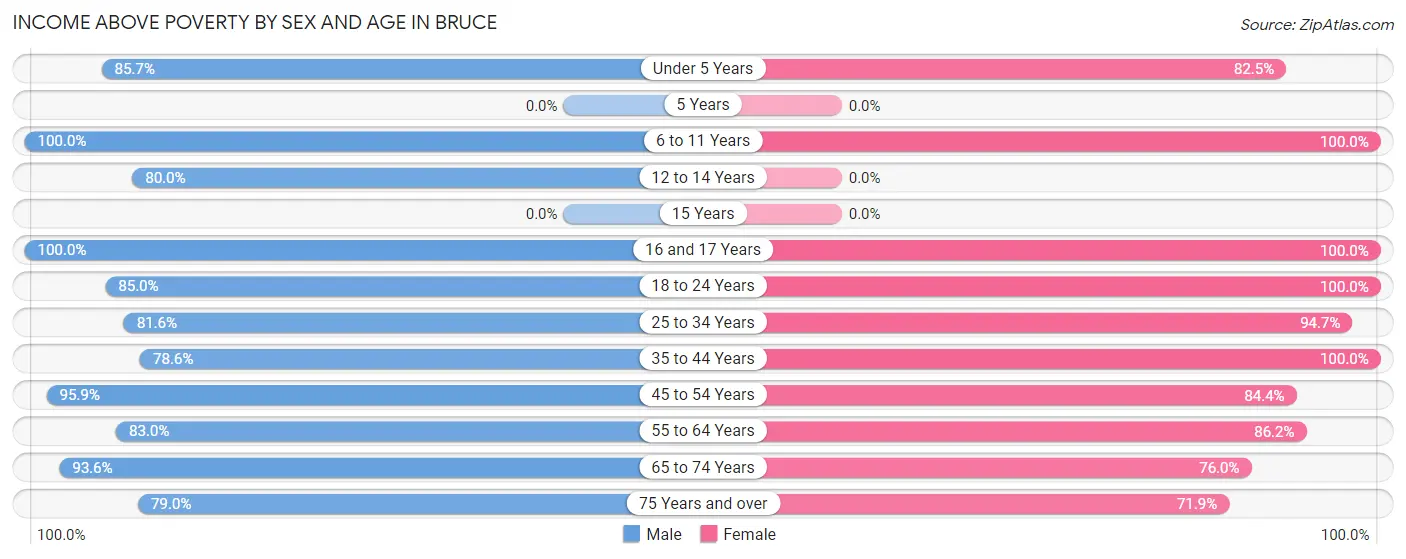
Income Above Poverty by Sex and Age in Bruce
According to the poverty statistics in Bruce, males aged 6 to 11 years and females aged 6 to 11 years are the age groups that are most secure financially, with 100.0% of males and 100.0% of females in these age groups living above the poverty line.
| Age Bracket | Male | Female |
| Under 5 Years | 24 (85.7%) | 47 (82.5%) |
| 5 Years | 0 (0.0%) | 0 (0.0%) |
| 6 to 11 Years | 38 (100.0%) | 46 (100.0%) |
| 12 to 14 Years | 12 (80.0%) | 0 (0.0%) |
| 15 Years | 0 (0.0%) | 0 (0.0%) |
| 16 and 17 Years | 12 (100.0%) | 6 (100.0%) |
| 18 to 24 Years | 17 (85.0%) | 15 (100.0%) |
| 25 to 34 Years | 31 (81.6%) | 72 (94.7%) |
| 35 to 44 Years | 22 (78.6%) | 12 (100.0%) |
| 45 to 54 Years | 47 (95.9%) | 54 (84.4%) |
| 55 to 64 Years | 44 (83.0%) | 25 (86.2%) |
| 65 to 74 Years | 29 (93.5%) | 38 (76.0%) |
| 75 Years and over | 15 (78.9%) | 23 (71.9%) |
| Total | 291 (86.6%) | 338 (86.5%) |
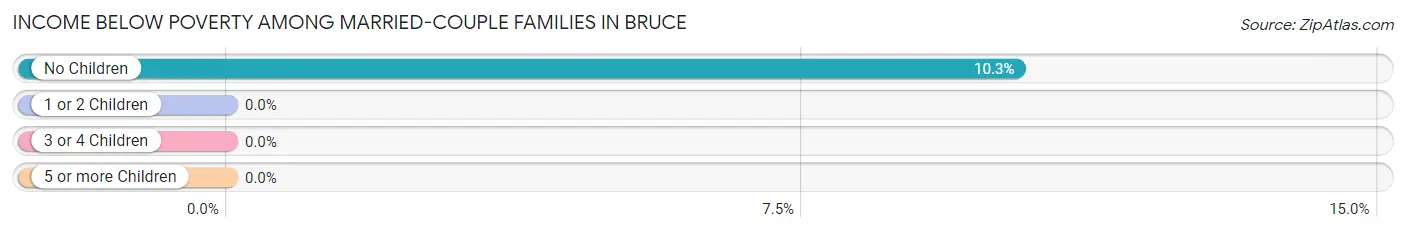
Income Below Poverty Among Married-Couple Families in Bruce
The poverty statistics for married-couple families in Bruce show that 6.2% or 7 of the total 112 families live below the poverty line. Families with no children have the highest poverty rate of 10.3%, comprising of 7 families. On the other hand, families with 1 or 2 children have the lowest poverty rate of 0.0%, which includes 0 families.
| Children | Above Poverty | Below Poverty |
| No Children | 61 (89.7%) | 7 (10.3%) |
| 1 or 2 Children | 24 (100.0%) | 0 (0.0%) |
| 3 or 4 Children | 20 (100.0%) | 0 (0.0%) |
| 5 or more Children | 0 (0.0%) | 0 (0.0%) |
| Total | 105 (93.8%) | 7 (6.2%) |
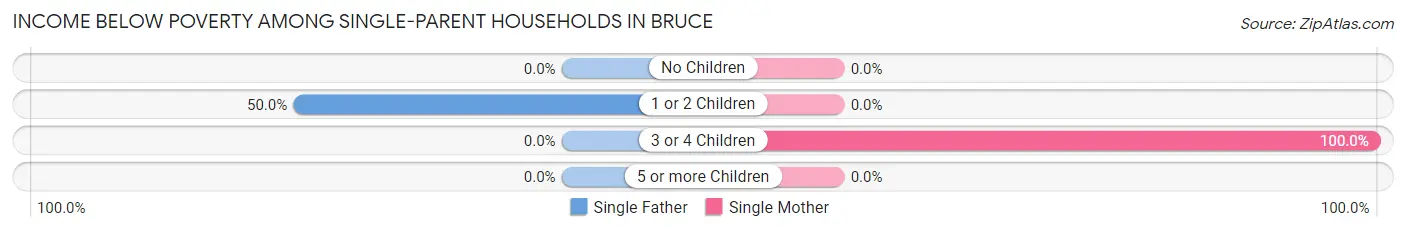
Income Below Poverty Among Single-Parent Households in Bruce
According to the poverty data in Bruce, 25.0% or 7 single-father households and 18.2% or 2 single-mother households are living below the poverty line. Among single-father households, those with 1 or 2 children have the highest poverty rate, with 7 households (50.0%) experiencing poverty. Likewise, among single-mother households, those with 3 or 4 children have the highest poverty rate, with 2 households (100.0%) falling below the poverty line.
| Children | Single Father | Single Mother |
| No Children | 0 (0.0%) | 0 (0.0%) |
| 1 or 2 Children | 7 (50.0%) | 0 (0.0%) |
| 3 or 4 Children | 0 (0.0%) | 2 (100.0%) |
| 5 or more Children | 0 (0.0%) | 0 (0.0%) |
| Total | 7 (25.0%) | 2 (18.2%) |
Income Below Poverty Among Married-Couple vs Single-Parent Households in Bruce
The poverty data for Bruce shows that 7 of the married-couple family households (6.2%) and 9 of the single-parent households (23.1%) are living below the poverty level. Within the married-couple family households, those with no children have the highest poverty rate, with 7 households (10.3%) falling below the poverty line. Among the single-parent households, those with 1 or 2 children have the highest poverty rate, with 7 household (36.8%) living below poverty.
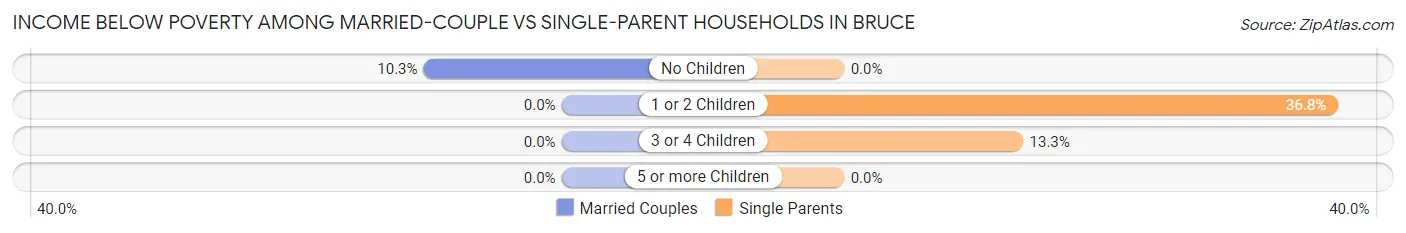
| Children | Married-Couple Families | Single-Parent Households |
| No Children | 7 (10.3%) | 0 (0.0%) |
| 1 or 2 Children | 0 (0.0%) | 7 (36.8%) |
| 3 or 4 Children | 0 (0.0%) | 2 (13.3%) |
| 5 or more Children | 0 (0.0%) | 0 (0.0%) |
| Total | 7 (6.2%) | 9 (23.1%) |
Employment Characteristics in Bruce
Employment by Class of Employer in Bruce
Among the 247 employed individuals in Bruce, private company employees (179 | 72.5%), local government employees (23 | 9.3%), and not-for-profit organizations (14 | 5.7%) make up the most common classes of employment.
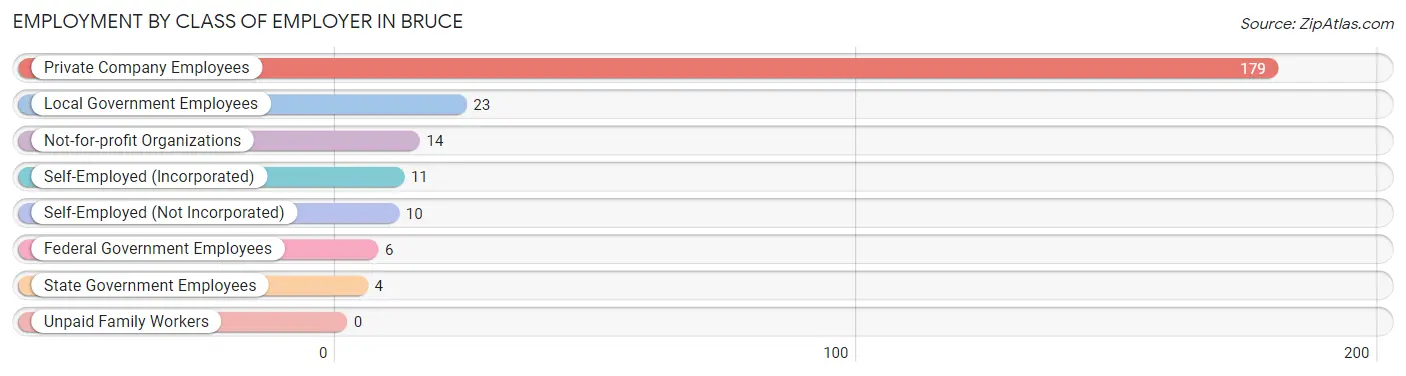
| Employer Class | # Employees | % Employees |
| Private Company Employees | 179 | 72.5% |
| Self-Employed (Incorporated) | 11 | 4.4% |
| Self-Employed (Not Incorporated) | 10 | 4.1% |
| Not-for-profit Organizations | 14 | 5.7% |
| Local Government Employees | 23 | 9.3% |
| State Government Employees | 4 | 1.6% |
| Federal Government Employees | 6 | 2.4% |
| Unpaid Family Workers | 0 | 0.0% |
| Total | 247 | 100.0% |
Employment Status by Age in Bruce
According to the labor force statistics for Bruce, out of the total population over 16 years of age (534), 54.1% or 289 individuals are in the labor force, with 2.8% or 8 of them unemployed. The age group with the highest labor force participation rate is 20 to 24 years, with 92.9% or 13 individuals in the labor force. Within the labor force, the 25 to 29 years age range has the highest percentage of unemployed individuals, with 31.3% or 5 of them being unemployed.
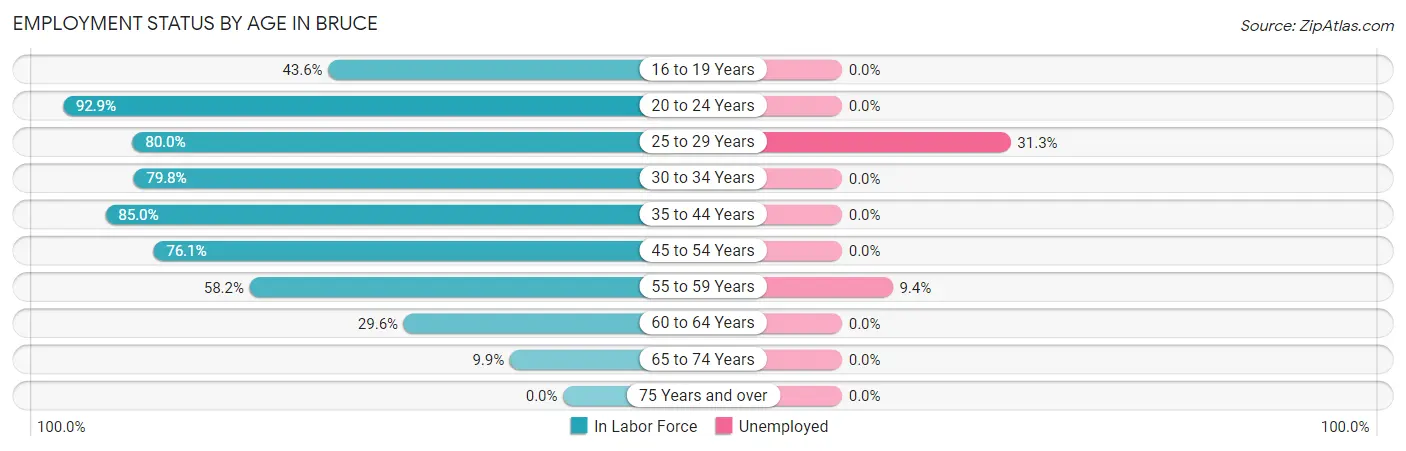
| Age Bracket | In Labor Force | Unemployed |
| 16 to 19 Years | 17 (43.6%) | 0 (0.0%) |
| 20 to 24 Years | 13 (92.9%) | 0 (0.0%) |
| 25 to 29 Years | 16 (80.0%) | 5 (31.3%) |
| 30 to 34 Years | 75 (79.8%) | 0 (0.0%) |
| 35 to 44 Years | 34 (85.0%) | 0 (0.0%) |
| 45 to 54 Years | 86 (76.1%) | 0 (0.0%) |
| 55 to 59 Years | 32 (58.2%) | 3 (9.4%) |
| 60 to 64 Years | 8 (29.6%) | 0 (0.0%) |
| 65 to 74 Years | 8 (9.9%) | 0 (0.0%) |
| 75 Years and over | 0 (0.0%) | 0 (0.0%) |
| Total | 289 (54.1%) | 8 (2.8%) |
Employment Status by Educational Attainment in Bruce
According to labor force statistics for Bruce, 71.9% of individuals (251) out of the total population between 25 and 64 years of age (349) are in the labor force, with 3.2% or 8 of them being unemployed. The group with the highest labor force participation rate are those with the educational attainment of high school diploma, with 80.0% or 100 individuals in the labor force. Within the labor force, individuals with high school diploma education have the highest percentage of unemployment, with 7.0% or 7 of them being unemployed.
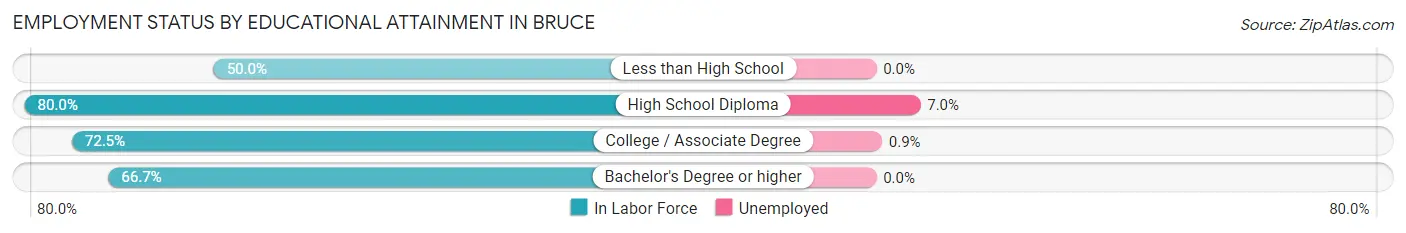
| Educational Attainment | In Labor Force | Unemployed |
| Less than High School | 22 (50.0%) | 0 (0.0%) |
| High School Diploma | 100 (80.0%) | 9 (7.0%) |
| College / Associate Degree | 111 (72.5%) | 1 (0.9%) |
| Bachelor's Degree or higher | 18 (66.7%) | 0 (0.0%) |
| Total | 251 (71.9%) | 11 (3.2%) |
Employment Occupations by Sex in Bruce
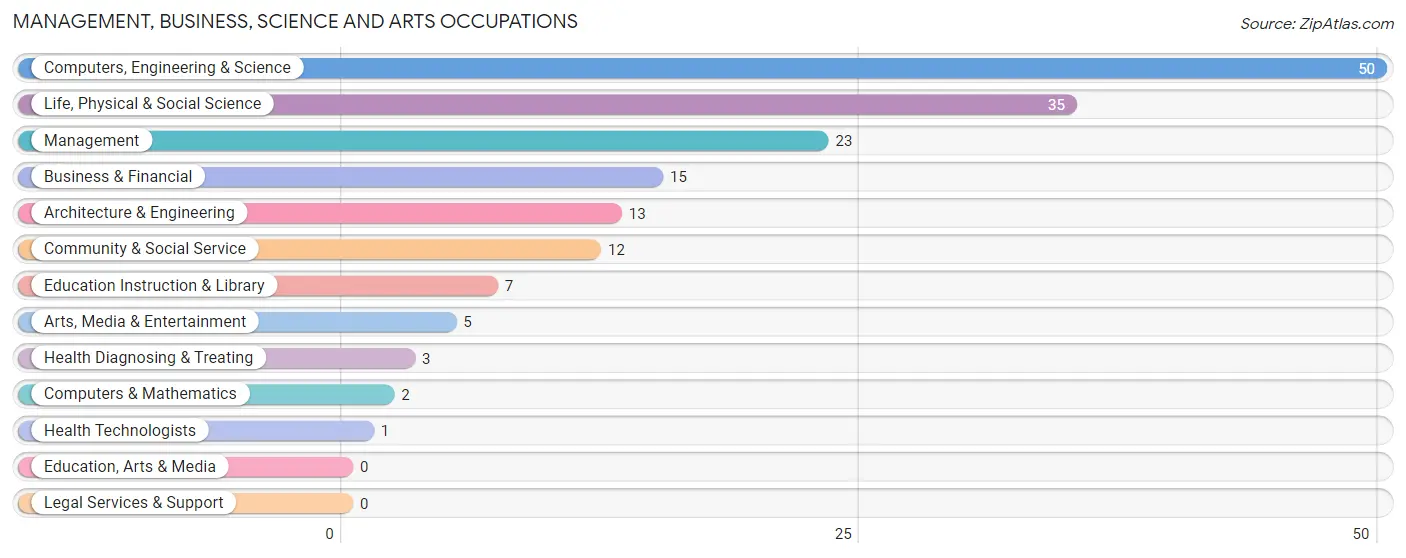
Management, Business, Science and Arts Occupations
The most common Management, Business, Science and Arts occupations in Bruce are Computers, Engineering & Science (50 | 17.8%), Life, Physical & Social Science (35 | 12.5%), Management (23 | 8.2%), Business & Financial (15 | 5.3%), and Architecture & Engineering (13 | 4.6%).
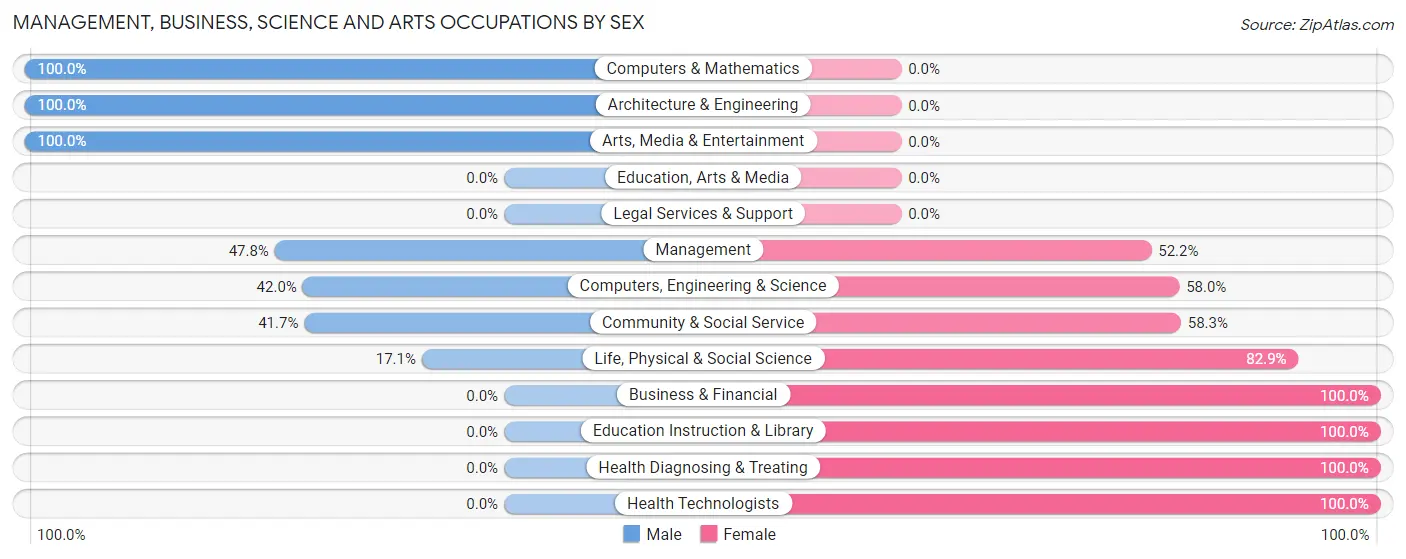
Management, Business, Science and Arts Occupations by Sex
Within the Management, Business, Science and Arts occupations in Bruce, the most male-oriented occupations are Computers & Mathematics (100.0%), Architecture & Engineering (100.0%), and Arts, Media & Entertainment (100.0%), while the most female-oriented occupations are Business & Financial (100.0%), Education Instruction & Library (100.0%), and Health Diagnosing & Treating (100.0%).
| Occupation | Male | Female |
| Management | 11 (47.8%) | 12 (52.2%) |
| Business & Financial | 0 (0.0%) | 15 (100.0%) |
| Computers, Engineering & Science | 21 (42.0%) | 29 (58.0%) |
| Computers & Mathematics | 2 (100.0%) | 0 (0.0%) |
| Architecture & Engineering | 13 (100.0%) | 0 (0.0%) |
| Life, Physical & Social Science | 6 (17.1%) | 29 (82.9%) |
| Community & Social Service | 5 (41.7%) | 7 (58.3%) |
| Education, Arts & Media | 0 (0.0%) | 0 (0.0%) |
| Legal Services & Support | 0 (0.0%) | 0 (0.0%) |
| Education Instruction & Library | 0 (0.0%) | 7 (100.0%) |
| Arts, Media & Entertainment | 5 (100.0%) | 0 (0.0%) |
| Health Diagnosing & Treating | 0 (0.0%) | 3 (100.0%) |
| Health Technologists | 0 (0.0%) | 1 (100.0%) |
| Total (Category) | 37 (35.9%) | 66 (64.1%) |
| Total (Overall) | 134 (47.7%) | 147 (52.3%) |
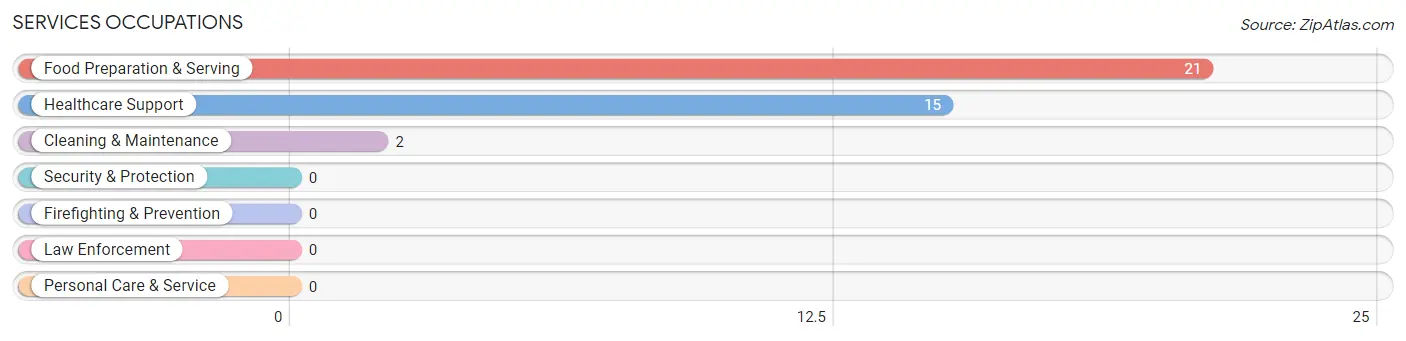
Services Occupations
The most common Services occupations in Bruce are Food Preparation & Serving (21 | 7.5%), Healthcare Support (15 | 5.3%), and Cleaning & Maintenance (2 | 0.7%).
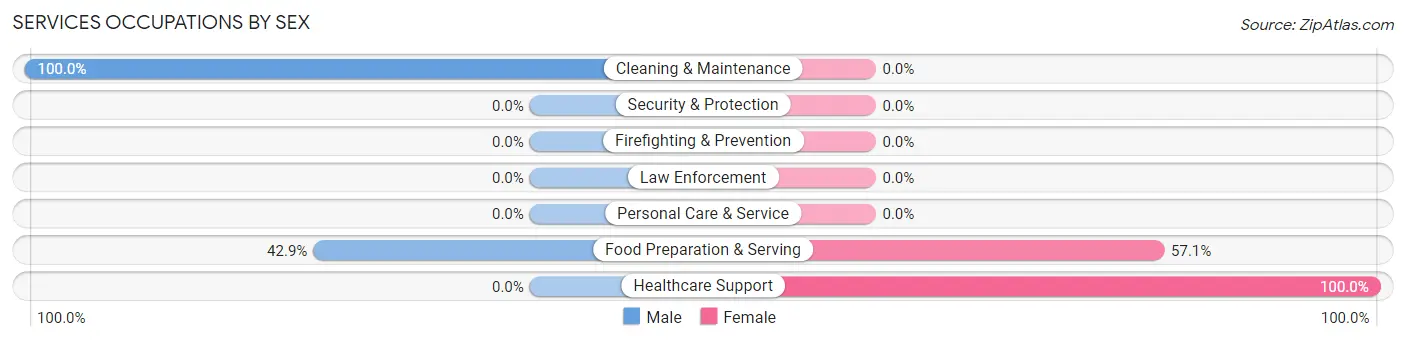
Services Occupations by Sex
Within the Services occupations in Bruce, the most male-oriented occupations are Cleaning & Maintenance (100.0%), and Food Preparation & Serving (42.9%), while the most female-oriented occupations are Healthcare Support (100.0%), and Food Preparation & Serving (57.1%).
| Occupation | Male | Female |
| Healthcare Support | 0 (0.0%) | 15 (100.0%) |
| Security & Protection | 0 (0.0%) | 0 (0.0%) |
| Firefighting & Prevention | 0 (0.0%) | 0 (0.0%) |
| Law Enforcement | 0 (0.0%) | 0 (0.0%) |
| Food Preparation & Serving | 9 (42.9%) | 12 (57.1%) |
| Cleaning & Maintenance | 2 (100.0%) | 0 (0.0%) |
| Personal Care & Service | 0 (0.0%) | 0 (0.0%) |
| Total (Category) | 11 (28.9%) | 27 (71.1%) |
| Total (Overall) | 134 (47.7%) | 147 (52.3%) |
Sales and Office Occupations
The most common Sales and Office occupations in Bruce are Office & Administration (28 | 10.0%), and Sales & Related (20 | 7.1%).

Sales and Office Occupations by Sex

| Occupation | Male | Female |
| Sales & Related | 5 (25.0%) | 15 (75.0%) |
| Office & Administration | 3 (10.7%) | 25 (89.3%) |
| Total (Category) | 8 (16.7%) | 40 (83.3%) |
| Total (Overall) | 134 (47.7%) | 147 (52.3%) |
Natural Resources, Construction and Maintenance Occupations
The most common Natural Resources, Construction and Maintenance occupations in Bruce are Construction & Extraction (14 | 5.0%), Installation, Maintenance & Repair (12 | 4.3%), and Farming, Fishing & Forestry (2 | 0.7%).
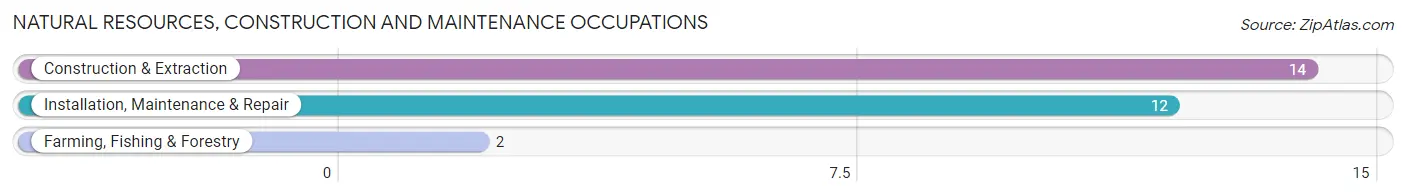
Natural Resources, Construction and Maintenance Occupations by Sex
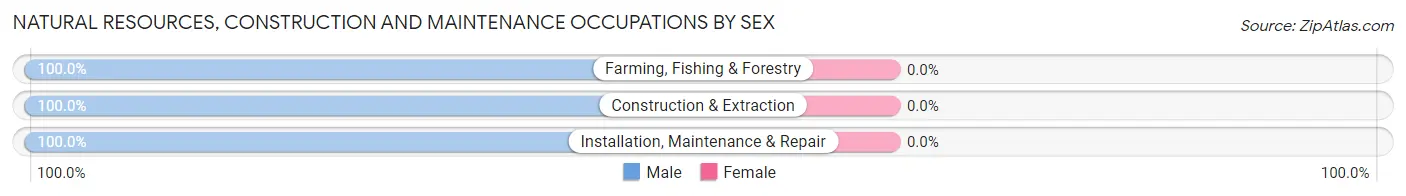
| Occupation | Male | Female |
| Farming, Fishing & Forestry | 2 (100.0%) | 0 (0.0%) |
| Construction & Extraction | 14 (100.0%) | 0 (0.0%) |
| Installation, Maintenance & Repair | 12 (100.0%) | 0 (0.0%) |
| Total (Category) | 28 (100.0%) | 0 (0.0%) |
| Total (Overall) | 134 (47.7%) | 147 (52.3%) |
Production, Transportation and Moving Occupations
The most common Production, Transportation and Moving occupations in Bruce are Material Moving (30 | 10.7%), Production (22 | 7.8%), and Transportation (12 | 4.3%).
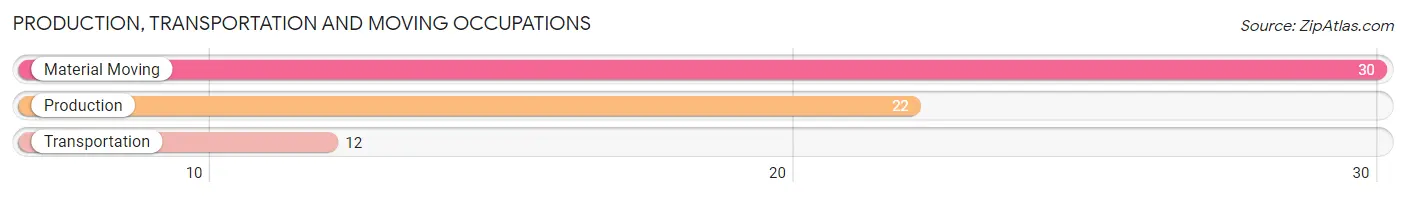
Production, Transportation and Moving Occupations by Sex
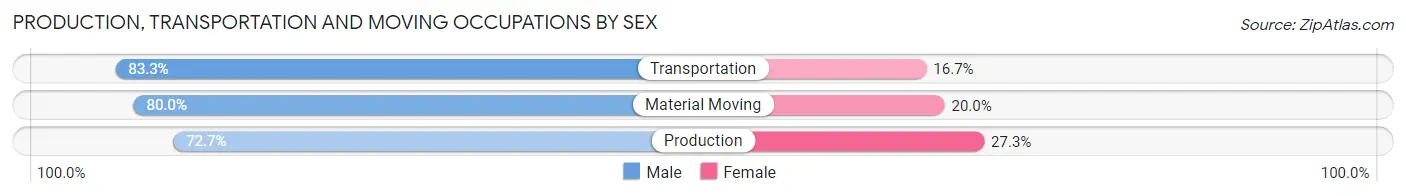
| Occupation | Male | Female |
| Production | 16 (72.7%) | 6 (27.3%) |
| Transportation | 10 (83.3%) | 2 (16.7%) |
| Material Moving | 24 (80.0%) | 6 (20.0%) |
| Total (Category) | 50 (78.1%) | 14 (21.9%) |
| Total (Overall) | 134 (47.7%) | 147 (52.3%) |
Employment Industries by Sex in Bruce
Employment Industries in Bruce
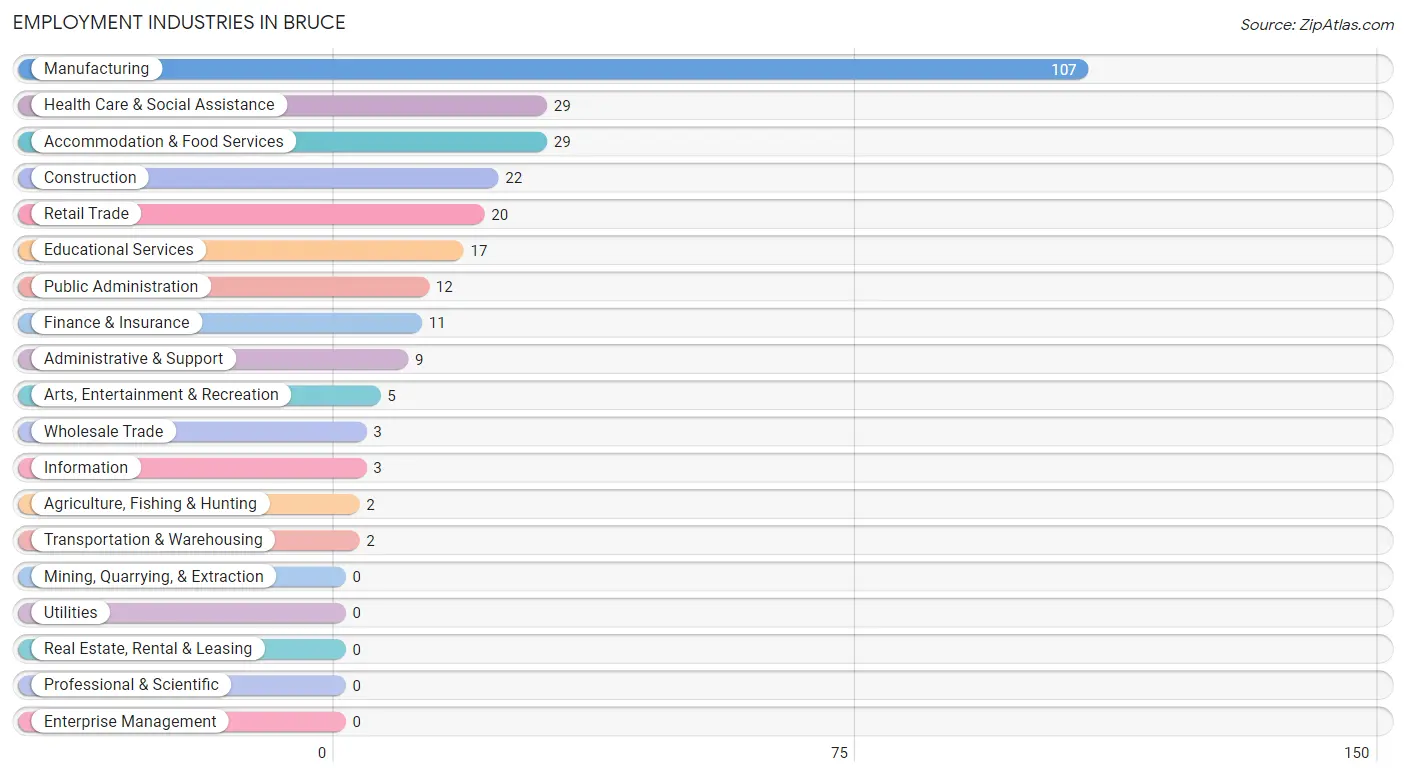
The major employment industries in Bruce include Manufacturing (107 | 38.1%), Health Care & Social Assistance (29 | 10.3%), Accommodation & Food Services (29 | 10.3%), Construction (22 | 7.8%), and Retail Trade (20 | 7.1%).
Employment Industries by Sex in Bruce
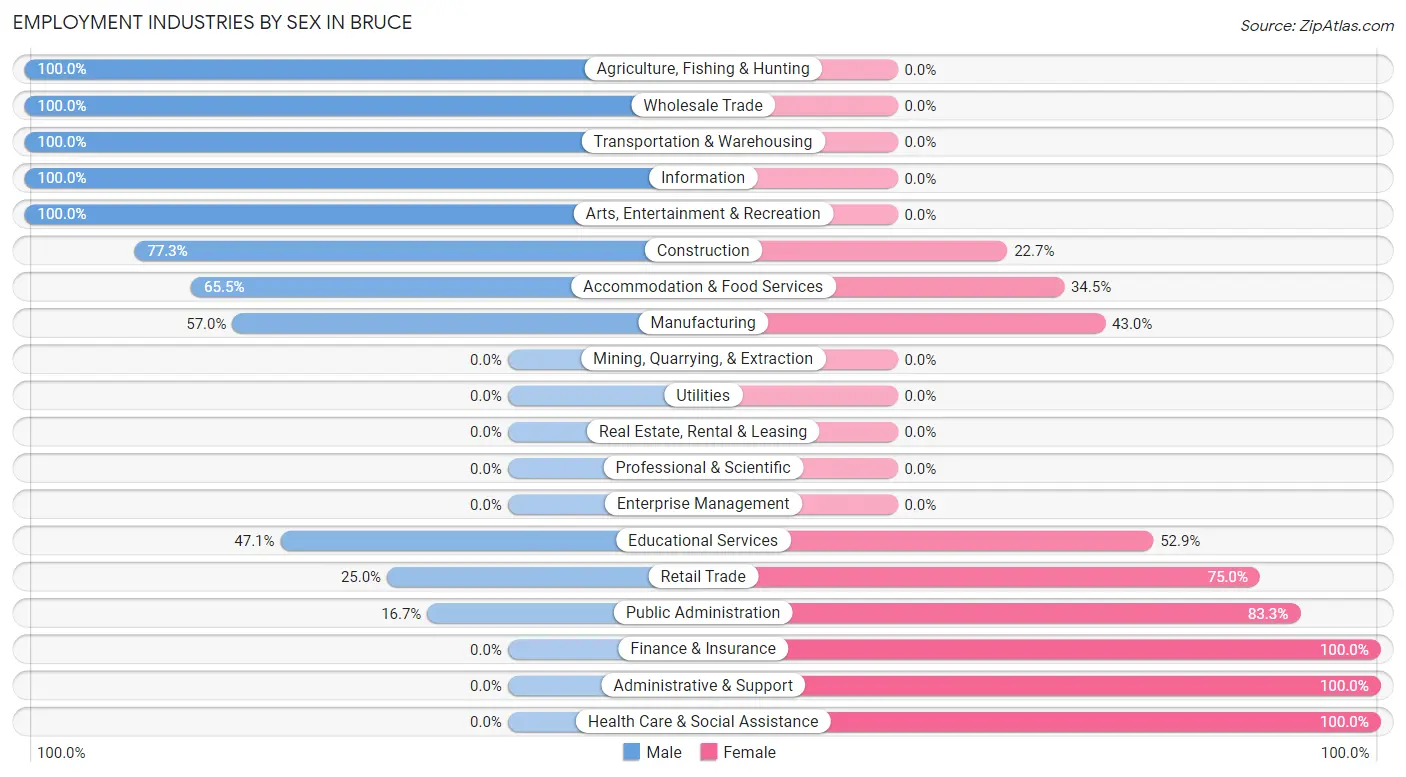
The Bruce industries that see more men than women are Agriculture, Fishing & Hunting (100.0%), Wholesale Trade (100.0%), and Transportation & Warehousing (100.0%), whereas the industries that tend to have a higher number of women are Finance & Insurance (100.0%), Administrative & Support (100.0%), and Health Care & Social Assistance (100.0%).
| Industry | Male | Female |
| Agriculture, Fishing & Hunting | 2 (100.0%) | 0 (0.0%) |
| Mining, Quarrying, & Extraction | 0 (0.0%) | 0 (0.0%) |
| Construction | 17 (77.3%) | 5 (22.7%) |
| Manufacturing | 61 (57.0%) | 46 (43.0%) |
| Wholesale Trade | 3 (100.0%) | 0 (0.0%) |
| Retail Trade | 5 (25.0%) | 15 (75.0%) |
| Transportation & Warehousing | 2 (100.0%) | 0 (0.0%) |
| Utilities | 0 (0.0%) | 0 (0.0%) |
| Information | 3 (100.0%) | 0 (0.0%) |
| Finance & Insurance | 0 (0.0%) | 11 (100.0%) |
| Real Estate, Rental & Leasing | 0 (0.0%) | 0 (0.0%) |
| Professional & Scientific | 0 (0.0%) | 0 (0.0%) |
| Enterprise Management | 0 (0.0%) | 0 (0.0%) |
| Administrative & Support | 0 (0.0%) | 9 (100.0%) |
| Educational Services | 8 (47.1%) | 9 (52.9%) |
| Health Care & Social Assistance | 0 (0.0%) | 29 (100.0%) |
| Arts, Entertainment & Recreation | 5 (100.0%) | 0 (0.0%) |
| Accommodation & Food Services | 19 (65.5%) | 10 (34.5%) |
| Public Administration | 2 (16.7%) | 10 (83.3%) |
| Total | 134 (47.7%) | 147 (52.3%) |
Education in Bruce
School Enrollment in Bruce
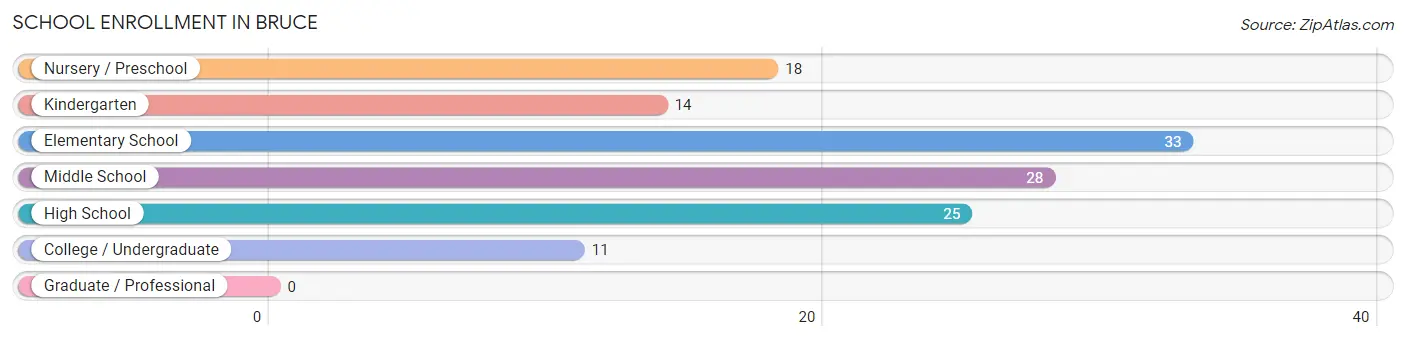
The most common levels of schooling among the 129 students in Bruce are elementary school (33 | 25.6%), middle school (28 | 21.7%), and high school (25 | 19.4%).
| School Level | # Students | % Students |
| Nursery / Preschool | 18 | 14.0% |
| Kindergarten | 14 | 10.8% |
| Elementary School | 33 | 25.6% |
| Middle School | 28 | 21.7% |
| High School | 25 | 19.4% |
| College / Undergraduate | 11 | 8.5% |
| Graduate / Professional | 0 | 0.0% |
| Total | 129 | 100.0% |
School Enrollment by Age by Funding Source in Bruce
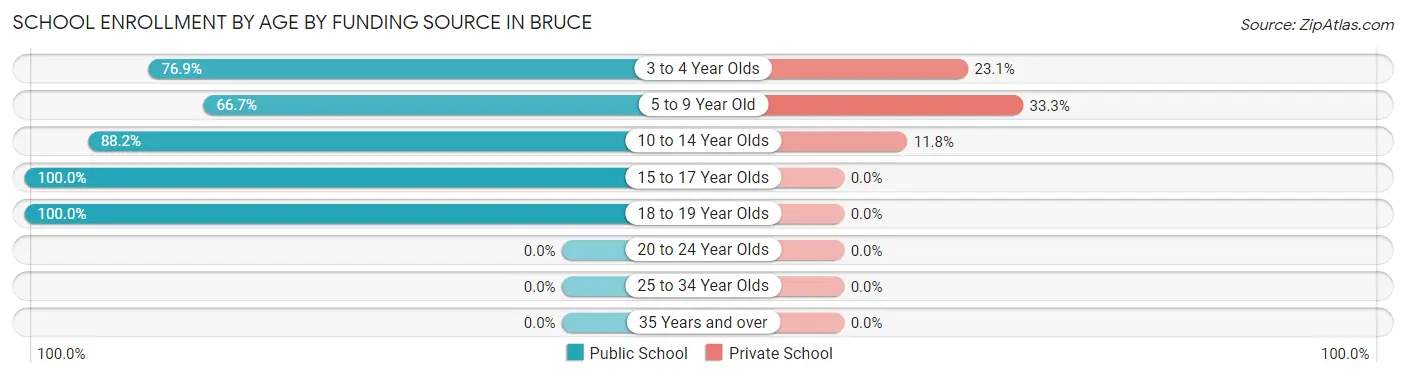
Out of a total of 129 students who are enrolled in schools in Bruce, 23 (17.8%) attend a private institution, while the remaining 106 (82.2%) are enrolled in public schools. The age group of 5 to 9 year old has the highest likelihood of being enrolled in private schools, with 16 (33.3% in the age bracket) enrolled. Conversely, the age group of 15 to 17 year olds has the lowest likelihood of being enrolled in a private school, with 22 (100.0% in the age bracket) attending a public institution.
| Age Bracket | Public School | Private School |
| 3 to 4 Year Olds | 10 (76.9%) | 3 (23.1%) |
| 5 to 9 Year Old | 32 (66.7%) | 16 (33.3%) |
| 10 to 14 Year Olds | 30 (88.2%) | 4 (11.8%) |
| 15 to 17 Year Olds | 22 (100.0%) | 0 (0.0%) |
| 18 to 19 Year Olds | 12 (100.0%) | 0 (0.0%) |
| 20 to 24 Year Olds | 0 (0.0%) | 0 (0.0%) |
| 25 to 34 Year Olds | 0 (0.0%) | 0 (0.0%) |
| 35 Years and over | 0 (0.0%) | 0 (0.0%) |
| Total | 106 (82.2%) | 23 (17.8%) |
Educational Attainment by Field of Study in Bruce
Education (17 | 28.8%), business (11 | 18.6%), communications (6 | 10.2%), bio, nature & agricultural (5 | 8.5%), and physical & health sciences (5 | 8.5%) are the most common fields of study among 59 individuals in Bruce who have obtained a bachelor's degree or higher.
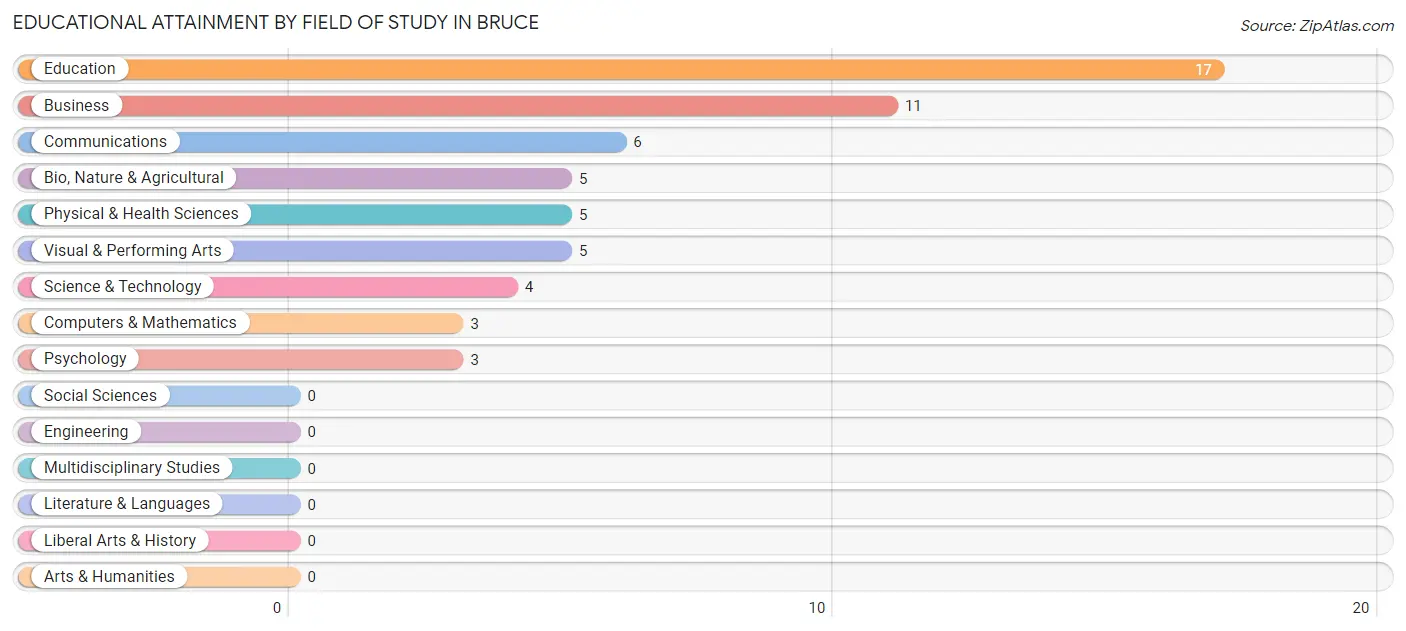
| Field of Study | # Graduates | % Graduates |
| Computers & Mathematics | 3 | 5.1% |
| Bio, Nature & Agricultural | 5 | 8.5% |
| Physical & Health Sciences | 5 | 8.5% |
| Psychology | 3 | 5.1% |
| Social Sciences | 0 | 0.0% |
| Engineering | 0 | 0.0% |
| Multidisciplinary Studies | 0 | 0.0% |
| Science & Technology | 4 | 6.8% |
| Business | 11 | 18.6% |
| Education | 17 | 28.8% |
| Literature & Languages | 0 | 0.0% |
| Liberal Arts & History | 0 | 0.0% |
| Visual & Performing Arts | 5 | 8.5% |
| Communications | 6 | 10.2% |
| Arts & Humanities | 0 | 0.0% |
| Total | 59 | 100.0% |
Transportation & Commute in Bruce
Vehicle Availability by Sex in Bruce
The most prevalent vehicle ownership categories in Bruce are males with 2 vehicles (72, accounting for 53.7%) and females with 2 vehicles (31, making up 63.7%).
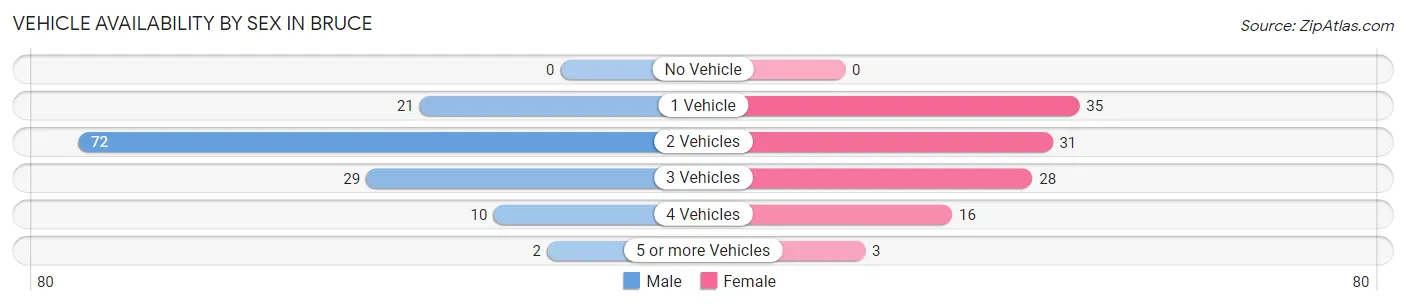
| Vehicles Available | Male | Female |
| No Vehicle | 0 (0.0%) | 0 (0.0%) |
| 1 Vehicle | 21 (15.7%) | 35 (31.0%) |
| 2 Vehicles | 72 (53.7%) | 31 (27.4%) |
| 3 Vehicles | 29 (21.6%) | 28 (24.8%) |
| 4 Vehicles | 10 (7.5%) | 16 (14.2%) |
| 5 or more Vehicles | 2 (1.5%) | 3 (2.6%) |
| Total | 134 (100.0%) | 113 (100.0%) |
Commute Time in Bruce
The most frequently occuring commute durations in Bruce are 15 to 19 minutes (40 commuters, 17.2%), 45 to 59 minutes (40 commuters, 17.2%), and 10 to 14 minutes (27 commuters, 11.6%).
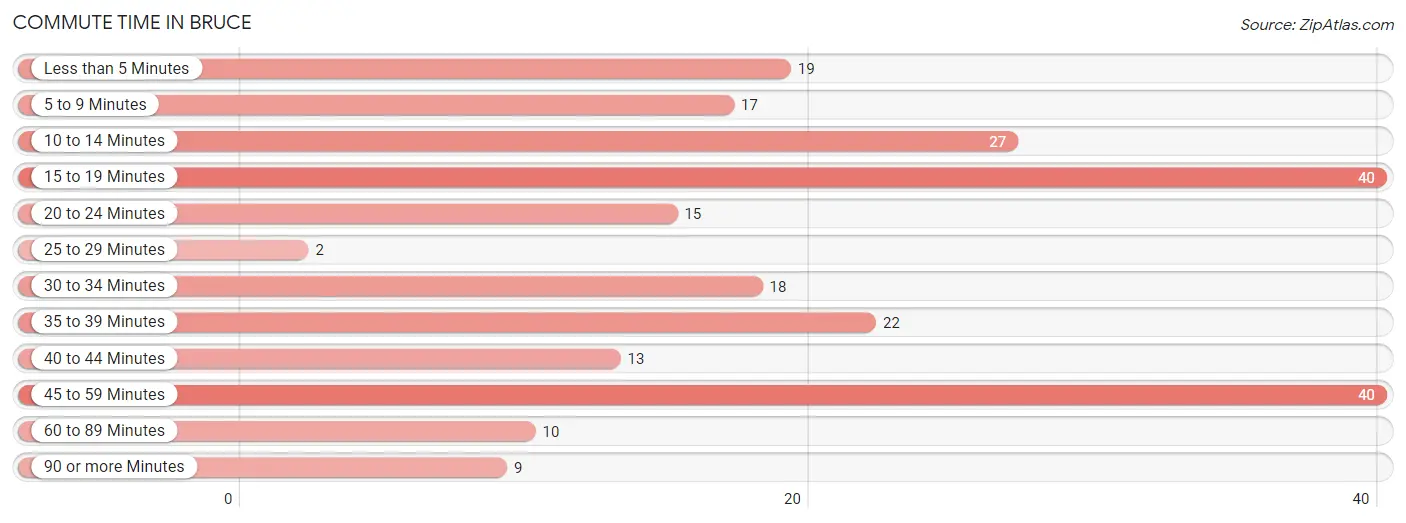
| Commute Time | # Commuters | % Commuters |
| Less than 5 Minutes | 19 | 8.2% |
| 5 to 9 Minutes | 17 | 7.3% |
| 10 to 14 Minutes | 27 | 11.6% |
| 15 to 19 Minutes | 40 | 17.2% |
| 20 to 24 Minutes | 15 | 6.5% |
| 25 to 29 Minutes | 2 | 0.9% |
| 30 to 34 Minutes | 18 | 7.8% |
| 35 to 39 Minutes | 22 | 9.5% |
| 40 to 44 Minutes | 13 | 5.6% |
| 45 to 59 Minutes | 40 | 17.2% |
| 60 to 89 Minutes | 10 | 4.3% |
| 90 or more Minutes | 9 | 3.9% |
Commute Time by Sex in Bruce
The most common commute times in Bruce are 45 to 59 minutes (34 commuters, 25.8%) for males and 15 to 19 minutes (24 commuters, 24.0%) for females.
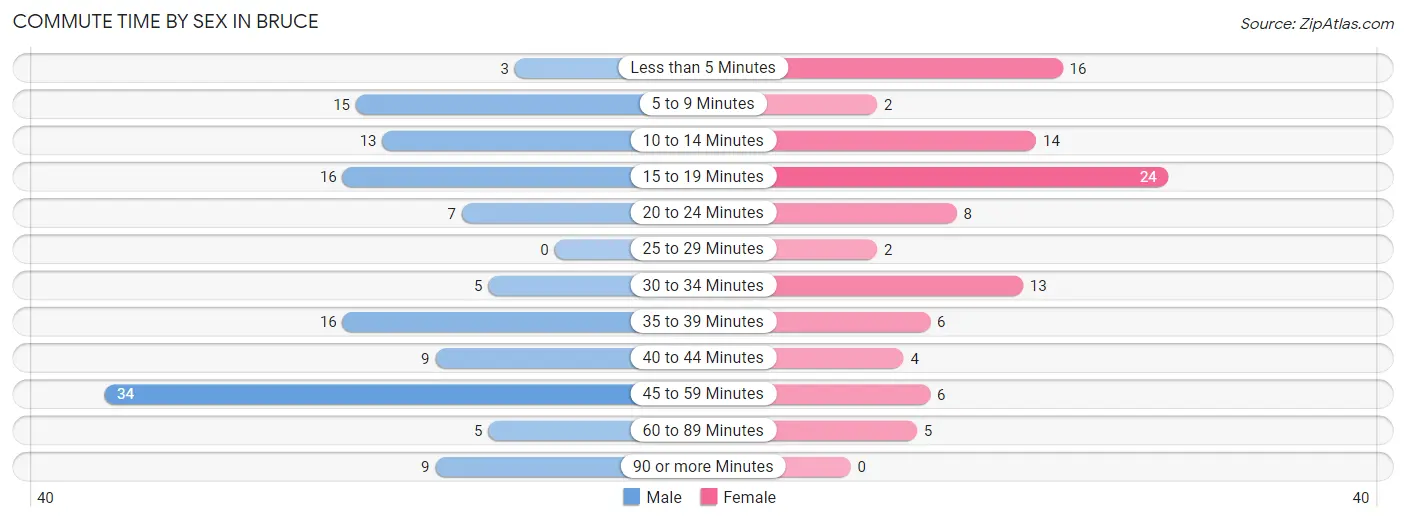
| Commute Time | Male | Female |
| Less than 5 Minutes | 3 (2.3%) | 16 (16.0%) |
| 5 to 9 Minutes | 15 (11.4%) | 2 (2.0%) |
| 10 to 14 Minutes | 13 (9.9%) | 14 (14.0%) |
| 15 to 19 Minutes | 16 (12.1%) | 24 (24.0%) |
| 20 to 24 Minutes | 7 (5.3%) | 8 (8.0%) |
| 25 to 29 Minutes | 0 (0.0%) | 2 (2.0%) |
| 30 to 34 Minutes | 5 (3.8%) | 13 (13.0%) |
| 35 to 39 Minutes | 16 (12.1%) | 6 (6.0%) |
| 40 to 44 Minutes | 9 (6.8%) | 4 (4.0%) |
| 45 to 59 Minutes | 34 (25.8%) | 6 (6.0%) |
| 60 to 89 Minutes | 5 (3.8%) | 5 (5.0%) |
| 90 or more Minutes | 9 (6.8%) | 0 (0.0%) |
Time of Departure to Work by Sex in Bruce
The most frequent times of departure to work in Bruce are 12:00 PM to 3:59 PM (26, 19.7%) for males and 8:00 AM to 8:29 AM (25, 25.0%) for females.
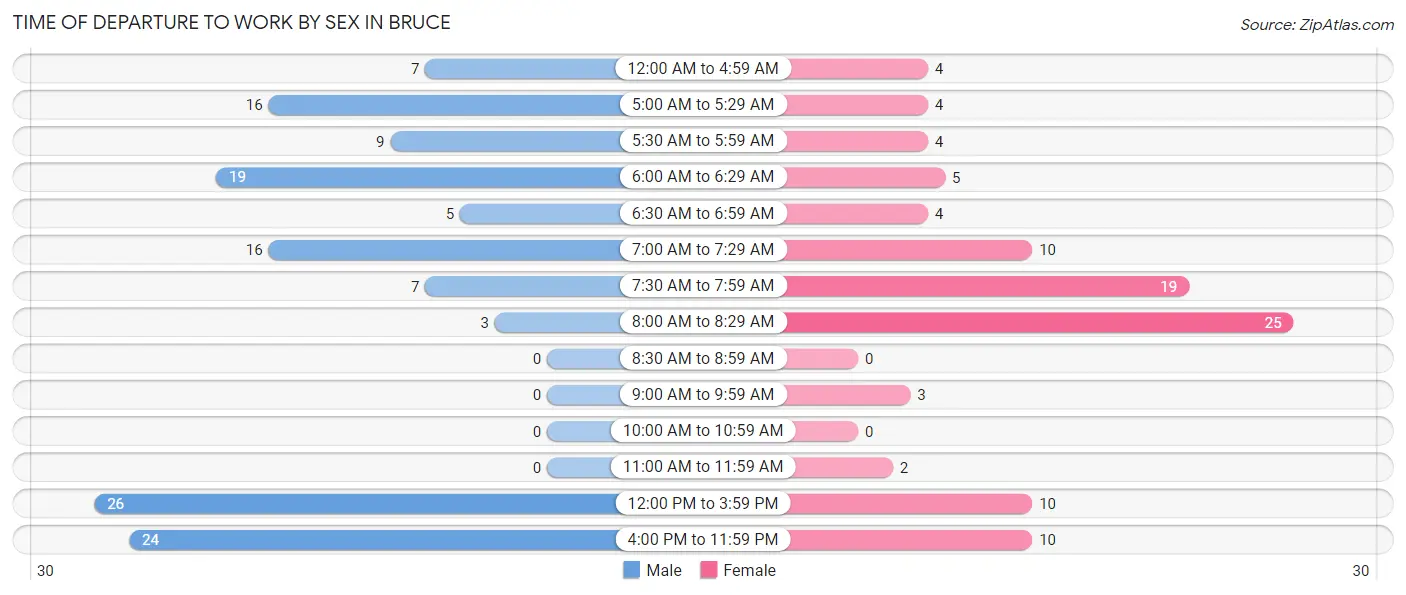
| Time of Departure | Male | Female |
| 12:00 AM to 4:59 AM | 7 (5.3%) | 4 (4.0%) |
| 5:00 AM to 5:29 AM | 16 (12.1%) | 4 (4.0%) |
| 5:30 AM to 5:59 AM | 9 (6.8%) | 4 (4.0%) |
| 6:00 AM to 6:29 AM | 19 (14.4%) | 5 (5.0%) |
| 6:30 AM to 6:59 AM | 5 (3.8%) | 4 (4.0%) |
| 7:00 AM to 7:29 AM | 16 (12.1%) | 10 (10.0%) |
| 7:30 AM to 7:59 AM | 7 (5.3%) | 19 (19.0%) |
| 8:00 AM to 8:29 AM | 3 (2.3%) | 25 (25.0%) |
| 8:30 AM to 8:59 AM | 0 (0.0%) | 0 (0.0%) |
| 9:00 AM to 9:59 AM | 0 (0.0%) | 3 (3.0%) |
| 10:00 AM to 10:59 AM | 0 (0.0%) | 0 (0.0%) |
| 11:00 AM to 11:59 AM | 0 (0.0%) | 2 (2.0%) |
| 12:00 PM to 3:59 PM | 26 (19.7%) | 10 (10.0%) |
| 4:00 PM to 11:59 PM | 24 (18.2%) | 10 (10.0%) |
| Total | 132 (100.0%) | 100 (100.0%) |
Housing Occupancy in Bruce
Occupancy by Ownership in Bruce
Of the total 285 dwellings in Bruce, owner-occupied units account for 208 (73.0%), while renter-occupied units make up 77 (27.0%).
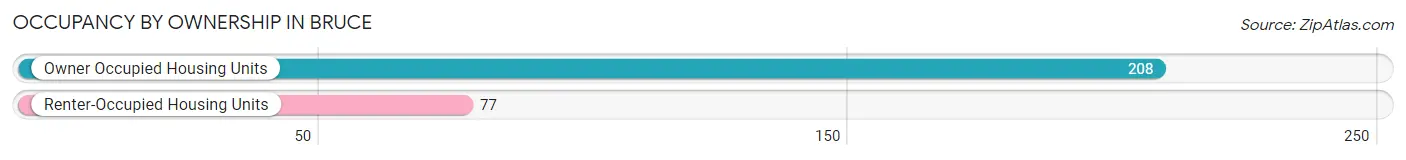
| Occupancy | # Housing Units | % Housing Units |
| Owner Occupied Housing Units | 208 | 73.0% |
| Renter-Occupied Housing Units | 77 | 27.0% |
| Total Occupied Housing Units | 285 | 100.0% |
Occupancy by Household Size in Bruce
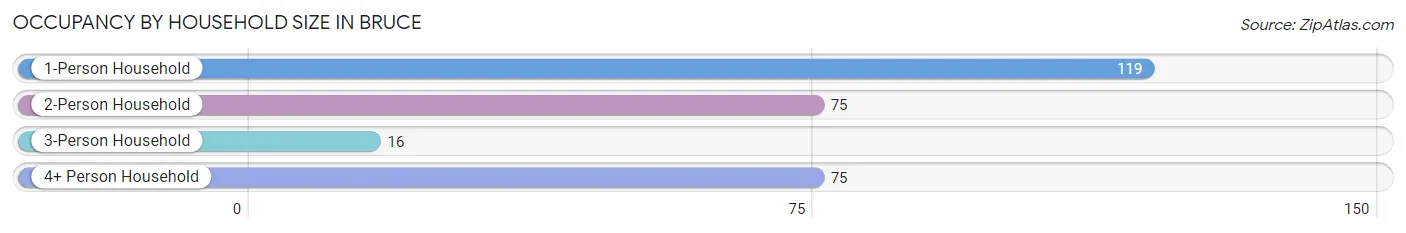
| Household Size | # Housing Units | % Housing Units |
| 1-Person Household | 119 | 41.7% |
| 2-Person Household | 75 | 26.3% |
| 3-Person Household | 16 | 5.6% |
| 4+ Person Household | 75 | 26.3% |
| Total Housing Units | 285 | 100.0% |
Occupancy by Ownership by Household Size in Bruce
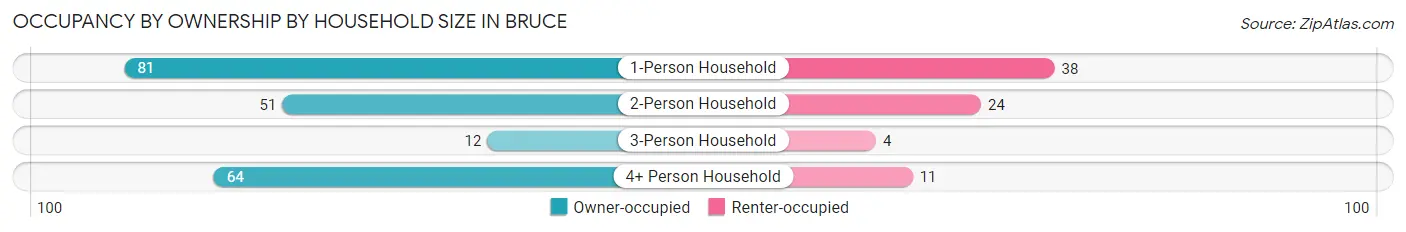
| Household Size | Owner-occupied | Renter-occupied |
| 1-Person Household | 81 (68.1%) | 38 (31.9%) |
| 2-Person Household | 51 (68.0%) | 24 (32.0%) |
| 3-Person Household | 12 (75.0%) | 4 (25.0%) |
| 4+ Person Household | 64 (85.3%) | 11 (14.7%) |
| Total Housing Units | 208 (73.0%) | 77 (27.0%) |
Occupancy by Educational Attainment in Bruce
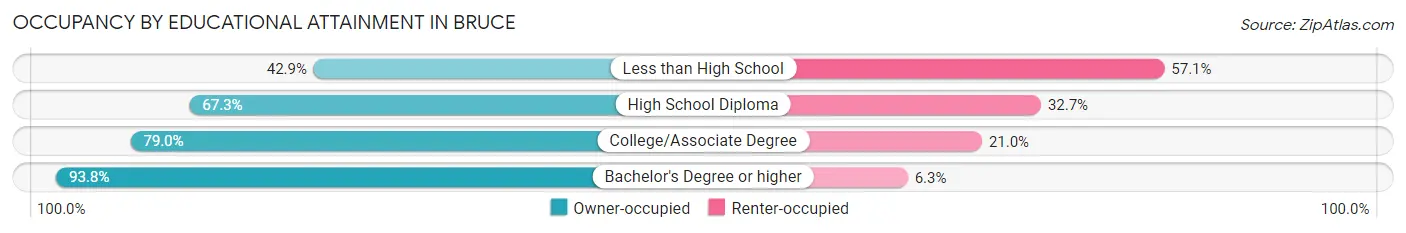
| Household Size | Owner-occupied | Renter-occupied |
| Less than High School | 12 (42.9%) | 16 (57.1%) |
| High School Diploma | 68 (67.3%) | 33 (32.7%) |
| College/Associate Degree | 98 (79.0%) | 26 (21.0%) |
| Bachelor's Degree or higher | 30 (93.8%) | 2 (6.2%) |
Occupancy by Age of Householder in Bruce
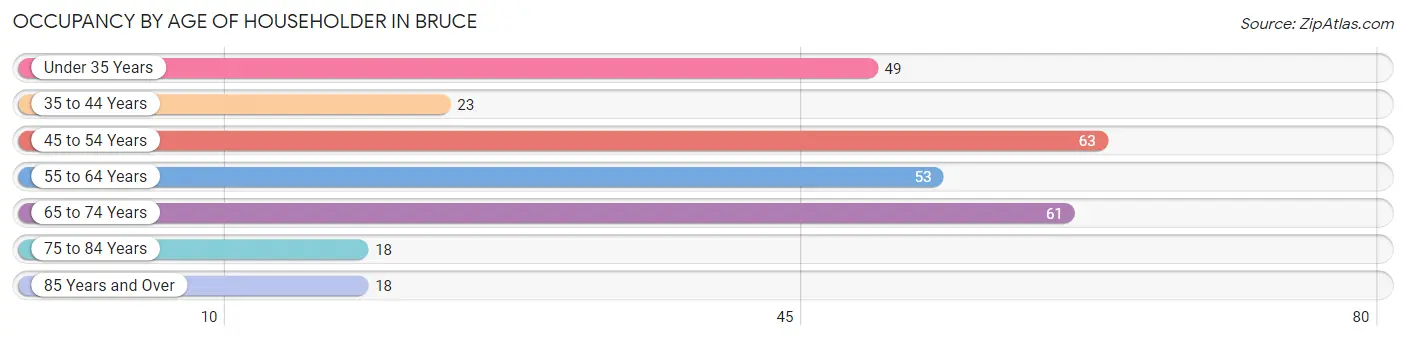
| Age Bracket | # Households | % Households |
| Under 35 Years | 49 | 17.2% |
| 35 to 44 Years | 23 | 8.1% |
| 45 to 54 Years | 63 | 22.1% |
| 55 to 64 Years | 53 | 18.6% |
| 65 to 74 Years | 61 | 21.4% |
| 75 to 84 Years | 18 | 6.3% |
| 85 Years and Over | 18 | 6.3% |
| Total | 285 | 100.0% |
Housing Finances in Bruce
Median Income by Occupancy in Bruce
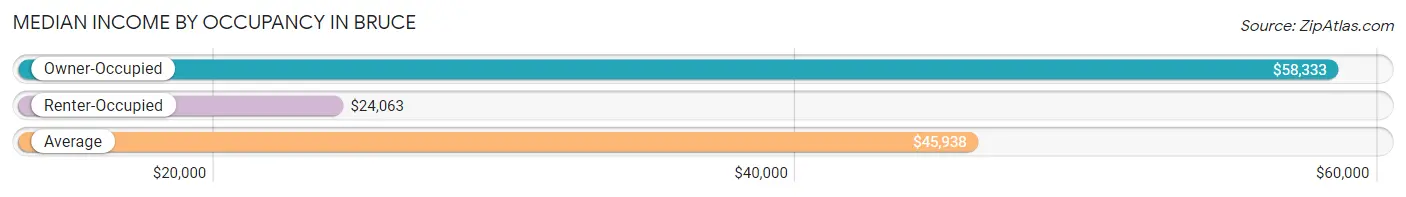
| Occupancy Type | # Households | Median Income |
| Owner-Occupied | 208 (73.0%) | $58,333 |
| Renter-Occupied | 77 (27.0%) | $24,063 |
| Average | 285 (100.0%) | $45,938 |
Occupancy by Householder Income Bracket in Bruce
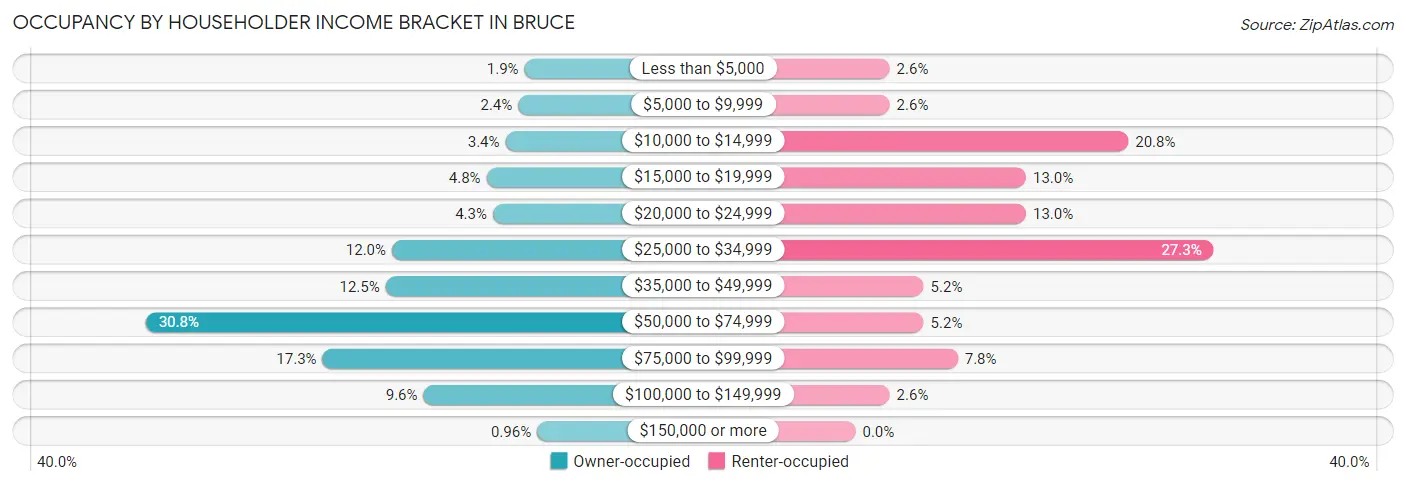
| Income Bracket | Owner-occupied | Renter-occupied |
| Less than $5,000 | 4 (1.9%) | 2 (2.6%) |
| $5,000 to $9,999 | 5 (2.4%) | 2 (2.6%) |
| $10,000 to $14,999 | 7 (3.4%) | 16 (20.8%) |
| $15,000 to $19,999 | 10 (4.8%) | 10 (13.0%) |
| $20,000 to $24,999 | 9 (4.3%) | 10 (13.0%) |
| $25,000 to $34,999 | 25 (12.0%) | 21 (27.3%) |
| $35,000 to $49,999 | 26 (12.5%) | 4 (5.2%) |
| $50,000 to $74,999 | 64 (30.8%) | 4 (5.2%) |
| $75,000 to $99,999 | 36 (17.3%) | 6 (7.8%) |
| $100,000 to $149,999 | 20 (9.6%) | 2 (2.6%) |
| $150,000 or more | 2 (1.0%) | 0 (0.0%) |
| Total | 208 (100.0%) | 77 (100.0%) |
Monthly Housing Cost Tiers in Bruce
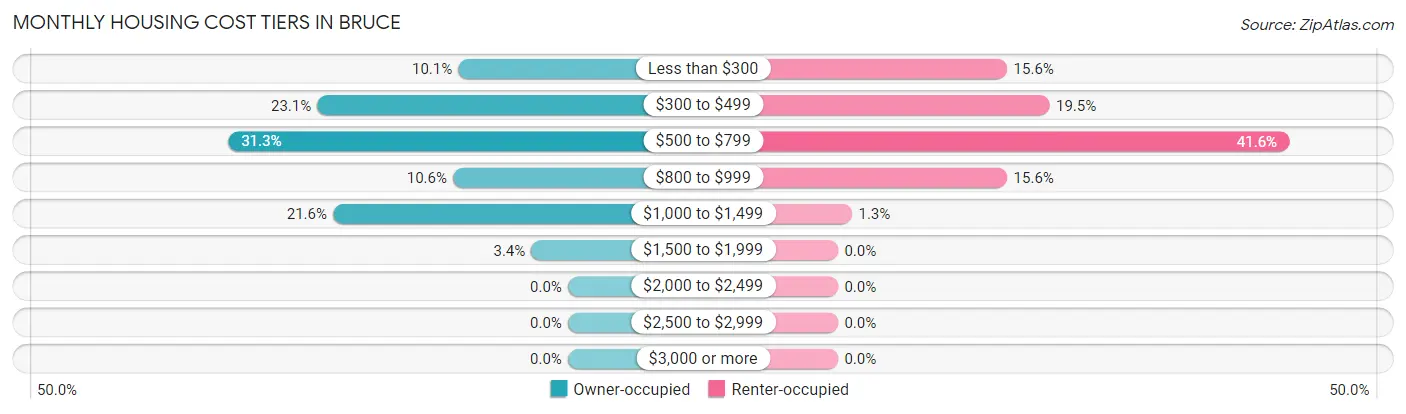
| Monthly Cost | Owner-occupied | Renter-occupied |
| Less than $300 | 21 (10.1%) | 12 (15.6%) |
| $300 to $499 | 48 (23.1%) | 15 (19.5%) |
| $500 to $799 | 65 (31.2%) | 32 (41.6%) |
| $800 to $999 | 22 (10.6%) | 12 (15.6%) |
| $1,000 to $1,499 | 45 (21.6%) | 1 (1.3%) |
| $1,500 to $1,999 | 7 (3.4%) | 0 (0.0%) |
| $2,000 to $2,499 | 0 (0.0%) | 0 (0.0%) |
| $2,500 to $2,999 | 0 (0.0%) | 0 (0.0%) |
| $3,000 or more | 0 (0.0%) | 0 (0.0%) |
| Total | 208 (100.0%) | 77 (100.0%) |
Physical Housing Characteristics in Bruce
Housing Structures in Bruce
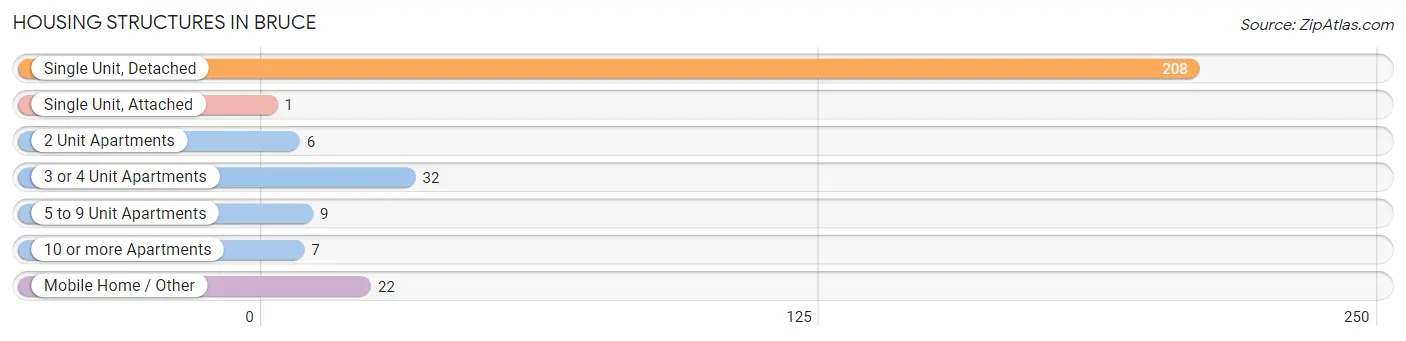
| Structure Type | # Housing Units | % Housing Units |
| Single Unit, Detached | 208 | 73.0% |
| Single Unit, Attached | 1 | 0.4% |
| 2 Unit Apartments | 6 | 2.1% |
| 3 or 4 Unit Apartments | 32 | 11.2% |
| 5 to 9 Unit Apartments | 9 | 3.2% |
| 10 or more Apartments | 7 | 2.5% |
| Mobile Home / Other | 22 | 7.7% |
| Total | 285 | 100.0% |
Housing Structures by Occupancy in Bruce
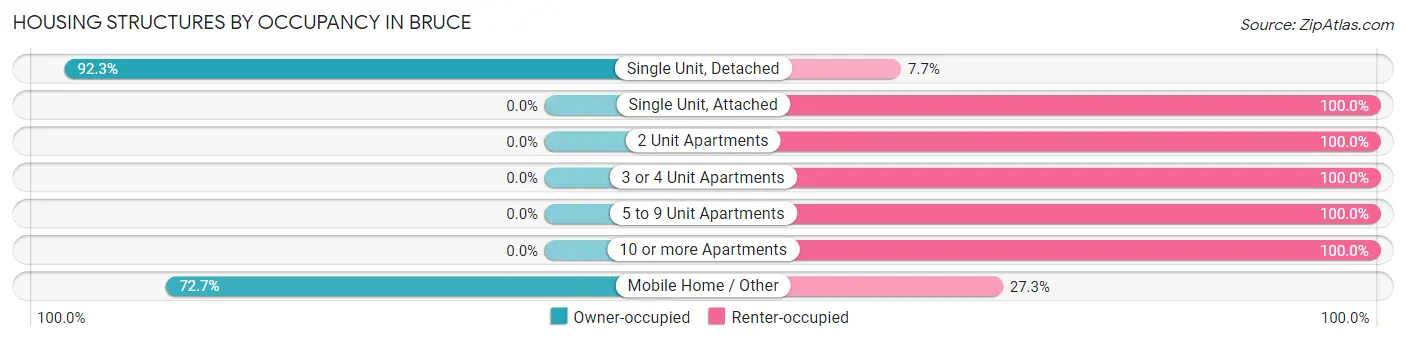
| Structure Type | Owner-occupied | Renter-occupied |
| Single Unit, Detached | 192 (92.3%) | 16 (7.7%) |
| Single Unit, Attached | 0 (0.0%) | 1 (100.0%) |
| 2 Unit Apartments | 0 (0.0%) | 6 (100.0%) |
| 3 or 4 Unit Apartments | 0 (0.0%) | 32 (100.0%) |
| 5 to 9 Unit Apartments | 0 (0.0%) | 9 (100.0%) |
| 10 or more Apartments | 0 (0.0%) | 7 (100.0%) |
| Mobile Home / Other | 16 (72.7%) | 6 (27.3%) |
| Total | 208 (73.0%) | 77 (27.0%) |
Housing Structures by Number of Rooms in Bruce
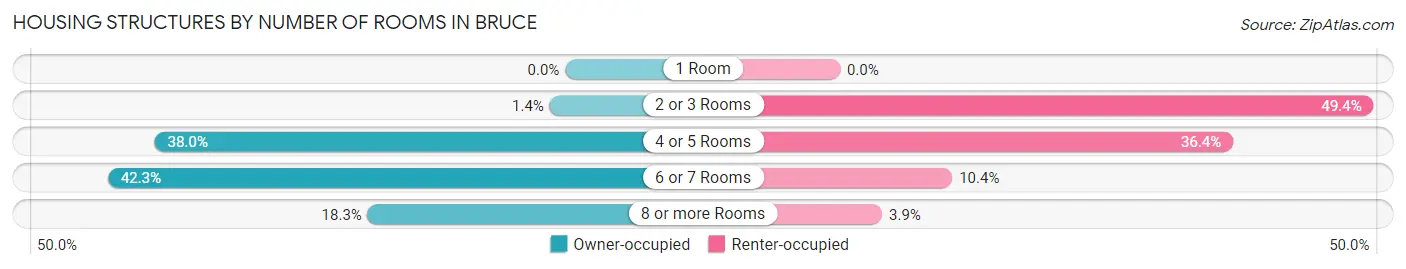
| Number of Rooms | Owner-occupied | Renter-occupied |
| 1 Room | 0 (0.0%) | 0 (0.0%) |
| 2 or 3 Rooms | 3 (1.4%) | 38 (49.3%) |
| 4 or 5 Rooms | 79 (38.0%) | 28 (36.4%) |
| 6 or 7 Rooms | 88 (42.3%) | 8 (10.4%) |
| 8 or more Rooms | 38 (18.3%) | 3 (3.9%) |
| Total | 208 (100.0%) | 77 (100.0%) |
Housing Structure by Heating Type in Bruce
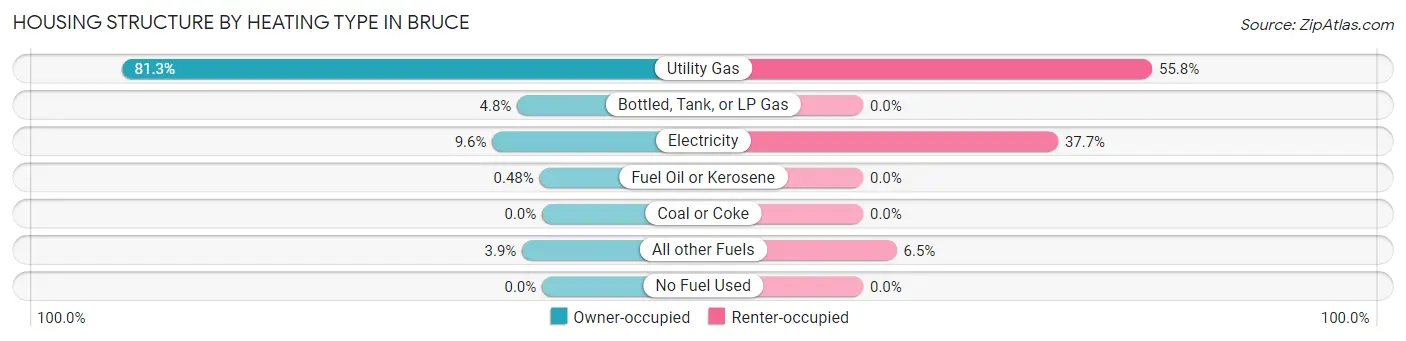
| Heating Type | Owner-occupied | Renter-occupied |
| Utility Gas | 169 (81.2%) | 43 (55.8%) |
| Bottled, Tank, or LP Gas | 10 (4.8%) | 0 (0.0%) |
| Electricity | 20 (9.6%) | 29 (37.7%) |
| Fuel Oil or Kerosene | 1 (0.5%) | 0 (0.0%) |
| Coal or Coke | 0 (0.0%) | 0 (0.0%) |
| All other Fuels | 8 (3.8%) | 5 (6.5%) |
| No Fuel Used | 0 (0.0%) | 0 (0.0%) |
| Total | 208 (100.0%) | 77 (100.0%) |
Household Vehicle Usage in Bruce
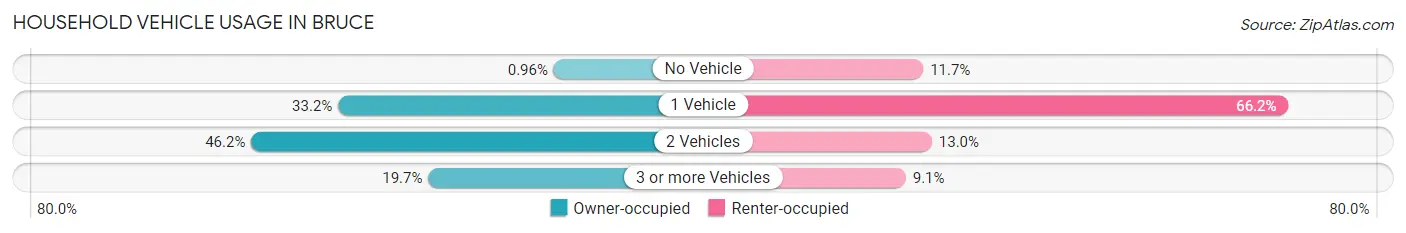
| Vehicles per Household | Owner-occupied | Renter-occupied |
| No Vehicle | 2 (1.0%) | 9 (11.7%) |
| 1 Vehicle | 69 (33.2%) | 51 (66.2%) |
| 2 Vehicles | 96 (46.2%) | 10 (13.0%) |
| 3 or more Vehicles | 41 (19.7%) | 7 (9.1%) |
| Total | 208 (100.0%) | 77 (100.0%) |
Real Estate & Mortgages in Bruce
Real Estate and Mortgage Overview in Bruce
| Characteristic | Without Mortgage | With Mortgage |
| Housing Units | 102 | 106 |
| Median Property Value | $85,000 | $103,300 |
| Median Household Income | $53,750 | $2 |
| Monthly Housing Costs | $442 | $0 |
| Real Estate Taxes | $1,087 | $0 |
Property Value by Mortgage Status in Bruce
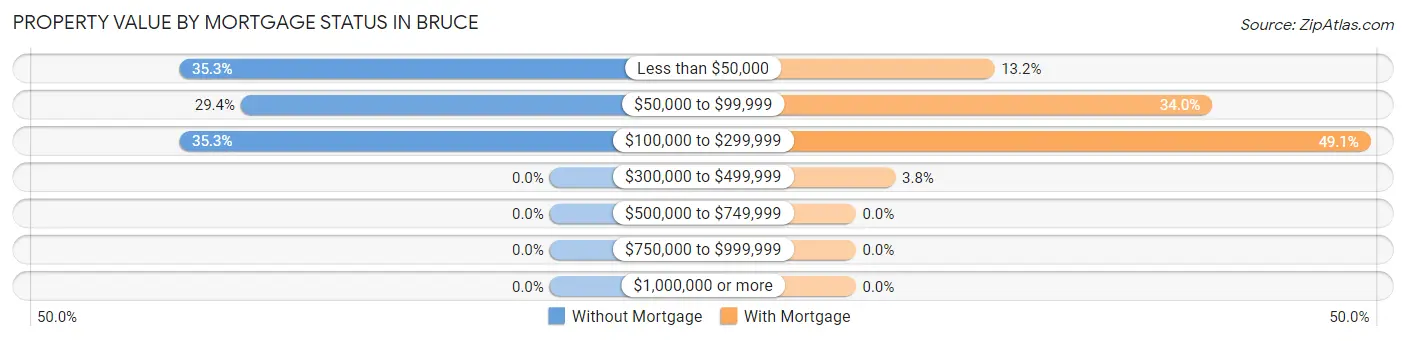
| Property Value | Without Mortgage | With Mortgage |
| Less than $50,000 | 36 (35.3%) | 14 (13.2%) |
| $50,000 to $99,999 | 30 (29.4%) | 36 (34.0%) |
| $100,000 to $299,999 | 36 (35.3%) | 52 (49.1%) |
| $300,000 to $499,999 | 0 (0.0%) | 4 (3.8%) |
| $500,000 to $749,999 | 0 (0.0%) | 0 (0.0%) |
| $750,000 to $999,999 | 0 (0.0%) | 0 (0.0%) |
| $1,000,000 or more | 0 (0.0%) | 0 (0.0%) |
| Total | 102 (100.0%) | 106 (100.0%) |
Household Income by Mortgage Status in Bruce
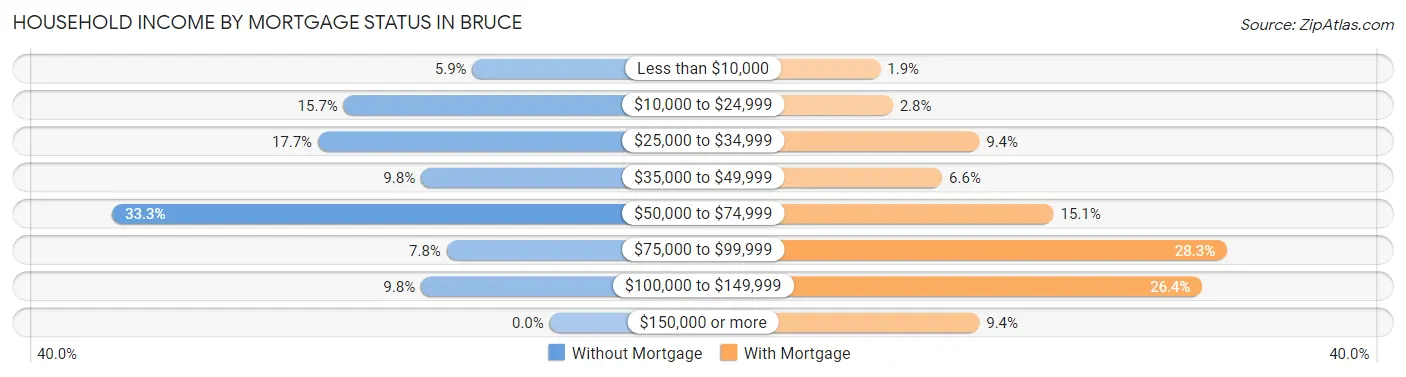
| Household Income | Without Mortgage | With Mortgage |
| Less than $10,000 | 6 (5.9%) | 2 (1.9%) |
| $10,000 to $24,999 | 16 (15.7%) | 3 (2.8%) |
| $25,000 to $34,999 | 18 (17.6%) | 10 (9.4%) |
| $35,000 to $49,999 | 10 (9.8%) | 7 (6.6%) |
| $50,000 to $74,999 | 34 (33.3%) | 16 (15.1%) |
| $75,000 to $99,999 | 8 (7.8%) | 30 (28.3%) |
| $100,000 to $149,999 | 10 (9.8%) | 28 (26.4%) |
| $150,000 or more | 0 (0.0%) | 10 (9.4%) |
| Total | 102 (100.0%) | 106 (100.0%) |
Property Value to Household Income Ratio in Bruce
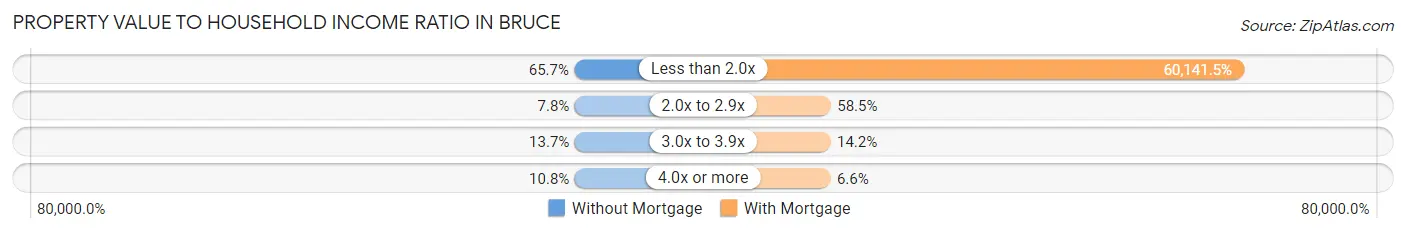
| Value-to-Income Ratio | Without Mortgage | With Mortgage |
| Less than 2.0x | 67 (65.7%) | 63,750 (60,141.5%) |
| 2.0x to 2.9x | 8 (7.8%) | 62 (58.5%) |
| 3.0x to 3.9x | 14 (13.7%) | 15 (14.1%) |
| 4.0x or more | 11 (10.8%) | 7 (6.6%) |
| Total | 102 (100.0%) | 106 (100.0%) |
Real Estate Taxes by Mortgage Status in Bruce
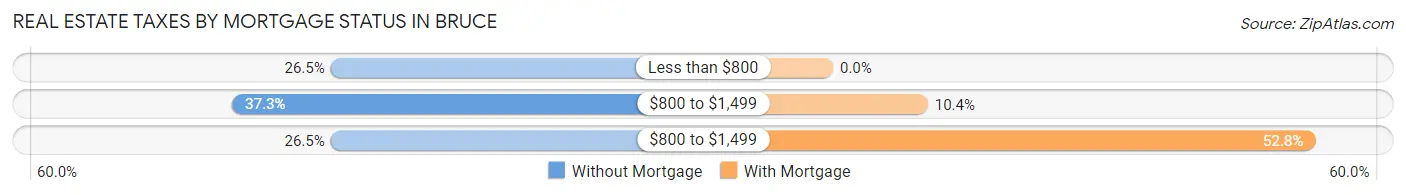
| Property Taxes | Without Mortgage | With Mortgage |
| Less than $800 | 27 (26.5%) | 0 (0.0%) |
| $800 to $1,499 | 38 (37.2%) | 11 (10.4%) |
| $800 to $1,499 | 27 (26.5%) | 56 (52.8%) |
| Total | 102 (100.0%) | 106 (100.0%) |
Health & Disability in Bruce
Health Insurance Coverage by Age in Bruce
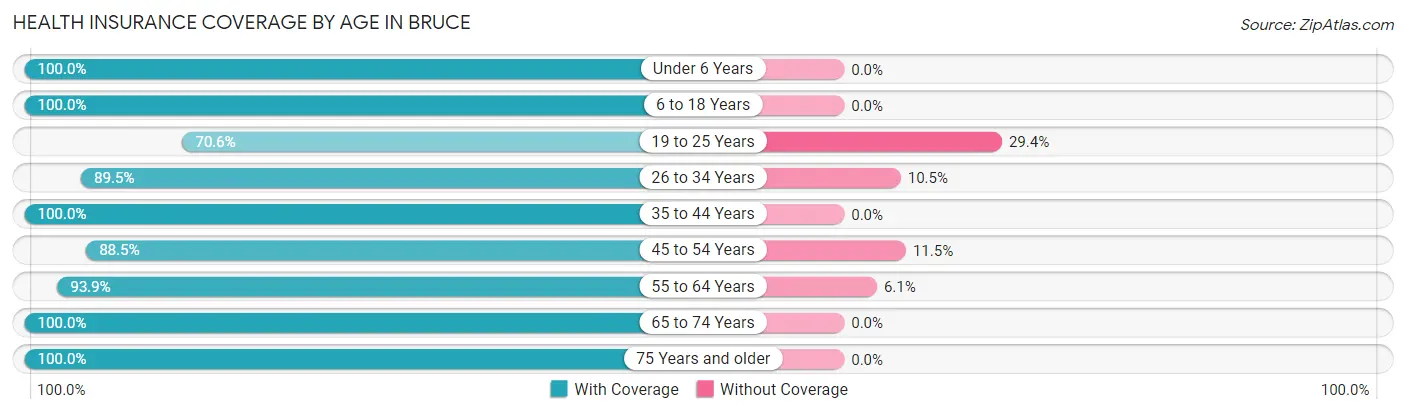
| Age Bracket | With Coverage | Without Coverage |
| Under 6 Years | 93 (100.0%) | 0 (0.0%) |
| 6 to 18 Years | 131 (100.0%) | 0 (0.0%) |
| 19 to 25 Years | 24 (70.6%) | 10 (29.4%) |
| 26 to 34 Years | 102 (89.5%) | 12 (10.5%) |
| 35 to 44 Years | 40 (100.0%) | 0 (0.0%) |
| 45 to 54 Years | 100 (88.5%) | 13 (11.5%) |
| 55 to 64 Years | 77 (93.9%) | 5 (6.1%) |
| 65 to 74 Years | 81 (100.0%) | 0 (0.0%) |
| 75 Years and older | 51 (100.0%) | 0 (0.0%) |
| Total | 699 (94.6%) | 40 (5.4%) |
Health Insurance Coverage by Citizenship Status in Bruce
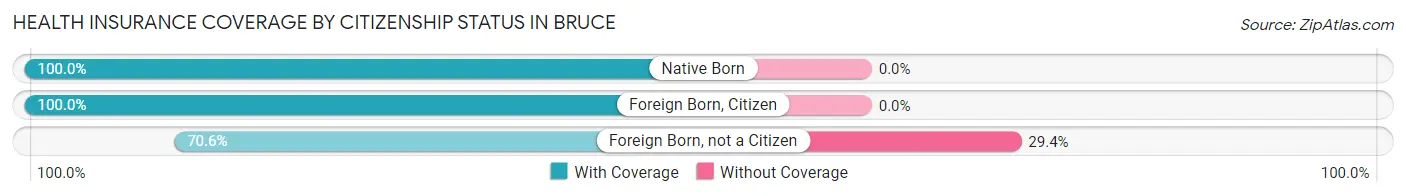
| Citizenship Status | With Coverage | Without Coverage |
| Native Born | 93 (100.0%) | 0 (0.0%) |
| Foreign Born, Citizen | 131 (100.0%) | 0 (0.0%) |
| Foreign Born, not a Citizen | 24 (70.6%) | 10 (29.4%) |
Health Insurance Coverage by Household Income in Bruce
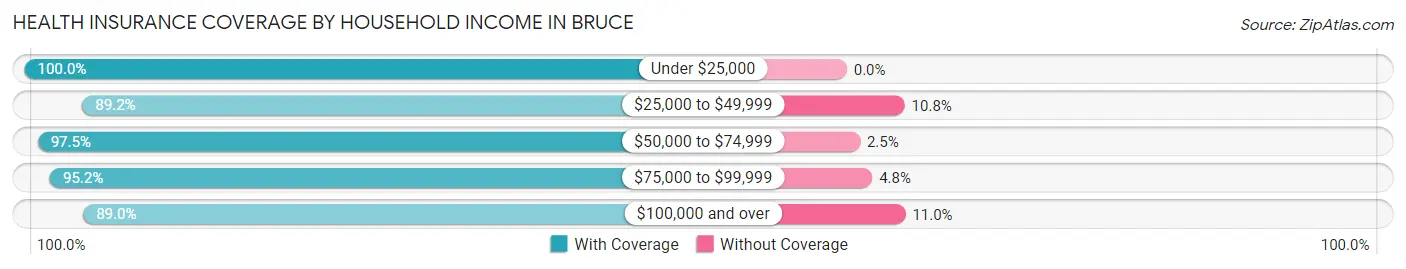
| Household Income | With Coverage | Without Coverage |
| Under $25,000 | 132 (100.0%) | 0 (0.0%) |
| $25,000 to $49,999 | 148 (89.2%) | 18 (10.8%) |
| $50,000 to $74,999 | 198 (97.5%) | 5 (2.5%) |
| $75,000 to $99,999 | 140 (95.2%) | 7 (4.8%) |
| $100,000 and over | 81 (89.0%) | 10 (11.0%) |
Public vs Private Health Insurance Coverage by Age in Bruce
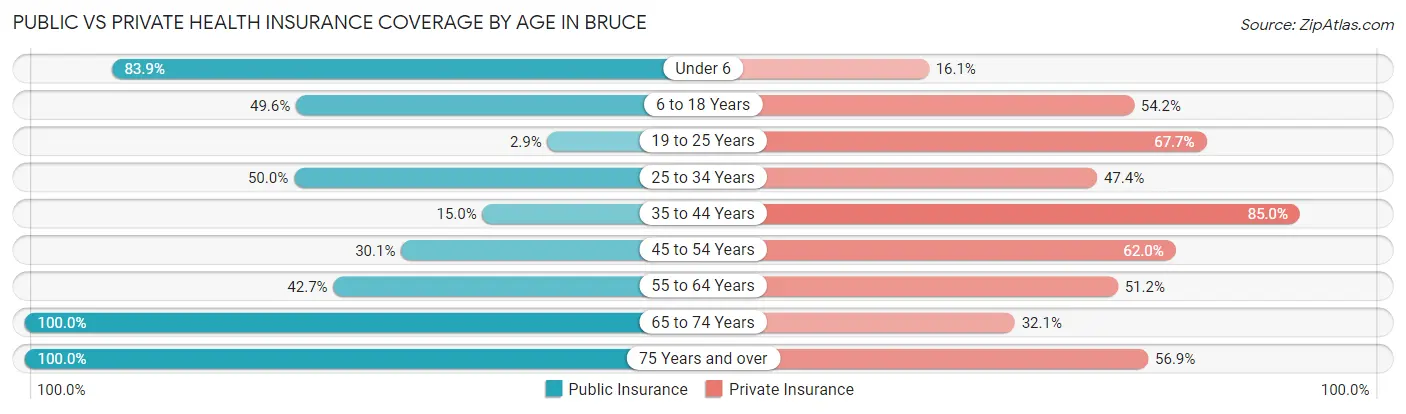
| Age Bracket | Public Insurance | Private Insurance |
| Under 6 | 78 (83.9%) | 15 (16.1%) |
| 6 to 18 Years | 65 (49.6%) | 71 (54.2%) |
| 19 to 25 Years | 1 (2.9%) | 23 (67.6%) |
| 25 to 34 Years | 57 (50.0%) | 54 (47.4%) |
| 35 to 44 Years | 6 (15.0%) | 34 (85.0%) |
| 45 to 54 Years | 34 (30.1%) | 70 (62.0%) |
| 55 to 64 Years | 35 (42.7%) | 42 (51.2%) |
| 65 to 74 Years | 81 (100.0%) | 26 (32.1%) |
| 75 Years and over | 51 (100.0%) | 29 (56.9%) |
| Total | 408 (55.2%) | 364 (49.3%) |
Disability Status by Sex by Age in Bruce
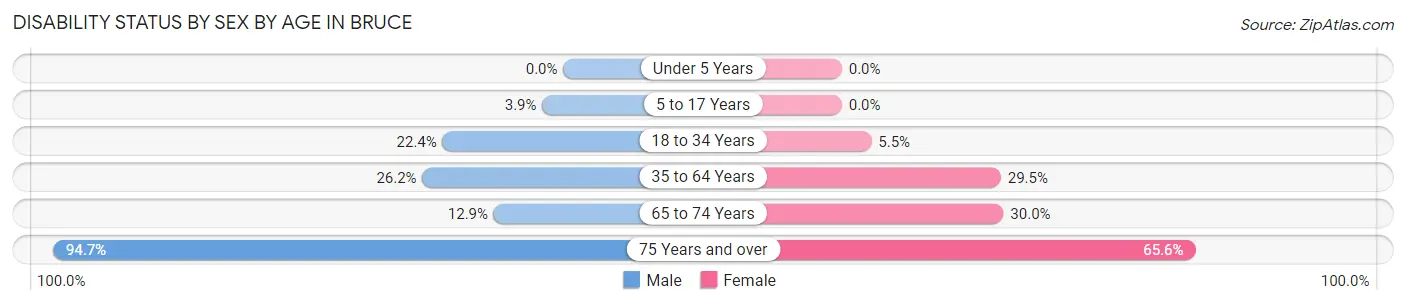
| Age Bracket | Male | Female |
| Under 5 Years | 0 (0.0%) | 0 (0.0%) |
| 5 to 17 Years | 3 (3.9%) | 0 (0.0%) |
| 18 to 34 Years | 13 (22.4%) | 5 (5.5%) |
| 35 to 64 Years | 34 (26.2%) | 31 (29.5%) |
| 65 to 74 Years | 4 (12.9%) | 15 (30.0%) |
| 75 Years and over | 18 (94.7%) | 21 (65.6%) |
Disability Class by Sex by Age in Bruce
Disability Class: Hearing Difficulty
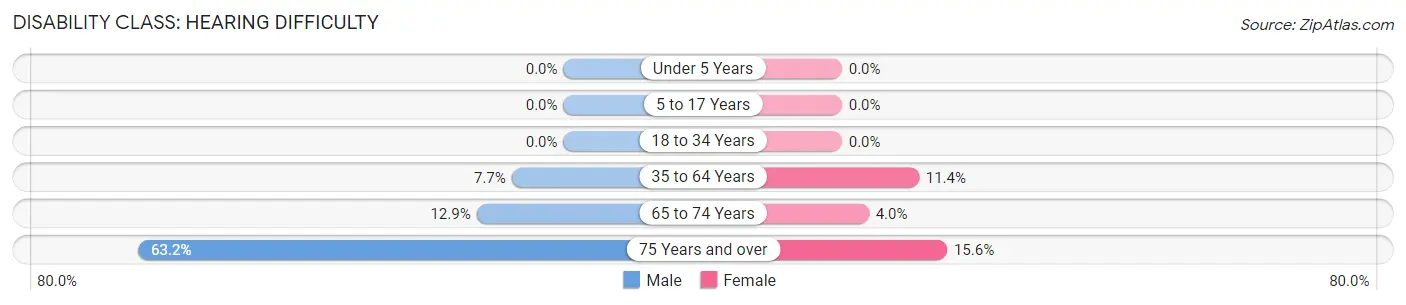
| Age Bracket | Male | Female |
| Under 5 Years | 0 (0.0%) | 0 (0.0%) |
| 5 to 17 Years | 0 (0.0%) | 0 (0.0%) |
| 18 to 34 Years | 0 (0.0%) | 0 (0.0%) |
| 35 to 64 Years | 10 (7.7%) | 12 (11.4%) |
| 65 to 74 Years | 4 (12.9%) | 2 (4.0%) |
| 75 Years and over | 12 (63.2%) | 5 (15.6%) |
Disability Class: Vision Difficulty
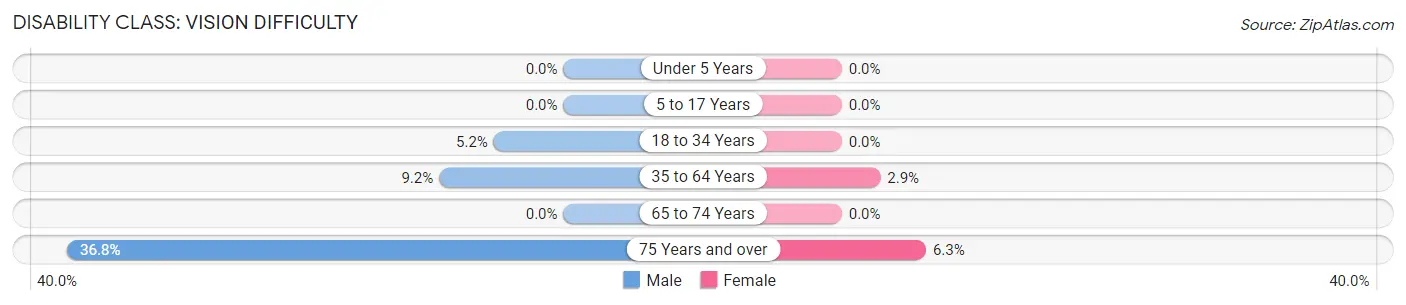
| Age Bracket | Male | Female |
| Under 5 Years | 0 (0.0%) | 0 (0.0%) |
| 5 to 17 Years | 0 (0.0%) | 0 (0.0%) |
| 18 to 34 Years | 3 (5.2%) | 0 (0.0%) |
| 35 to 64 Years | 12 (9.2%) | 3 (2.9%) |
| 65 to 74 Years | 0 (0.0%) | 0 (0.0%) |
| 75 Years and over | 7 (36.8%) | 2 (6.2%) |
Disability Class: Cognitive Difficulty
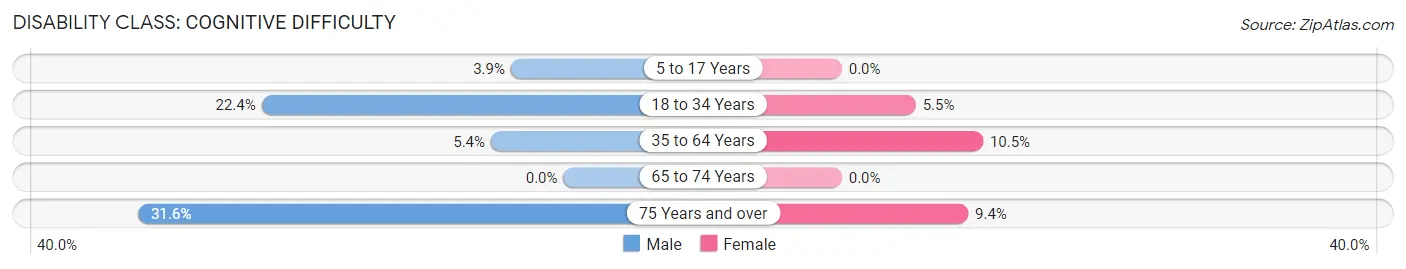
| Age Bracket | Male | Female |
| 5 to 17 Years | 3 (3.9%) | 0 (0.0%) |
| 18 to 34 Years | 13 (22.4%) | 5 (5.5%) |
| 35 to 64 Years | 7 (5.4%) | 11 (10.5%) |
| 65 to 74 Years | 0 (0.0%) | 0 (0.0%) |
| 75 Years and over | 6 (31.6%) | 3 (9.4%) |
Disability Class: Ambulatory Difficulty
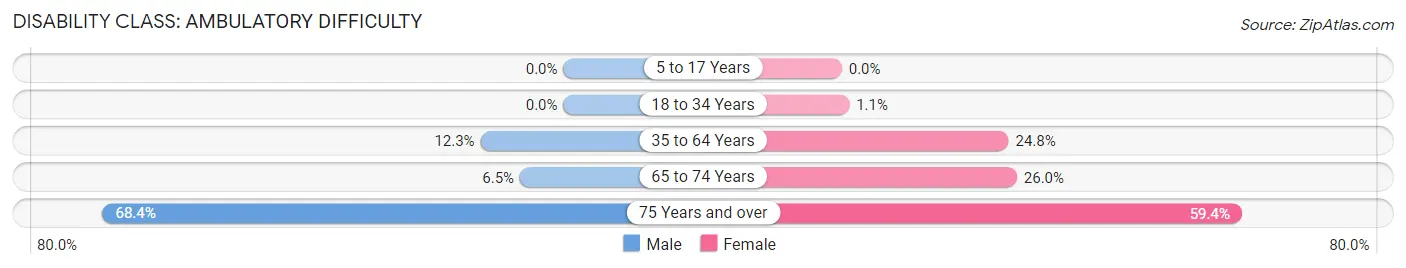
| Age Bracket | Male | Female |
| 5 to 17 Years | 0 (0.0%) | 0 (0.0%) |
| 18 to 34 Years | 0 (0.0%) | 1 (1.1%) |
| 35 to 64 Years | 16 (12.3%) | 26 (24.8%) |
| 65 to 74 Years | 2 (6.5%) | 13 (26.0%) |
| 75 Years and over | 13 (68.4%) | 19 (59.4%) |
Disability Class: Self-Care Difficulty
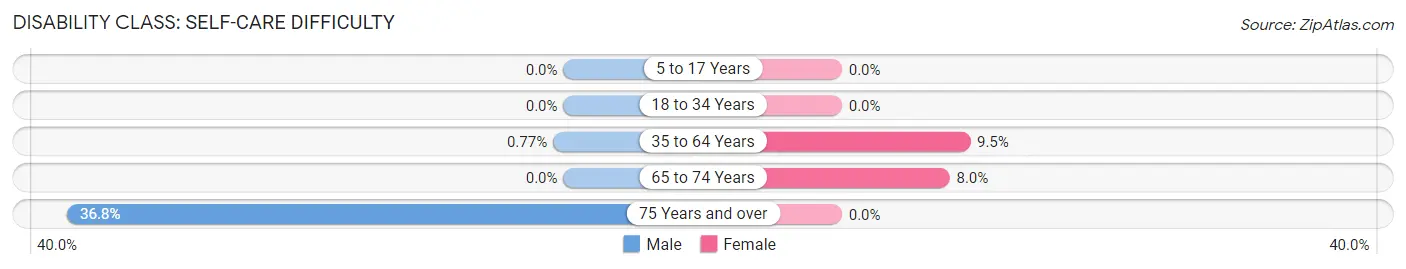
| Age Bracket | Male | Female |
| 5 to 17 Years | 0 (0.0%) | 0 (0.0%) |
| 18 to 34 Years | 0 (0.0%) | 0 (0.0%) |
| 35 to 64 Years | 1 (0.8%) | 10 (9.5%) |
| 65 to 74 Years | 0 (0.0%) | 4 (8.0%) |
| 75 Years and over | 7 (36.8%) | 0 (0.0%) |
Technology Access in Bruce
Computing Device Access in Bruce
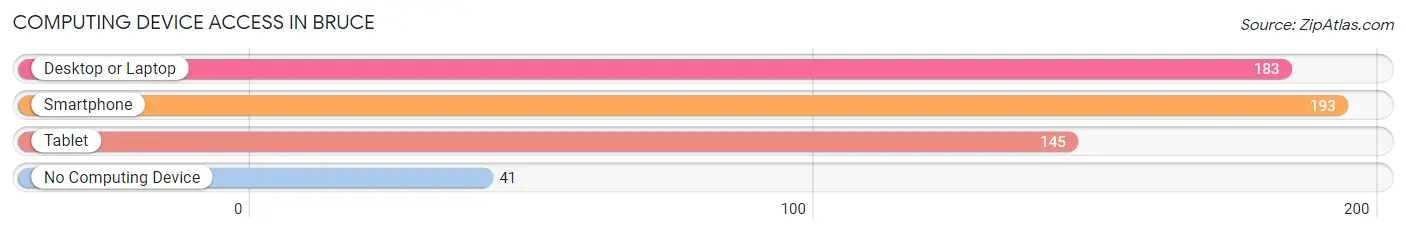
| Device Type | # Households | % Households |
| Desktop or Laptop | 183 | 64.2% |
| Smartphone | 193 | 67.7% |
| Tablet | 145 | 50.9% |
| No Computing Device | 41 | 14.4% |
| Total | 285 | 100.0% |
Internet Access in Bruce
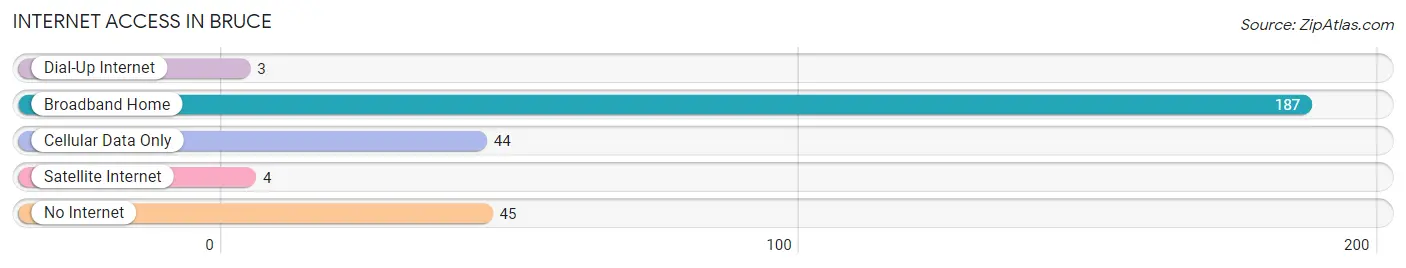
| Internet Type | # Households | % Households |
| Dial-Up Internet | 3 | 1.1% |
| Broadband Home | 187 | 65.6% |
| Cellular Data Only | 44 | 15.4% |
| Satellite Internet | 4 | 1.4% |
| No Internet | 45 | 15.8% |
| Total | 285 | 100.0% |
Bruce Summary
Bruce, Wisconsin is a small town located in the northwest corner of the state, in the county of Rusk. It is situated on the banks of the Yellow River, and is surrounded by rolling hills and forests. The town has a population of approximately 1,000 people, and is known for its rural charm and friendly atmosphere.
History
The area that is now Bruce was first settled in the late 1800s by a group of Norwegian immigrants. The town was originally called “Bruse”, which is Norwegian for “brush”, and was named after the thick brush that grew in the area. The town was officially incorporated in 1891, and the name was changed to Bruce in 1895.
The town grew slowly over the years, and by the early 1900s it had become a thriving agricultural community. The town was home to several small businesses, including a general store, a blacksmith, and a sawmill. The town also had a school, a post office, and a church.
Geography
Bruce is located in the northwest corner of Wisconsin, in the county of Rusk. It is situated on the banks of the Yellow River, and is surrounded by rolling hills and forests. The town is located about 30 miles from the city of Eau Claire, and is about an hour’s drive from the Twin Cities of Minneapolis and St. Paul.
The town has a total area of 1.2 square miles, all of which is land. The town is located at an elevation of 890 feet above sea level. The climate in Bruce is generally mild, with cold winters and warm summers.
Economy
The economy of Bruce is largely based on agriculture. The town is home to several small farms, which produce a variety of crops, including corn, soybeans, and hay. The town also has a few small businesses, including a general store, a hardware store, and a restaurant.
The town is also home to a few small manufacturing companies, which produce a variety of products, including furniture, clothing, and automotive parts. The town also has a few small service businesses, including a gas station, a barber shop, and a beauty salon.
Demographics
As of the 2010 census, the population of Bruce was 1,000 people. The racial makeup of the town was 97.2% White, 0.7% African American, 0.3% Native American, 0.2% Asian, 0.1% Pacific Islander, and 1.5% from other races. The median household income in Bruce was $37,500, and the median family income was $45,000.
The town is served by the Bruce School District, which consists of one elementary school, one middle school, and one high school. The town also has a public library, a post office, and a few churches.
Conclusion
Bruce, Wisconsin is a small town located in the northwest corner of the state, in the county of Rusk. It is situated on the banks of the Yellow River, and is surrounded by rolling hills and forests. The town has a population of approximately 1,000 people, and is known for its rural charm and friendly atmosphere. The economy of Bruce is largely based on agriculture, and the town is home to several small businesses. The town is served by the Bruce School District, and has a public library, a post office, and a few churches.
Common Questions
What is the Total Population of Bruce?
Total Population of Bruce is 739.
What is the Total Male Population of Bruce?
Total Male Population of Bruce is 343.
What is the Total Female Population of Bruce?
Total Female Population of Bruce is 396.
What is the Ratio of Males per 100 Females in Bruce?
There are 86.62 Males per 100 Females in Bruce.
What is the Ratio of Females per 100 Males in Bruce?
There are 115.45 Females per 100 Males in Bruce.
What is the Median Population Age in Bruce?
Median Population Age in Bruce is 34.8 Years.
What is the Average Family Size in Bruce
Average Family Size in Bruce is 3.4 People.
What is the Average Household Size in Bruce
Average Household Size in Bruce is 2.6 People.
What is Per Capita Income in Bruce?
Per Capita income in Bruce is $21,170.
What is the Median Family Income in Bruce?
Median Family Income in Bruce is $54,792.
What is the Median Household income in Bruce?
Median Household Income in Bruce is $45,938.
What is Income or Wage Gap in Bruce?
Income or Wage Gap in Bruce is 35.6%.
Women in Bruce earn 64.4 cents for every dollar earned by a man.
What is Inequality or Gini Index in Bruce?
Inequality or Gini Index in Bruce is 0.37.
How Large is the Labor Force in Bruce?
There are 289 People in the Labor Forcein in Bruce.
What is the Percentage of People in the Labor Force in Bruce?
54.1% of People are in the Labor Force in Bruce.
What is the Unemployment Rate in Bruce?
Unemployment Rate in Bruce is 2.8%.