Brandon, WI Map & Demographics
Brandon Map
Brandon Overview
$37,085
PER CAPITA INCOME
$102,500
AVG FAMILY INCOME
$79,688
AVG HOUSEHOLD INCOME
42.3%
WAGE / INCOME GAP [ % ]
57.7¢/ $1
WAGE / INCOME GAP [ $ ]
0.40
INEQUALITY / GINI INDEX
842
TOTAL POPULATION
435
MALE POPULATION
407
FEMALE POPULATION
106.88
MALES / 100 FEMALES
93.56
FEMALES / 100 MALES
41.3
MEDIAN AGE
3.3
AVG FAMILY SIZE
2.5
AVG HOUSEHOLD SIZE
495
LABOR FORCE [ PEOPLE ]
75.0%
PERCENT IN LABOR FORCE
4.0%
UNEMPLOYMENT RATE
Brandon Zip Codes
Brandon Area Codes
Income in Brandon
Income Overview in Brandon
Per Capita Income in Brandon is $37,085, while median incomes of families and households are $102,500 and $79,688 respectively.
| Characteristic | Number | Measure |
| Per Capita Income | 842 | $37,085 |
| Median Family Income | 192 | $102,500 |
| Mean Family Income | 192 | $101,488 |
| Median Household Income | 331 | $79,688 |
| Mean Household Income | 331 | $91,396 |
| Income Deficit | 192 | $0 |
| Wage / Income Gap (%) | 842 | 42.33% |
| Wage / Income Gap ($) | 842 | 57.67¢ per $1 |
| Gini / Inequality Index | 842 | 0.40 |
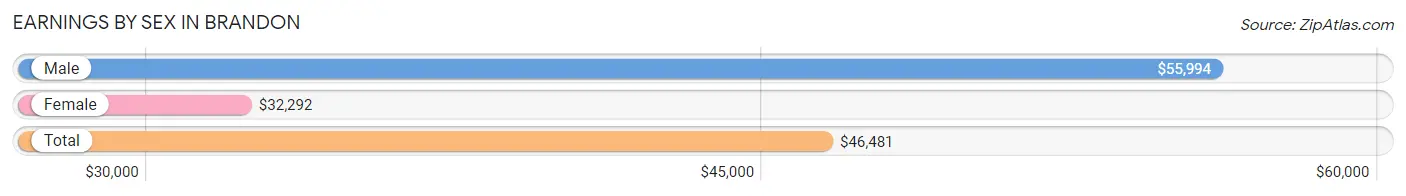
Earnings by Sex in Brandon
Average Earnings in Brandon are $46,481, $55,994 for men and $32,292 for women, a difference of 42.3%.
| Sex | Number | Average Earnings |
| Male | 279 (53.2%) | $55,994 |
| Female | 245 (46.8%) | $32,292 |
| Total | 524 (100.0%) | $46,481 |
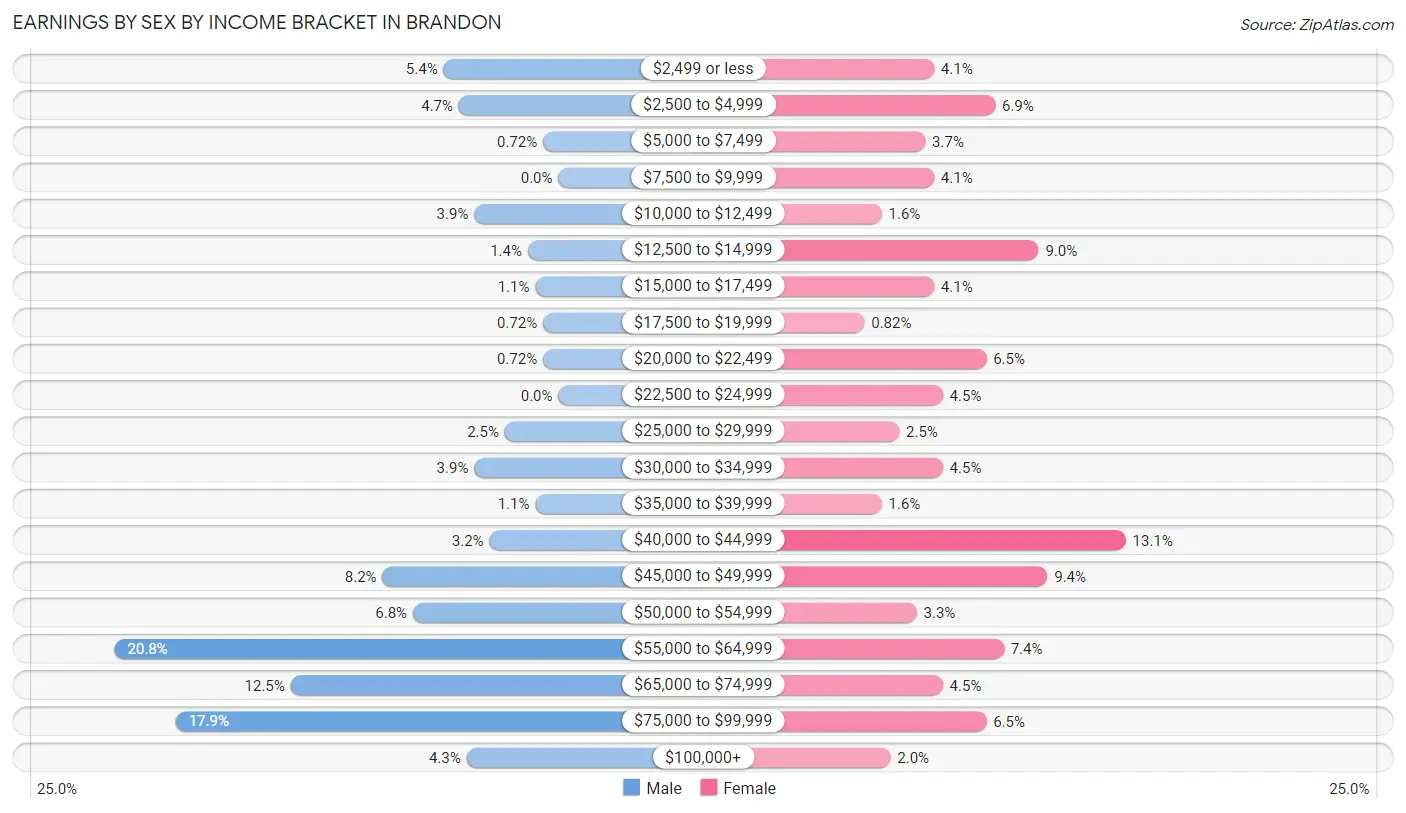
Earnings by Sex by Income Bracket in Brandon
The most common earnings brackets in Brandon are $55,000 to $64,999 for men (58 | 20.8%) and $40,000 to $44,999 for women (32 | 13.1%).
| Income | Male | Female |
| $2,499 or less | 15 (5.4%) | 10 (4.1%) |
| $2,500 to $4,999 | 13 (4.7%) | 17 (6.9%) |
| $5,000 to $7,499 | 2 (0.7%) | 9 (3.7%) |
| $7,500 to $9,999 | 0 (0.0%) | 10 (4.1%) |
| $10,000 to $12,499 | 11 (3.9%) | 4 (1.6%) |
| $12,500 to $14,999 | 4 (1.4%) | 22 (9.0%) |
| $15,000 to $17,499 | 3 (1.1%) | 10 (4.1%) |
| $17,500 to $19,999 | 2 (0.7%) | 2 (0.8%) |
| $20,000 to $22,499 | 2 (0.7%) | 16 (6.5%) |
| $22,500 to $24,999 | 0 (0.0%) | 11 (4.5%) |
| $25,000 to $29,999 | 7 (2.5%) | 6 (2.5%) |
| $30,000 to $34,999 | 11 (3.9%) | 11 (4.5%) |
| $35,000 to $39,999 | 3 (1.1%) | 4 (1.6%) |
| $40,000 to $44,999 | 9 (3.2%) | 32 (13.1%) |
| $45,000 to $49,999 | 23 (8.2%) | 23 (9.4%) |
| $50,000 to $54,999 | 19 (6.8%) | 8 (3.3%) |
| $55,000 to $64,999 | 58 (20.8%) | 18 (7.3%) |
| $65,000 to $74,999 | 35 (12.5%) | 11 (4.5%) |
| $75,000 to $99,999 | 50 (17.9%) | 16 (6.5%) |
| $100,000+ | 12 (4.3%) | 5 (2.0%) |
| Total | 279 (100.0%) | 245 (100.0%) |
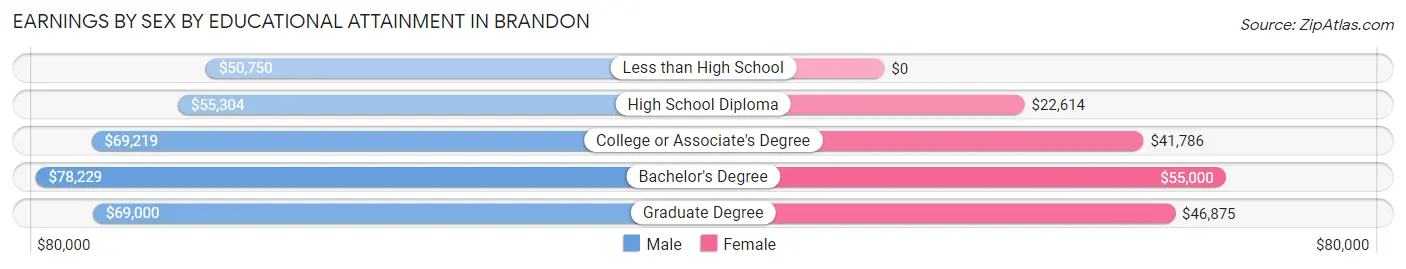
Earnings by Sex by Educational Attainment in Brandon
Average earnings in Brandon are $57,244 for men and $41,000 for women, a difference of 28.4%. Men with an educational attainment of bachelor's degree enjoy the highest average annual earnings of $78,229, while those with less than high school education earn the least with $50,750. Women with an educational attainment of bachelor's degree earn the most with the average annual earnings of $55,000, while those with high school diploma education have the smallest earnings of $22,614.
| Educational Attainment | Male Income | Female Income |
| Less than High School | $50,750 | $0 |
| High School Diploma | $55,304 | $22,614 |
| College or Associate's Degree | $69,219 | $41,786 |
| Bachelor's Degree | $78,229 | $55,000 |
| Graduate Degree | $69,000 | $46,875 |
| Total | $57,244 | $41,000 |
Family Income in Brandon
Family Income Brackets in Brandon
According to the Brandon family income data, there are 72 families falling into the $100,000 to $149,999 income range, which is the most common income bracket and makes up 37.5% of all families.
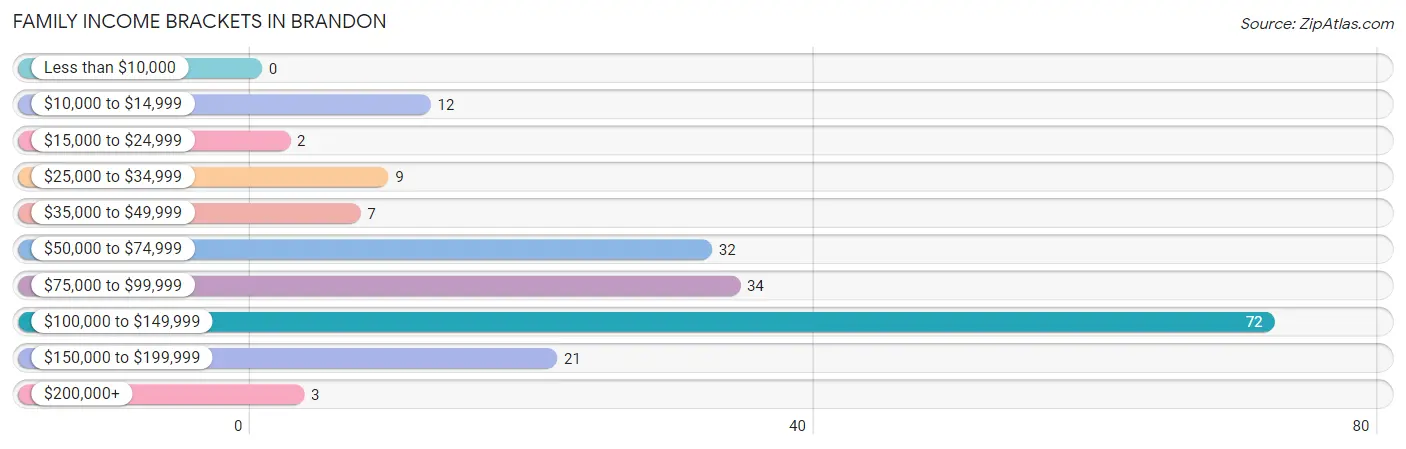
| Income Bracket | # Families | % Families |
| Less than $10,000 | 0 | 0.0% |
| $10,000 to $14,999 | 12 | 6.3% |
| $15,000 to $24,999 | 2 | 1.0% |
| $25,000 to $34,999 | 9 | 4.7% |
| $35,000 to $49,999 | 7 | 3.6% |
| $50,000 to $74,999 | 32 | 16.7% |
| $75,000 to $99,999 | 34 | 17.7% |
| $100,000 to $149,999 | 72 | 37.5% |
| $150,000 to $199,999 | 21 | 10.9% |
| $200,000+ | 3 | 1.6% |
Family Income by Famaliy Size in Brandon
5-person families (20 | 10.4%) account for the highest median family income in Brandon with $148,214 per family, while 2-person families (78 | 40.6%) have the highest median income of $40,416 per family member.
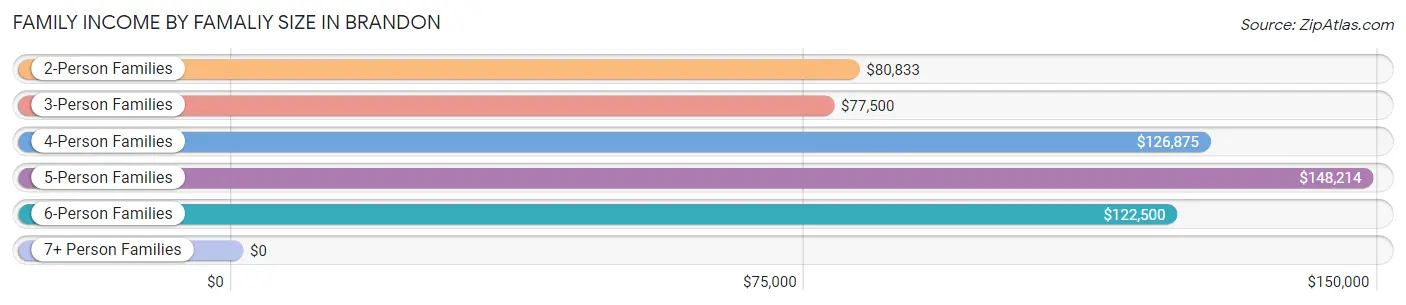
| Income Bracket | # Families | Median Income |
| 2-Person Families | 78 (40.6%) | $80,833 |
| 3-Person Families | 44 (22.9%) | $77,500 |
| 4-Person Families | 42 (21.9%) | $126,875 |
| 5-Person Families | 20 (10.4%) | $148,214 |
| 6-Person Families | 8 (4.2%) | $122,500 |
| 7+ Person Families | 0 (0.0%) | $0 |
| Total | 192 (100.0%) | $102,500 |
Family Income by Number of Earners in Brandon
The median family income in Brandon is $102,500, with families comprising 3+ earners (50) having the highest median family income of $137,500, while families with 1 earner (39) have the lowest median family income of $44,250, accounting for 26.0% and 20.3% of families, respectively.
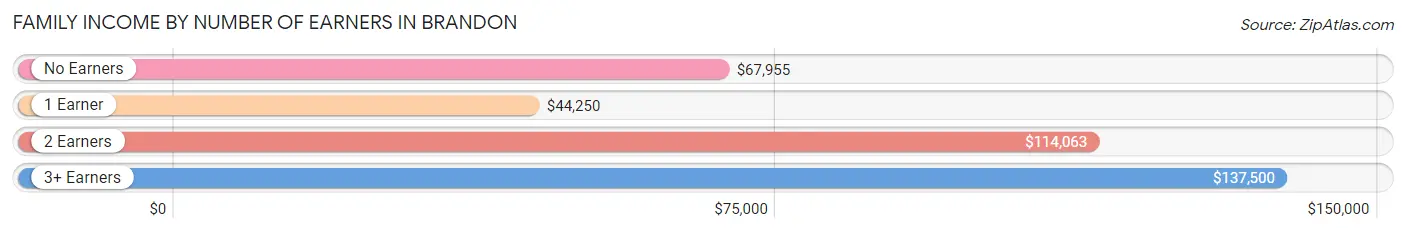
| Number of Earners | # Families | Median Income |
| No Earners | 22 (11.5%) | $67,955 |
| 1 Earner | 39 (20.3%) | $44,250 |
| 2 Earners | 81 (42.2%) | $114,063 |
| 3+ Earners | 50 (26.0%) | $137,500 |
| Total | 192 (100.0%) | $102,500 |
Household Income in Brandon
Household Income Brackets in Brandon
With 79 households falling in the category, the $100,000 to $149,999 income range is the most frequent in Brandon, accounting for 23.9% of all households. In contrast, only 5 households (1.5%) fall into the $10,000 to $14,999 income bracket, making it the least populous group.
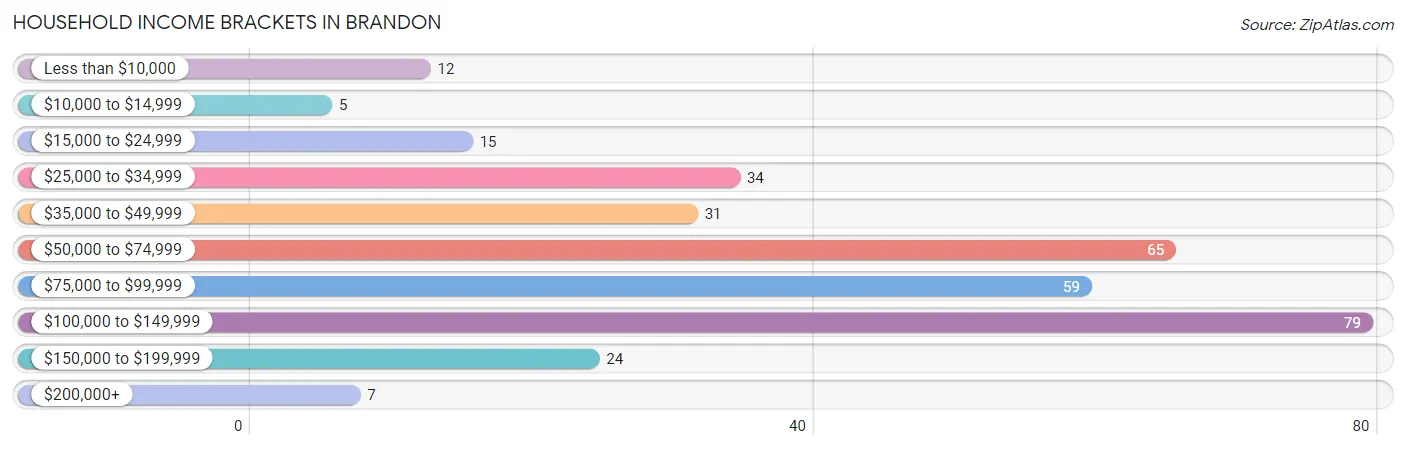
| Income Bracket | # Households | % Households |
| Less than $10,000 | 12 | 3.6% |
| $10,000 to $14,999 | 5 | 1.5% |
| $15,000 to $24,999 | 15 | 4.5% |
| $25,000 to $34,999 | 34 | 10.3% |
| $35,000 to $49,999 | 31 | 9.4% |
| $50,000 to $74,999 | 65 | 19.6% |
| $75,000 to $99,999 | 59 | 17.8% |
| $100,000 to $149,999 | 79 | 23.9% |
| $150,000 to $199,999 | 24 | 7.3% |
| $200,000+ | 7 | 2.1% |
Household Income by Householder Age in Brandon
The median household income in Brandon is $79,688, with the highest median household income of $113,333 found in the 45 to 64 years age bracket for the primary householder. A total of 146 households (44.1%) fall into this category. Meanwhile, the 15 to 24 years age bracket for the primary householder has the lowest median household income of $33,333, with 8 households (2.4%) in this group.
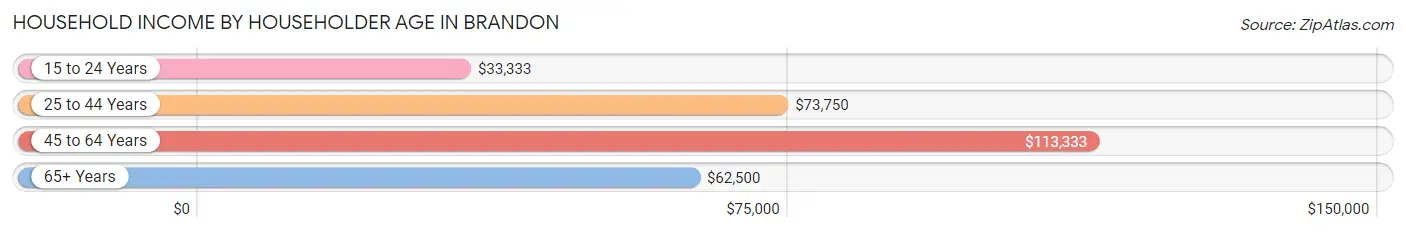
| Income Bracket | # Households | Median Income |
| 15 to 24 Years | 8 (2.4%) | $33,333 |
| 25 to 44 Years | 107 (32.3%) | $73,750 |
| 45 to 64 Years | 146 (44.1%) | $113,333 |
| 65+ Years | 70 (21.1%) | $62,500 |
| Total | 331 (100.0%) | $79,688 |
Poverty in Brandon
Income Below Poverty by Sex and Age in Brandon
With 5.5% poverty level for males and 12.8% for females among the residents of Brandon, 16 and 17 year old males and 12 to 14 year old females are the most vulnerable to poverty, with 2 males (20.0%) and 10 females (33.3%) in their respective age groups living below the poverty level.
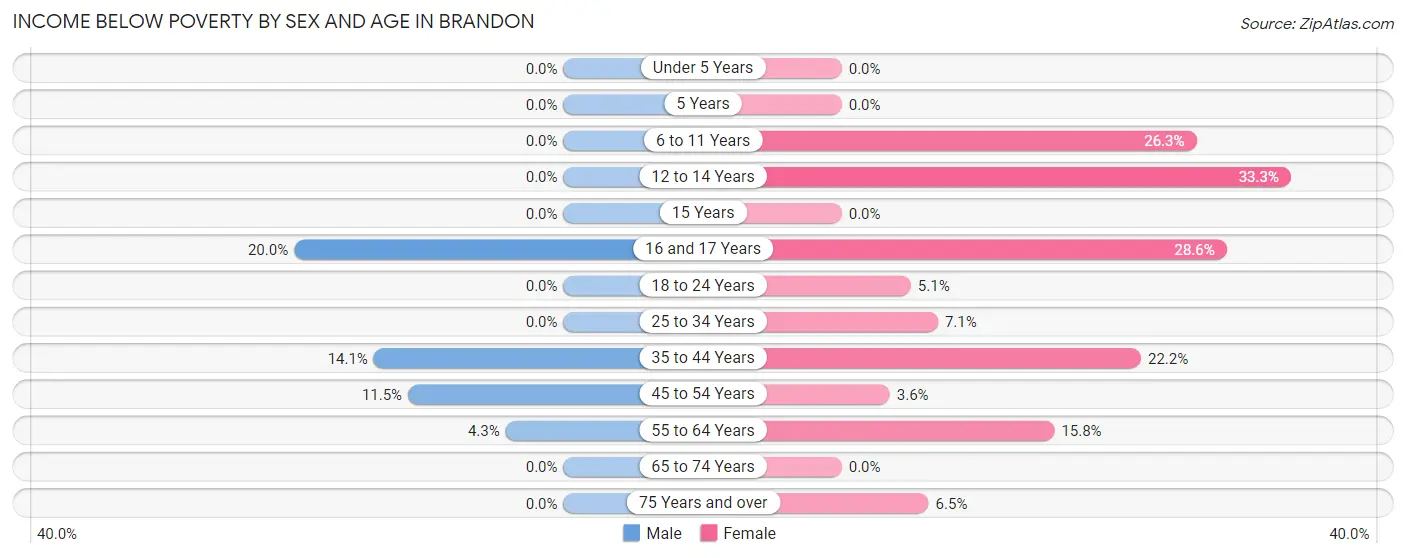
| Age Bracket | Male | Female |
| Under 5 Years | 0 (0.0%) | 0 (0.0%) |
| 5 Years | 0 (0.0%) | 0 (0.0%) |
| 6 to 11 Years | 0 (0.0%) | 10 (26.3%) |
| 12 to 14 Years | 0 (0.0%) | 10 (33.3%) |
| 15 Years | 0 (0.0%) | 0 (0.0%) |
| 16 and 17 Years | 2 (20.0%) | 2 (28.6%) |
| 18 to 24 Years | 0 (0.0%) | 2 (5.1%) |
| 25 to 34 Years | 0 (0.0%) | 3 (7.1%) |
| 35 to 44 Years | 10 (14.1%) | 12 (22.2%) |
| 45 to 54 Years | 9 (11.5%) | 2 (3.6%) |
| 55 to 64 Years | 3 (4.3%) | 9 (15.8%) |
| 65 to 74 Years | 0 (0.0%) | 0 (0.0%) |
| 75 Years and over | 0 (0.0%) | 2 (6.5%) |
| Total | 24 (5.5%) | 52 (12.8%) |
Income Above Poverty by Sex and Age in Brandon
According to the poverty statistics in Brandon, males aged under 5 years and females aged under 5 years are the age groups that are most secure financially, with 100.0% of males and 100.0% of females in these age groups living above the poverty line.
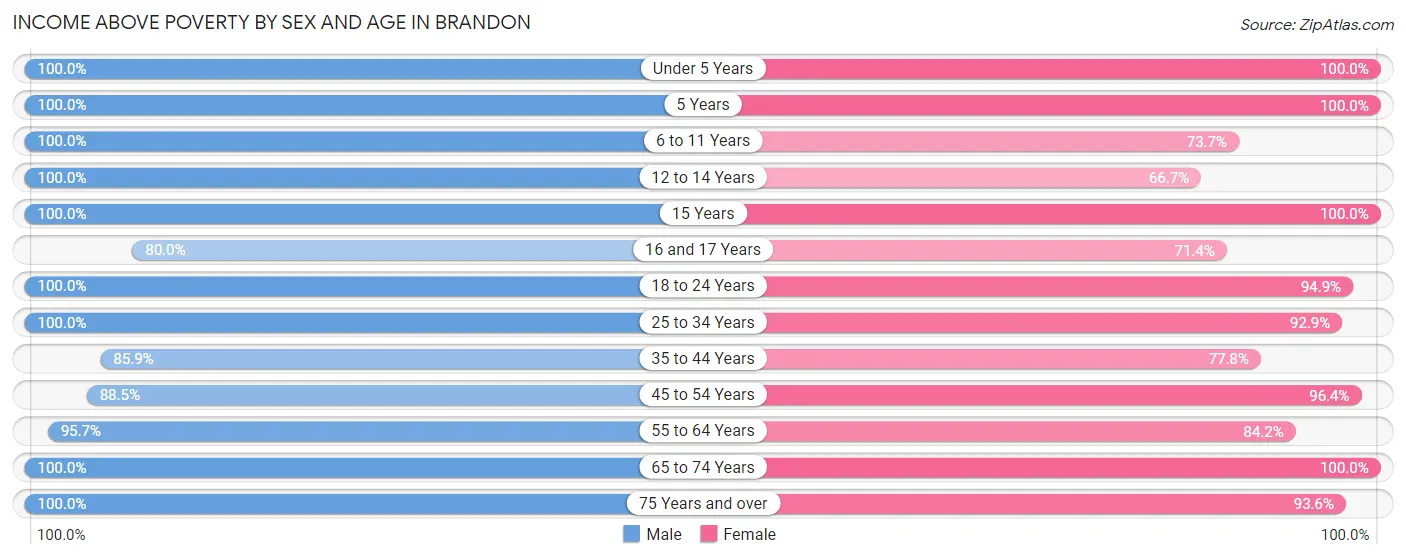
| Age Bracket | Male | Female |
| Under 5 Years | 7 (100.0%) | 14 (100.0%) |
| 5 Years | 6 (100.0%) | 4 (100.0%) |
| 6 to 11 Years | 30 (100.0%) | 28 (73.7%) |
| 12 to 14 Years | 30 (100.0%) | 20 (66.7%) |
| 15 Years | 10 (100.0%) | 11 (100.0%) |
| 16 and 17 Years | 8 (80.0%) | 5 (71.4%) |
| 18 to 24 Years | 33 (100.0%) | 37 (94.9%) |
| 25 to 34 Years | 41 (100.0%) | 39 (92.9%) |
| 35 to 44 Years | 61 (85.9%) | 42 (77.8%) |
| 45 to 54 Years | 69 (88.5%) | 54 (96.4%) |
| 55 to 64 Years | 67 (95.7%) | 48 (84.2%) |
| 65 to 74 Years | 23 (100.0%) | 24 (100.0%) |
| 75 Years and over | 24 (100.0%) | 29 (93.5%) |
| Total | 409 (94.5%) | 355 (87.2%) |
Income Below Poverty Among Married-Couple Families in Brandon
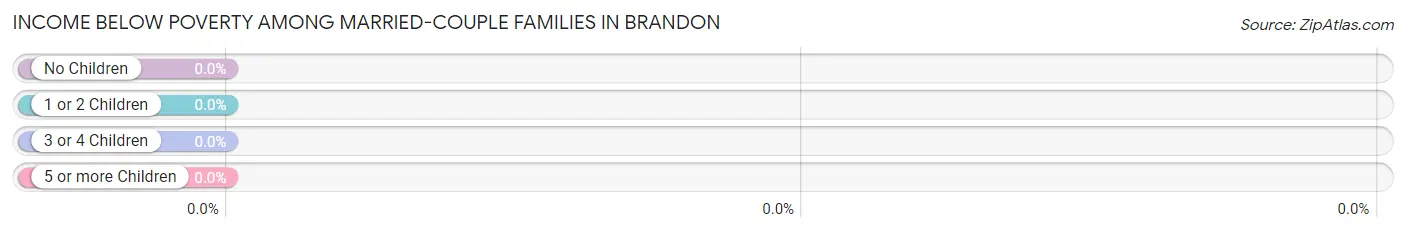
| Children | Above Poverty | Below Poverty |
| No Children | 92 (100.0%) | 0 (0.0%) |
| 1 or 2 Children | 50 (100.0%) | 0 (0.0%) |
| 3 or 4 Children | 19 (100.0%) | 0 (0.0%) |
| 5 or more Children | 0 (0.0%) | 0 (0.0%) |
| Total | 161 (100.0%) | 0 (0.0%) |
Income Below Poverty Among Single-Parent Households in Brandon
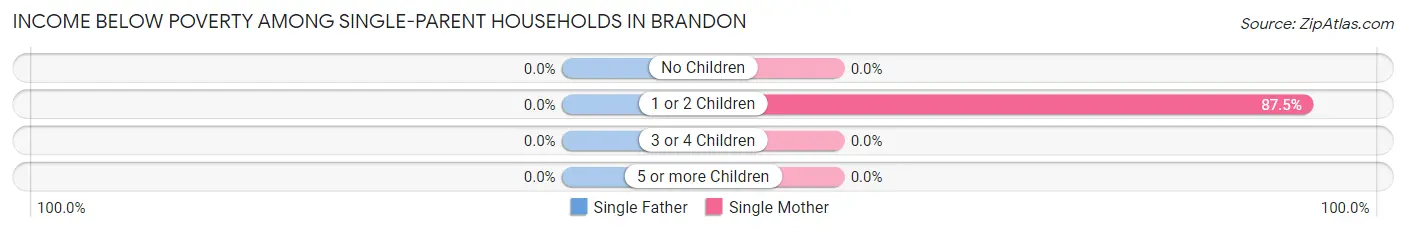
| Children | Single Father | Single Mother |
| No Children | 0 (0.0%) | 0 (0.0%) |
| 1 or 2 Children | 0 (0.0%) | 14 (87.5%) |
| 3 or 4 Children | 0 (0.0%) | 0 (0.0%) |
| 5 or more Children | 0 (0.0%) | 0 (0.0%) |
| Total | 0 (0.0%) | 14 (66.7%) |
Income Below Poverty Among Married-Couple vs Single-Parent Households in Brandon
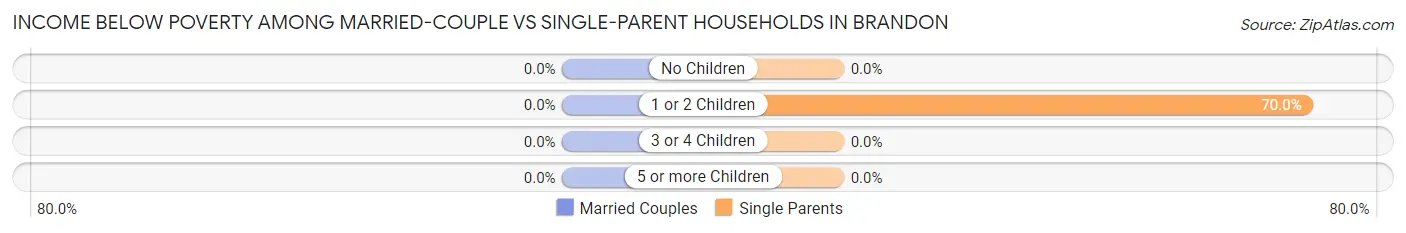
| Children | Married-Couple Families | Single-Parent Households |
| No Children | 0 (0.0%) | 0 (0.0%) |
| 1 or 2 Children | 0 (0.0%) | 14 (70.0%) |
| 3 or 4 Children | 0 (0.0%) | 0 (0.0%) |
| 5 or more Children | 0 (0.0%) | 0 (0.0%) |
| Total | 0 (0.0%) | 14 (45.2%) |
Race in Brandon
The most populous races in Brandon are White / Caucasian (754 | 89.5%), Black / African American (43 | 5.1%), and Hispanic or Latino (28 | 3.3%).
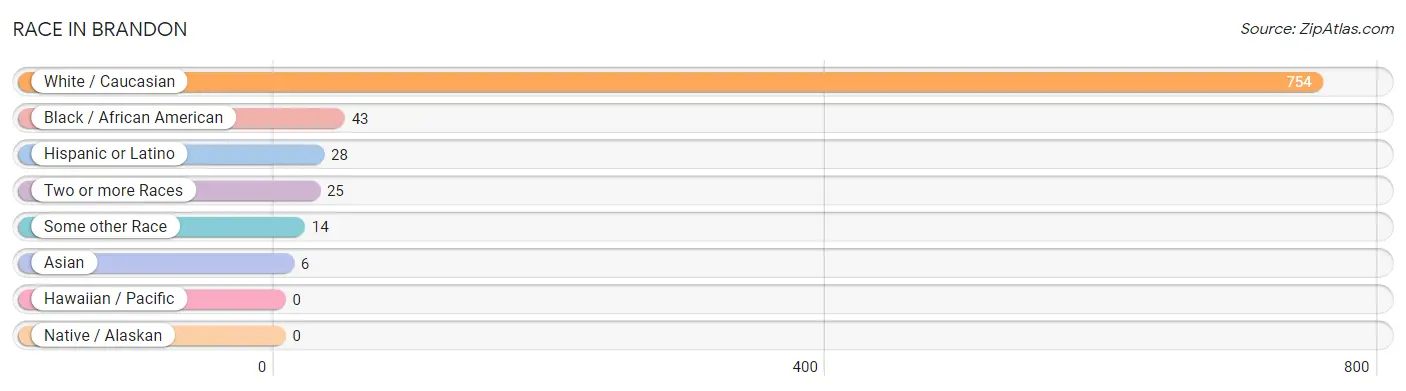
| Race | # Population | % Population |
| Asian | 6 | 0.7% |
| Black / African American | 43 | 5.1% |
| Hawaiian / Pacific | 0 | 0.0% |
| Hispanic or Latino | 28 | 3.3% |
| Native / Alaskan | 0 | 0.0% |
| White / Caucasian | 754 | 89.5% |
| Two or more Races | 25 | 3.0% |
| Some other Race | 14 | 1.7% |
| Total | 842 | 100.0% |
Ancestry in Brandon
The most populous ancestries reported in Brandon are German (360 | 42.8%), Dutch (134 | 15.9%), Irish (130 | 15.4%), Polish (56 | 6.7%), and English (46 | 5.5%), together accounting for 86.2% of all Brandon residents.
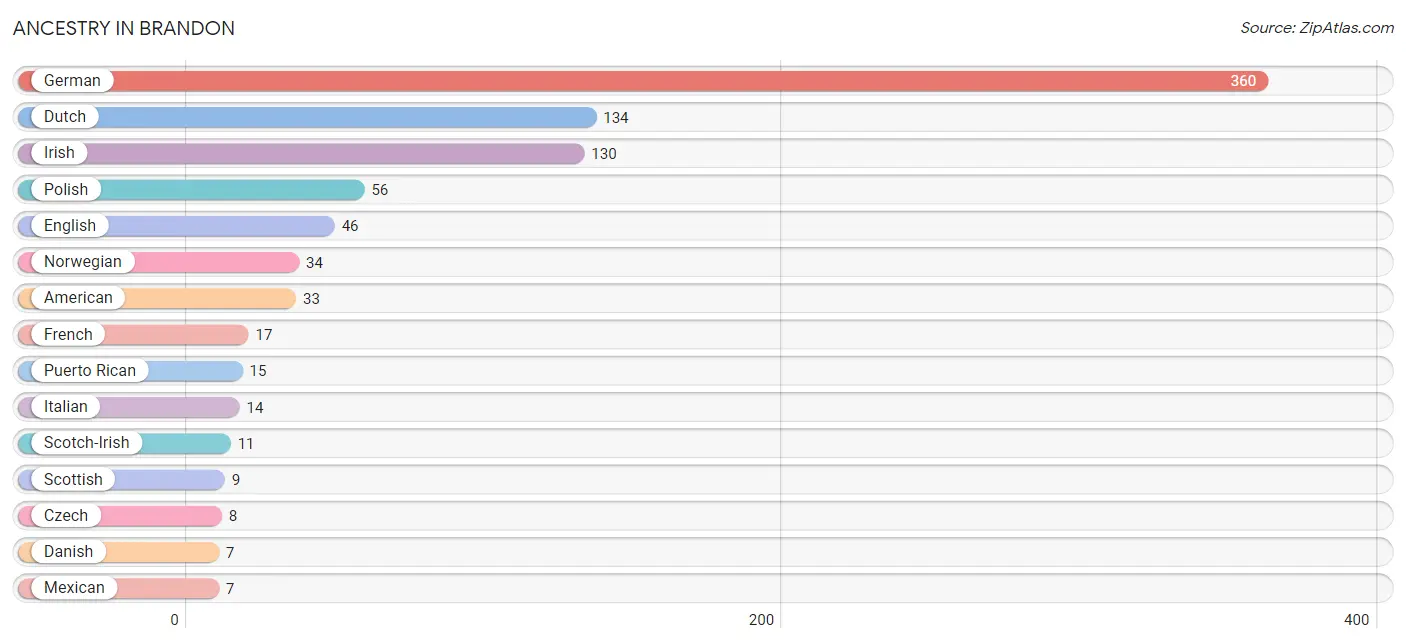
| Ancestry | # Population | % Population |
| American | 33 | 3.9% |
| Australian | 3 | 0.4% |
| Canadian | 6 | 0.7% |
| Central American | 2 | 0.2% |
| Chippewa | 3 | 0.4% |
| Czech | 8 | 0.9% |
| Danish | 7 | 0.8% |
| Dutch | 134 | 15.9% |
| Eastern European | 5 | 0.6% |
| English | 46 | 5.5% |
| European | 1 | 0.1% |
| French | 17 | 2.0% |
| French Canadian | 2 | 0.2% |
| German | 360 | 42.8% |
| Indian (Asian) | 3 | 0.4% |
| Irish | 130 | 15.4% |
| Italian | 14 | 1.7% |
| Korean | 3 | 0.4% |
| Mexican | 7 | 0.8% |
| Norwegian | 34 | 4.0% |
| Polish | 56 | 6.7% |
| Puerto Rican | 15 | 1.8% |
| Russian | 6 | 0.7% |
| Salvadoran | 2 | 0.2% |
| Scotch-Irish | 11 | 1.3% |
| Scottish | 9 | 1.1% |
| Swedish | 2 | 0.2% | View All 27 Rows |
Immigrants in Brandon
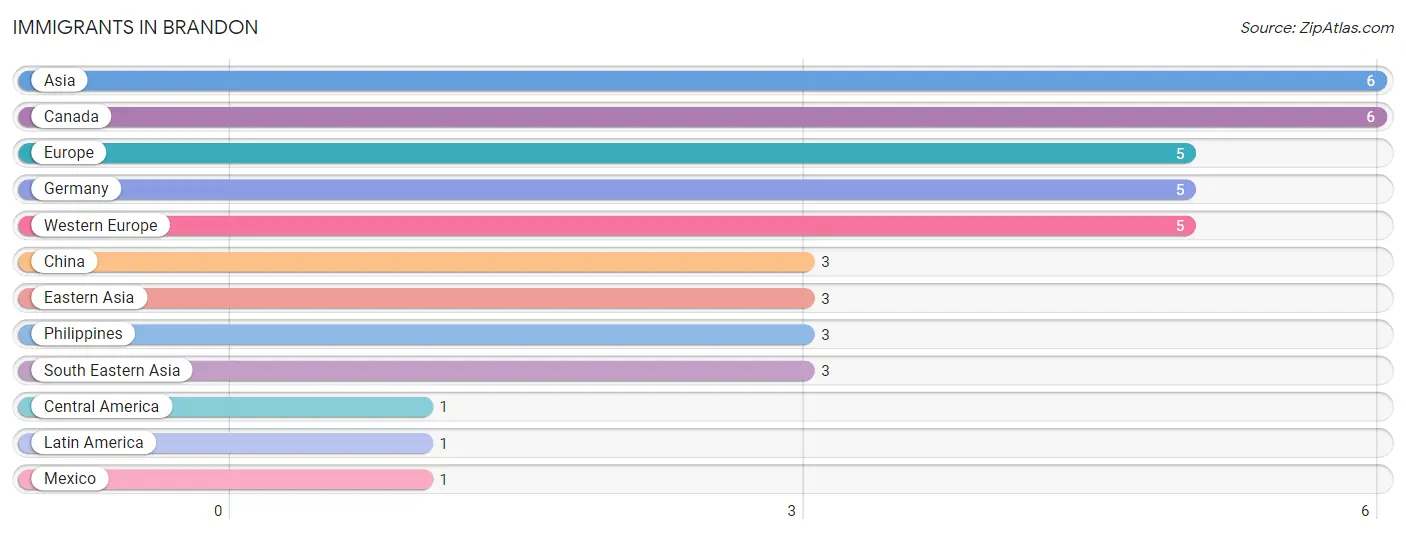
The most numerous immigrant groups reported in Brandon came from Asia (6 | 0.7%), Canada (6 | 0.7%), Europe (5 | 0.6%), Germany (5 | 0.6%), and Western Europe (5 | 0.6%), together accounting for 3.2% of all Brandon residents.
| Immigration Origin | # Population | % Population |
| Asia | 6 | 0.7% |
| Canada | 6 | 0.7% |
| Central America | 1 | 0.1% |
| China | 3 | 0.4% |
| Eastern Asia | 3 | 0.4% |
| Europe | 5 | 0.6% |
| Germany | 5 | 0.6% |
| Latin America | 1 | 0.1% |
| Mexico | 1 | 0.1% |
| Philippines | 3 | 0.4% |
| South Eastern Asia | 3 | 0.4% |
| Western Europe | 5 | 0.6% | View All 12 Rows |
Sex and Age in Brandon
Sex and Age in Brandon
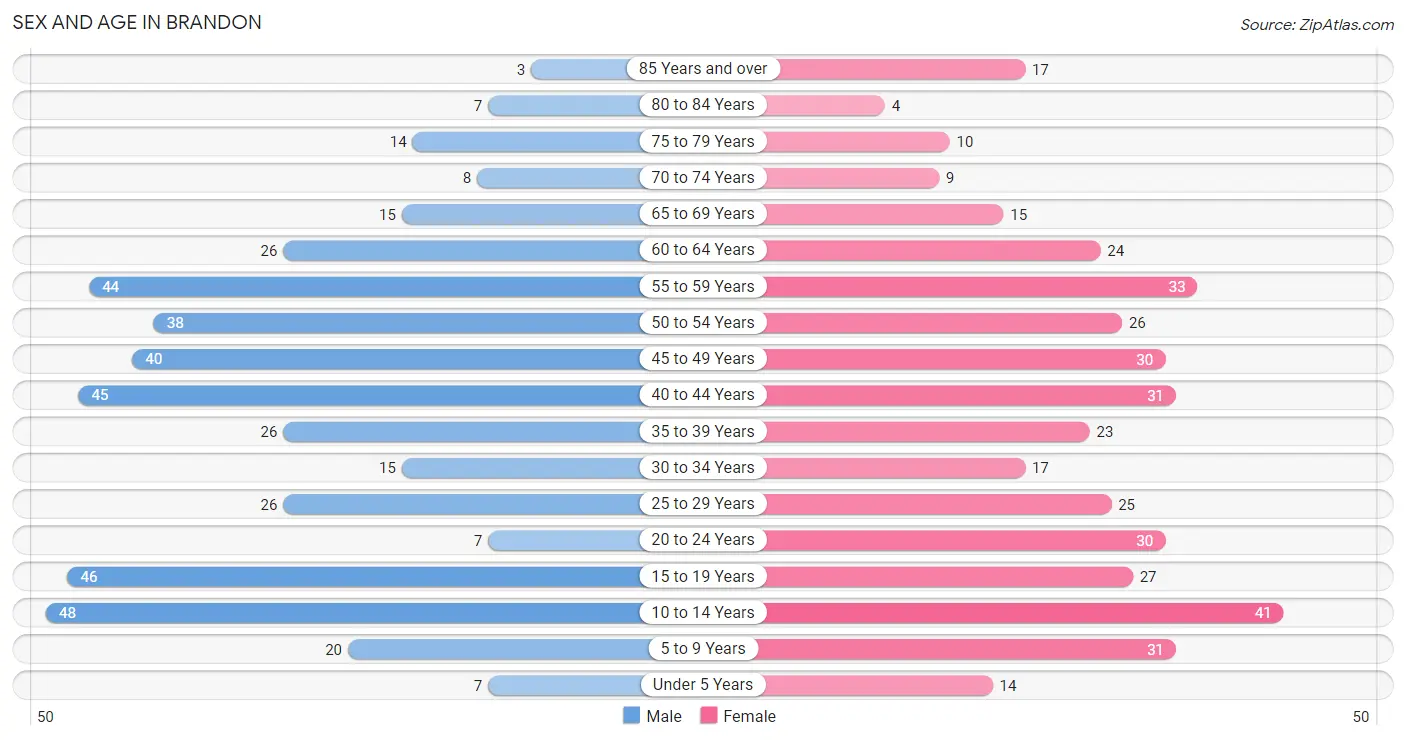
The most populous age groups in Brandon are 10 to 14 Years (48 | 11.0%) for men and 10 to 14 Years (41 | 10.1%) for women.
| Age Bracket | Male | Female |
| Under 5 Years | 7 (1.6%) | 14 (3.4%) |
| 5 to 9 Years | 20 (4.6%) | 31 (7.6%) |
| 10 to 14 Years | 48 (11.0%) | 41 (10.1%) |
| 15 to 19 Years | 46 (10.6%) | 27 (6.6%) |
| 20 to 24 Years | 7 (1.6%) | 30 (7.4%) |
| 25 to 29 Years | 26 (6.0%) | 25 (6.1%) |
| 30 to 34 Years | 15 (3.5%) | 17 (4.2%) |
| 35 to 39 Years | 26 (6.0%) | 23 (5.7%) |
| 40 to 44 Years | 45 (10.3%) | 31 (7.6%) |
| 45 to 49 Years | 40 (9.2%) | 30 (7.4%) |
| 50 to 54 Years | 38 (8.7%) | 26 (6.4%) |
| 55 to 59 Years | 44 (10.1%) | 33 (8.1%) |
| 60 to 64 Years | 26 (6.0%) | 24 (5.9%) |
| 65 to 69 Years | 15 (3.5%) | 15 (3.7%) |
| 70 to 74 Years | 8 (1.8%) | 9 (2.2%) |
| 75 to 79 Years | 14 (3.2%) | 10 (2.5%) |
| 80 to 84 Years | 7 (1.6%) | 4 (1.0%) |
| 85 Years and over | 3 (0.7%) | 17 (4.2%) |
| Total | 435 (100.0%) | 407 (100.0%) |
Families and Households in Brandon
Median Family Size in Brandon
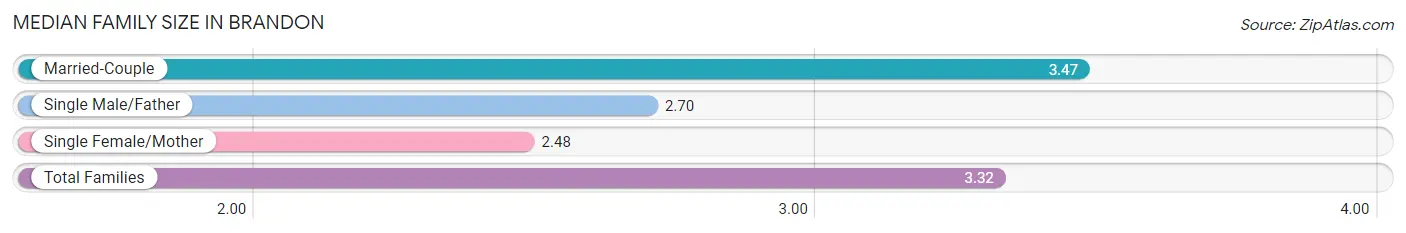
The median family size in Brandon is 3.32 persons per family, with married-couple families (161 | 83.9%) accounting for the largest median family size of 3.47 persons per family. On the other hand, single female/mother families (21 | 10.9%) represent the smallest median family size with 2.48 persons per family.
| Family Type | # Families | Family Size |
| Married-Couple | 161 (83.9%) | 3.47 |
| Single Male/Father | 10 (5.2%) | 2.70 |
| Single Female/Mother | 21 (10.9%) | 2.48 |
| Total Families | 192 (100.0%) | 3.32 |
Median Household Size in Brandon
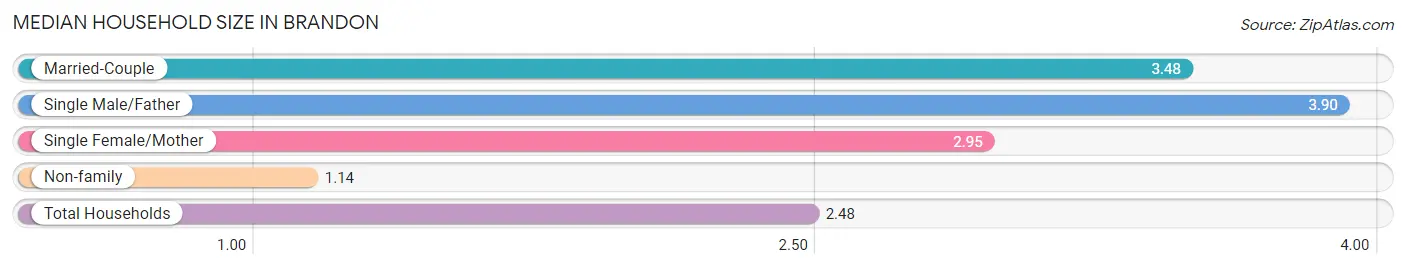
The median household size in Brandon is 2.48 persons per household, with single male/father households (10 | 3.0%) accounting for the largest median household size of 3.9 persons per household. non-family households (139 | 42.0%) represent the smallest median household size with 1.14 persons per household.
| Household Type | # Households | Household Size |
| Married-Couple | 161 (48.6%) | 3.48 |
| Single Male/Father | 10 (3.0%) | 3.90 |
| Single Female/Mother | 21 (6.3%) | 2.95 |
| Non-family | 139 (42.0%) | 1.14 |
| Total Households | 331 (100.0%) | 2.48 |
Household Size by Marriage Status in Brandon
Out of a total of 331 households in Brandon, 192 (58.0%) are family households, while 139 (42.0%) are nonfamily households. The most numerous type of family households are 2-person households, comprising 75, and the most common type of nonfamily households are 1-person households, comprising 118.
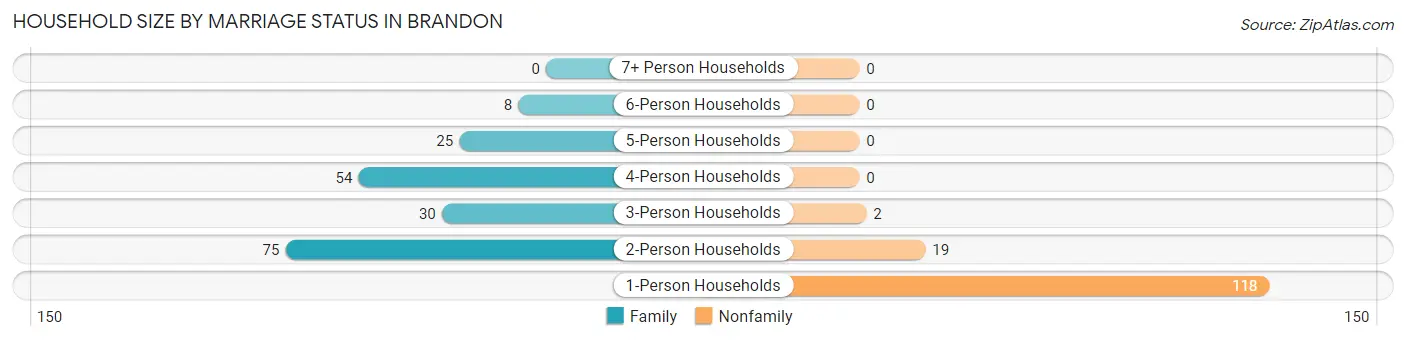
| Household Size | Family Households | Nonfamily Households |
| 1-Person Households | - | 118 (35.6%) |
| 2-Person Households | 75 (22.7%) | 19 (5.7%) |
| 3-Person Households | 30 (9.1%) | 2 (0.6%) |
| 4-Person Households | 54 (16.3%) | 0 (0.0%) |
| 5-Person Households | 25 (7.5%) | 0 (0.0%) |
| 6-Person Households | 8 (2.4%) | 0 (0.0%) |
| 7+ Person Households | 0 (0.0%) | 0 (0.0%) |
| Total | 192 (58.0%) | 139 (42.0%) |
Female Fertility in Brandon
Fertility by Age in Brandon
Average fertility rate in Brandon is 68.0 births per 1,000 women. Women in the age bracket of 20 to 34 years have the highest fertility rate with 167.0 births per 1,000 women. Women in the age bracket of 20 to 34 years acount for 92.3% of all women with births.
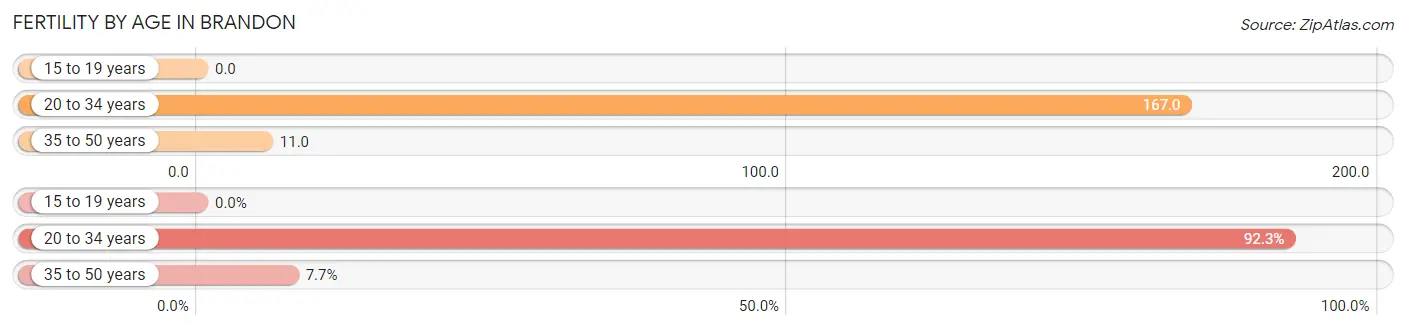
| Age Bracket | Women with Births | Births / 1,000 Women |
| 15 to 19 years | 0 (0.0%) | 0.0 |
| 20 to 34 years | 12 (92.3%) | 167.0 |
| 35 to 50 years | 1 (7.7%) | 11.0 |
| Total | 13 (100.0%) | 68.0 |
Fertility by Age by Marriage Status in Brandon
76.9% of women with births (13) in Brandon are married. The highest percentage of unmarried women with births falls into 20 to 34 years age bracket with 25.0% of them unmarried at the time of birth, while the lowest percentage of unmarried women with births belong to 35 to 50 years age bracket with 0.0% of them unmarried.
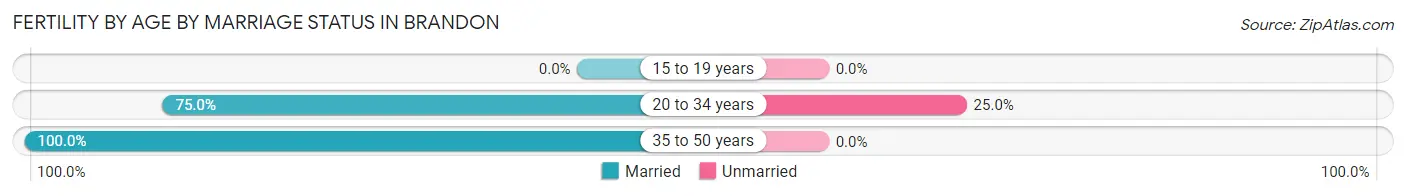
| Age Bracket | Married | Unmarried |
| 15 to 19 years | 0 (0.0%) | 0 (0.0%) |
| 20 to 34 years | 9 (75.0%) | 3 (25.0%) |
| 35 to 50 years | 1 (100.0%) | 0 (0.0%) |
| Total | 10 (76.9%) | 3 (23.1%) |
Fertility by Education in Brandon
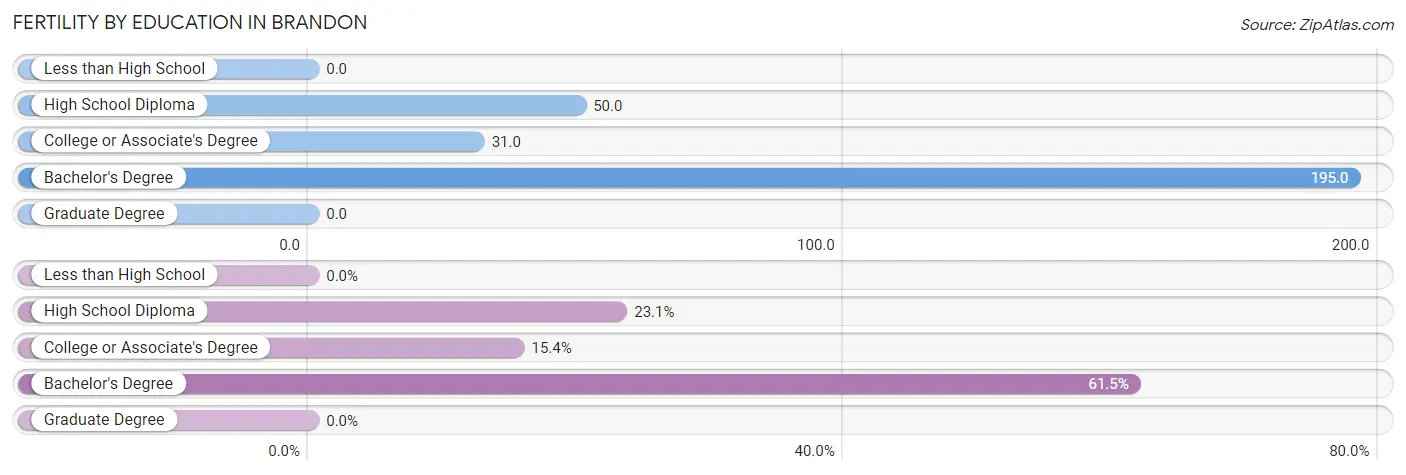
| Educational Attainment | Women with Births | Births / 1,000 Women |
| Less than High School | 0 (0.0%) | 0.0 |
| High School Diploma | 3 (23.1%) | 50.0 |
| College or Associate's Degree | 2 (15.4%) | 31.0 |
| Bachelor's Degree | 8 (61.5%) | 195.0 |
| Graduate Degree | 0 (0.0%) | 0.0 |
| Total | 13 (100.0%) | 68.0 |
Fertility by Education by Marriage Status in Brandon
23.1% of women with births in Brandon are unmarried. Women with the educational attainment of college or associate's degree are most likely to be married with 100.0% of them married at childbirth, while women with the educational attainment of high school diploma are least likely to be married with 100.0% of them unmarried at childbirth.
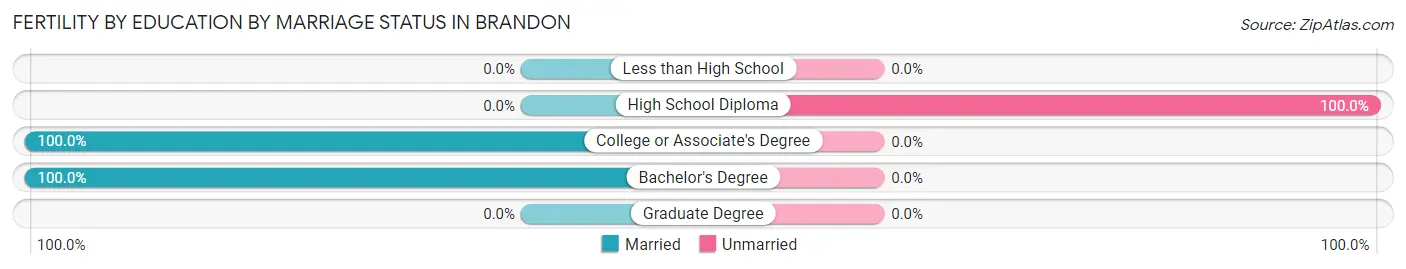
| Educational Attainment | Married | Unmarried |
| Less than High School | 0 (0.0%) | 0 (0.0%) |
| High School Diploma | 0 (0.0%) | 3 (100.0%) |
| College or Associate's Degree | 2 (100.0%) | 0 (0.0%) |
| Bachelor's Degree | 8 (100.0%) | 0 (0.0%) |
| Graduate Degree | 0 (0.0%) | 0 (0.0%) |
| Total | 10 (76.9%) | 3 (23.1%) |
Employment Characteristics in Brandon
Employment by Class of Employer in Brandon
Among the 471 employed individuals in Brandon, private company employees (324 | 68.8%), state government employees (37 | 7.9%), and local government employees (32 | 6.8%) make up the most common classes of employment.
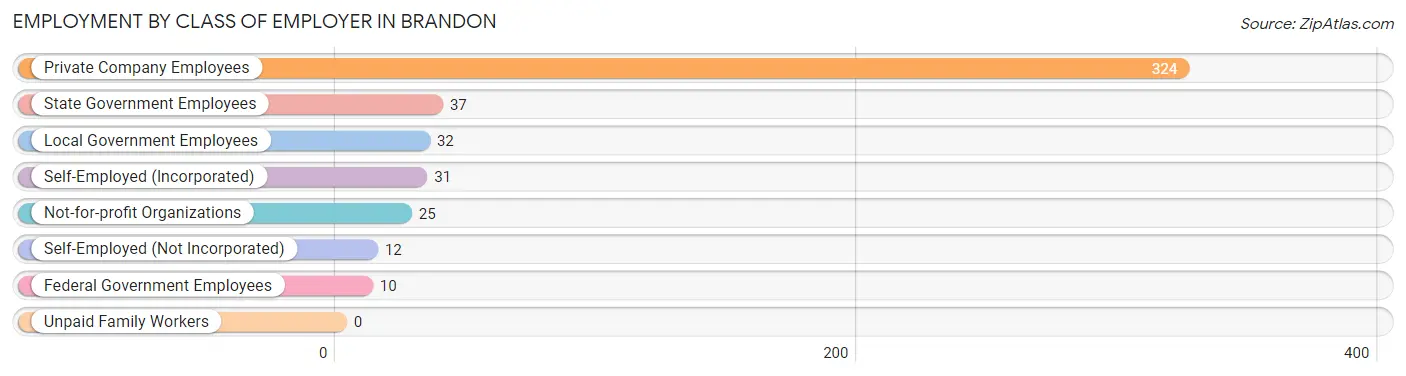
| Employer Class | # Employees | % Employees |
| Private Company Employees | 324 | 68.8% |
| Self-Employed (Incorporated) | 31 | 6.6% |
| Self-Employed (Not Incorporated) | 12 | 2.5% |
| Not-for-profit Organizations | 25 | 5.3% |
| Local Government Employees | 32 | 6.8% |
| State Government Employees | 37 | 7.9% |
| Federal Government Employees | 10 | 2.1% |
| Unpaid Family Workers | 0 | 0.0% |
| Total | 471 | 100.0% |
Employment Status by Age in Brandon
According to the labor force statistics for Brandon, out of the total population over 16 years of age (660), 75.0% or 495 individuals are in the labor force, with 4.0% or 20 of them unemployed. The age group with the highest labor force participation rate is 25 to 29 years, with 100.0% or 51 individuals in the labor force. Within the labor force, the 16 to 19 years age range has the highest percentage of unemployed individuals, with 20.0% or 7 of them being unemployed.
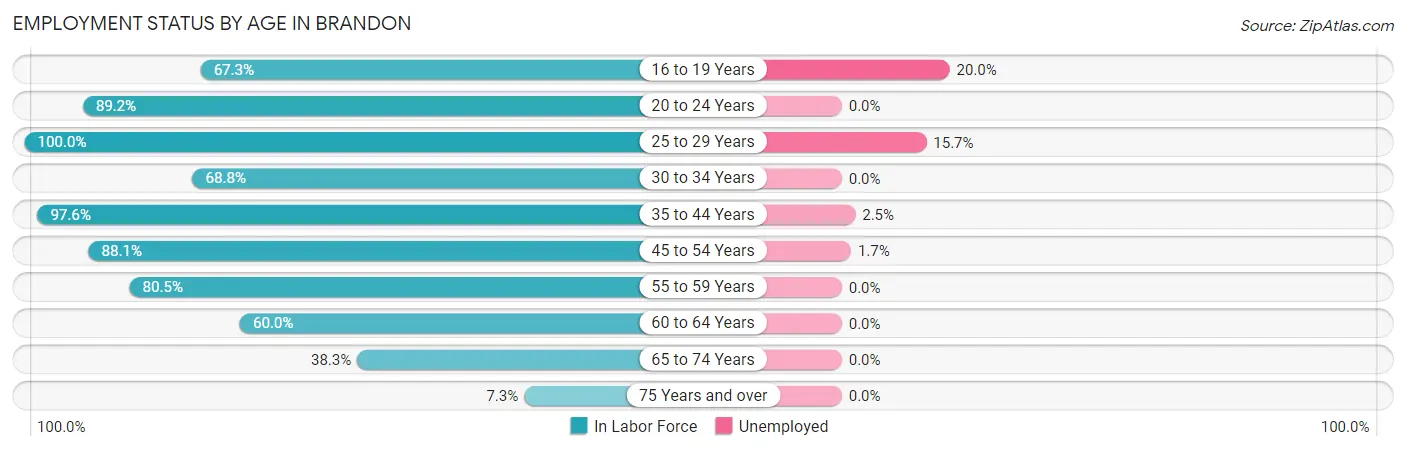
| Age Bracket | In Labor Force | Unemployed |
| 16 to 19 Years | 35 (67.3%) | 7 (20.0%) |
| 20 to 24 Years | 33 (89.2%) | 0 (0.0%) |
| 25 to 29 Years | 51 (100.0%) | 8 (15.7%) |
| 30 to 34 Years | 22 (68.8%) | 0 (0.0%) |
| 35 to 44 Years | 122 (97.6%) | 3 (2.5%) |
| 45 to 54 Years | 118 (88.1%) | 2 (1.7%) |
| 55 to 59 Years | 62 (80.5%) | 0 (0.0%) |
| 60 to 64 Years | 30 (60.0%) | 0 (0.0%) |
| 65 to 74 Years | 18 (38.3%) | 0 (0.0%) |
| 75 Years and over | 4 (7.3%) | 0 (0.0%) |
| Total | 495 (75.0%) | 20 (4.0%) |
Employment Status by Educational Attainment in Brandon
According to labor force statistics for Brandon, 86.4% of individuals (405) out of the total population between 25 and 64 years of age (469) are in the labor force, with 3.2% or 13 of them being unemployed. The group with the highest labor force participation rate are those with the educational attainment of less than high school, with 100.0% or 7 individuals in the labor force. Within the labor force, individuals with college / associate degree education have the highest percentage of unemployment, with 7.4% or 11 of them being unemployed.
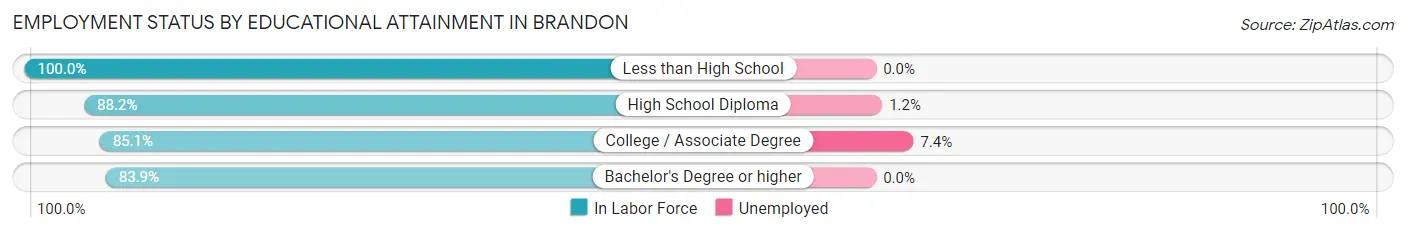
| Educational Attainment | In Labor Force | Unemployed |
| Less than High School | 7 (100.0%) | 0 (0.0%) |
| High School Diploma | 172 (88.2%) | 2 (1.2%) |
| College / Associate Degree | 148 (85.1%) | 13 (7.4%) |
| Bachelor's Degree or higher | 78 (83.9%) | 0 (0.0%) |
| Total | 405 (86.4%) | 15 (3.2%) |
Employment Occupations by Sex in Brandon
Management, Business, Science and Arts Occupations
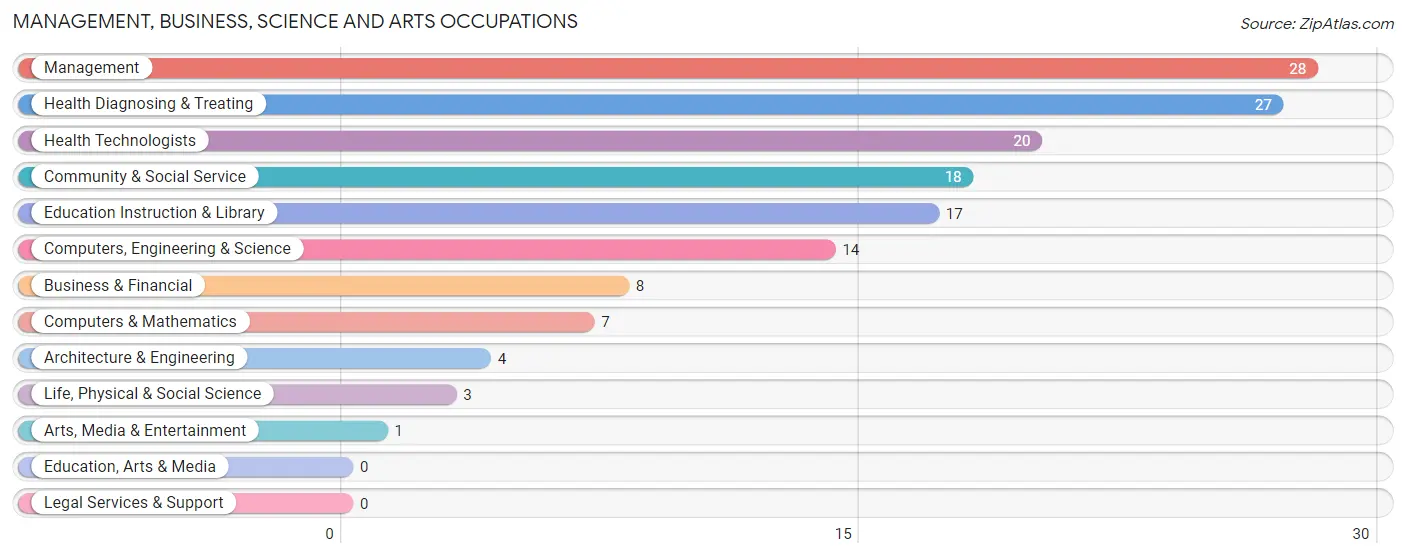
The most common Management, Business, Science and Arts occupations in Brandon are Management (28 | 5.9%), Health Diagnosing & Treating (27 | 5.7%), Health Technologists (20 | 4.2%), Community & Social Service (18 | 3.8%), and Education Instruction & Library (17 | 3.6%).
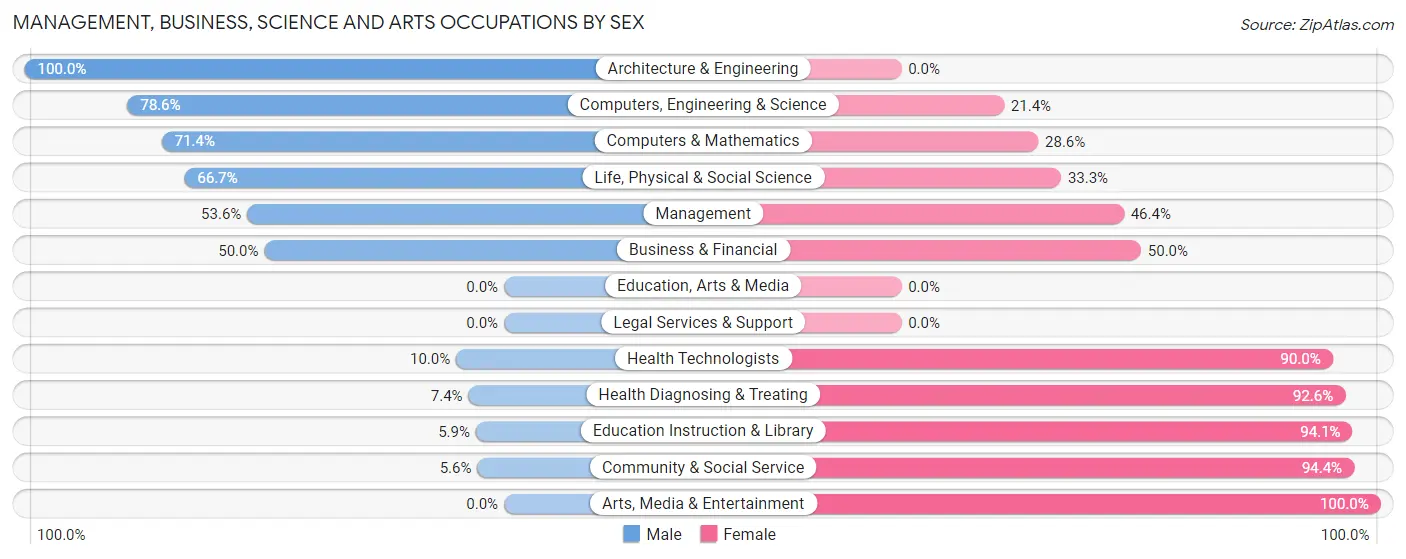
Management, Business, Science and Arts Occupations by Sex
Within the Management, Business, Science and Arts occupations in Brandon, the most male-oriented occupations are Architecture & Engineering (100.0%), Computers, Engineering & Science (78.6%), and Computers & Mathematics (71.4%), while the most female-oriented occupations are Arts, Media & Entertainment (100.0%), Community & Social Service (94.4%), and Education Instruction & Library (94.1%).
| Occupation | Male | Female |
| Management | 15 (53.6%) | 13 (46.4%) |
| Business & Financial | 4 (50.0%) | 4 (50.0%) |
| Computers, Engineering & Science | 11 (78.6%) | 3 (21.4%) |
| Computers & Mathematics | 5 (71.4%) | 2 (28.6%) |
| Architecture & Engineering | 4 (100.0%) | 0 (0.0%) |
| Life, Physical & Social Science | 2 (66.7%) | 1 (33.3%) |
| Community & Social Service | 1 (5.6%) | 17 (94.4%) |
| Education, Arts & Media | 0 (0.0%) | 0 (0.0%) |
| Legal Services & Support | 0 (0.0%) | 0 (0.0%) |
| Education Instruction & Library | 1 (5.9%) | 16 (94.1%) |
| Arts, Media & Entertainment | 0 (0.0%) | 1 (100.0%) |
| Health Diagnosing & Treating | 2 (7.4%) | 25 (92.6%) |
| Health Technologists | 2 (10.0%) | 18 (90.0%) |
| Total (Category) | 33 (34.7%) | 62 (65.3%) |
| Total (Overall) | 259 (54.5%) | 216 (45.5%) |
Services Occupations
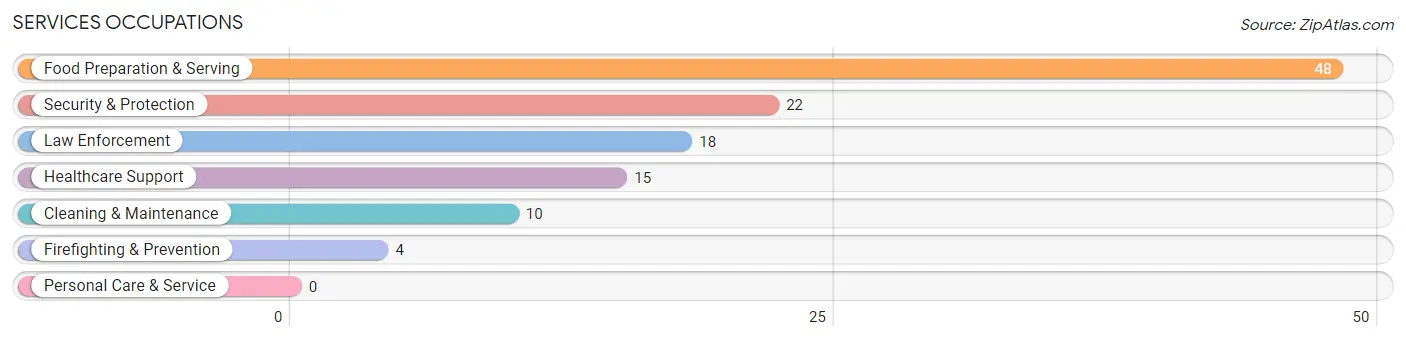
The most common Services occupations in Brandon are Food Preparation & Serving (48 | 10.1%), Security & Protection (22 | 4.6%), Law Enforcement (18 | 3.8%), Healthcare Support (15 | 3.2%), and Cleaning & Maintenance (10 | 2.1%).
Services Occupations by Sex
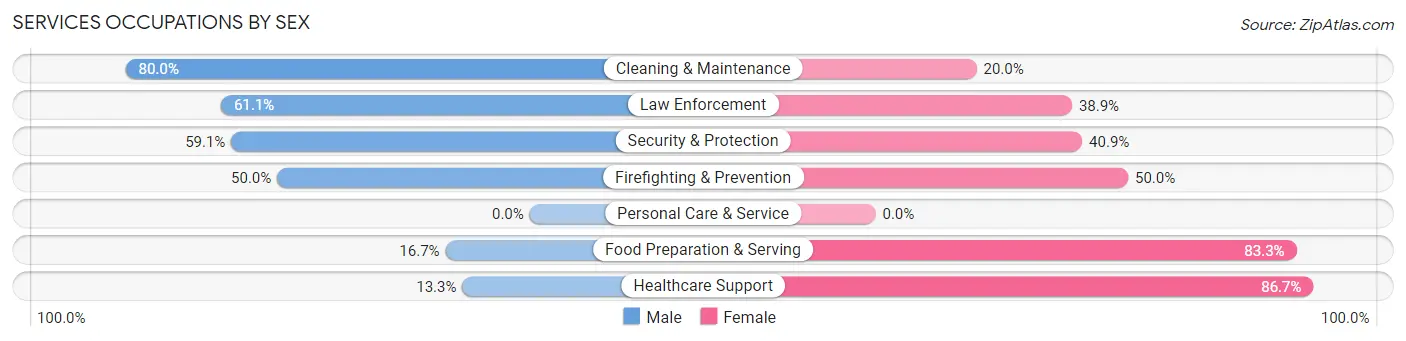
Within the Services occupations in Brandon, the most male-oriented occupations are Cleaning & Maintenance (80.0%), Law Enforcement (61.1%), and Security & Protection (59.1%), while the most female-oriented occupations are Healthcare Support (86.7%), Food Preparation & Serving (83.3%), and Firefighting & Prevention (50.0%).
| Occupation | Male | Female |
| Healthcare Support | 2 (13.3%) | 13 (86.7%) |
| Security & Protection | 13 (59.1%) | 9 (40.9%) |
| Firefighting & Prevention | 2 (50.0%) | 2 (50.0%) |
| Law Enforcement | 11 (61.1%) | 7 (38.9%) |
| Food Preparation & Serving | 8 (16.7%) | 40 (83.3%) |
| Cleaning & Maintenance | 8 (80.0%) | 2 (20.0%) |
| Personal Care & Service | 0 (0.0%) | 0 (0.0%) |
| Total (Category) | 31 (32.6%) | 64 (67.4%) |
| Total (Overall) | 259 (54.5%) | 216 (45.5%) |
Sales and Office Occupations
The most common Sales and Office occupations in Brandon are Office & Administration (54 | 11.4%), and Sales & Related (43 | 9.0%).
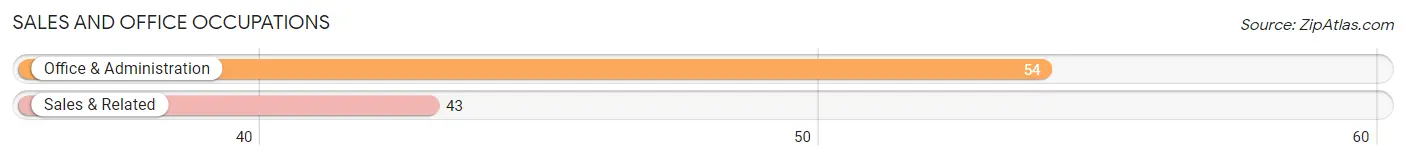
Sales and Office Occupations by Sex
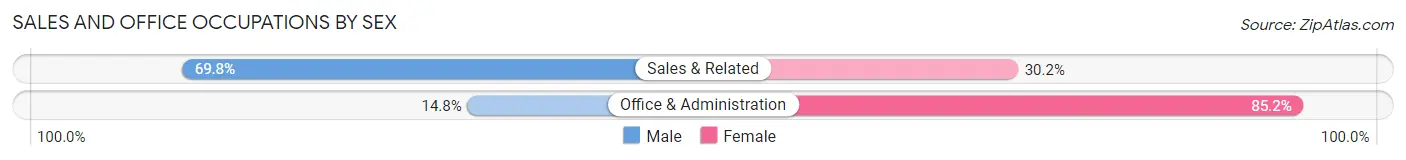
| Occupation | Male | Female |
| Sales & Related | 30 (69.8%) | 13 (30.2%) |
| Office & Administration | 8 (14.8%) | 46 (85.2%) |
| Total (Category) | 38 (39.2%) | 59 (60.8%) |
| Total (Overall) | 259 (54.5%) | 216 (45.5%) |
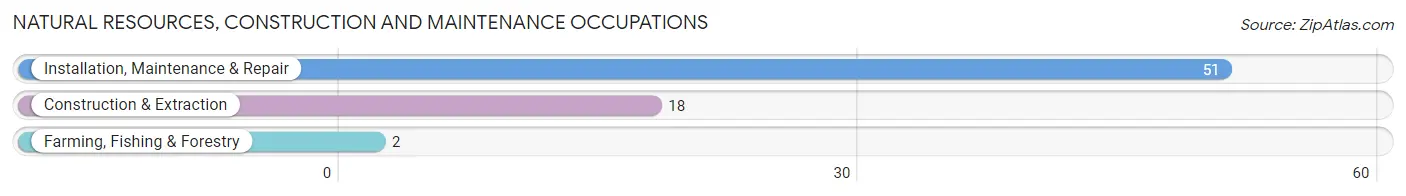
Natural Resources, Construction and Maintenance Occupations
The most common Natural Resources, Construction and Maintenance occupations in Brandon are Installation, Maintenance & Repair (51 | 10.7%), Construction & Extraction (18 | 3.8%), and Farming, Fishing & Forestry (2 | 0.4%).
Natural Resources, Construction and Maintenance Occupations by Sex
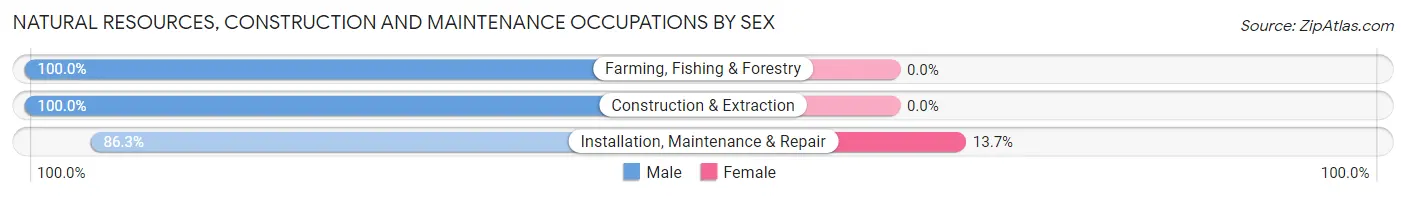
| Occupation | Male | Female |
| Farming, Fishing & Forestry | 2 (100.0%) | 0 (0.0%) |
| Construction & Extraction | 18 (100.0%) | 0 (0.0%) |
| Installation, Maintenance & Repair | 44 (86.3%) | 7 (13.7%) |
| Total (Category) | 64 (90.1%) | 7 (9.9%) |
| Total (Overall) | 259 (54.5%) | 216 (45.5%) |
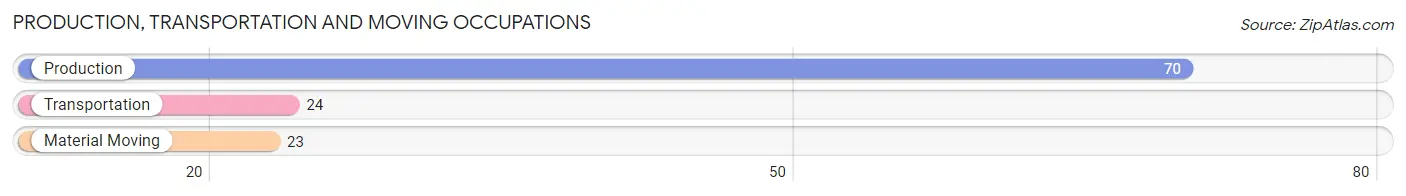
Production, Transportation and Moving Occupations
The most common Production, Transportation and Moving occupations in Brandon are Production (70 | 14.7%), Transportation (24 | 5.1%), and Material Moving (23 | 4.8%).
Production, Transportation and Moving Occupations by Sex
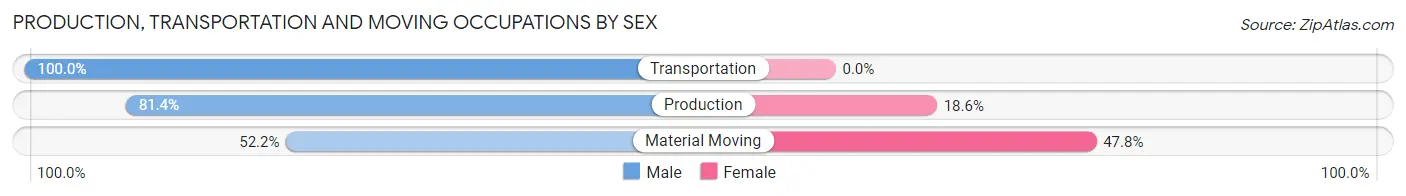
| Occupation | Male | Female |
| Production | 57 (81.4%) | 13 (18.6%) |
| Transportation | 24 (100.0%) | 0 (0.0%) |
| Material Moving | 12 (52.2%) | 11 (47.8%) |
| Total (Category) | 93 (79.5%) | 24 (20.5%) |
| Total (Overall) | 259 (54.5%) | 216 (45.5%) |
Employment Industries by Sex in Brandon
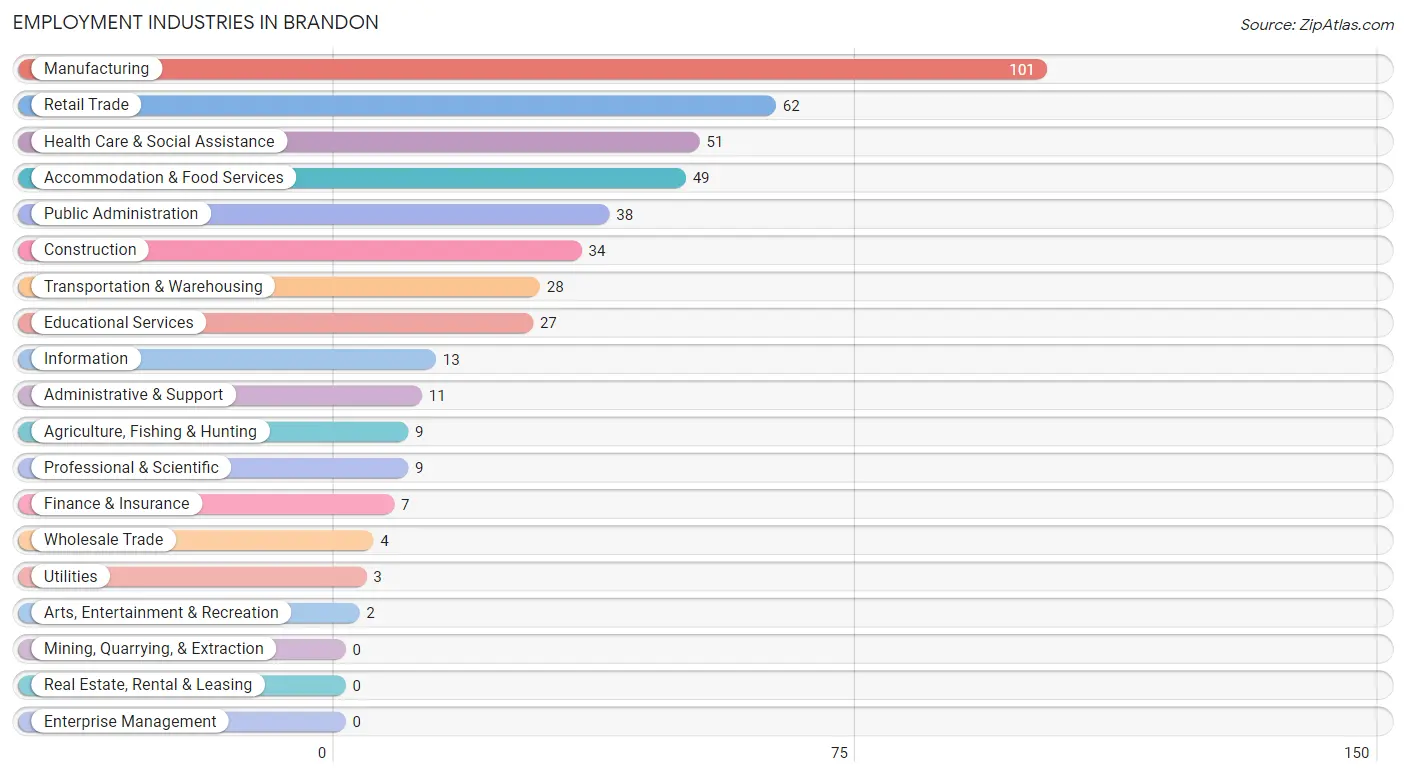
Employment Industries in Brandon
The major employment industries in Brandon include Manufacturing (101 | 21.3%), Retail Trade (62 | 13.1%), Health Care & Social Assistance (51 | 10.7%), Accommodation & Food Services (49 | 10.3%), and Public Administration (38 | 8.0%).
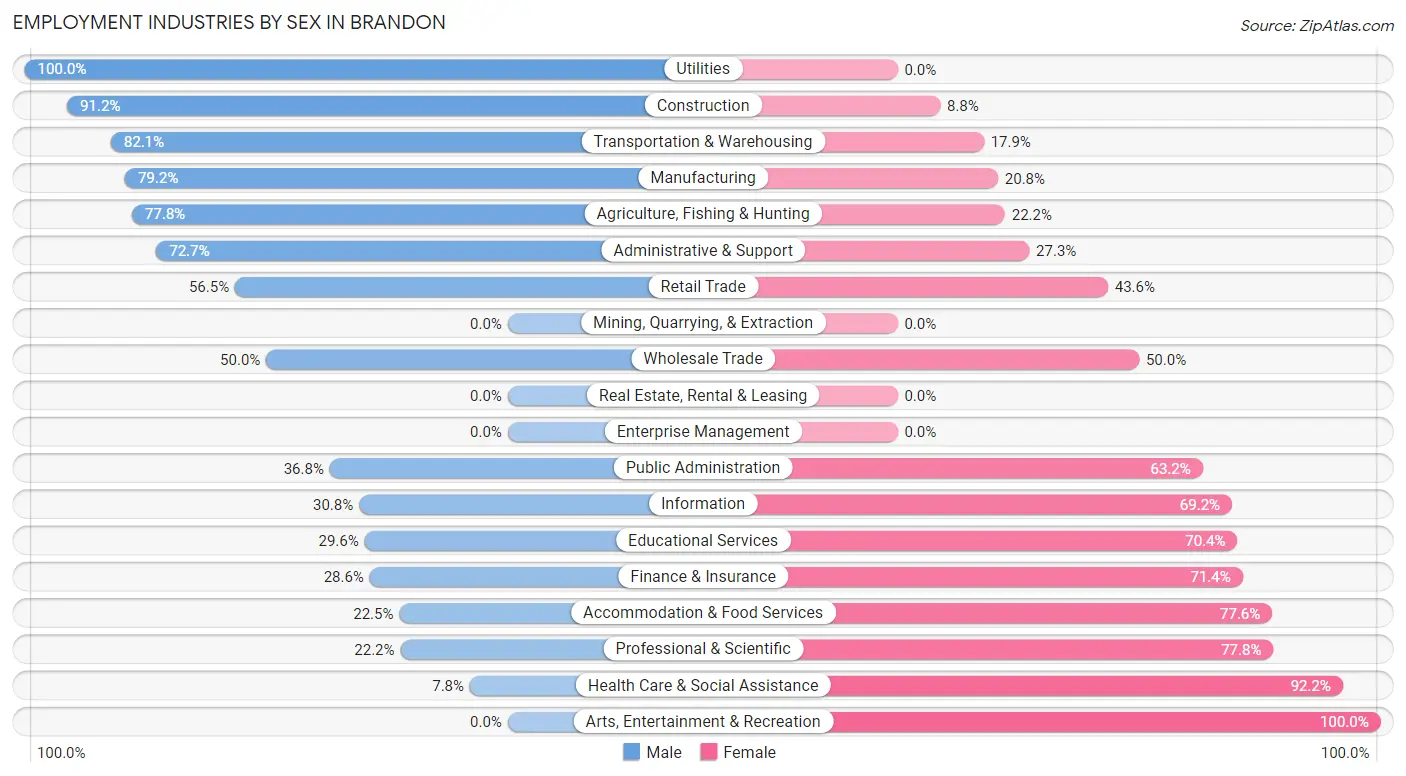
Employment Industries by Sex in Brandon
The Brandon industries that see more men than women are Utilities (100.0%), Construction (91.2%), and Transportation & Warehousing (82.1%), whereas the industries that tend to have a higher number of women are Arts, Entertainment & Recreation (100.0%), Health Care & Social Assistance (92.2%), and Professional & Scientific (77.8%).
| Industry | Male | Female |
| Agriculture, Fishing & Hunting | 7 (77.8%) | 2 (22.2%) |
| Mining, Quarrying, & Extraction | 0 (0.0%) | 0 (0.0%) |
| Construction | 31 (91.2%) | 3 (8.8%) |
| Manufacturing | 80 (79.2%) | 21 (20.8%) |
| Wholesale Trade | 2 (50.0%) | 2 (50.0%) |
| Retail Trade | 35 (56.5%) | 27 (43.5%) |
| Transportation & Warehousing | 23 (82.1%) | 5 (17.9%) |
| Utilities | 3 (100.0%) | 0 (0.0%) |
| Information | 4 (30.8%) | 9 (69.2%) |
| Finance & Insurance | 2 (28.6%) | 5 (71.4%) |
| Real Estate, Rental & Leasing | 0 (0.0%) | 0 (0.0%) |
| Professional & Scientific | 2 (22.2%) | 7 (77.8%) |
| Enterprise Management | 0 (0.0%) | 0 (0.0%) |
| Administrative & Support | 8 (72.7%) | 3 (27.3%) |
| Educational Services | 8 (29.6%) | 19 (70.4%) |
| Health Care & Social Assistance | 4 (7.8%) | 47 (92.2%) |
| Arts, Entertainment & Recreation | 0 (0.0%) | 2 (100.0%) |
| Accommodation & Food Services | 11 (22.5%) | 38 (77.5%) |
| Public Administration | 14 (36.8%) | 24 (63.2%) |
| Total | 259 (54.5%) | 216 (45.5%) |
Education in Brandon
School Enrollment in Brandon
The most common levels of schooling among the 224 students in Brandon are middle school (68 | 30.4%), high school (67 | 29.9%), and elementary school (40 | 17.9%).
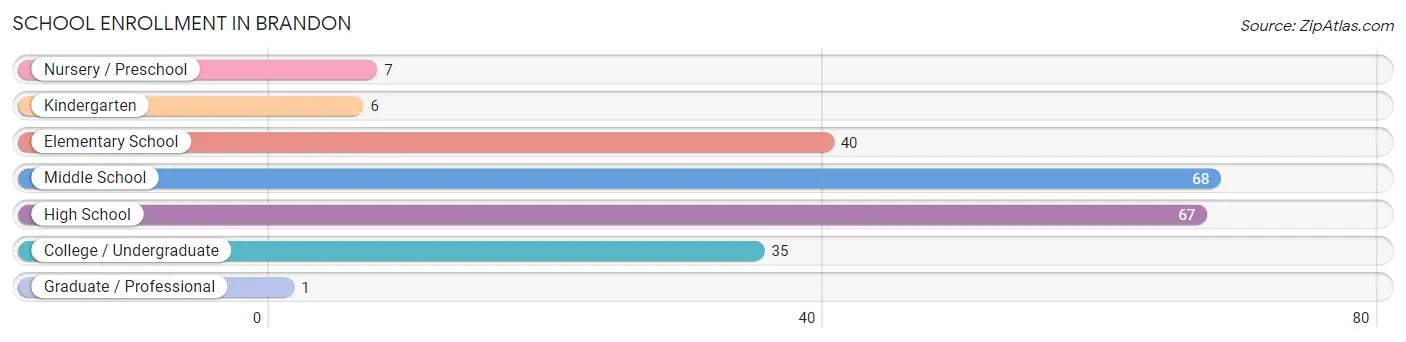
| School Level | # Students | % Students |
| Nursery / Preschool | 7 | 3.1% |
| Kindergarten | 6 | 2.7% |
| Elementary School | 40 | 17.9% |
| Middle School | 68 | 30.4% |
| High School | 67 | 29.9% |
| College / Undergraduate | 35 | 15.6% |
| Graduate / Professional | 1 | 0.4% |
| Total | 224 | 100.0% |
School Enrollment by Age by Funding Source in Brandon
Out of a total of 224 students who are enrolled in schools in Brandon, 31 (13.8%) attend a private institution, while the remaining 193 (86.2%) are enrolled in public schools. The age group of 20 to 24 year olds has the highest likelihood of being enrolled in private schools, with 5 (26.3% in the age bracket) enrolled. Conversely, the age group of 5 to 9 year old has the lowest likelihood of being enrolled in a private school, with 50 (98.0% in the age bracket) attending a public institution.
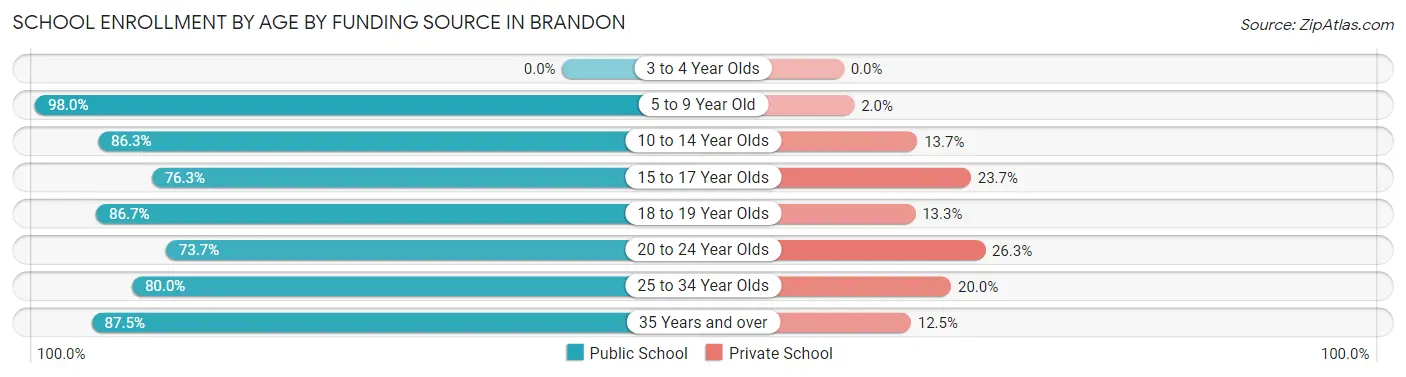
| Age Bracket | Public School | Private School |
| 3 to 4 Year Olds | 0 (0.0%) | 0 (0.0%) |
| 5 to 9 Year Old | 50 (98.0%) | 1 (2.0%) |
| 10 to 14 Year Olds | 63 (86.3%) | 10 (13.7%) |
| 15 to 17 Year Olds | 29 (76.3%) | 9 (23.7%) |
| 18 to 19 Year Olds | 26 (86.7%) | 4 (13.3%) |
| 20 to 24 Year Olds | 14 (73.7%) | 5 (26.3%) |
| 25 to 34 Year Olds | 4 (80.0%) | 1 (20.0%) |
| 35 Years and over | 7 (87.5%) | 1 (12.5%) |
| Total | 193 (86.2%) | 31 (13.8%) |
Educational Attainment by Field of Study in Brandon
Business (25 | 20.5%), social sciences (19 | 15.6%), arts & humanities (19 | 15.6%), education (18 | 14.7%), and science & technology (16 | 13.1%) are the most common fields of study among 122 individuals in Brandon who have obtained a bachelor's degree or higher.
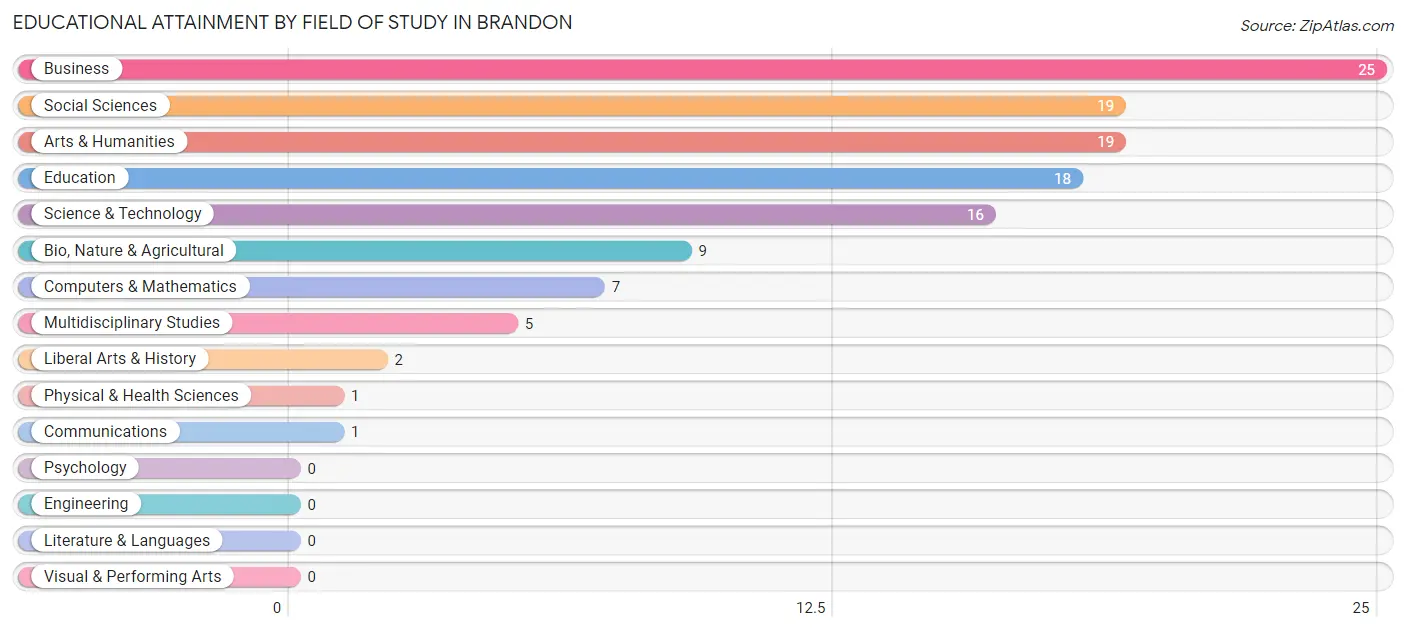
| Field of Study | # Graduates | % Graduates |
| Computers & Mathematics | 7 | 5.7% |
| Bio, Nature & Agricultural | 9 | 7.4% |
| Physical & Health Sciences | 1 | 0.8% |
| Psychology | 0 | 0.0% |
| Social Sciences | 19 | 15.6% |
| Engineering | 0 | 0.0% |
| Multidisciplinary Studies | 5 | 4.1% |
| Science & Technology | 16 | 13.1% |
| Business | 25 | 20.5% |
| Education | 18 | 14.7% |
| Literature & Languages | 0 | 0.0% |
| Liberal Arts & History | 2 | 1.6% |
| Visual & Performing Arts | 0 | 0.0% |
| Communications | 1 | 0.8% |
| Arts & Humanities | 19 | 15.6% |
| Total | 122 | 100.0% |
Transportation & Commute in Brandon
Vehicle Availability by Sex in Brandon
The most prevalent vehicle ownership categories in Brandon are males with 2 vehicles (132, accounting for 53.0%) and females with 2 vehicles (95, making up 61.7%).
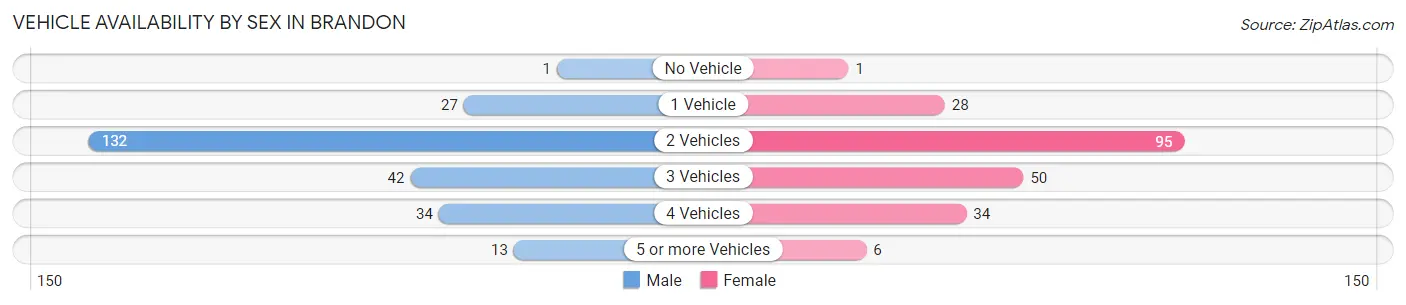
| Vehicles Available | Male | Female |
| No Vehicle | 1 (0.4%) | 1 (0.5%) |
| 1 Vehicle | 27 (10.8%) | 28 (13.1%) |
| 2 Vehicles | 132 (53.0%) | 95 (44.4%) |
| 3 Vehicles | 42 (16.9%) | 50 (23.4%) |
| 4 Vehicles | 34 (13.7%) | 34 (15.9%) |
| 5 or more Vehicles | 13 (5.2%) | 6 (2.8%) |
| Total | 249 (100.0%) | 214 (100.0%) |
Commute Time in Brandon
The most frequently occuring commute durations in Brandon are 30 to 34 minutes (99 commuters, 22.8%), 15 to 19 minutes (80 commuters, 18.4%), and 10 to 14 minutes (52 commuters, 11.9%).
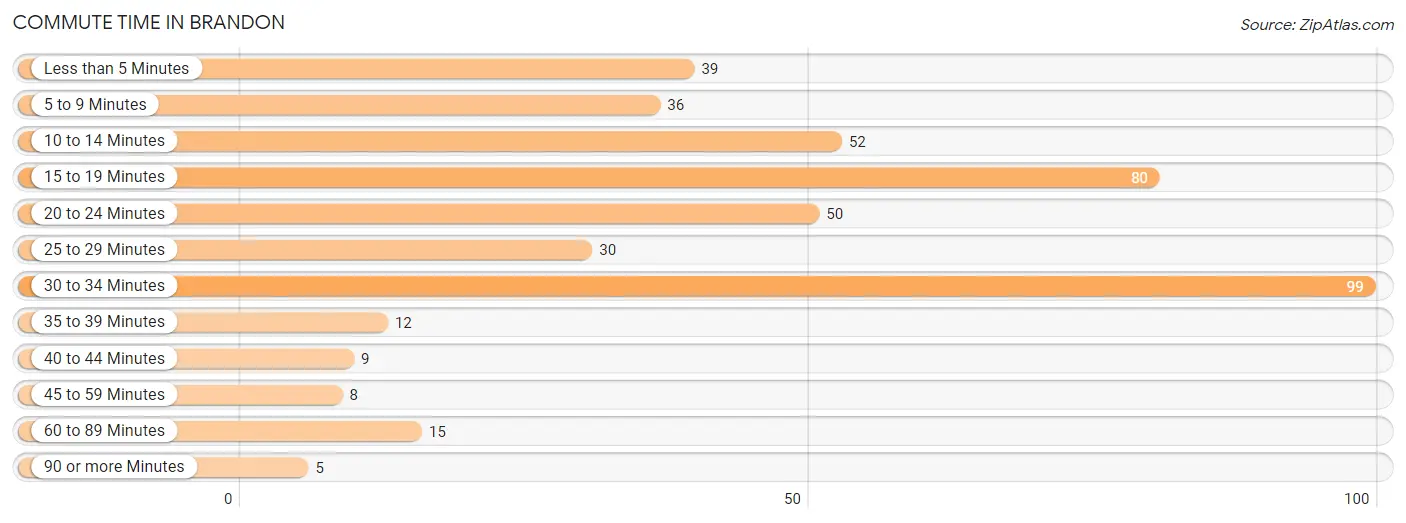
| Commute Time | # Commuters | % Commuters |
| Less than 5 Minutes | 39 | 9.0% |
| 5 to 9 Minutes | 36 | 8.3% |
| 10 to 14 Minutes | 52 | 11.9% |
| 15 to 19 Minutes | 80 | 18.4% |
| 20 to 24 Minutes | 50 | 11.5% |
| 25 to 29 Minutes | 30 | 6.9% |
| 30 to 34 Minutes | 99 | 22.8% |
| 35 to 39 Minutes | 12 | 2.8% |
| 40 to 44 Minutes | 9 | 2.1% |
| 45 to 59 Minutes | 8 | 1.8% |
| 60 to 89 Minutes | 15 | 3.5% |
| 90 or more Minutes | 5 | 1.1% |
Commute Time by Sex in Brandon
The most common commute times in Brandon are 30 to 34 minutes (64 commuters, 26.8%) for males and 15 to 19 minutes (36 commuters, 18.4%) for females.
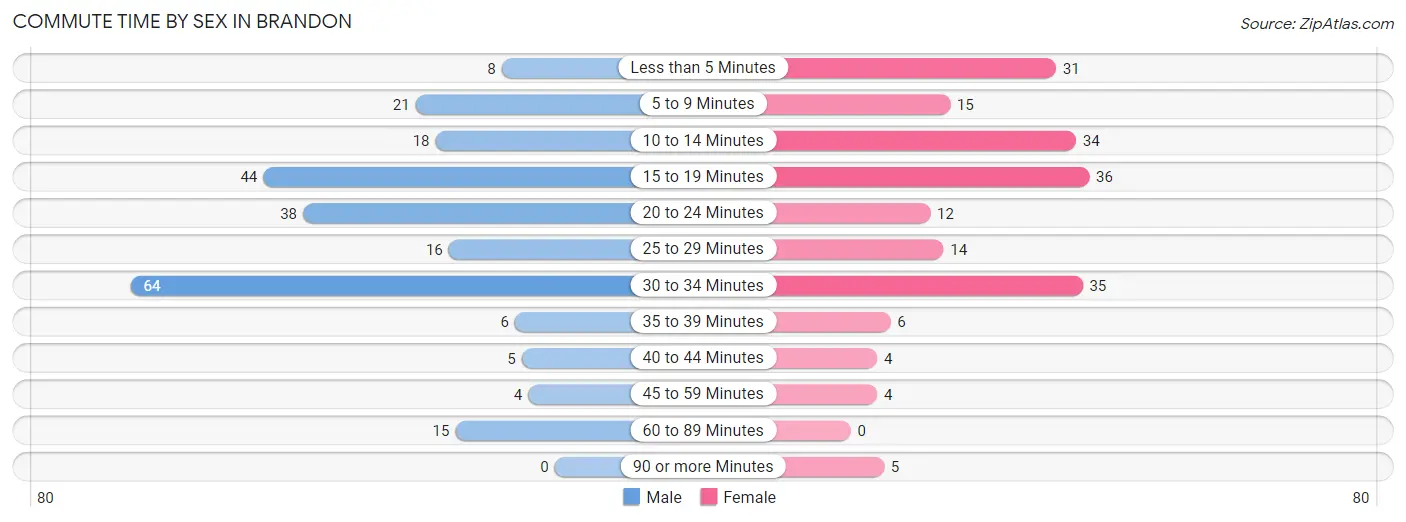
| Commute Time | Male | Female |
| Less than 5 Minutes | 8 (3.4%) | 31 (15.8%) |
| 5 to 9 Minutes | 21 (8.8%) | 15 (7.6%) |
| 10 to 14 Minutes | 18 (7.5%) | 34 (17.3%) |
| 15 to 19 Minutes | 44 (18.4%) | 36 (18.4%) |
| 20 to 24 Minutes | 38 (15.9%) | 12 (6.1%) |
| 25 to 29 Minutes | 16 (6.7%) | 14 (7.1%) |
| 30 to 34 Minutes | 64 (26.8%) | 35 (17.9%) |
| 35 to 39 Minutes | 6 (2.5%) | 6 (3.1%) |
| 40 to 44 Minutes | 5 (2.1%) | 4 (2.0%) |
| 45 to 59 Minutes | 4 (1.7%) | 4 (2.0%) |
| 60 to 89 Minutes | 15 (6.3%) | 0 (0.0%) |
| 90 or more Minutes | 0 (0.0%) | 5 (2.5%) |
Time of Departure to Work by Sex in Brandon
The most frequent times of departure to work in Brandon are 5:00 AM to 5:29 AM (32, 13.4%) for males and 7:30 AM to 7:59 AM (39, 19.9%) for females.
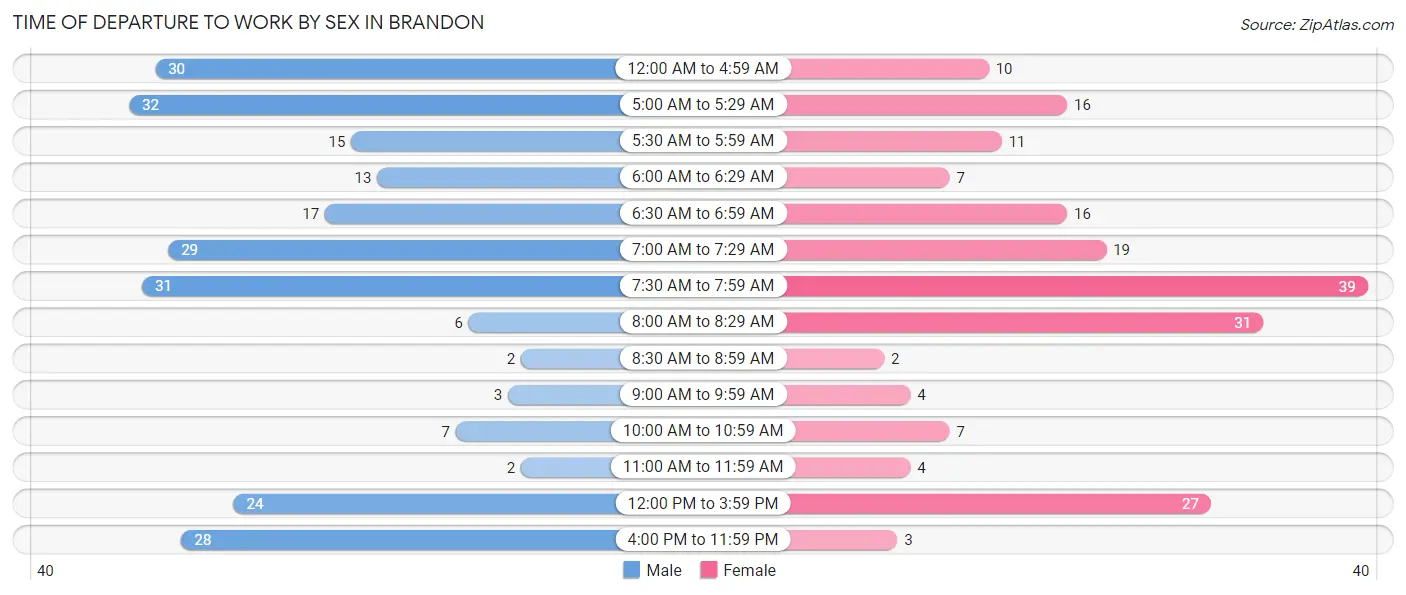
| Time of Departure | Male | Female |
| 12:00 AM to 4:59 AM | 30 (12.6%) | 10 (5.1%) |
| 5:00 AM to 5:29 AM | 32 (13.4%) | 16 (8.2%) |
| 5:30 AM to 5:59 AM | 15 (6.3%) | 11 (5.6%) |
| 6:00 AM to 6:29 AM | 13 (5.4%) | 7 (3.6%) |
| 6:30 AM to 6:59 AM | 17 (7.1%) | 16 (8.2%) |
| 7:00 AM to 7:29 AM | 29 (12.1%) | 19 (9.7%) |
| 7:30 AM to 7:59 AM | 31 (13.0%) | 39 (19.9%) |
| 8:00 AM to 8:29 AM | 6 (2.5%) | 31 (15.8%) |
| 8:30 AM to 8:59 AM | 2 (0.8%) | 2 (1.0%) |
| 9:00 AM to 9:59 AM | 3 (1.3%) | 4 (2.0%) |
| 10:00 AM to 10:59 AM | 7 (2.9%) | 7 (3.6%) |
| 11:00 AM to 11:59 AM | 2 (0.8%) | 4 (2.0%) |
| 12:00 PM to 3:59 PM | 24 (10.0%) | 27 (13.8%) |
| 4:00 PM to 11:59 PM | 28 (11.7%) | 3 (1.5%) |
| Total | 239 (100.0%) | 196 (100.0%) |
Housing Occupancy in Brandon
Occupancy by Ownership in Brandon
Of the total 331 dwellings in Brandon, owner-occupied units account for 225 (68.0%), while renter-occupied units make up 106 (32.0%).
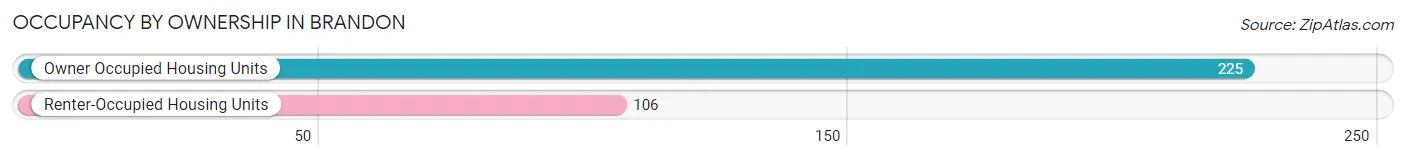
| Occupancy | # Housing Units | % Housing Units |
| Owner Occupied Housing Units | 225 | 68.0% |
| Renter-Occupied Housing Units | 106 | 32.0% |
| Total Occupied Housing Units | 331 | 100.0% |
Occupancy by Household Size in Brandon
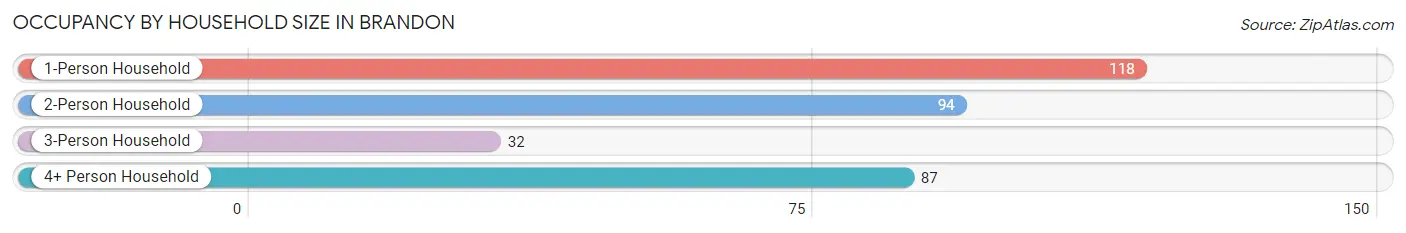
| Household Size | # Housing Units | % Housing Units |
| 1-Person Household | 118 | 35.6% |
| 2-Person Household | 94 | 28.4% |
| 3-Person Household | 32 | 9.7% |
| 4+ Person Household | 87 | 26.3% |
| Total Housing Units | 331 | 100.0% |
Occupancy by Ownership by Household Size in Brandon
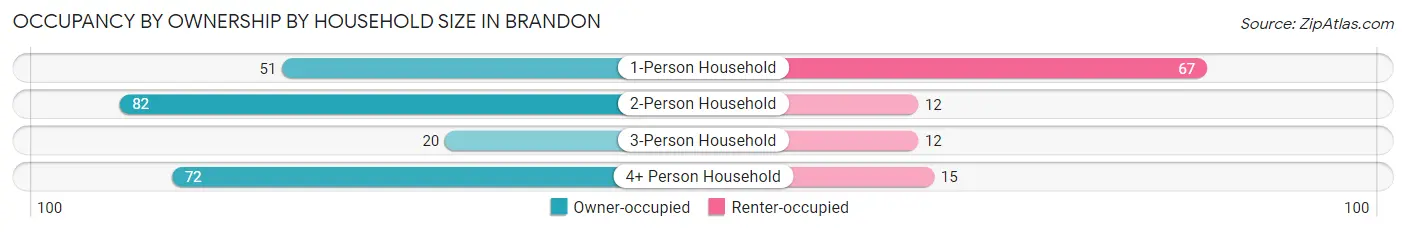
| Household Size | Owner-occupied | Renter-occupied |
| 1-Person Household | 51 (43.2%) | 67 (56.8%) |
| 2-Person Household | 82 (87.2%) | 12 (12.8%) |
| 3-Person Household | 20 (62.5%) | 12 (37.5%) |
| 4+ Person Household | 72 (82.8%) | 15 (17.2%) |
| Total Housing Units | 225 (68.0%) | 106 (32.0%) |
Occupancy by Educational Attainment in Brandon
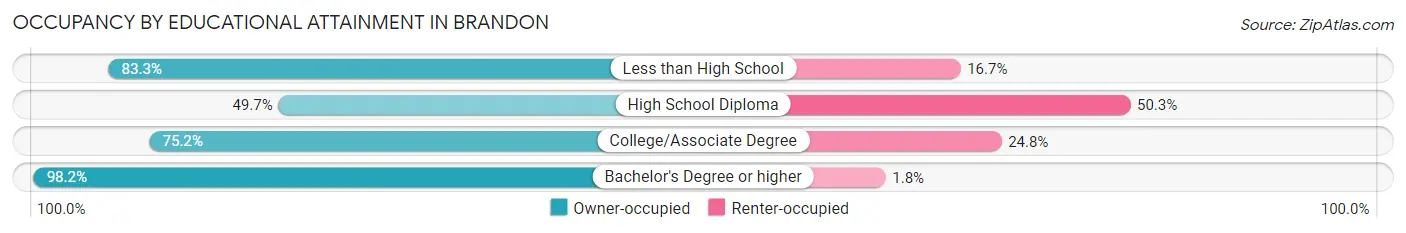
| Household Size | Owner-occupied | Renter-occupied |
| Less than High School | 10 (83.3%) | 2 (16.7%) |
| High School Diploma | 73 (49.7%) | 74 (50.3%) |
| College/Associate Degree | 88 (75.2%) | 29 (24.8%) |
| Bachelor's Degree or higher | 54 (98.2%) | 1 (1.8%) |
Occupancy by Age of Householder in Brandon
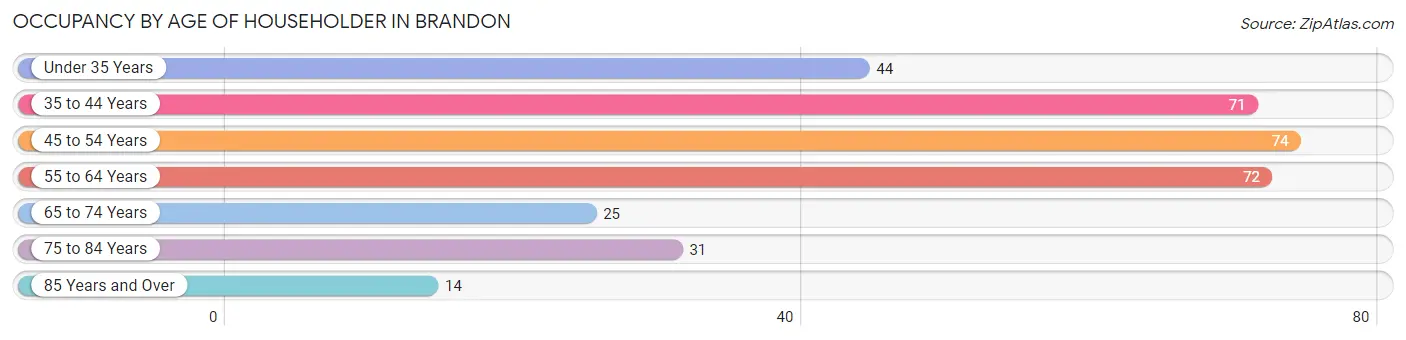
| Age Bracket | # Households | % Households |
| Under 35 Years | 44 | 13.3% |
| 35 to 44 Years | 71 | 21.4% |
| 45 to 54 Years | 74 | 22.4% |
| 55 to 64 Years | 72 | 21.7% |
| 65 to 74 Years | 25 | 7.5% |
| 75 to 84 Years | 31 | 9.4% |
| 85 Years and Over | 14 | 4.2% |
| Total | 331 | 100.0% |
Housing Finances in Brandon
Median Income by Occupancy in Brandon
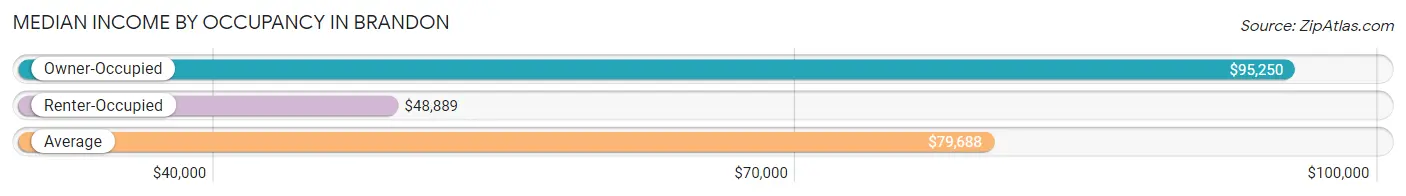
| Occupancy Type | # Households | Median Income |
| Owner-Occupied | 225 (68.0%) | $95,250 |
| Renter-Occupied | 106 (32.0%) | $48,889 |
| Average | 331 (100.0%) | $79,688 |
Occupancy by Householder Income Bracket in Brandon
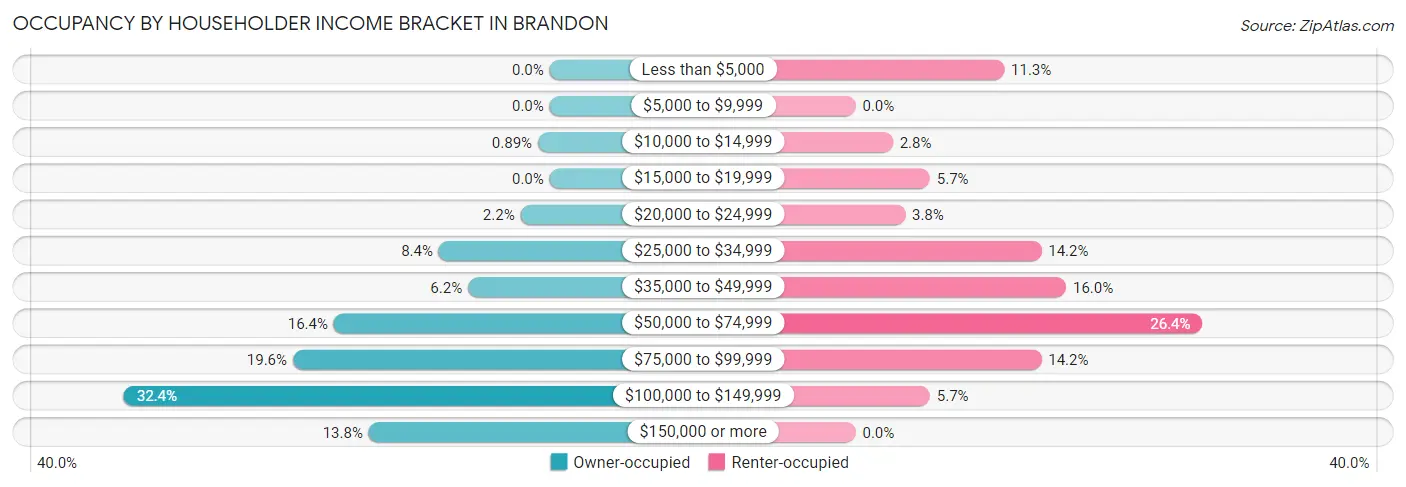
| Income Bracket | Owner-occupied | Renter-occupied |
| Less than $5,000 | 0 (0.0%) | 12 (11.3%) |
| $5,000 to $9,999 | 0 (0.0%) | 0 (0.0%) |
| $10,000 to $14,999 | 2 (0.9%) | 3 (2.8%) |
| $15,000 to $19,999 | 0 (0.0%) | 6 (5.7%) |
| $20,000 to $24,999 | 5 (2.2%) | 4 (3.8%) |
| $25,000 to $34,999 | 19 (8.4%) | 15 (14.1%) |
| $35,000 to $49,999 | 14 (6.2%) | 17 (16.0%) |
| $50,000 to $74,999 | 37 (16.4%) | 28 (26.4%) |
| $75,000 to $99,999 | 44 (19.6%) | 15 (14.1%) |
| $100,000 to $149,999 | 73 (32.4%) | 6 (5.7%) |
| $150,000 or more | 31 (13.8%) | 0 (0.0%) |
| Total | 225 (100.0%) | 106 (100.0%) |
Monthly Housing Cost Tiers in Brandon
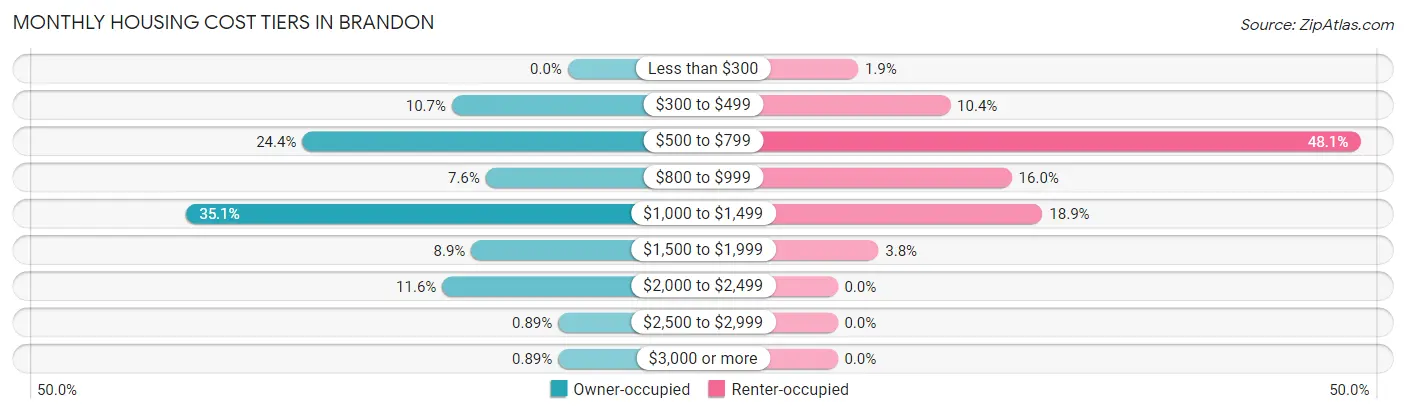
| Monthly Cost | Owner-occupied | Renter-occupied |
| Less than $300 | 0 (0.0%) | 2 (1.9%) |
| $300 to $499 | 24 (10.7%) | 11 (10.4%) |
| $500 to $799 | 55 (24.4%) | 51 (48.1%) |
| $800 to $999 | 17 (7.6%) | 17 (16.0%) |
| $1,000 to $1,499 | 79 (35.1%) | 20 (18.9%) |
| $1,500 to $1,999 | 20 (8.9%) | 4 (3.8%) |
| $2,000 to $2,499 | 26 (11.6%) | 0 (0.0%) |
| $2,500 to $2,999 | 2 (0.9%) | 0 (0.0%) |
| $3,000 or more | 2 (0.9%) | 0 (0.0%) |
| Total | 225 (100.0%) | 106 (100.0%) |
Physical Housing Characteristics in Brandon
Housing Structures in Brandon
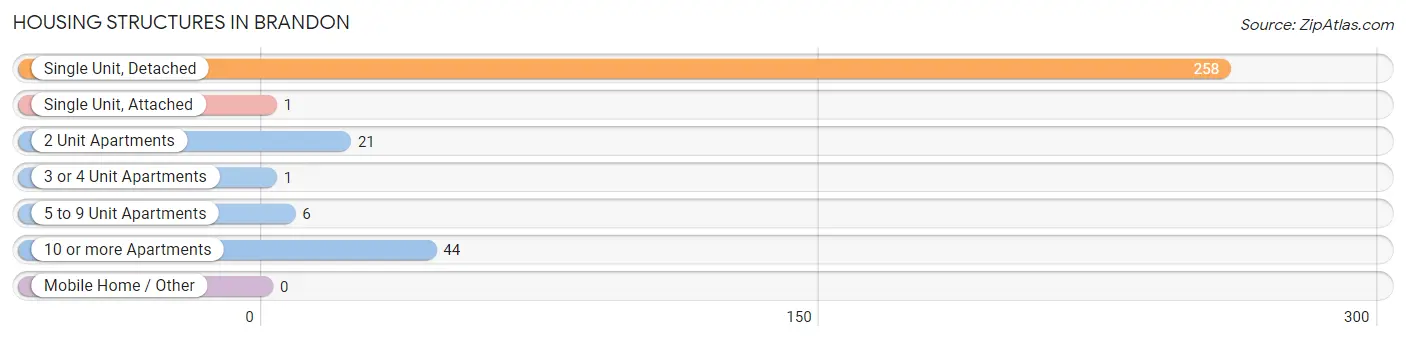
| Structure Type | # Housing Units | % Housing Units |
| Single Unit, Detached | 258 | 77.9% |
| Single Unit, Attached | 1 | 0.3% |
| 2 Unit Apartments | 21 | 6.3% |
| 3 or 4 Unit Apartments | 1 | 0.3% |
| 5 to 9 Unit Apartments | 6 | 1.8% |
| 10 or more Apartments | 44 | 13.3% |
| Mobile Home / Other | 0 | 0.0% |
| Total | 331 | 100.0% |
Housing Structures by Occupancy in Brandon
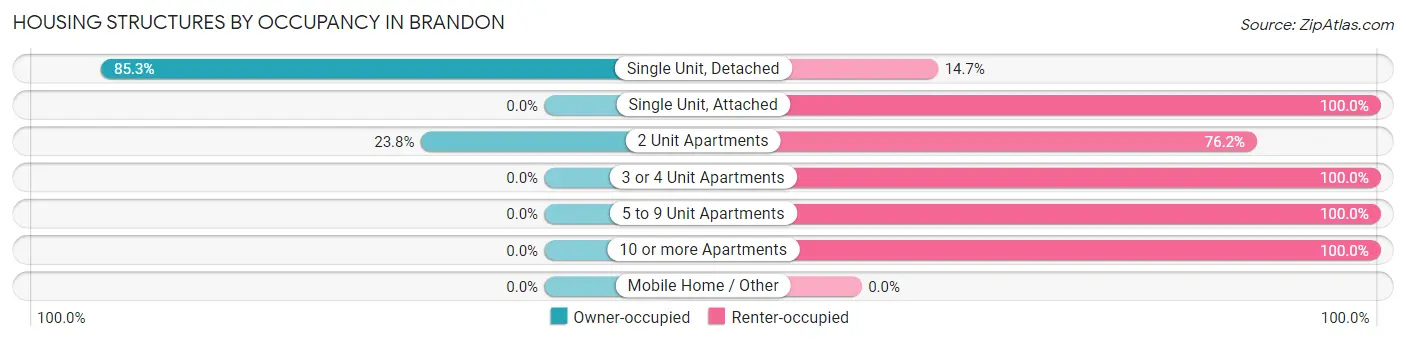
| Structure Type | Owner-occupied | Renter-occupied |
| Single Unit, Detached | 220 (85.3%) | 38 (14.7%) |
| Single Unit, Attached | 0 (0.0%) | 1 (100.0%) |
| 2 Unit Apartments | 5 (23.8%) | 16 (76.2%) |
| 3 or 4 Unit Apartments | 0 (0.0%) | 1 (100.0%) |
| 5 to 9 Unit Apartments | 0 (0.0%) | 6 (100.0%) |
| 10 or more Apartments | 0 (0.0%) | 44 (100.0%) |
| Mobile Home / Other | 0 (0.0%) | 0 (0.0%) |
| Total | 225 (68.0%) | 106 (32.0%) |
Housing Structures by Number of Rooms in Brandon
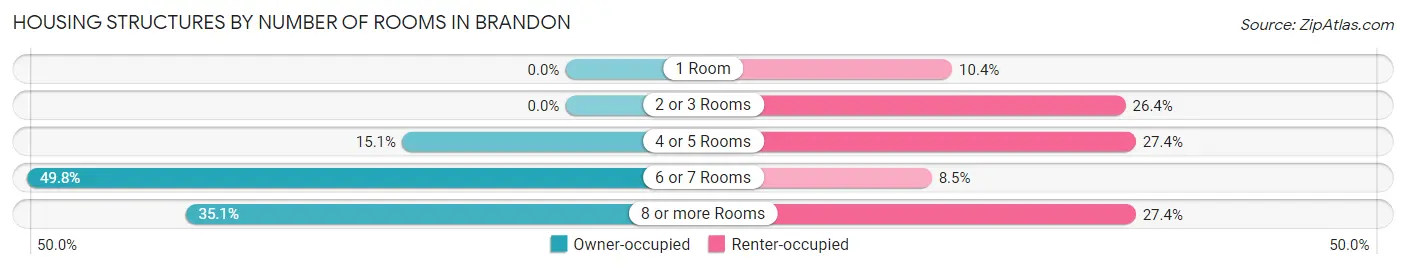
| Number of Rooms | Owner-occupied | Renter-occupied |
| 1 Room | 0 (0.0%) | 11 (10.4%) |
| 2 or 3 Rooms | 0 (0.0%) | 28 (26.4%) |
| 4 or 5 Rooms | 34 (15.1%) | 29 (27.4%) |
| 6 or 7 Rooms | 112 (49.8%) | 9 (8.5%) |
| 8 or more Rooms | 79 (35.1%) | 29 (27.4%) |
| Total | 225 (100.0%) | 106 (100.0%) |
Housing Structure by Heating Type in Brandon
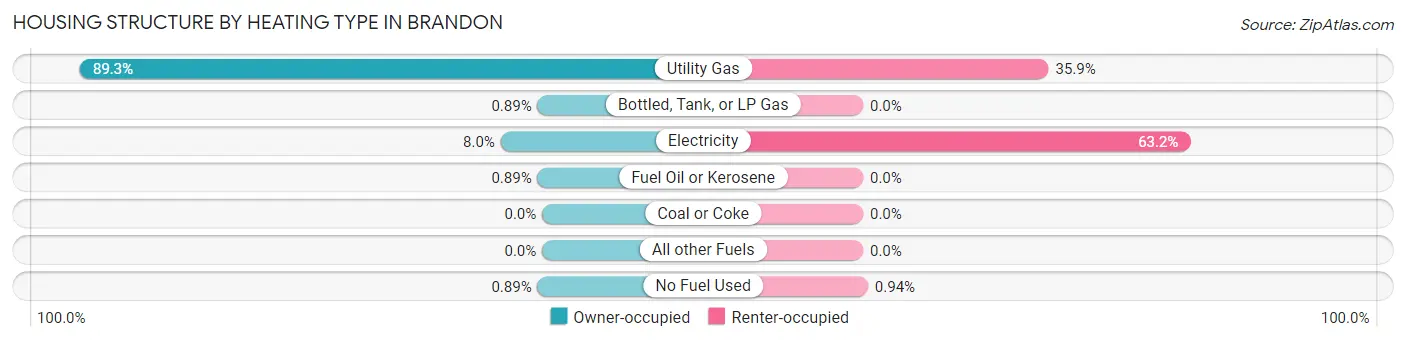
| Heating Type | Owner-occupied | Renter-occupied |
| Utility Gas | 201 (89.3%) | 38 (35.8%) |
| Bottled, Tank, or LP Gas | 2 (0.9%) | 0 (0.0%) |
| Electricity | 18 (8.0%) | 67 (63.2%) |
| Fuel Oil or Kerosene | 2 (0.9%) | 0 (0.0%) |
| Coal or Coke | 0 (0.0%) | 0 (0.0%) |
| All other Fuels | 0 (0.0%) | 0 (0.0%) |
| No Fuel Used | 2 (0.9%) | 1 (0.9%) |
| Total | 225 (100.0%) | 106 (100.0%) |
Household Vehicle Usage in Brandon
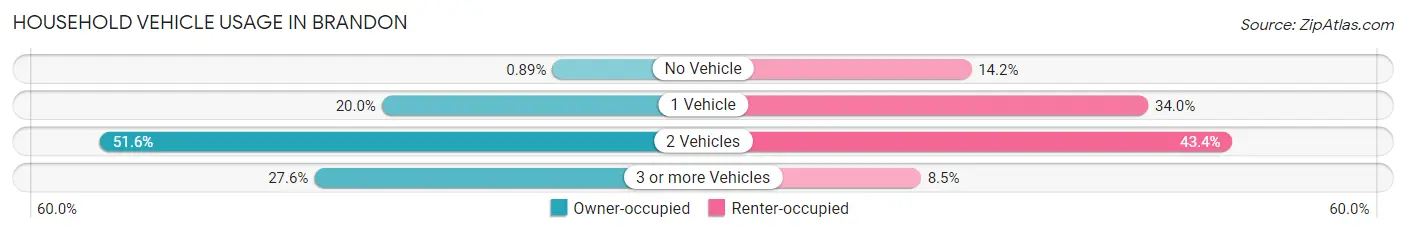
| Vehicles per Household | Owner-occupied | Renter-occupied |
| No Vehicle | 2 (0.9%) | 15 (14.1%) |
| 1 Vehicle | 45 (20.0%) | 36 (34.0%) |
| 2 Vehicles | 116 (51.6%) | 46 (43.4%) |
| 3 or more Vehicles | 62 (27.6%) | 9 (8.5%) |
| Total | 225 (100.0%) | 106 (100.0%) |
Real Estate & Mortgages in Brandon
Real Estate and Mortgage Overview in Brandon
| Characteristic | Without Mortgage | With Mortgage |
| Housing Units | 69 | 156 |
| Median Property Value | $136,900 | $151,300 |
| Median Household Income | $66,250 | $25 |
| Monthly Housing Costs | $571 | $2 |
| Real Estate Taxes | $2,539 | $0 |
Property Value by Mortgage Status in Brandon
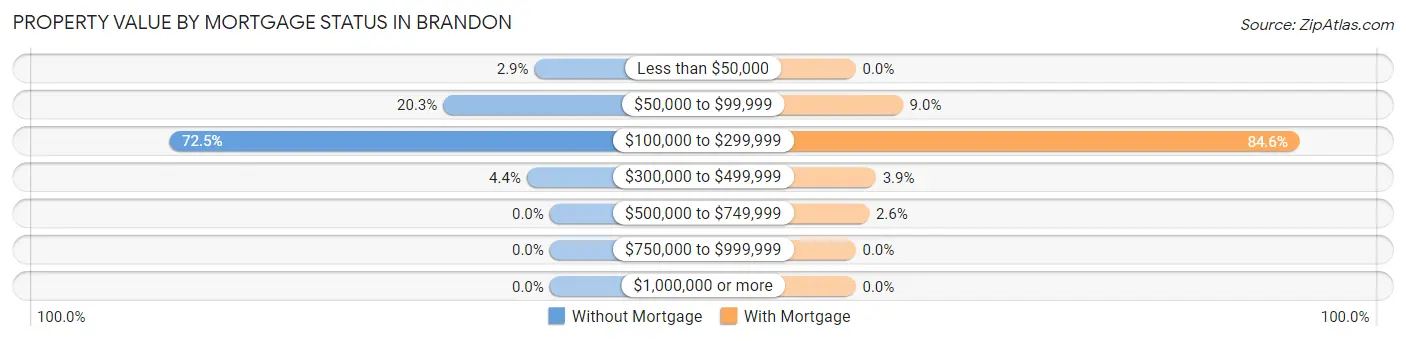
| Property Value | Without Mortgage | With Mortgage |
| Less than $50,000 | 2 (2.9%) | 0 (0.0%) |
| $50,000 to $99,999 | 14 (20.3%) | 14 (9.0%) |
| $100,000 to $299,999 | 50 (72.5%) | 132 (84.6%) |
| $300,000 to $499,999 | 3 (4.3%) | 6 (3.8%) |
| $500,000 to $749,999 | 0 (0.0%) | 4 (2.6%) |
| $750,000 to $999,999 | 0 (0.0%) | 0 (0.0%) |
| $1,000,000 or more | 0 (0.0%) | 0 (0.0%) |
| Total | 69 (100.0%) | 156 (100.0%) |
Household Income by Mortgage Status in Brandon
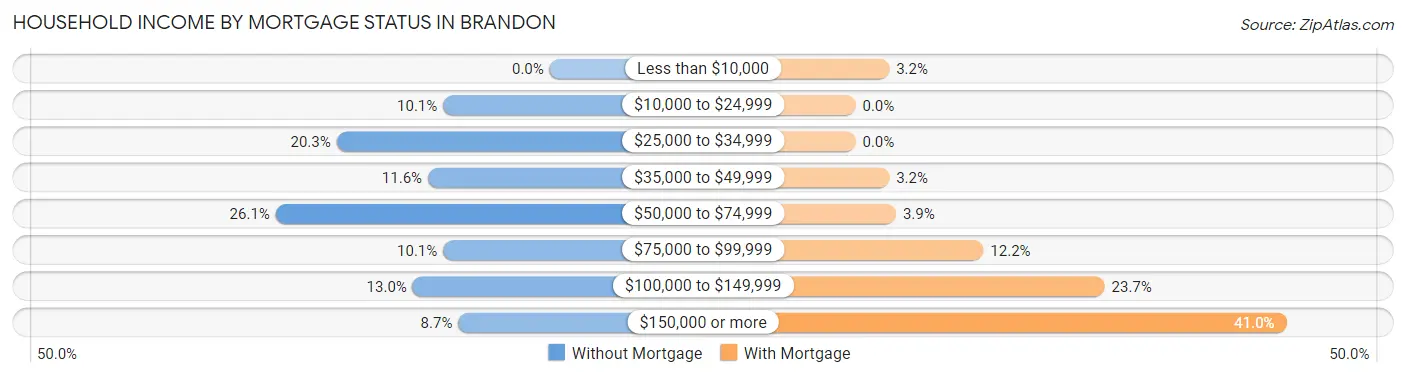
| Household Income | Without Mortgage | With Mortgage |
| Less than $10,000 | 0 (0.0%) | 5 (3.2%) |
| $10,000 to $24,999 | 7 (10.1%) | 0 (0.0%) |
| $25,000 to $34,999 | 14 (20.3%) | 0 (0.0%) |
| $35,000 to $49,999 | 8 (11.6%) | 5 (3.2%) |
| $50,000 to $74,999 | 18 (26.1%) | 6 (3.8%) |
| $75,000 to $99,999 | 7 (10.1%) | 19 (12.2%) |
| $100,000 to $149,999 | 9 (13.0%) | 37 (23.7%) |
| $150,000 or more | 6 (8.7%) | 64 (41.0%) |
| Total | 69 (100.0%) | 156 (100.0%) |
Property Value to Household Income Ratio in Brandon
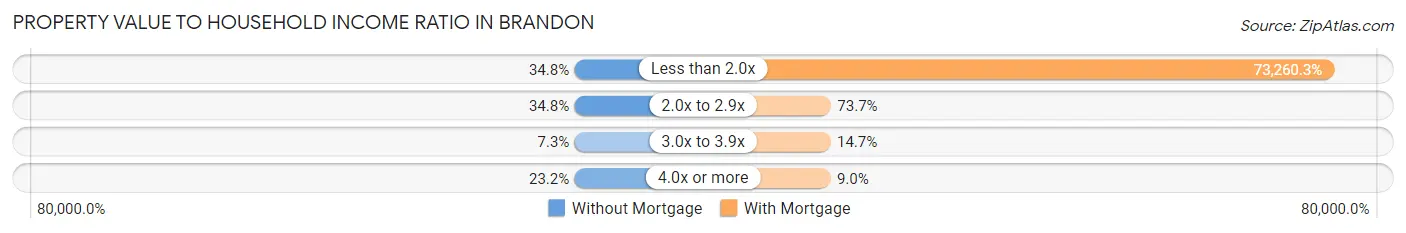
| Value-to-Income Ratio | Without Mortgage | With Mortgage |
| Less than 2.0x | 24 (34.8%) | 114,286 (73,260.3%) |
| 2.0x to 2.9x | 24 (34.8%) | 115 (73.7%) |
| 3.0x to 3.9x | 5 (7.2%) | 23 (14.7%) |
| 4.0x or more | 16 (23.2%) | 14 (9.0%) |
| Total | 69 (100.0%) | 156 (100.0%) |
Real Estate Taxes by Mortgage Status in Brandon
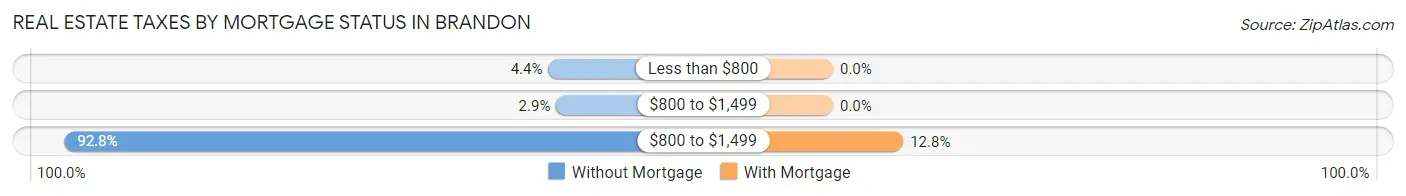
| Property Taxes | Without Mortgage | With Mortgage |
| Less than $800 | 3 (4.3%) | 0 (0.0%) |
| $800 to $1,499 | 2 (2.9%) | 0 (0.0%) |
| $800 to $1,499 | 64 (92.7%) | 20 (12.8%) |
| Total | 69 (100.0%) | 156 (100.0%) |
Health & Disability in Brandon
Health Insurance Coverage by Age in Brandon
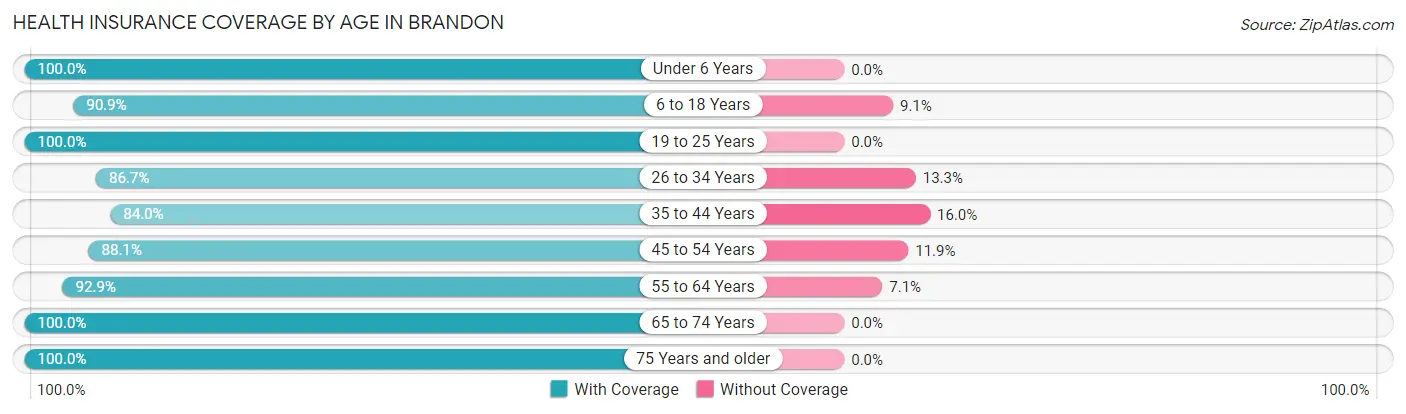
| Age Bracket | With Coverage | Without Coverage |
| Under 6 Years | 31 (100.0%) | 0 (0.0%) |
| 6 to 18 Years | 180 (90.9%) | 18 (9.1%) |
| 19 to 25 Years | 50 (100.0%) | 0 (0.0%) |
| 26 to 34 Years | 65 (86.7%) | 10 (13.3%) |
| 35 to 44 Years | 105 (84.0%) | 20 (16.0%) |
| 45 to 54 Years | 118 (88.1%) | 16 (11.9%) |
| 55 to 64 Years | 118 (92.9%) | 9 (7.1%) |
| 65 to 74 Years | 47 (100.0%) | 0 (0.0%) |
| 75 Years and older | 55 (100.0%) | 0 (0.0%) |
| Total | 769 (91.3%) | 73 (8.7%) |
Health Insurance Coverage by Citizenship Status in Brandon
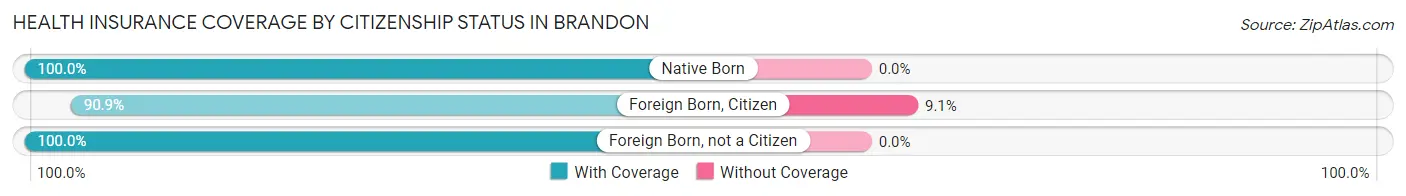
| Citizenship Status | With Coverage | Without Coverage |
| Native Born | 31 (100.0%) | 0 (0.0%) |
| Foreign Born, Citizen | 180 (90.9%) | 18 (9.1%) |
| Foreign Born, not a Citizen | 50 (100.0%) | 0 (0.0%) |
Health Insurance Coverage by Household Income in Brandon
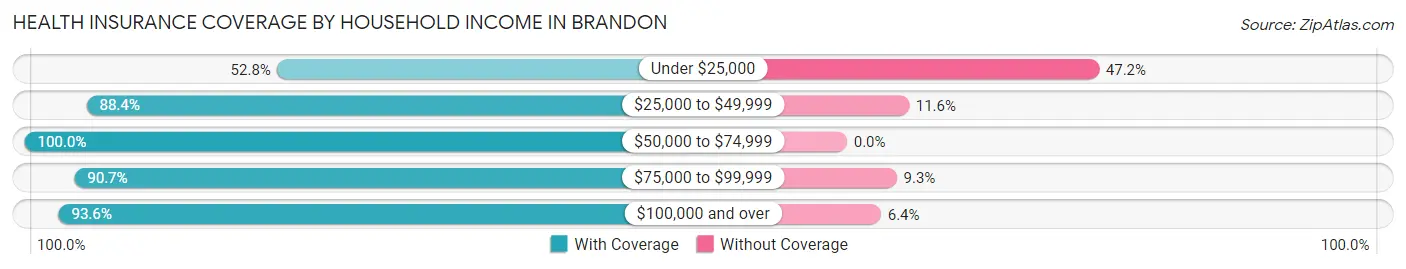
| Household Income | With Coverage | Without Coverage |
| Under $25,000 | 19 (52.8%) | 17 (47.2%) |
| $25,000 to $49,999 | 99 (88.4%) | 13 (11.6%) |
| $50,000 to $74,999 | 115 (100.0%) | 0 (0.0%) |
| $75,000 to $99,999 | 136 (90.7%) | 14 (9.3%) |
| $100,000 and over | 382 (93.6%) | 26 (6.4%) |
Public vs Private Health Insurance Coverage by Age in Brandon
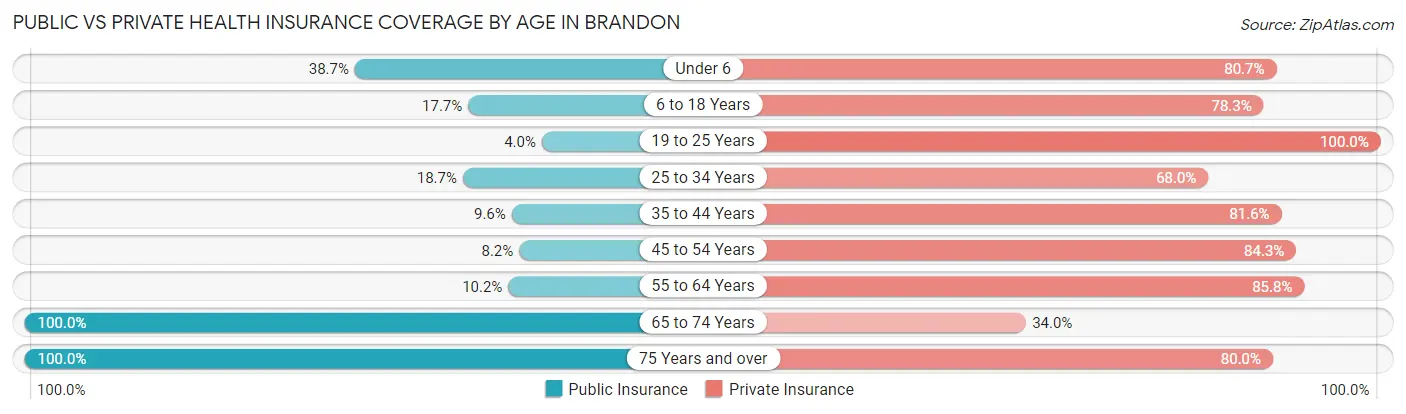
| Age Bracket | Public Insurance | Private Insurance |
| Under 6 | 12 (38.7%) | 25 (80.6%) |
| 6 to 18 Years | 35 (17.7%) | 155 (78.3%) |
| 19 to 25 Years | 2 (4.0%) | 50 (100.0%) |
| 25 to 34 Years | 14 (18.7%) | 51 (68.0%) |
| 35 to 44 Years | 12 (9.6%) | 102 (81.6%) |
| 45 to 54 Years | 11 (8.2%) | 113 (84.3%) |
| 55 to 64 Years | 13 (10.2%) | 109 (85.8%) |
| 65 to 74 Years | 47 (100.0%) | 16 (34.0%) |
| 75 Years and over | 55 (100.0%) | 44 (80.0%) |
| Total | 201 (23.9%) | 665 (79.0%) |
Disability Status by Sex by Age in Brandon
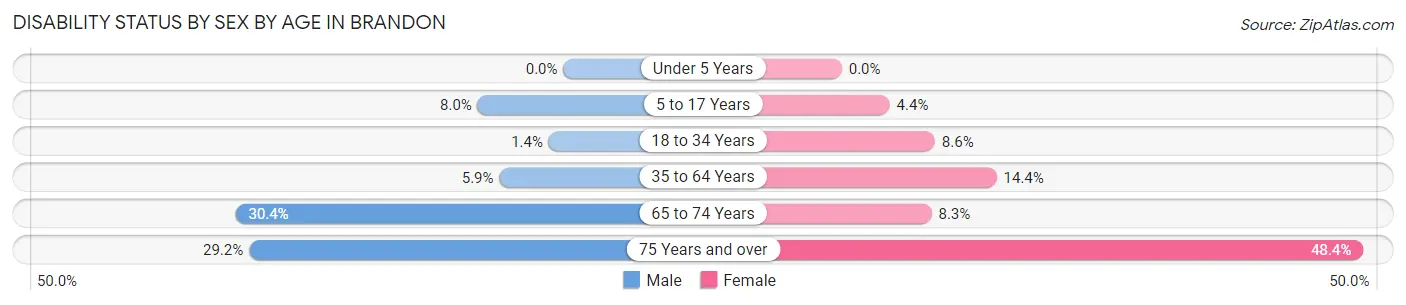
| Age Bracket | Male | Female |
| Under 5 Years | 0 (0.0%) | 0 (0.0%) |
| 5 to 17 Years | 7 (8.0%) | 4 (4.4%) |
| 18 to 34 Years | 1 (1.3%) | 7 (8.6%) |
| 35 to 64 Years | 13 (5.9%) | 24 (14.4%) |
| 65 to 74 Years | 7 (30.4%) | 2 (8.3%) |
| 75 Years and over | 7 (29.2%) | 15 (48.4%) |
Disability Class by Sex by Age in Brandon
Disability Class: Hearing Difficulty
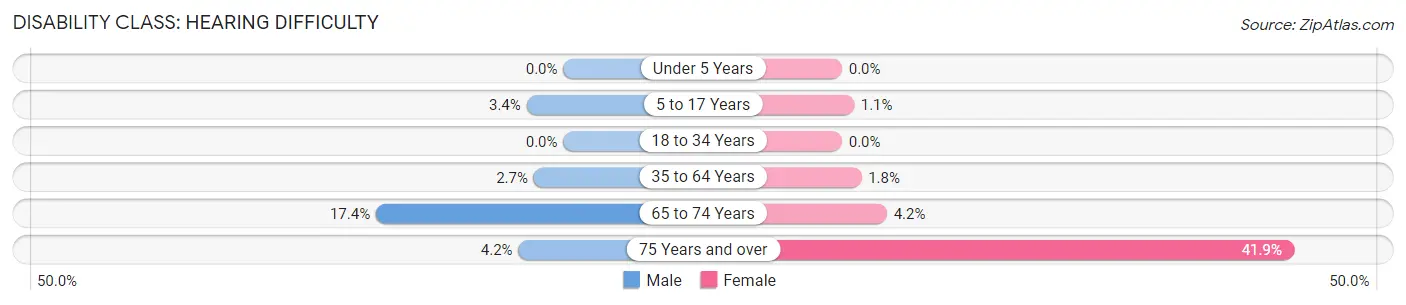
| Age Bracket | Male | Female |
| Under 5 Years | 0 (0.0%) | 0 (0.0%) |
| 5 to 17 Years | 3 (3.4%) | 1 (1.1%) |
| 18 to 34 Years | 0 (0.0%) | 0 (0.0%) |
| 35 to 64 Years | 6 (2.7%) | 3 (1.8%) |
| 65 to 74 Years | 4 (17.4%) | 1 (4.2%) |
| 75 Years and over | 1 (4.2%) | 13 (41.9%) |
Disability Class: Vision Difficulty
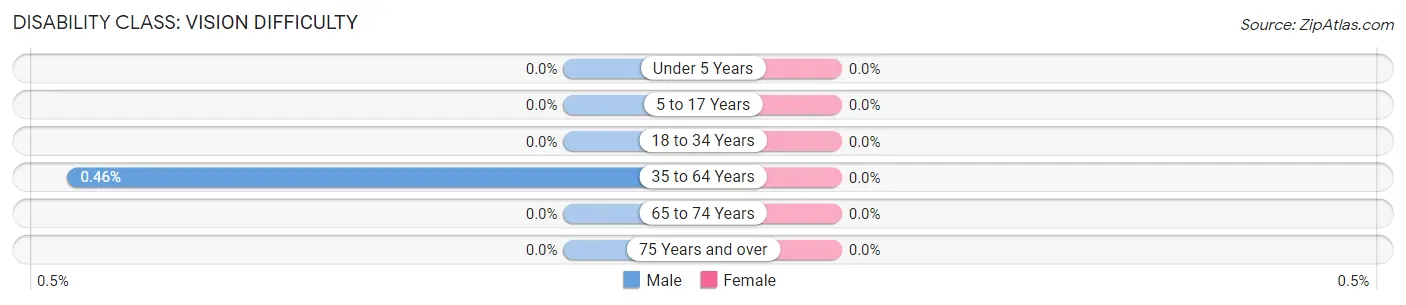
| Age Bracket | Male | Female |
| Under 5 Years | 0 (0.0%) | 0 (0.0%) |
| 5 to 17 Years | 0 (0.0%) | 0 (0.0%) |
| 18 to 34 Years | 0 (0.0%) | 0 (0.0%) |
| 35 to 64 Years | 1 (0.5%) | 0 (0.0%) |
| 65 to 74 Years | 0 (0.0%) | 0 (0.0%) |
| 75 Years and over | 0 (0.0%) | 0 (0.0%) |
Disability Class: Cognitive Difficulty
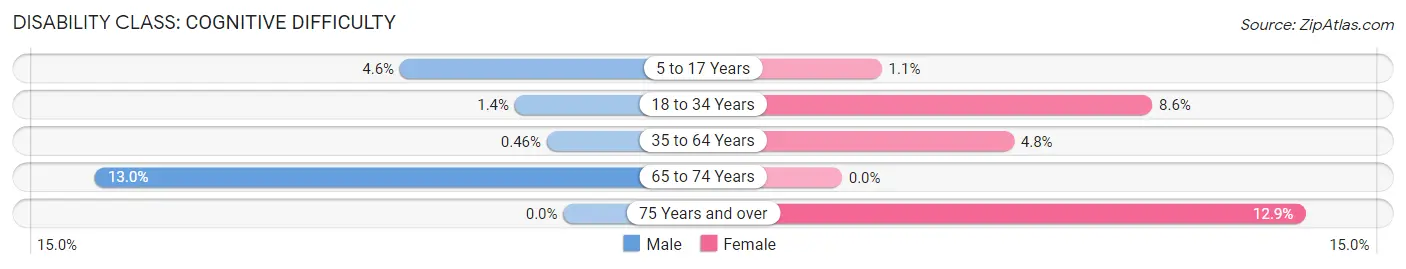
| Age Bracket | Male | Female |
| 5 to 17 Years | 4 (4.5%) | 1 (1.1%) |
| 18 to 34 Years | 1 (1.3%) | 7 (8.6%) |
| 35 to 64 Years | 1 (0.5%) | 8 (4.8%) |
| 65 to 74 Years | 3 (13.0%) | 0 (0.0%) |
| 75 Years and over | 0 (0.0%) | 4 (12.9%) |
Disability Class: Ambulatory Difficulty
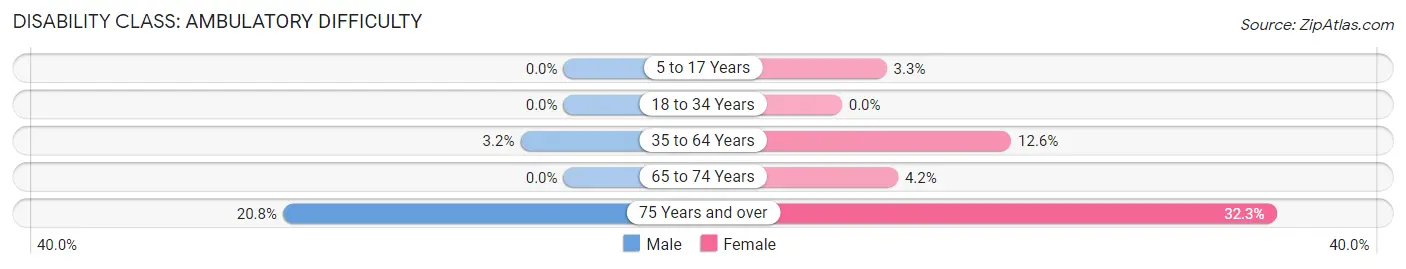
| Age Bracket | Male | Female |
| 5 to 17 Years | 0 (0.0%) | 3 (3.3%) |
| 18 to 34 Years | 0 (0.0%) | 0 (0.0%) |
| 35 to 64 Years | 7 (3.2%) | 21 (12.6%) |
| 65 to 74 Years | 0 (0.0%) | 1 (4.2%) |
| 75 Years and over | 5 (20.8%) | 10 (32.3%) |
Disability Class: Self-Care Difficulty
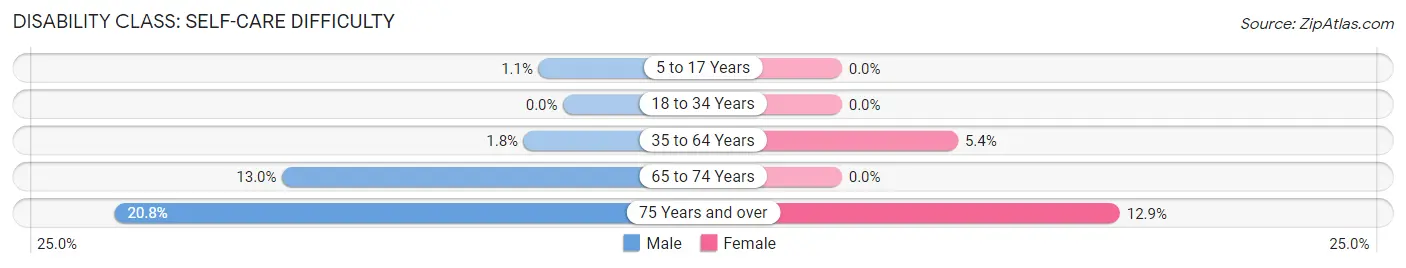
| Age Bracket | Male | Female |
| 5 to 17 Years | 1 (1.1%) | 0 (0.0%) |
| 18 to 34 Years | 0 (0.0%) | 0 (0.0%) |
| 35 to 64 Years | 4 (1.8%) | 9 (5.4%) |
| 65 to 74 Years | 3 (13.0%) | 0 (0.0%) |
| 75 Years and over | 5 (20.8%) | 4 (12.9%) |
Technology Access in Brandon
Computing Device Access in Brandon
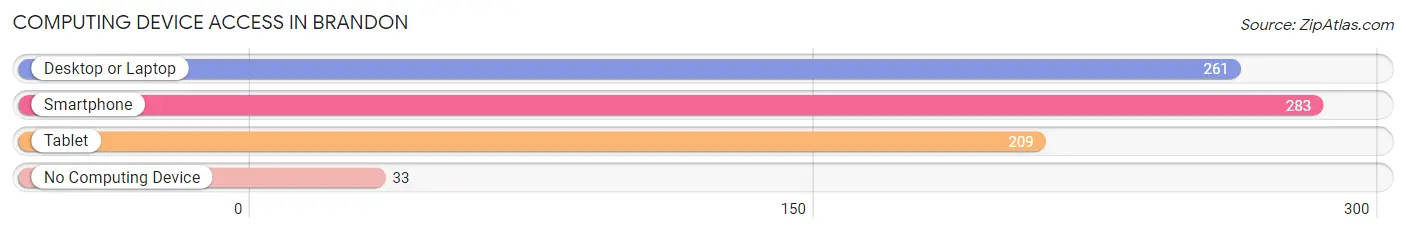
| Device Type | # Households | % Households |
| Desktop or Laptop | 261 | 78.8% |
| Smartphone | 283 | 85.5% |
| Tablet | 209 | 63.1% |
| No Computing Device | 33 | 10.0% |
| Total | 331 | 100.0% |
Internet Access in Brandon
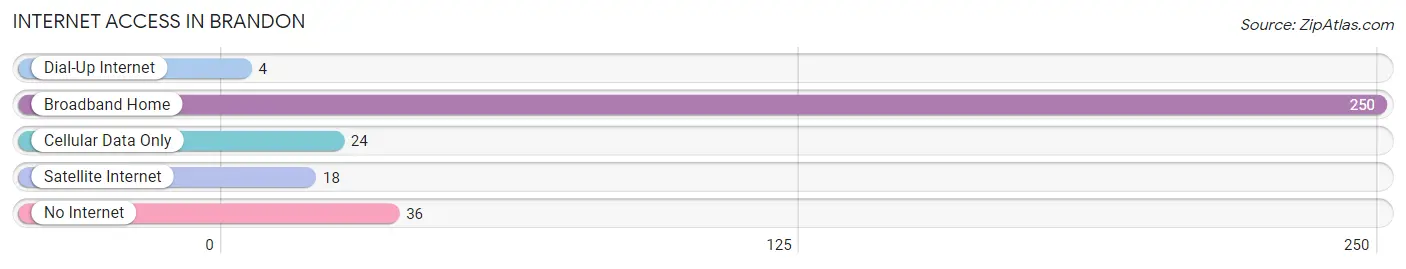
| Internet Type | # Households | % Households |
| Dial-Up Internet | 4 | 1.2% |
| Broadband Home | 250 | 75.5% |
| Cellular Data Only | 24 | 7.2% |
| Satellite Internet | 18 | 5.4% |
| No Internet | 36 | 10.9% |
| Total | 331 | 100.0% |
Brandon Summary
Brandon is a small town located in Fond du Lac County, Wisconsin. It is situated on the western edge of the county, just south of the city of Fond du Lac. The town was founded in 1845 and has a population of just over 1,000 people.
History
The area that is now Brandon was first settled in 1845 by a group of German immigrants. The town was originally called “New Berlin”, but was later changed to Brandon in 1856. The town was named after a local settler, William Brandon.
The town was primarily an agricultural community for many years, with the main crops being wheat, corn, and oats. In the late 19th century, Brandon began to develop into a small industrial center, with several factories being built in the area. These factories included a flour mill, a sawmill, a cheese factory, and a brickyard.
Geography
Brandon is located in the western part of Fond du Lac County, Wisconsin. It is situated on the western edge of the county, just south of the city of Fond du Lac. The town is bordered by the towns of Oakfield to the north, Eden to the east, and Taycheedah to the south.
The town has a total area of 2.2 square miles, all of which is land. The terrain is mostly flat, with some rolling hills in the northern part of the town. The town is located in the Central Plain region of Wisconsin, and is part of the Eastern Ridges and Lowlands ecoregion.
Economy
The economy of Brandon is largely based on agriculture and manufacturing. The town is home to several small businesses, including a cheese factory, a sawmill, and a flour mill. The town also has a few retail stores, including a grocery store and a hardware store.
The town is also home to several small farms, which produce a variety of crops, including wheat, corn, and oats. The town also has a few small vineyards, which produce wine for local consumption.
Demographics
As of the 2010 census, the population of Brandon was 1,072. The racial makeup of the town was 97.3% White, 0.7% African American, 0.2% Native American, 0.2% Asian, 0.2% from other races, and 1.4% from two or more races. Hispanic or Latino of any race were 1.2% of the population.
The median household income in Brandon was $50,938, and the median family income was $60,000. The per capita income for the town was $22,845. About 4.3% of families and 5.7% of the population were below the poverty line, including 6.3% of those under age 18 and 4.2% of those age 65 or over.
Common Questions
What is Per Capita Income in Brandon?
Per Capita income in Brandon is $37,085.
What is the Median Family Income in Brandon?
Median Family Income in Brandon is $102,500.
What is the Median Household income in Brandon?
Median Household Income in Brandon is $79,688.
What is Income or Wage Gap in Brandon?
Income or Wage Gap in Brandon is 42.3%.
Women in Brandon earn 57.7 cents for every dollar earned by a man.
What is Inequality or Gini Index in Brandon?
Inequality or Gini Index in Brandon is 0.40.
What is the Total Population of Brandon?
Total Population of Brandon is 842.
What is the Total Male Population of Brandon?
Total Male Population of Brandon is 435.
What is the Total Female Population of Brandon?
Total Female Population of Brandon is 407.
What is the Ratio of Males per 100 Females in Brandon?
There are 106.88 Males per 100 Females in Brandon.
What is the Ratio of Females per 100 Males in Brandon?
There are 93.56 Females per 100 Males in Brandon.
What is the Median Population Age in Brandon?
Median Population Age in Brandon is 41.3 Years.
What is the Average Family Size in Brandon
Average Family Size in Brandon is 3.3 People.
What is the Average Household Size in Brandon
Average Household Size in Brandon is 2.5 People.
How Large is the Labor Force in Brandon?
There are 495 People in the Labor Forcein in Brandon.
What is the Percentage of People in the Labor Force in Brandon?
75.0% of People are in the Labor Force in Brandon.
What is the Unemployment Rate in Brandon?
Unemployment Rate in Brandon is 4.0%.