Bowler, WI Map & Demographics
Bowler Map
Bowler Overview
$25,984
PER CAPITA INCOME
$88,958
AVG FAMILY INCOME
$50,000
AVG HOUSEHOLD INCOME
27.5%
WAGE / INCOME GAP [ % ]
72.5¢/ $1
WAGE / INCOME GAP [ $ ]
0.38
INEQUALITY / GINI INDEX
297
TOTAL POPULATION
157
MALE POPULATION
140
FEMALE POPULATION
112.14
MALES / 100 FEMALES
89.17
FEMALES / 100 MALES
34.6
MEDIAN AGE
3.4
AVG FAMILY SIZE
2.4
AVG HOUSEHOLD SIZE
128
LABOR FORCE [ PEOPLE ]
60.1%
PERCENT IN LABOR FORCE
0.8%
UNEMPLOYMENT RATE
Bowler Zip Codes
Bowler Area Codes
Income in Bowler
Income Overview in Bowler
Per Capita Income in Bowler is $25,984, while median incomes of families and households are $88,958 and $50,000 respectively.
| Characteristic | Number | Measure |
| Per Capita Income | 297 | $25,984 |
| Median Family Income | 69 | $88,958 |
| Mean Family Income | 69 | $84,801 |
| Median Household Income | 124 | $50,000 |
| Mean Household Income | 124 | $60,660 |
| Income Deficit | 69 | $0 |
| Wage / Income Gap (%) | 297 | 27.52% |
| Wage / Income Gap ($) | 297 | 72.48¢ per $1 |
| Gini / Inequality Index | 297 | 0.38 |
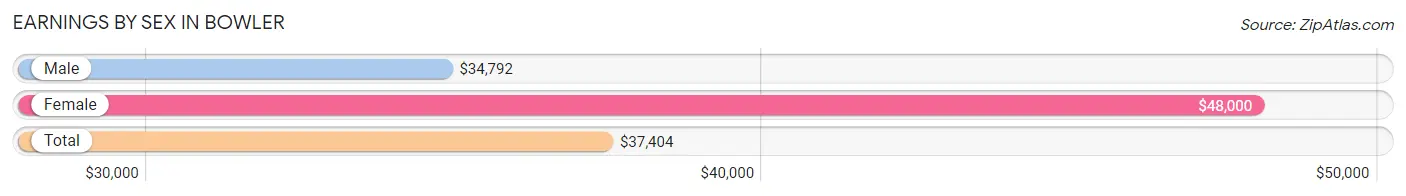
Earnings by Sex in Bowler
Average Earnings in Bowler are $37,404, $34,792 for men and $48,000 for women, a difference of 27.5%.
| Sex | Number | Average Earnings |
| Male | 75 (53.2%) | $34,792 |
| Female | 66 (46.8%) | $48,000 |
| Total | 141 (100.0%) | $37,404 |
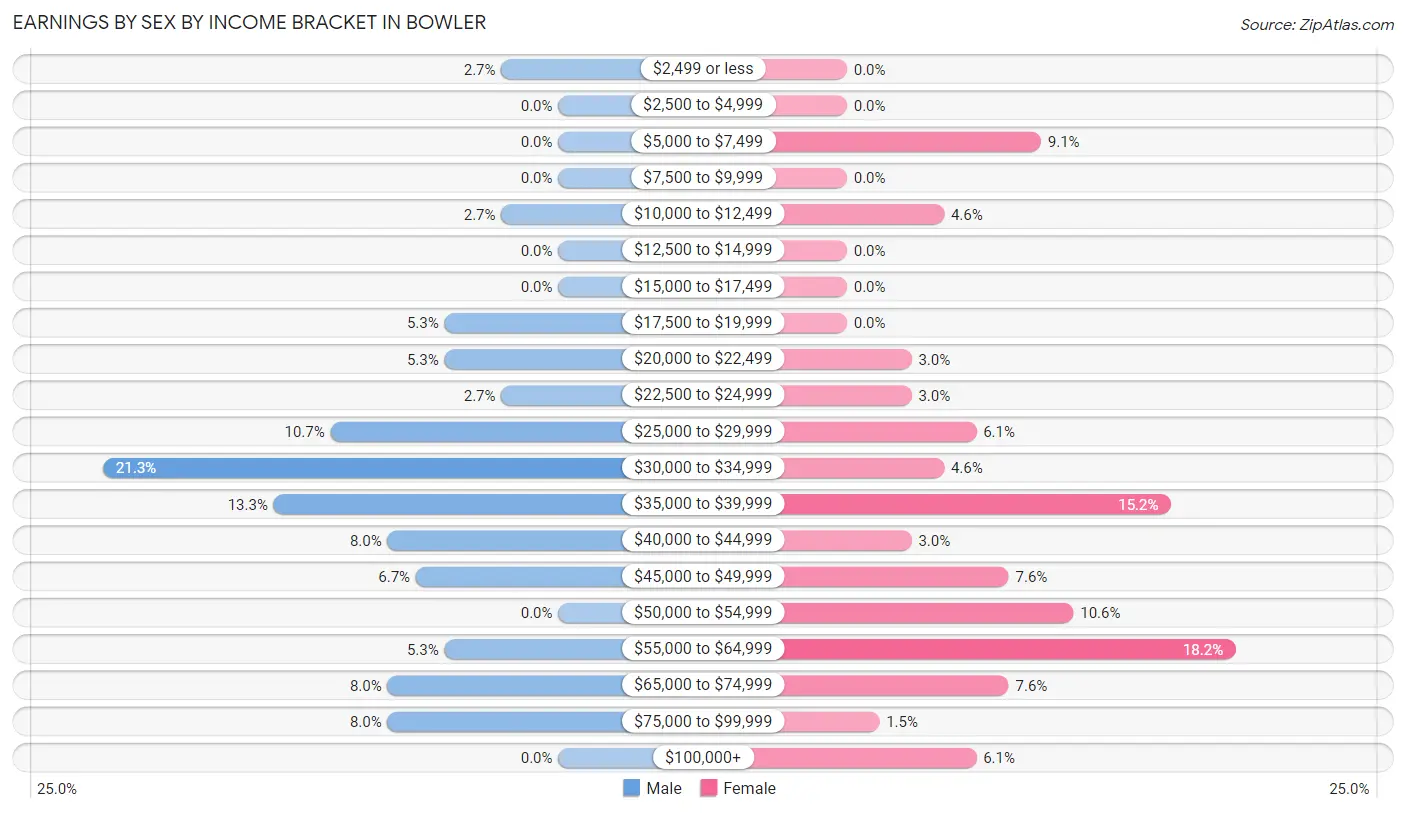
Earnings by Sex by Income Bracket in Bowler
The most common earnings brackets in Bowler are $30,000 to $34,999 for men (16 | 21.3%) and $55,000 to $64,999 for women (12 | 18.2%).
| Income | Male | Female |
| $2,499 or less | 2 (2.7%) | 0 (0.0%) |
| $2,500 to $4,999 | 0 (0.0%) | 0 (0.0%) |
| $5,000 to $7,499 | 0 (0.0%) | 6 (9.1%) |
| $7,500 to $9,999 | 0 (0.0%) | 0 (0.0%) |
| $10,000 to $12,499 | 2 (2.7%) | 3 (4.5%) |
| $12,500 to $14,999 | 0 (0.0%) | 0 (0.0%) |
| $15,000 to $17,499 | 0 (0.0%) | 0 (0.0%) |
| $17,500 to $19,999 | 4 (5.3%) | 0 (0.0%) |
| $20,000 to $22,499 | 4 (5.3%) | 2 (3.0%) |
| $22,500 to $24,999 | 2 (2.7%) | 2 (3.0%) |
| $25,000 to $29,999 | 8 (10.7%) | 4 (6.1%) |
| $30,000 to $34,999 | 16 (21.3%) | 3 (4.5%) |
| $35,000 to $39,999 | 10 (13.3%) | 10 (15.1%) |
| $40,000 to $44,999 | 6 (8.0%) | 2 (3.0%) |
| $45,000 to $49,999 | 5 (6.7%) | 5 (7.6%) |
| $50,000 to $54,999 | 0 (0.0%) | 7 (10.6%) |
| $55,000 to $64,999 | 4 (5.3%) | 12 (18.2%) |
| $65,000 to $74,999 | 6 (8.0%) | 5 (7.6%) |
| $75,000 to $99,999 | 6 (8.0%) | 1 (1.5%) |
| $100,000+ | 0 (0.0%) | 4 (6.1%) |
| Total | 75 (100.0%) | 66 (100.0%) |
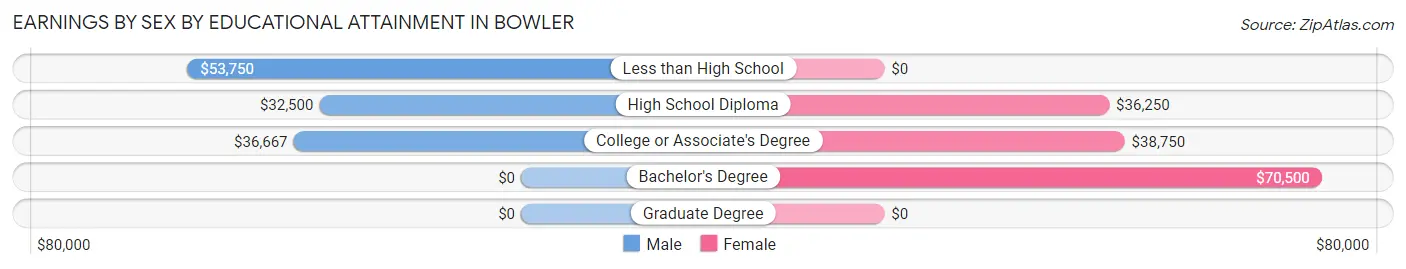
Earnings by Sex by Educational Attainment in Bowler
Average earnings in Bowler are $37,679 for men and $48,750 for women, a difference of 22.7%. Men with an educational attainment of less than high school enjoy the highest average annual earnings of $53,750, while those with high school diploma education earn the least with $32,500. Women with an educational attainment of bachelor's degree earn the most with the average annual earnings of $70,500, while those with high school diploma education have the smallest earnings of $36,250.
| Educational Attainment | Male Income | Female Income |
| Less than High School | $53,750 | $0 |
| High School Diploma | $32,500 | $36,250 |
| College or Associate's Degree | $36,667 | $38,750 |
| Bachelor's Degree | - | - |
| Graduate Degree | - | - |
| Total | $37,679 | $48,750 |
Family Income in Bowler
Family Income Brackets in Bowler
According to the Bowler family income data, there are 23 families falling into the $100,000 to $149,999 income range, which is the most common income bracket and makes up 33.3% of all families.
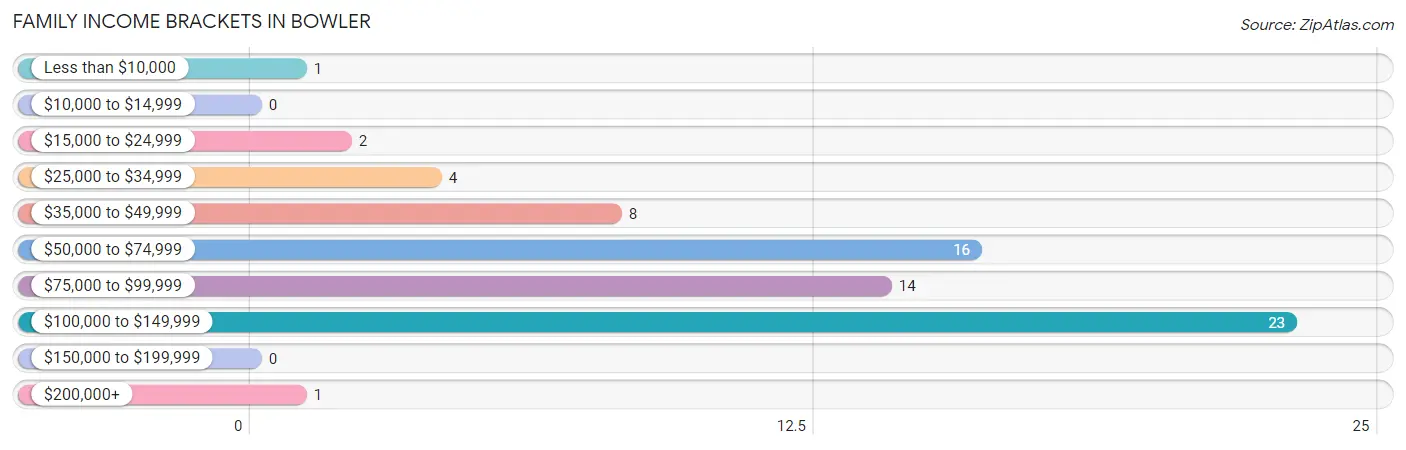
| Income Bracket | # Families | % Families |
| Less than $10,000 | 1 | 1.4% |
| $10,000 to $14,999 | 0 | 0.0% |
| $15,000 to $24,999 | 2 | 2.9% |
| $25,000 to $34,999 | 4 | 5.8% |
| $35,000 to $49,999 | 8 | 11.6% |
| $50,000 to $74,999 | 16 | 23.2% |
| $75,000 to $99,999 | 14 | 20.3% |
| $100,000 to $149,999 | 23 | 33.3% |
| $150,000 to $199,999 | 0 | 0.0% |
| $200,000+ | 1 | 1.4% |
Family Income by Famaliy Size in Bowler
4-person families (12 | 17.4%) account for the highest median family income in Bowler with $92,500 per family, while 2-person families (33 | 47.8%) have the highest median income of $33,125 per family member.
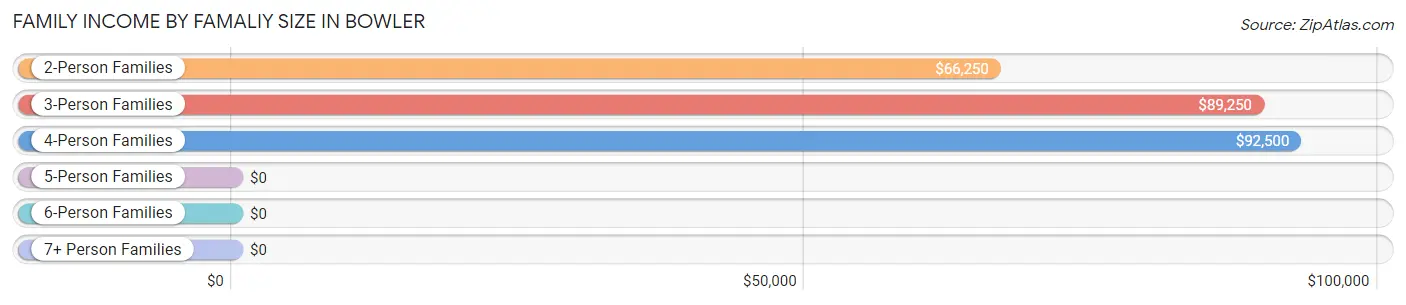
| Income Bracket | # Families | Median Income |
| 2-Person Families | 33 (47.8%) | $66,250 |
| 3-Person Families | 15 (21.7%) | $89,250 |
| 4-Person Families | 12 (17.4%) | $92,500 |
| 5-Person Families | 3 (4.3%) | $0 |
| 6-Person Families | 6 (8.7%) | $0 |
| 7+ Person Families | 0 (0.0%) | $0 |
| Total | 69 (100.0%) | $88,958 |
Family Income by Number of Earners in Bowler
The median family income in Bowler is $88,958, with families comprising 3+ earners (10) having the highest median family income of $137,500, while families with no earners (5) have the lowest median family income of $44,375, accounting for 14.5% and 7.2% of families, respectively.
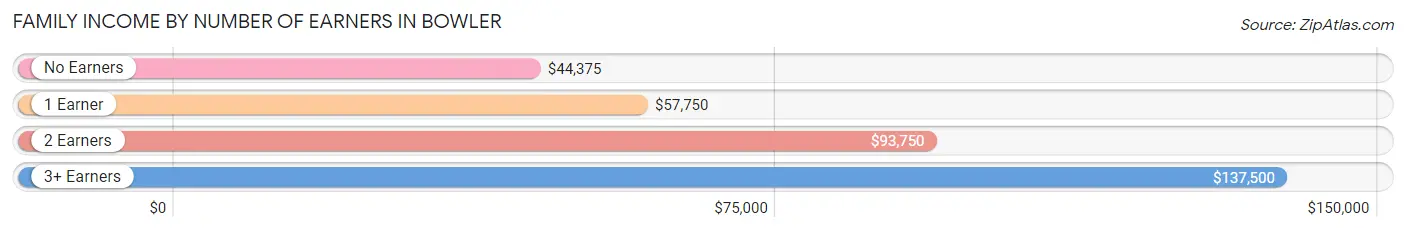
| Number of Earners | # Families | Median Income |
| No Earners | 5 (7.2%) | $44,375 |
| 1 Earner | 25 (36.2%) | $57,750 |
| 2 Earners | 29 (42.0%) | $93,750 |
| 3+ Earners | 10 (14.5%) | $137,500 |
| Total | 69 (100.0%) | $88,958 |
Household Income in Bowler
Household Income Brackets in Bowler
With 26 households falling in the category, the $100,000 to $149,999 income range is the most frequent in Bowler, accounting for 21.0% of all households.
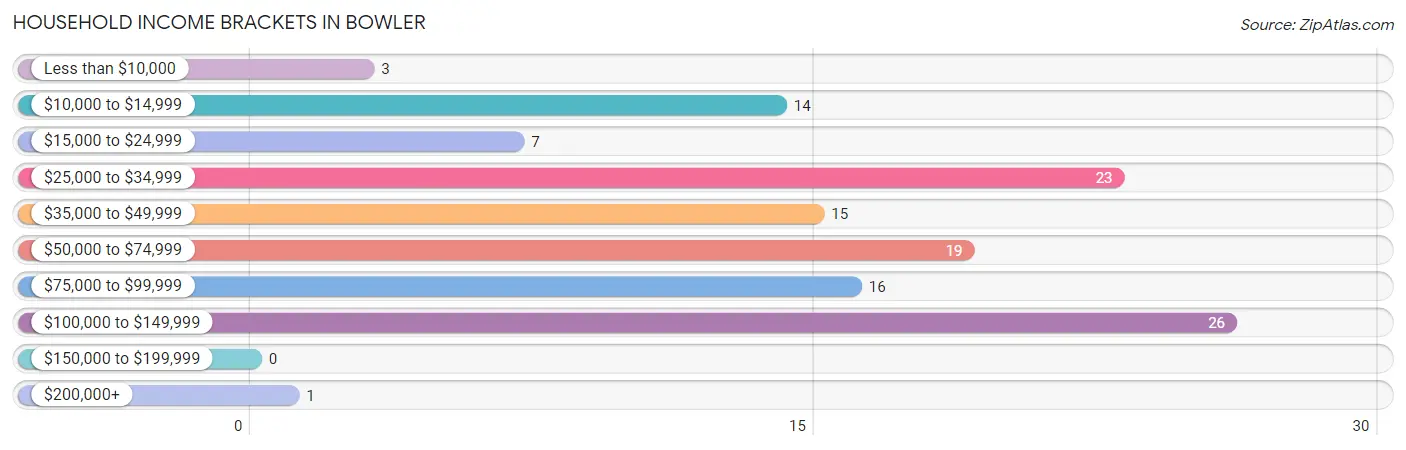
| Income Bracket | # Households | % Households |
| Less than $10,000 | 3 | 2.4% |
| $10,000 to $14,999 | 14 | 11.3% |
| $15,000 to $24,999 | 7 | 5.6% |
| $25,000 to $34,999 | 23 | 18.5% |
| $35,000 to $49,999 | 15 | 12.1% |
| $50,000 to $74,999 | 19 | 15.3% |
| $75,000 to $99,999 | 16 | 12.9% |
| $100,000 to $149,999 | 26 | 21.0% |
| $150,000 to $199,999 | 0 | 0.0% |
| $200,000+ | 1 | 0.8% |
Household Income by Householder Age in Bowler
The median household income in Bowler is $50,000, with the highest median household income of $71,250 found in the 45 to 64 years age bracket for the primary householder. A total of 48 households (38.7%) fall into this category.
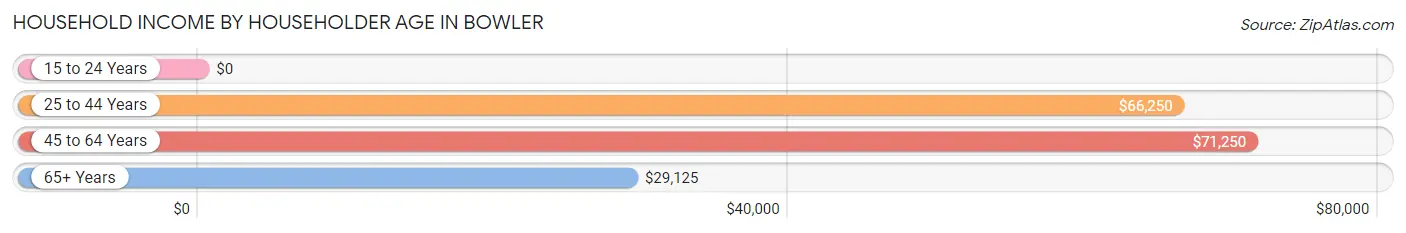
| Income Bracket | # Households | Median Income |
| 15 to 24 Years | 0 (0.0%) | $0 |
| 25 to 44 Years | 40 (32.3%) | $66,250 |
| 45 to 64 Years | 48 (38.7%) | $71,250 |
| 65+ Years | 36 (29.0%) | $29,125 |
| Total | 124 (100.0%) | $50,000 |
Poverty in Bowler
Income Below Poverty by Sex and Age in Bowler
With 14.6% poverty level for males and 12.9% for females among the residents of Bowler, 16 and 17 year old males and 5 year old females are the most vulnerable to poverty, with 1 males (50.0%) and 4 females (100.0%) in their respective age groups living below the poverty level.
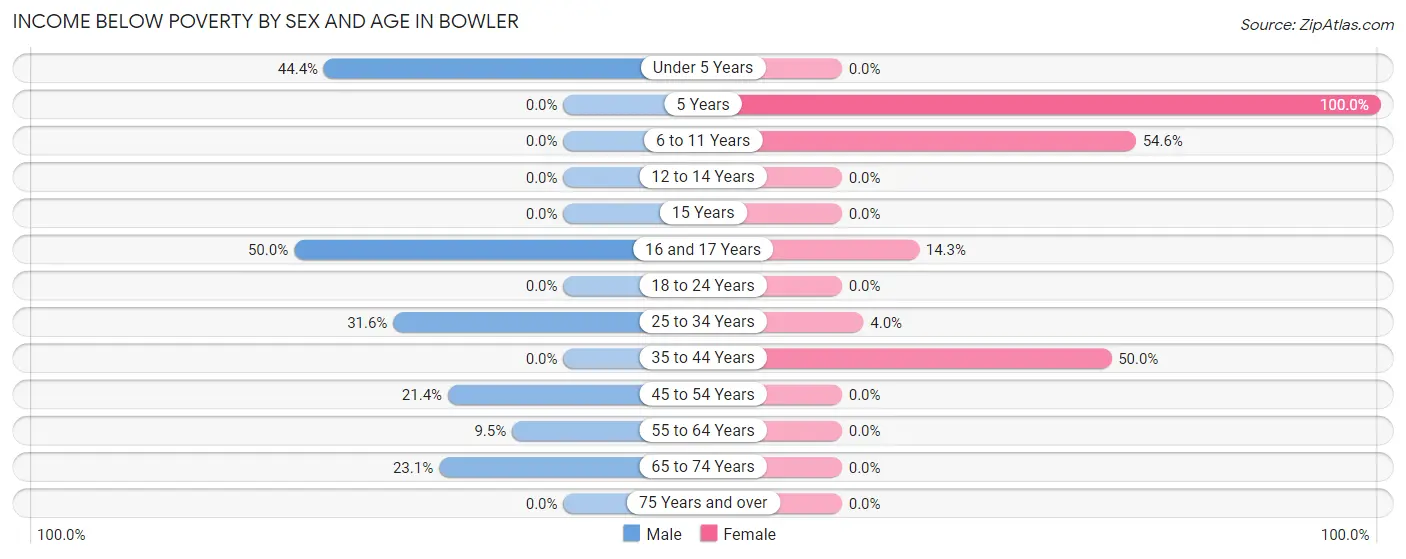
| Age Bracket | Male | Female |
| Under 5 Years | 8 (44.4%) | 0 (0.0%) |
| 5 Years | 0 (0.0%) | 4 (100.0%) |
| 6 to 11 Years | 0 (0.0%) | 6 (54.5%) |
| 12 to 14 Years | 0 (0.0%) | 0 (0.0%) |
| 15 Years | 0 (0.0%) | 0 (0.0%) |
| 16 and 17 Years | 1 (50.0%) | 1 (14.3%) |
| 18 to 24 Years | 0 (0.0%) | 0 (0.0%) |
| 25 to 34 Years | 6 (31.6%) | 1 (4.0%) |
| 35 to 44 Years | 0 (0.0%) | 6 (50.0%) |
| 45 to 54 Years | 3 (21.4%) | 0 (0.0%) |
| 55 to 64 Years | 2 (9.5%) | 0 (0.0%) |
| 65 to 74 Years | 3 (23.1%) | 0 (0.0%) |
| 75 Years and over | 0 (0.0%) | 0 (0.0%) |
| Total | 23 (14.6%) | 18 (12.9%) |
Income Above Poverty by Sex and Age in Bowler
According to the poverty statistics in Bowler, males aged 6 to 11 years and females aged 12 to 14 years are the age groups that are most secure financially, with 100.0% of males and 100.0% of females in these age groups living above the poverty line.
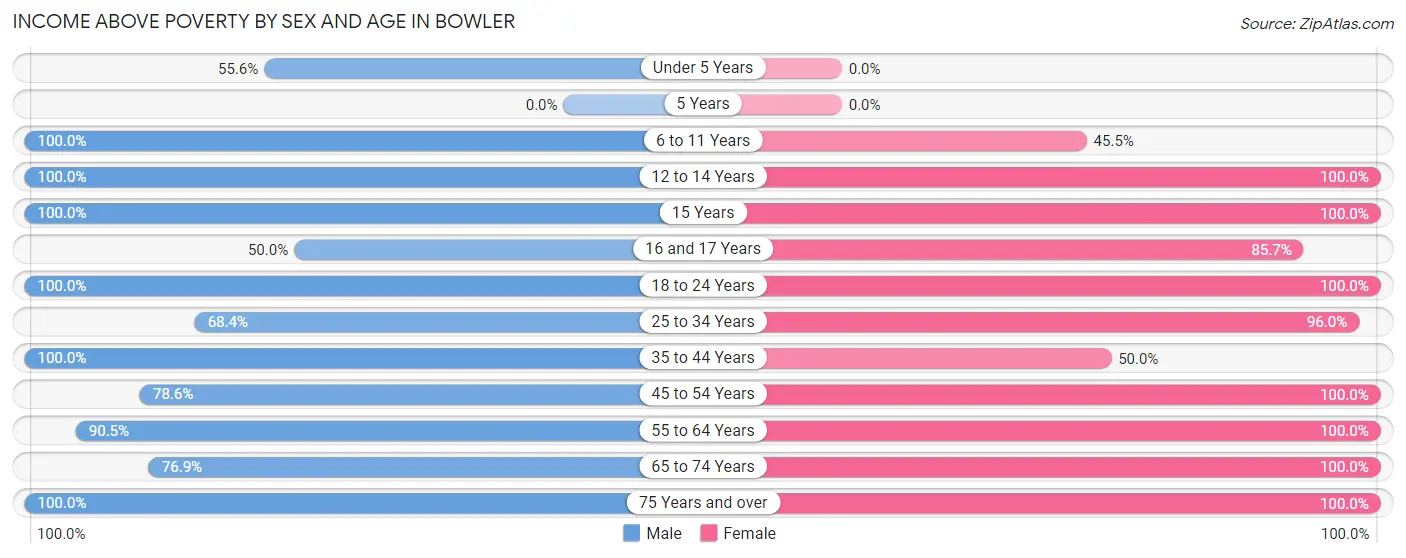
| Age Bracket | Male | Female |
| Under 5 Years | 10 (55.6%) | 0 (0.0%) |
| 5 Years | 0 (0.0%) | 0 (0.0%) |
| 6 to 11 Years | 25 (100.0%) | 5 (45.5%) |
| 12 to 14 Years | 12 (100.0%) | 6 (100.0%) |
| 15 Years | 3 (100.0%) | 5 (100.0%) |
| 16 and 17 Years | 1 (50.0%) | 6 (85.7%) |
| 18 to 24 Years | 7 (100.0%) | 7 (100.0%) |
| 25 to 34 Years | 13 (68.4%) | 24 (96.0%) |
| 35 to 44 Years | 18 (100.0%) | 6 (50.0%) |
| 45 to 54 Years | 11 (78.6%) | 16 (100.0%) |
| 55 to 64 Years | 19 (90.5%) | 17 (100.0%) |
| 65 to 74 Years | 10 (76.9%) | 23 (100.0%) |
| 75 Years and over | 5 (100.0%) | 7 (100.0%) |
| Total | 134 (85.4%) | 122 (87.1%) |
Income Below Poverty Among Married-Couple Families in Bowler
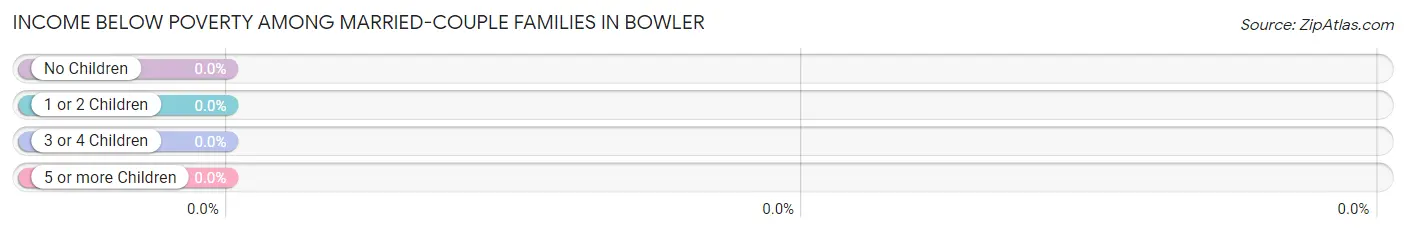
| Children | Above Poverty | Below Poverty |
| No Children | 24 (100.0%) | 0 (0.0%) |
| 1 or 2 Children | 14 (100.0%) | 0 (0.0%) |
| 3 or 4 Children | 8 (100.0%) | 0 (0.0%) |
| 5 or more Children | 0 (0.0%) | 0 (0.0%) |
| Total | 46 (100.0%) | 0 (0.0%) |
Income Below Poverty Among Single-Parent Households in Bowler
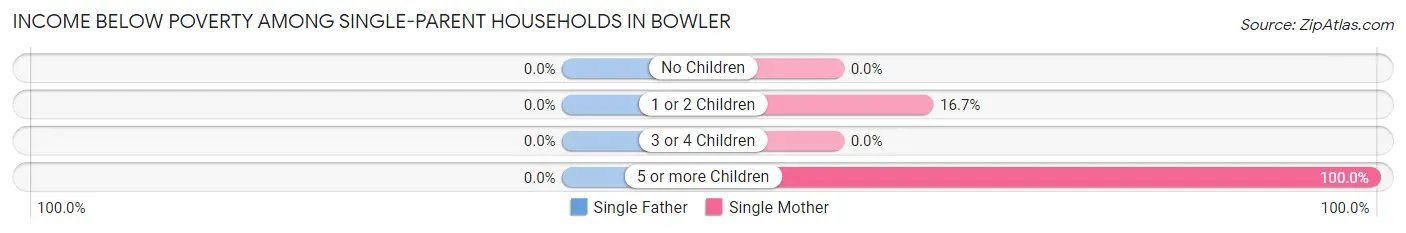
| Children | Single Father | Single Mother |
| No Children | 0 (0.0%) | 0 (0.0%) |
| 1 or 2 Children | 0 (0.0%) | 1 (16.7%) |
| 3 or 4 Children | 0 (0.0%) | 0 (0.0%) |
| 5 or more Children | 0 (0.0%) | 1 (100.0%) |
| Total | 0 (0.0%) | 2 (20.0%) |
Income Below Poverty Among Married-Couple vs Single-Parent Households in Bowler
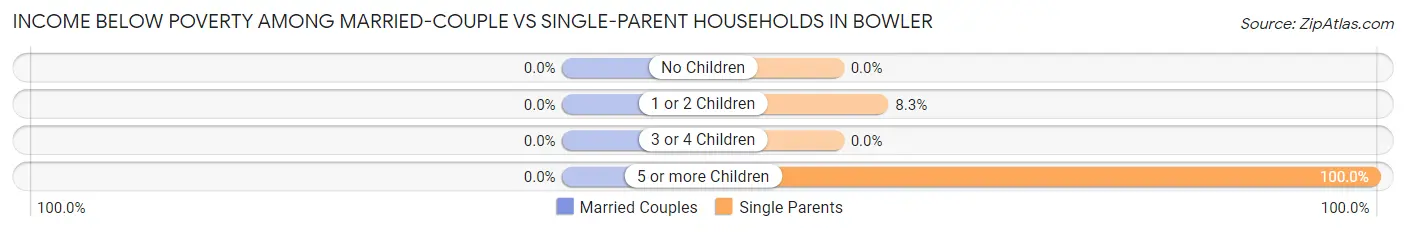
| Children | Married-Couple Families | Single-Parent Households |
| No Children | 0 (0.0%) | 0 (0.0%) |
| 1 or 2 Children | 0 (0.0%) | 1 (8.3%) |
| 3 or 4 Children | 0 (0.0%) | 0 (0.0%) |
| 5 or more Children | 0 (0.0%) | 1 (100.0%) |
| Total | 0 (0.0%) | 2 (8.7%) |
Race in Bowler
The most populous races in Bowler are White / Caucasian (190 | 64.0%), Native / Alaskan (64 | 21.5%), and Two or more Races (31 | 10.4%).
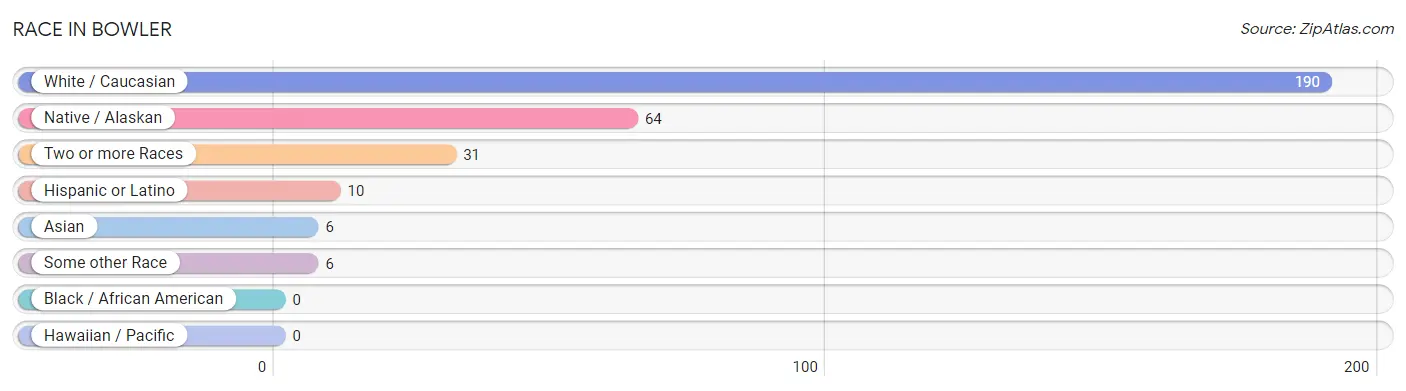
| Race | # Population | % Population |
| Asian | 6 | 2.0% |
| Black / African American | 0 | 0.0% |
| Hawaiian / Pacific | 0 | 0.0% |
| Hispanic or Latino | 10 | 3.4% |
| Native / Alaskan | 64 | 21.5% |
| White / Caucasian | 190 | 64.0% |
| Two or more Races | 31 | 10.4% |
| Some other Race | 6 | 2.0% |
| Total | 297 | 100.0% |
Ancestry in Bowler
The most populous ancestries reported in Bowler are German (115 | 38.7%), Menominee (32 | 10.8%), Chippewa (28 | 9.4%), Polish (25 | 8.4%), and Norwegian (17 | 5.7%), together accounting for 73.1% of all Bowler residents.
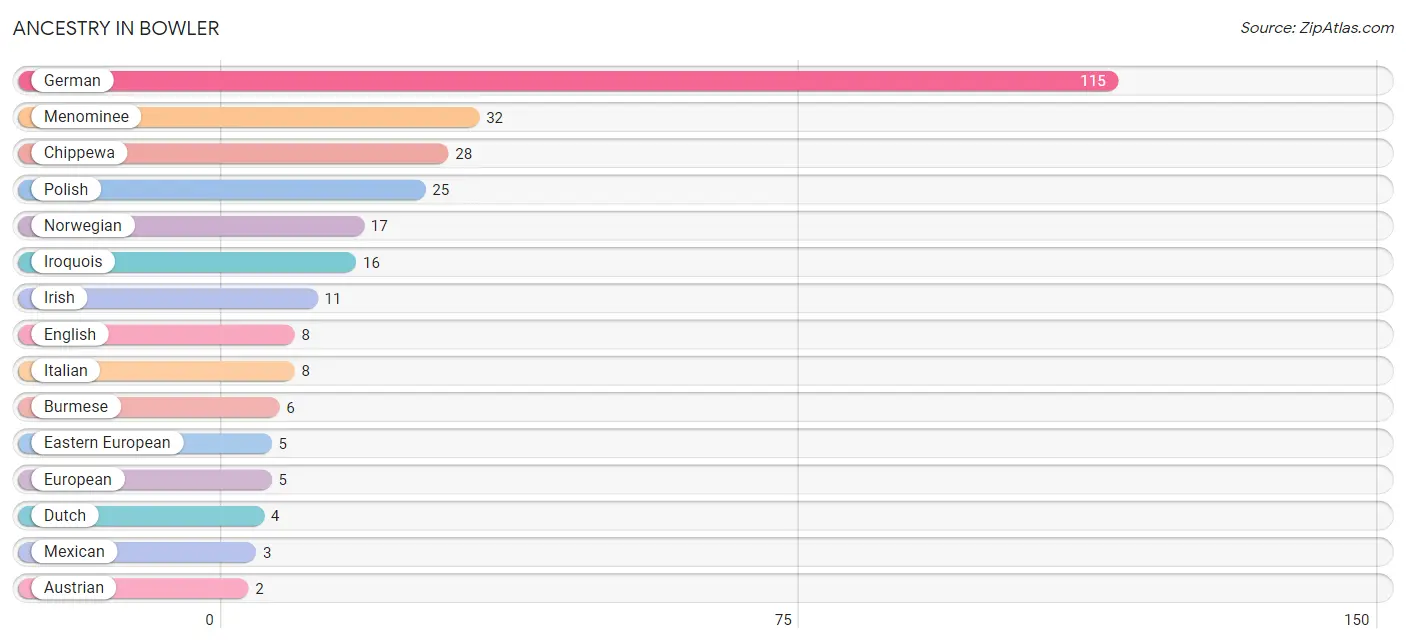
| Ancestry | # Population | % Population |
| Austrian | 2 | 0.7% |
| Burmese | 6 | 2.0% |
| Chippewa | 28 | 9.4% |
| Croatian | 1 | 0.3% |
| Dutch | 4 | 1.3% |
| Eastern European | 5 | 1.7% |
| English | 8 | 2.7% |
| European | 5 | 1.7% |
| French Canadian | 1 | 0.3% |
| German | 115 | 38.7% |
| Hungarian | 1 | 0.3% |
| Irish | 11 | 3.7% |
| Iroquois | 16 | 5.4% |
| Italian | 8 | 2.7% |
| Menominee | 32 | 10.8% |
| Mexican | 3 | 1.0% |
| Norwegian | 17 | 5.7% |
| Polish | 25 | 8.4% |
| Puerto Rican | 1 | 0.3% |
| Scottish | 2 | 0.7% | View All 20 Rows |
Immigrants in Bowler

| Immigration Origin | # Population | % Population | View All 0 Rows |
Sex and Age in Bowler
Sex and Age in Bowler
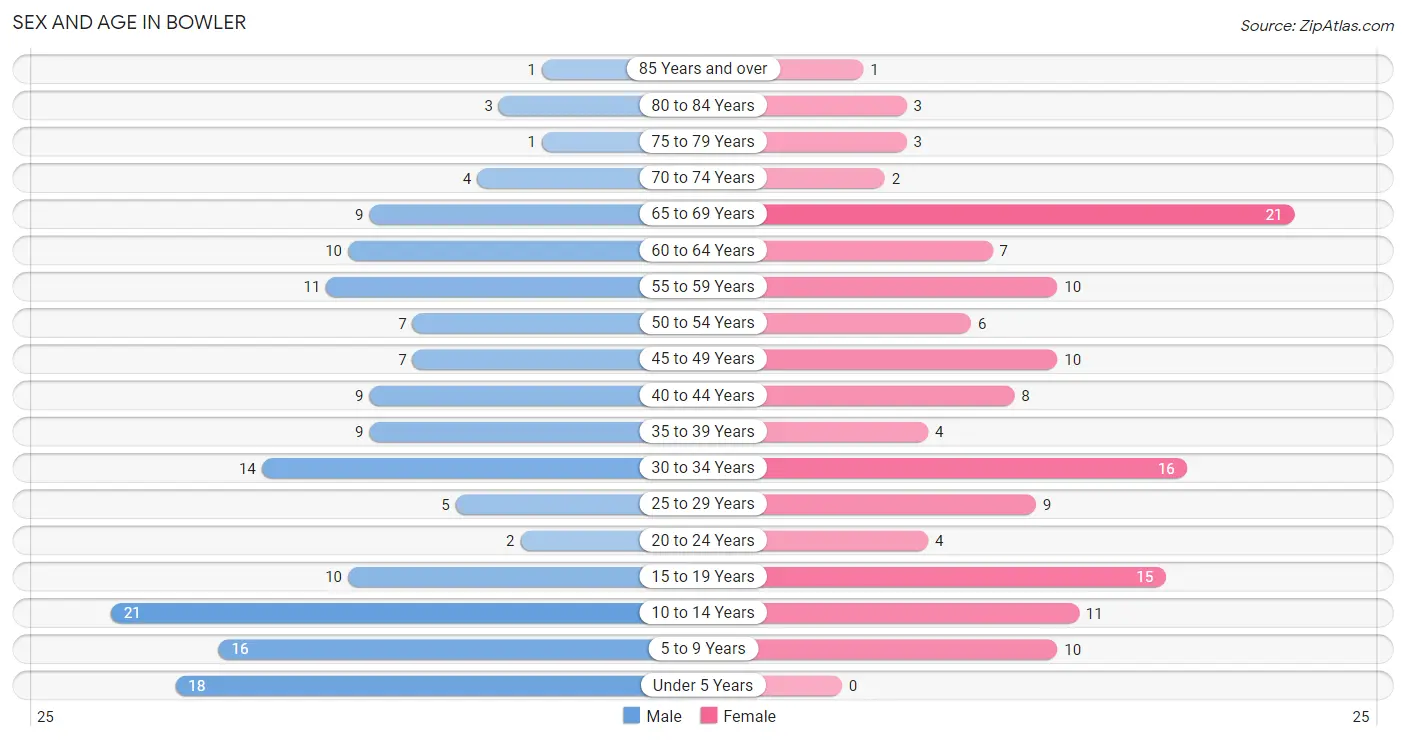
The most populous age groups in Bowler are 10 to 14 Years (21 | 13.4%) for men and 65 to 69 Years (21 | 15.0%) for women.
| Age Bracket | Male | Female |
| Under 5 Years | 18 (11.5%) | 0 (0.0%) |
| 5 to 9 Years | 16 (10.2%) | 10 (7.1%) |
| 10 to 14 Years | 21 (13.4%) | 11 (7.9%) |
| 15 to 19 Years | 10 (6.4%) | 15 (10.7%) |
| 20 to 24 Years | 2 (1.3%) | 4 (2.9%) |
| 25 to 29 Years | 5 (3.2%) | 9 (6.4%) |
| 30 to 34 Years | 14 (8.9%) | 16 (11.4%) |
| 35 to 39 Years | 9 (5.7%) | 4 (2.9%) |
| 40 to 44 Years | 9 (5.7%) | 8 (5.7%) |
| 45 to 49 Years | 7 (4.5%) | 10 (7.1%) |
| 50 to 54 Years | 7 (4.5%) | 6 (4.3%) |
| 55 to 59 Years | 11 (7.0%) | 10 (7.1%) |
| 60 to 64 Years | 10 (6.4%) | 7 (5.0%) |
| 65 to 69 Years | 9 (5.7%) | 21 (15.0%) |
| 70 to 74 Years | 4 (2.5%) | 2 (1.4%) |
| 75 to 79 Years | 1 (0.6%) | 3 (2.1%) |
| 80 to 84 Years | 3 (1.9%) | 3 (2.1%) |
| 85 Years and over | 1 (0.6%) | 1 (0.7%) |
| Total | 157 (100.0%) | 140 (100.0%) |
Families and Households in Bowler
Median Family Size in Bowler
The median family size in Bowler is 3.43 persons per family, with single female/mother families (10 | 14.5%) accounting for the largest median family size of 5.4 persons per family. On the other hand, married-couple families (46 | 66.7%) represent the smallest median family size with 3.09 persons per family.
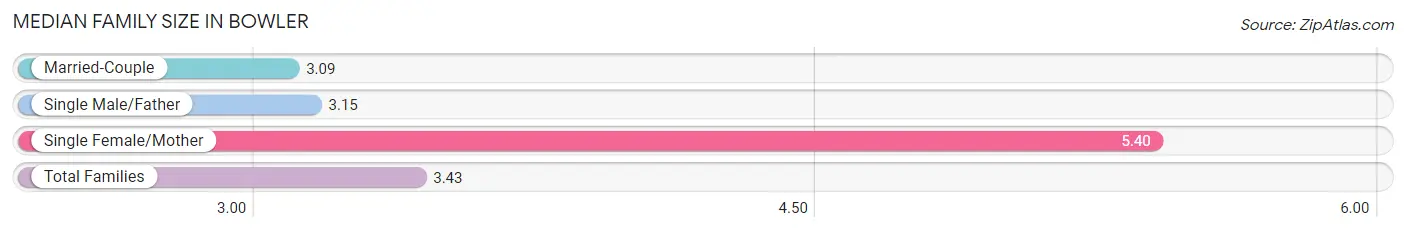
| Family Type | # Families | Family Size |
| Married-Couple | 46 (66.7%) | 3.09 |
| Single Male/Father | 13 (18.8%) | 3.15 |
| Single Female/Mother | 10 (14.5%) | 5.40 |
| Total Families | 69 (100.0%) | 3.43 |
Median Household Size in Bowler
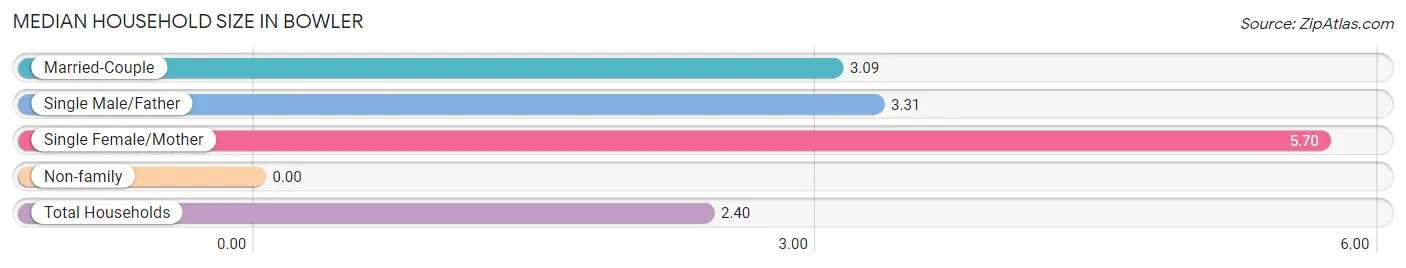
| Household Type | # Households | Household Size |
| Married-Couple | 46 (37.1%) | 3.09 |
| Single Male/Father | 13 (10.5%) | 3.31 |
| Single Female/Mother | 10 (8.1%) | 5.70 |
| Non-family | 55 (44.4%) | - |
| Total Households | 124 (100.0%) | 2.40 |
Household Size by Marriage Status in Bowler
Out of a total of 124 households in Bowler, 69 (55.6%) are family households, while 55 (44.4%) are nonfamily households. The most numerous type of family households are 2-person households, comprising 33, and the most common type of nonfamily households are 1-person households, comprising 55.
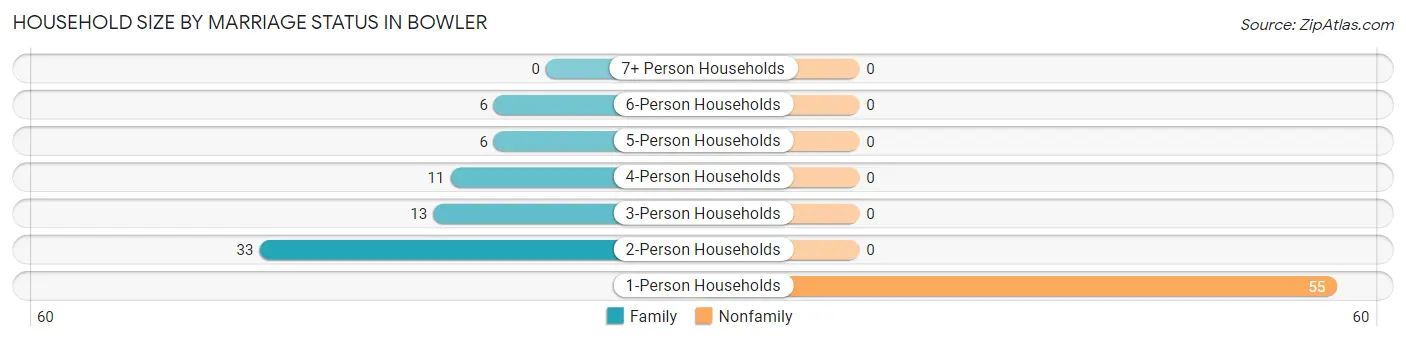
| Household Size | Family Households | Nonfamily Households |
| 1-Person Households | - | 55 (44.4%) |
| 2-Person Households | 33 (26.6%) | 0 (0.0%) |
| 3-Person Households | 13 (10.5%) | 0 (0.0%) |
| 4-Person Households | 11 (8.9%) | 0 (0.0%) |
| 5-Person Households | 6 (4.8%) | 0 (0.0%) |
| 6-Person Households | 6 (4.8%) | 0 (0.0%) |
| 7+ Person Households | 0 (0.0%) | 0 (0.0%) |
| Total | 69 (55.6%) | 55 (44.4%) |
Female Fertility in Bowler
Fertility by Age in Bowler
| Age Bracket | Women with Births | Births / 1,000 Women |
| 15 to 19 years | 0 (0.0%) | 0.0 |
| 20 to 34 years | 0 (0.0%) | 0.0 |
| 35 to 50 years | 0 (0.0%) | 0.0 |
| Total | 0 (0.0%) | 0.0 |
Fertility by Age by Marriage Status in Bowler
| Age Bracket | Married | Unmarried |
| 15 to 19 years | 0 (0.0%) | 0 (0.0%) |
| 20 to 34 years | 0 (0.0%) | 0 (0.0%) |
| 35 to 50 years | 0 (0.0%) | 0 (0.0%) |
| Total | 0 (0.0%) | 0 (0.0%) |
Fertility by Education in Bowler
| Educational Attainment | Women with Births | Births / 1,000 Women |
| Less than High School | 0 (0.0%) | 0.0 |
| High School Diploma | 0 (0.0%) | 0.0 |
| College or Associate's Degree | 0 (0.0%) | 0.0 |
| Bachelor's Degree | 0 (0.0%) | 0.0 |
| Graduate Degree | 0 (0.0%) | 0.0 |
| Total | 0 (0.0%) | 0.0 |
Fertility by Education by Marriage Status in Bowler
| Educational Attainment | Married | Unmarried |
| Less than High School | 0 (0.0%) | 0 (0.0%) |
| High School Diploma | 0 (0.0%) | 0 (0.0%) |
| College or Associate's Degree | 0 (0.0%) | 0 (0.0%) |
| Bachelor's Degree | 0 (0.0%) | 0 (0.0%) |
| Graduate Degree | 0 (0.0%) | 0 (0.0%) |
| Total | 0 (0.0%) | 0 (0.0%) |
Employment Characteristics in Bowler
Employment by Class of Employer in Bowler
Among the 127 employed individuals in Bowler, private company employees (78 | 61.4%), local government employees (21 | 16.5%), and self-employed (not incorporated) (9 | 7.1%) make up the most common classes of employment.
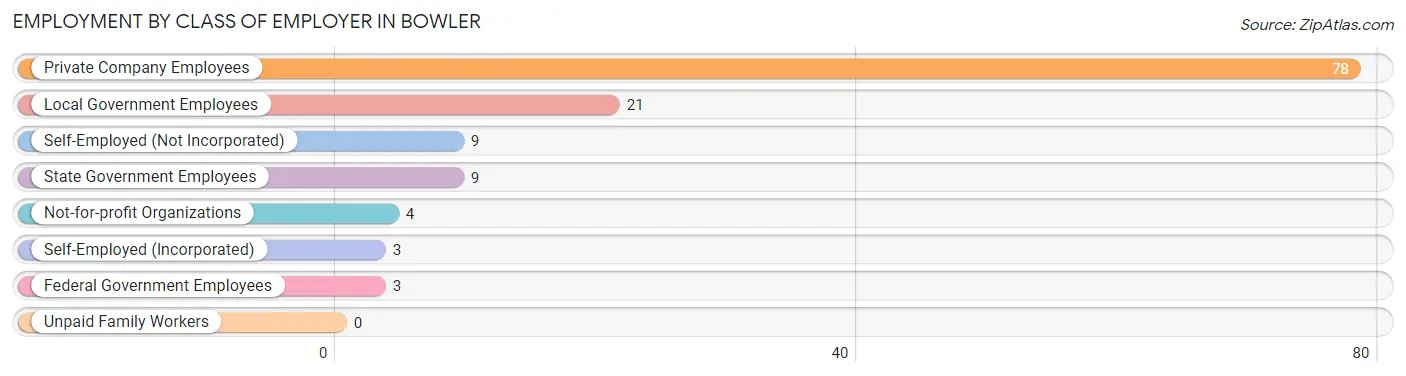
| Employer Class | # Employees | % Employees |
| Private Company Employees | 78 | 61.4% |
| Self-Employed (Incorporated) | 3 | 2.4% |
| Self-Employed (Not Incorporated) | 9 | 7.1% |
| Not-for-profit Organizations | 4 | 3.2% |
| Local Government Employees | 21 | 16.5% |
| State Government Employees | 9 | 7.1% |
| Federal Government Employees | 3 | 2.4% |
| Unpaid Family Workers | 0 | 0.0% |
| Total | 127 | 100.0% |
Employment Status by Age in Bowler
According to the labor force statistics for Bowler, out of the total population over 16 years of age (213), 60.1% or 128 individuals are in the labor force, with 0.8% or 1 of them unemployed. The age group with the highest labor force participation rate is 25 to 29 years, with 100.0% or 14 individuals in the labor force. Within the labor force, the 16 to 19 years age range has the highest percentage of unemployed individuals, with 25.0% or 1 of them being unemployed.
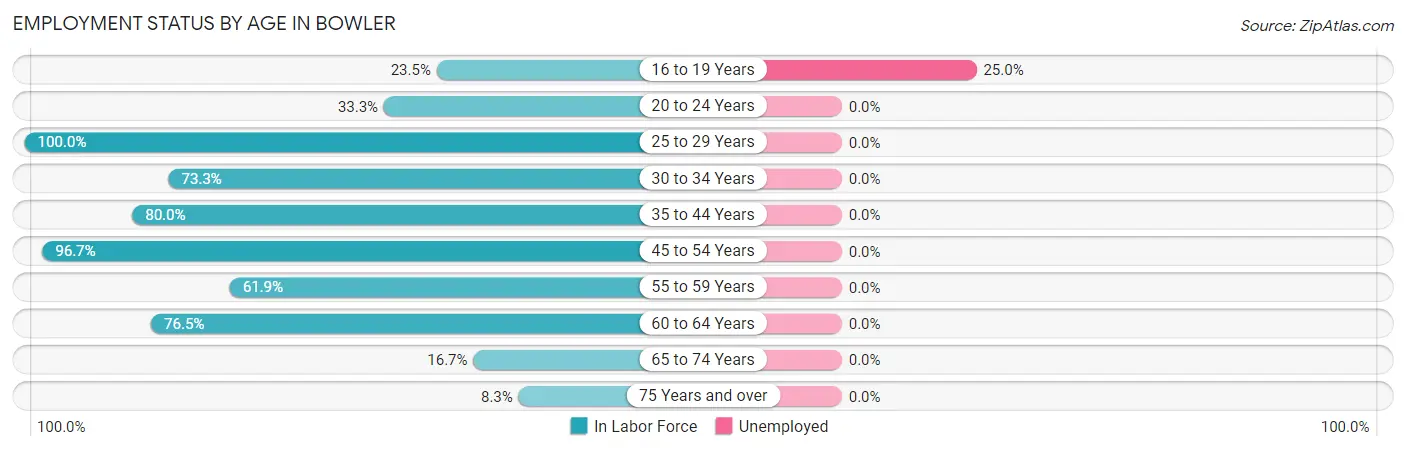
| Age Bracket | In Labor Force | Unemployed |
| 16 to 19 Years | 4 (23.5%) | 1 (25.0%) |
| 20 to 24 Years | 2 (33.3%) | 0 (0.0%) |
| 25 to 29 Years | 14 (100.0%) | 0 (0.0%) |
| 30 to 34 Years | 22 (73.3%) | 0 (0.0%) |
| 35 to 44 Years | 24 (80.0%) | 0 (0.0%) |
| 45 to 54 Years | 29 (96.7%) | 0 (0.0%) |
| 55 to 59 Years | 13 (61.9%) | 0 (0.0%) |
| 60 to 64 Years | 13 (76.5%) | 0 (0.0%) |
| 65 to 74 Years | 6 (16.7%) | 0 (0.0%) |
| 75 Years and over | 1 (8.3%) | 0 (0.0%) |
| Total | 128 (60.1%) | 1 (0.8%) |
Employment Status by Educational Attainment in Bowler
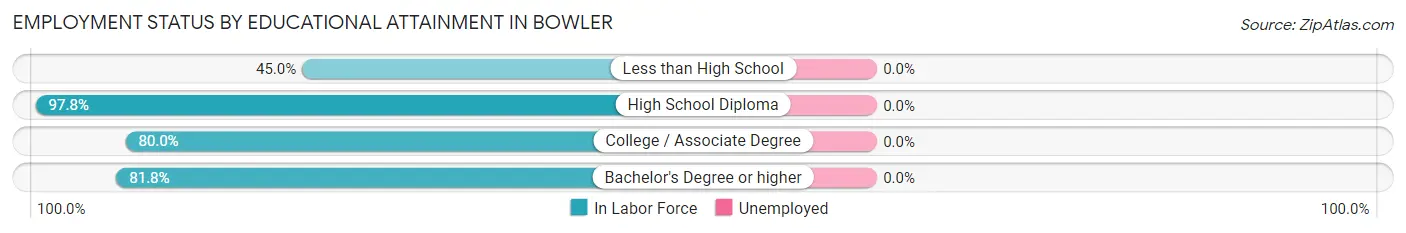
| Educational Attainment | In Labor Force | Unemployed |
| Less than High School | 9 (45.0%) | 0 (0.0%) |
| High School Diploma | 44 (97.8%) | 0 (0.0%) |
| College / Associate Degree | 44 (80.0%) | 0 (0.0%) |
| Bachelor's Degree or higher | 18 (81.8%) | 0 (0.0%) |
| Total | 115 (81.0%) | 0 (0.0%) |
Employment Occupations by Sex in Bowler
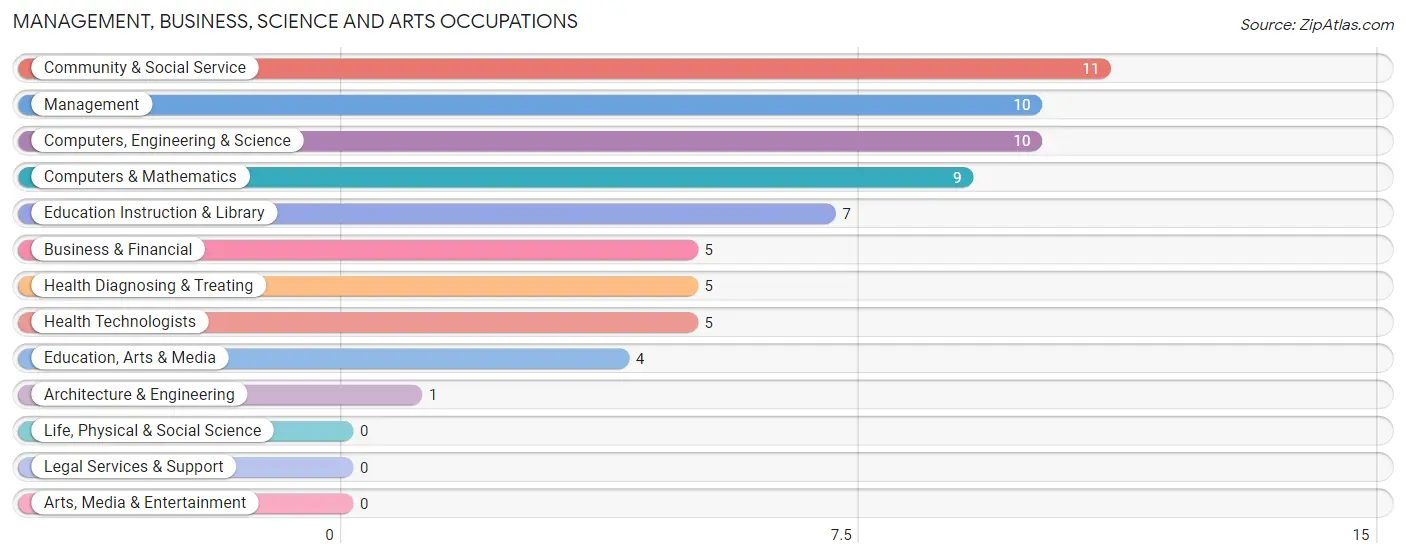
Management, Business, Science and Arts Occupations
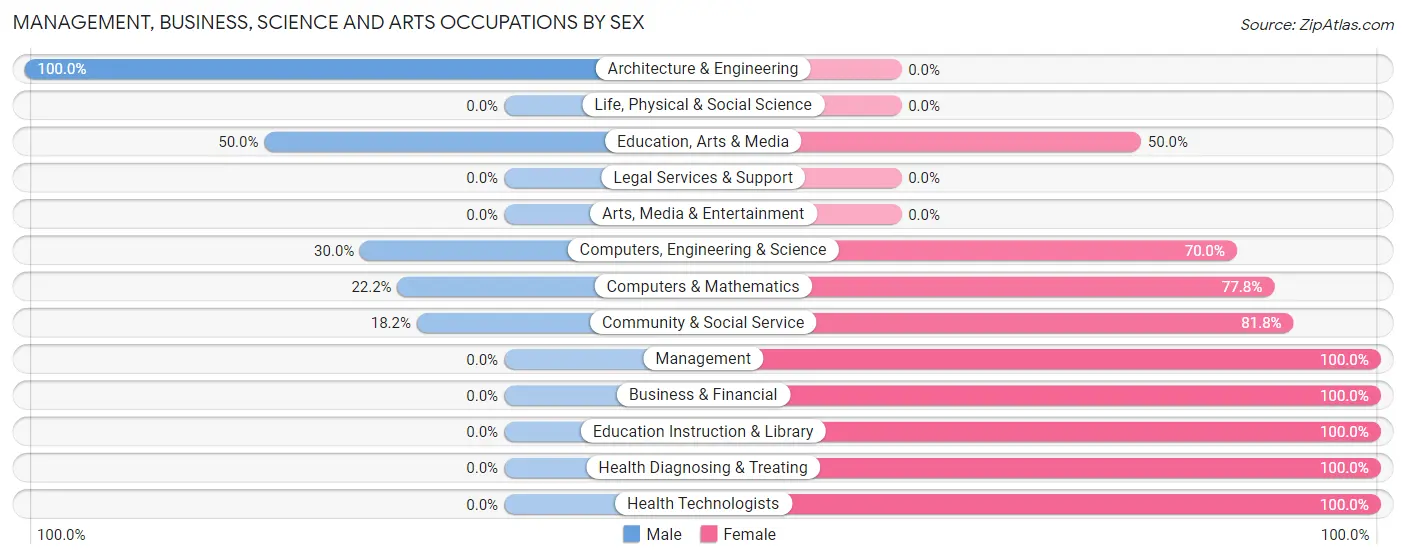
The most common Management, Business, Science and Arts occupations in Bowler are Community & Social Service (11 | 8.7%), Management (10 | 7.9%), Computers, Engineering & Science (10 | 7.9%), Computers & Mathematics (9 | 7.1%), and Education Instruction & Library (7 | 5.5%).
Management, Business, Science and Arts Occupations by Sex
Within the Management, Business, Science and Arts occupations in Bowler, the most male-oriented occupations are Architecture & Engineering (100.0%), Education, Arts & Media (50.0%), and Computers, Engineering & Science (30.0%), while the most female-oriented occupations are Management (100.0%), Business & Financial (100.0%), and Education Instruction & Library (100.0%).
| Occupation | Male | Female |
| Management | 0 (0.0%) | 10 (100.0%) |
| Business & Financial | 0 (0.0%) | 5 (100.0%) |
| Computers, Engineering & Science | 3 (30.0%) | 7 (70.0%) |
| Computers & Mathematics | 2 (22.2%) | 7 (77.8%) |
| Architecture & Engineering | 1 (100.0%) | 0 (0.0%) |
| Life, Physical & Social Science | 0 (0.0%) | 0 (0.0%) |
| Community & Social Service | 2 (18.2%) | 9 (81.8%) |
| Education, Arts & Media | 2 (50.0%) | 2 (50.0%) |
| Legal Services & Support | 0 (0.0%) | 0 (0.0%) |
| Education Instruction & Library | 0 (0.0%) | 7 (100.0%) |
| Arts, Media & Entertainment | 0 (0.0%) | 0 (0.0%) |
| Health Diagnosing & Treating | 0 (0.0%) | 5 (100.0%) |
| Health Technologists | 0 (0.0%) | 5 (100.0%) |
| Total (Category) | 5 (12.2%) | 36 (87.8%) |
| Total (Overall) | 63 (49.6%) | 64 (50.4%) |
Services Occupations
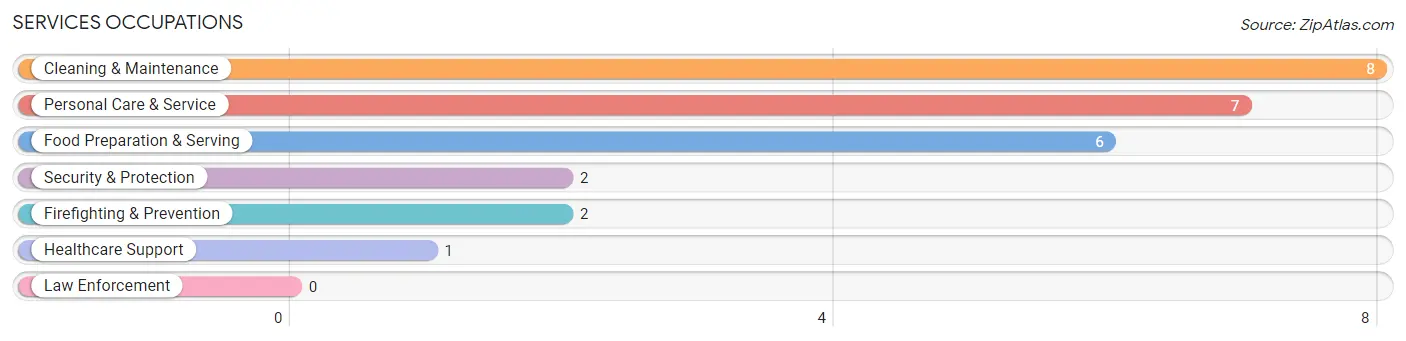
The most common Services occupations in Bowler are Cleaning & Maintenance (8 | 6.3%), Personal Care & Service (7 | 5.5%), Food Preparation & Serving (6 | 4.7%), Security & Protection (2 | 1.6%), and Firefighting & Prevention (2 | 1.6%).
Services Occupations by Sex
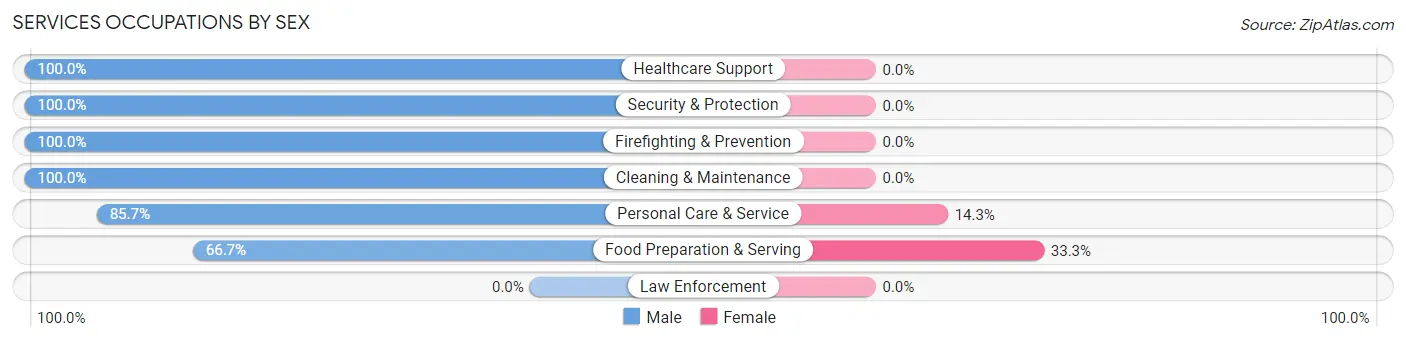
Within the Services occupations in Bowler, the most male-oriented occupations are Healthcare Support (100.0%), Security & Protection (100.0%), and Firefighting & Prevention (100.0%), while the most female-oriented occupations are Food Preparation & Serving (33.3%), and Personal Care & Service (14.3%).
| Occupation | Male | Female |
| Healthcare Support | 1 (100.0%) | 0 (0.0%) |
| Security & Protection | 2 (100.0%) | 0 (0.0%) |
| Firefighting & Prevention | 2 (100.0%) | 0 (0.0%) |
| Law Enforcement | 0 (0.0%) | 0 (0.0%) |
| Food Preparation & Serving | 4 (66.7%) | 2 (33.3%) |
| Cleaning & Maintenance | 8 (100.0%) | 0 (0.0%) |
| Personal Care & Service | 6 (85.7%) | 1 (14.3%) |
| Total (Category) | 21 (87.5%) | 3 (12.5%) |
| Total (Overall) | 63 (49.6%) | 64 (50.4%) |
Sales and Office Occupations
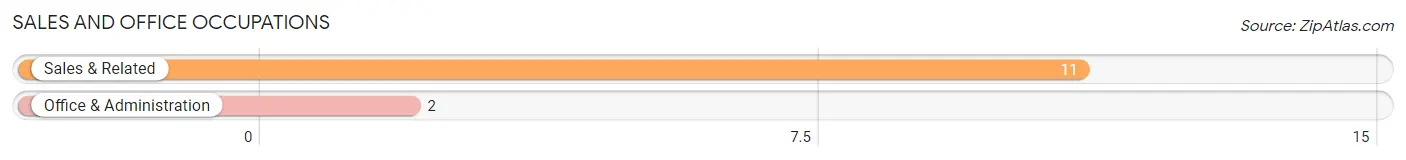
The most common Sales and Office occupations in Bowler are Sales & Related (11 | 8.7%), and Office & Administration (2 | 1.6%).
Sales and Office Occupations by Sex
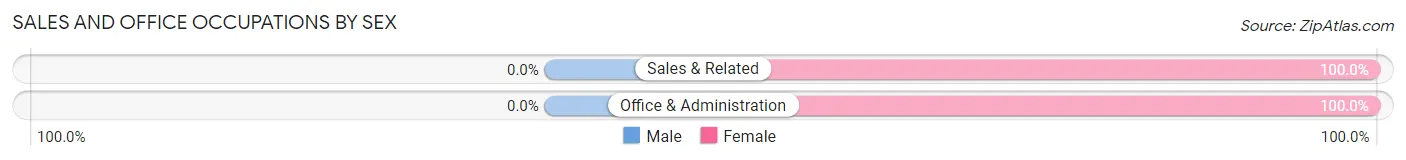
| Occupation | Male | Female |
| Sales & Related | 0 (0.0%) | 11 (100.0%) |
| Office & Administration | 0 (0.0%) | 2 (100.0%) |
| Total (Category) | 0 (0.0%) | 13 (100.0%) |
| Total (Overall) | 63 (49.6%) | 64 (50.4%) |
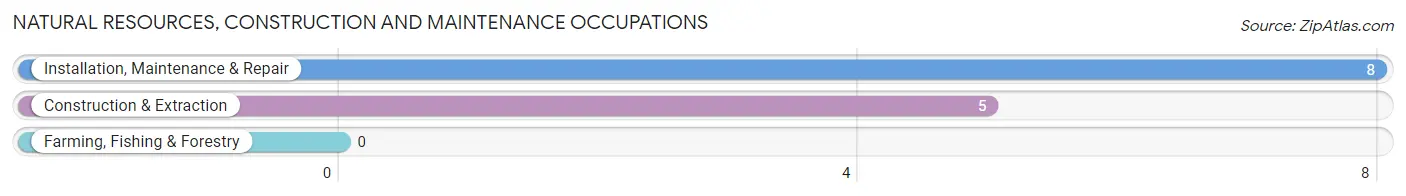
Natural Resources, Construction and Maintenance Occupations
The most common Natural Resources, Construction and Maintenance occupations in Bowler are Installation, Maintenance & Repair (8 | 6.3%), and Construction & Extraction (5 | 3.9%).
Natural Resources, Construction and Maintenance Occupations by Sex
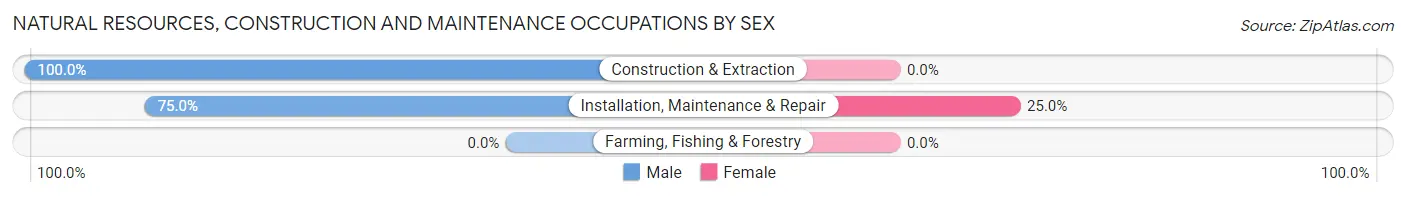
| Occupation | Male | Female |
| Farming, Fishing & Forestry | 0 (0.0%) | 0 (0.0%) |
| Construction & Extraction | 5 (100.0%) | 0 (0.0%) |
| Installation, Maintenance & Repair | 6 (75.0%) | 2 (25.0%) |
| Total (Category) | 11 (84.6%) | 2 (15.4%) |
| Total (Overall) | 63 (49.6%) | 64 (50.4%) |
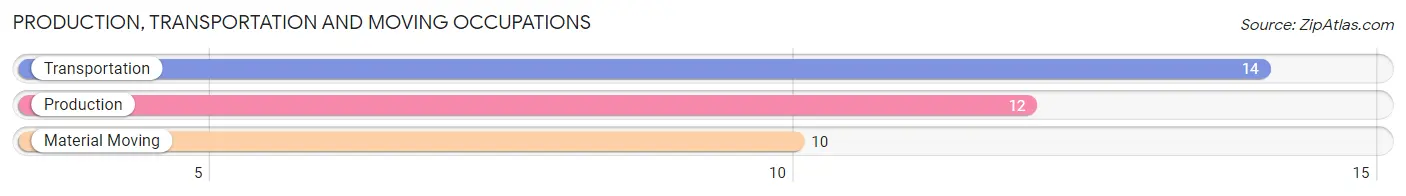
Production, Transportation and Moving Occupations
The most common Production, Transportation and Moving occupations in Bowler are Transportation (14 | 11.0%), Production (12 | 9.5%), and Material Moving (10 | 7.9%).
Production, Transportation and Moving Occupations by Sex
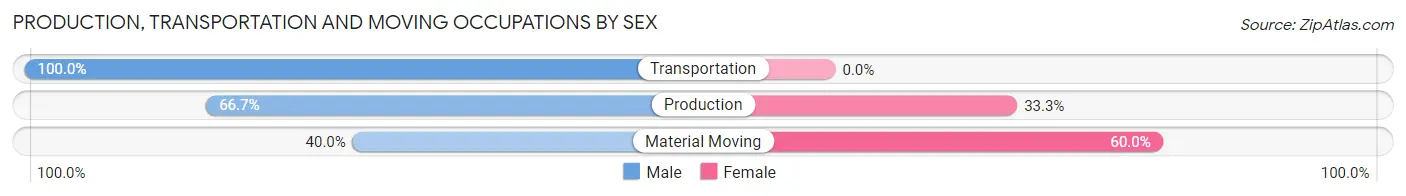
| Occupation | Male | Female |
| Production | 8 (66.7%) | 4 (33.3%) |
| Transportation | 14 (100.0%) | 0 (0.0%) |
| Material Moving | 4 (40.0%) | 6 (60.0%) |
| Total (Category) | 26 (72.2%) | 10 (27.8%) |
| Total (Overall) | 63 (49.6%) | 64 (50.4%) |
Employment Industries by Sex in Bowler
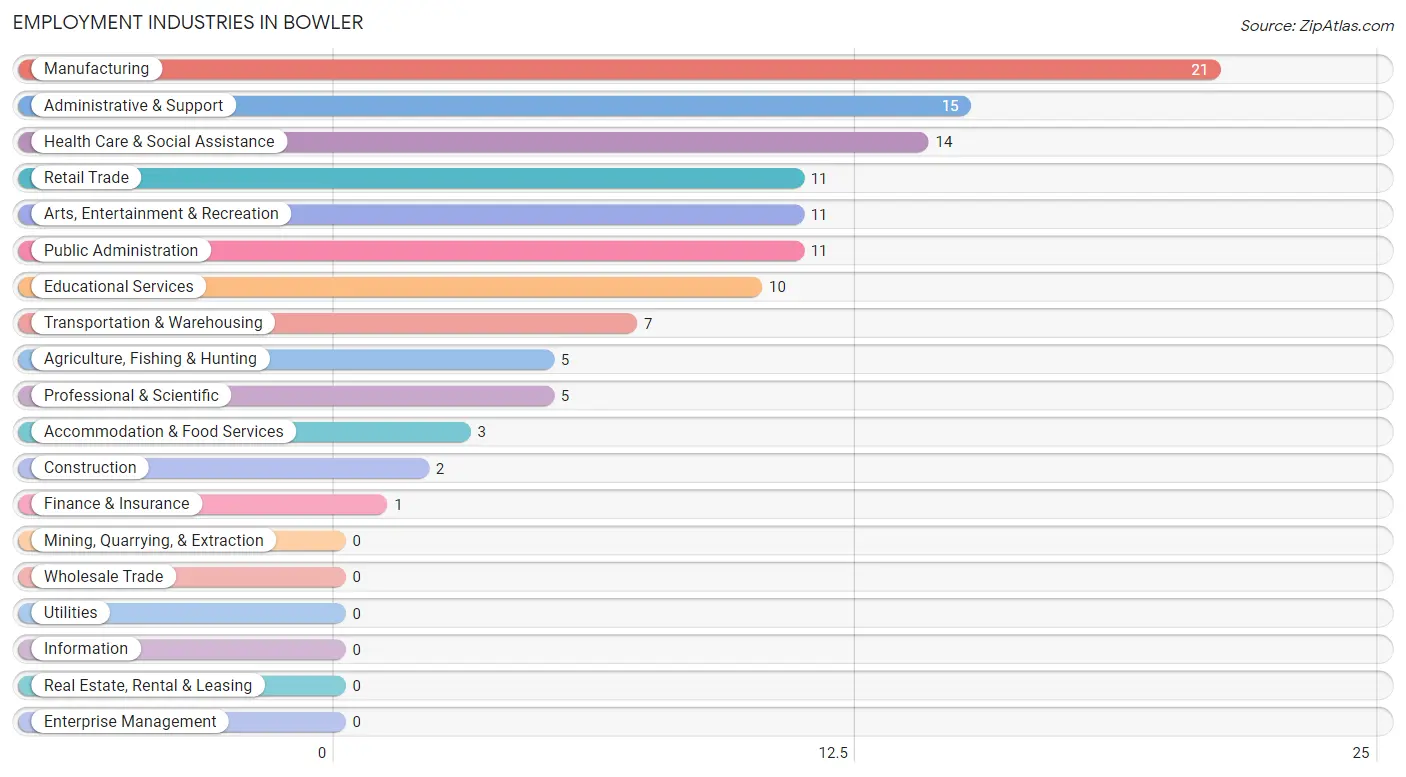
Employment Industries in Bowler
The major employment industries in Bowler include Manufacturing (21 | 16.5%), Administrative & Support (15 | 11.8%), Health Care & Social Assistance (14 | 11.0%), Retail Trade (11 | 8.7%), and Arts, Entertainment & Recreation (11 | 8.7%).
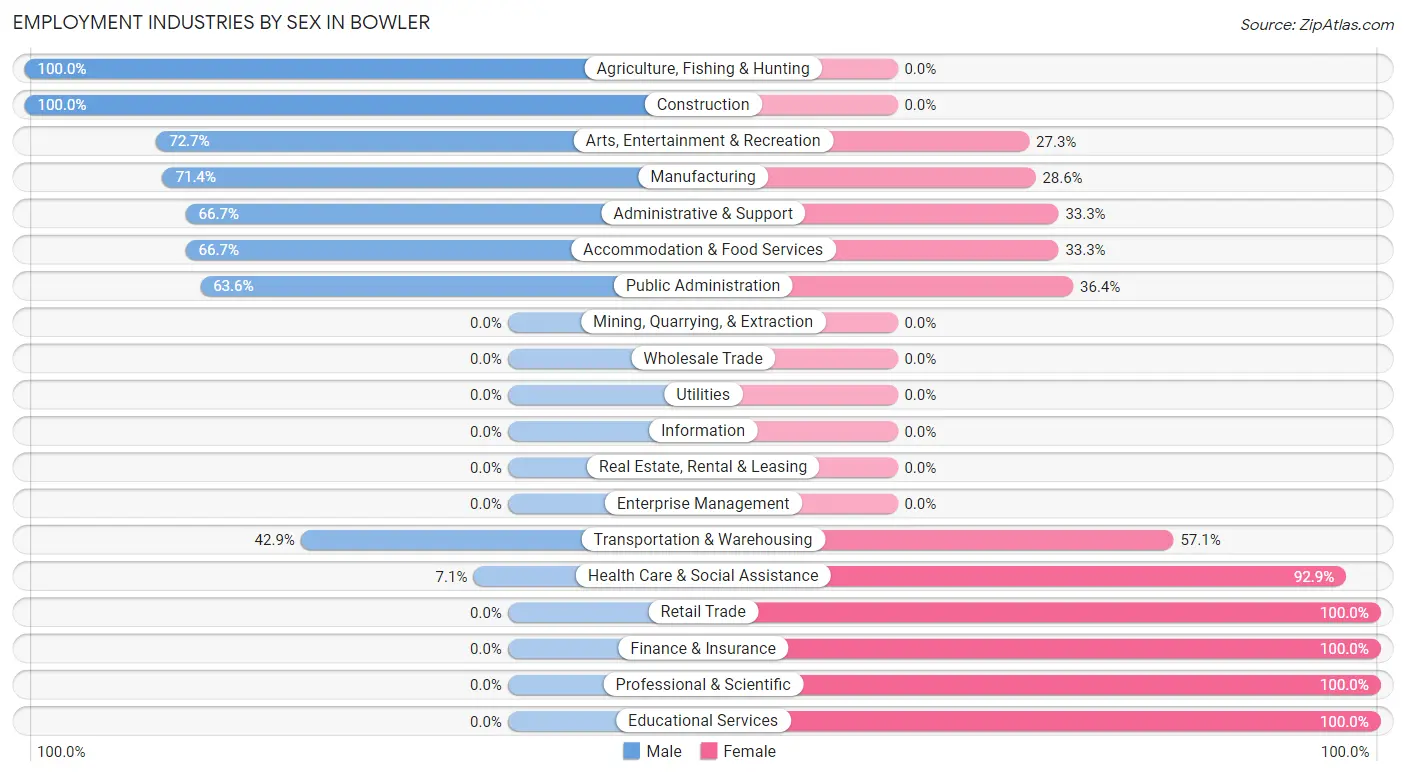
Employment Industries by Sex in Bowler
The Bowler industries that see more men than women are Agriculture, Fishing & Hunting (100.0%), Construction (100.0%), and Arts, Entertainment & Recreation (72.7%), whereas the industries that tend to have a higher number of women are Retail Trade (100.0%), Finance & Insurance (100.0%), and Professional & Scientific (100.0%).
| Industry | Male | Female |
| Agriculture, Fishing & Hunting | 5 (100.0%) | 0 (0.0%) |
| Mining, Quarrying, & Extraction | 0 (0.0%) | 0 (0.0%) |
| Construction | 2 (100.0%) | 0 (0.0%) |
| Manufacturing | 15 (71.4%) | 6 (28.6%) |
| Wholesale Trade | 0 (0.0%) | 0 (0.0%) |
| Retail Trade | 0 (0.0%) | 11 (100.0%) |
| Transportation & Warehousing | 3 (42.9%) | 4 (57.1%) |
| Utilities | 0 (0.0%) | 0 (0.0%) |
| Information | 0 (0.0%) | 0 (0.0%) |
| Finance & Insurance | 0 (0.0%) | 1 (100.0%) |
| Real Estate, Rental & Leasing | 0 (0.0%) | 0 (0.0%) |
| Professional & Scientific | 0 (0.0%) | 5 (100.0%) |
| Enterprise Management | 0 (0.0%) | 0 (0.0%) |
| Administrative & Support | 10 (66.7%) | 5 (33.3%) |
| Educational Services | 0 (0.0%) | 10 (100.0%) |
| Health Care & Social Assistance | 1 (7.1%) | 13 (92.9%) |
| Arts, Entertainment & Recreation | 8 (72.7%) | 3 (27.3%) |
| Accommodation & Food Services | 2 (66.7%) | 1 (33.3%) |
| Public Administration | 7 (63.6%) | 4 (36.4%) |
| Total | 63 (49.6%) | 64 (50.4%) |
Education in Bowler
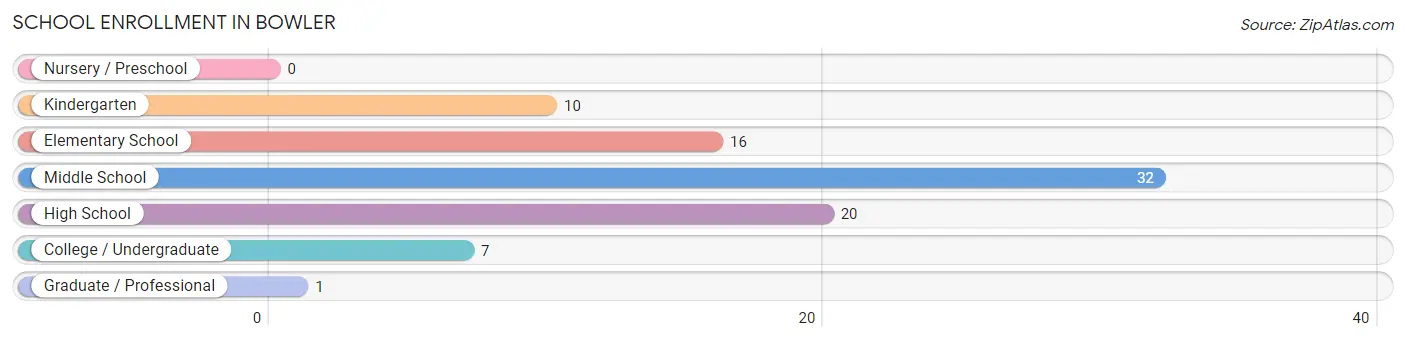
School Enrollment in Bowler
The most common levels of schooling among the 86 students in Bowler are middle school (32 | 37.2%), high school (20 | 23.3%), and elementary school (16 | 18.6%).
| School Level | # Students | % Students |
| Nursery / Preschool | 0 | 0.0% |
| Kindergarten | 10 | 11.6% |
| Elementary School | 16 | 18.6% |
| Middle School | 32 | 37.2% |
| High School | 20 | 23.3% |
| College / Undergraduate | 7 | 8.1% |
| Graduate / Professional | 1 | 1.2% |
| Total | 86 | 100.0% |
School Enrollment by Age by Funding Source in Bowler
Out of a total of 86 students who are enrolled in schools in Bowler, 7 (8.1%) attend a private institution, while the remaining 79 (91.9%) are enrolled in public schools. The age group of 15 to 17 year olds has the highest likelihood of being enrolled in private schools, with 3 (17.6% in the age bracket) enrolled. Conversely, the age group of 10 to 14 year olds has the lowest likelihood of being enrolled in a private school, with 32 (100.0% in the age bracket) attending a public institution.
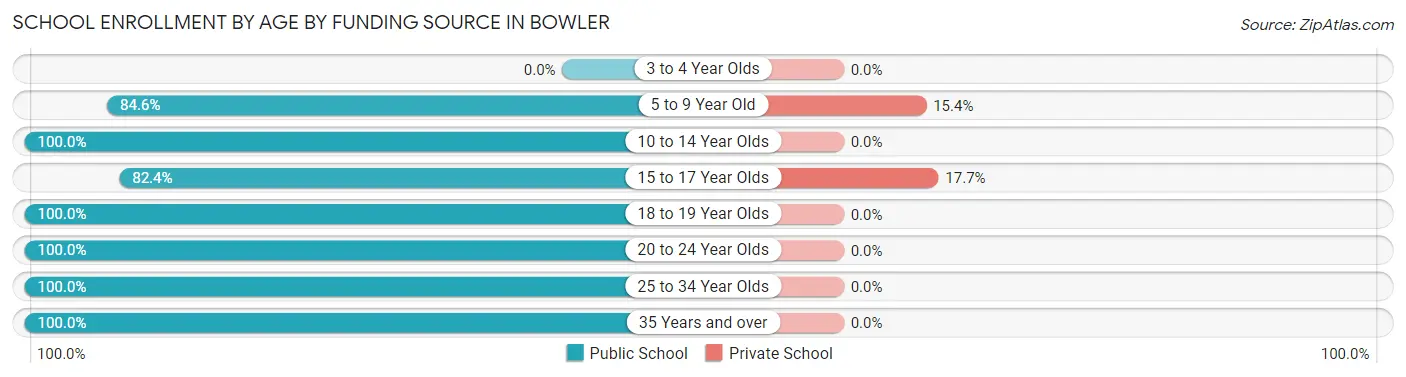
| Age Bracket | Public School | Private School |
| 3 to 4 Year Olds | 0 (0.0%) | 0 (0.0%) |
| 5 to 9 Year Old | 22 (84.6%) | 4 (15.4%) |
| 10 to 14 Year Olds | 32 (100.0%) | 0 (0.0%) |
| 15 to 17 Year Olds | 14 (82.4%) | 3 (17.6%) |
| 18 to 19 Year Olds | 3 (100.0%) | 0 (0.0%) |
| 20 to 24 Year Olds | 3 (100.0%) | 0 (0.0%) |
| 25 to 34 Year Olds | 1 (100.0%) | 0 (0.0%) |
| 35 Years and over | 4 (100.0%) | 0 (0.0%) |
| Total | 79 (91.9%) | 7 (8.1%) |
Educational Attainment by Field of Study in Bowler
Business (11 | 39.3%), education (11 | 39.3%), science & technology (3 | 10.7%), physical & health sciences (1 | 3.6%), and psychology (1 | 3.6%) are the most common fields of study among 28 individuals in Bowler who have obtained a bachelor's degree or higher.
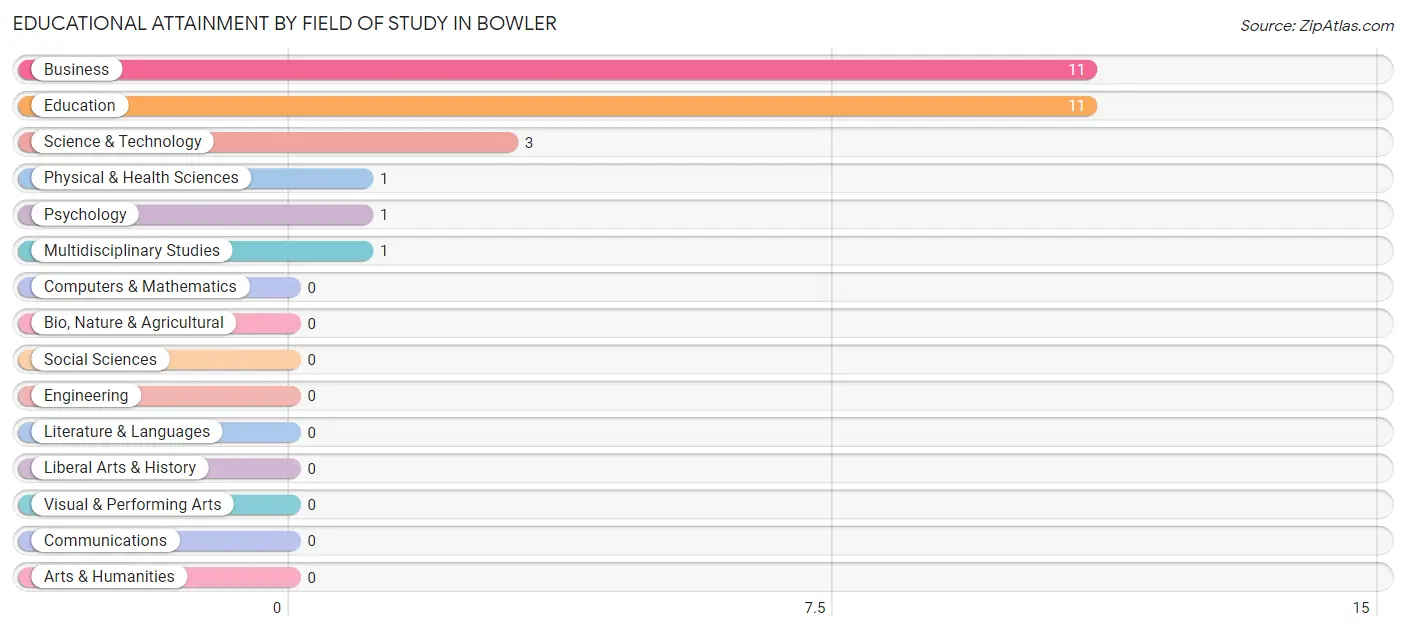
| Field of Study | # Graduates | % Graduates |
| Computers & Mathematics | 0 | 0.0% |
| Bio, Nature & Agricultural | 0 | 0.0% |
| Physical & Health Sciences | 1 | 3.6% |
| Psychology | 1 | 3.6% |
| Social Sciences | 0 | 0.0% |
| Engineering | 0 | 0.0% |
| Multidisciplinary Studies | 1 | 3.6% |
| Science & Technology | 3 | 10.7% |
| Business | 11 | 39.3% |
| Education | 11 | 39.3% |
| Literature & Languages | 0 | 0.0% |
| Liberal Arts & History | 0 | 0.0% |
| Visual & Performing Arts | 0 | 0.0% |
| Communications | 0 | 0.0% |
| Arts & Humanities | 0 | 0.0% |
| Total | 28 | 100.0% |
Transportation & Commute in Bowler
Vehicle Availability by Sex in Bowler
The most prevalent vehicle ownership categories in Bowler are males with 2 vehicles (21, accounting for 33.3%) and females with 2 vehicles (13, making up 32.8%).
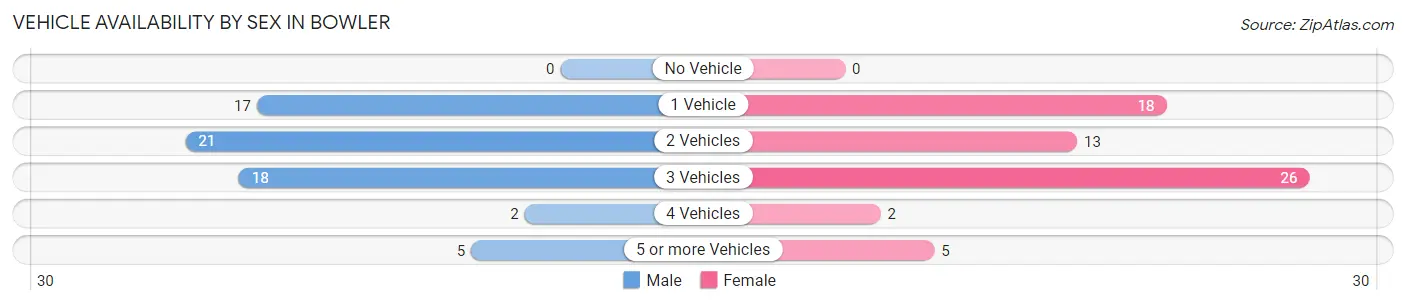
| Vehicles Available | Male | Female |
| No Vehicle | 0 (0.0%) | 0 (0.0%) |
| 1 Vehicle | 17 (27.0%) | 18 (28.1%) |
| 2 Vehicles | 21 (33.3%) | 13 (20.3%) |
| 3 Vehicles | 18 (28.6%) | 26 (40.6%) |
| 4 Vehicles | 2 (3.2%) | 2 (3.1%) |
| 5 or more Vehicles | 5 (7.9%) | 5 (7.8%) |
| Total | 63 (100.0%) | 64 (100.0%) |
Commute Time in Bowler
The most frequently occuring commute durations in Bowler are 5 to 9 minutes (23 commuters, 20.2%), 60 to 89 minutes (14 commuters, 12.3%), and 20 to 24 minutes (13 commuters, 11.4%).
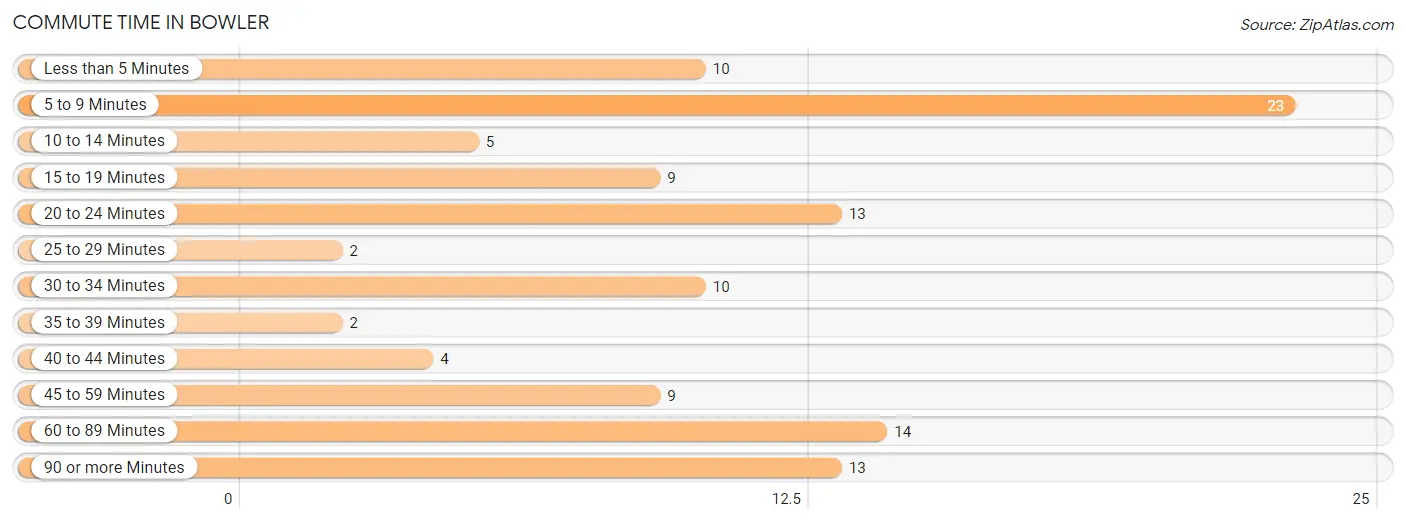
| Commute Time | # Commuters | % Commuters |
| Less than 5 Minutes | 10 | 8.8% |
| 5 to 9 Minutes | 23 | 20.2% |
| 10 to 14 Minutes | 5 | 4.4% |
| 15 to 19 Minutes | 9 | 7.9% |
| 20 to 24 Minutes | 13 | 11.4% |
| 25 to 29 Minutes | 2 | 1.8% |
| 30 to 34 Minutes | 10 | 8.8% |
| 35 to 39 Minutes | 2 | 1.8% |
| 40 to 44 Minutes | 4 | 3.5% |
| 45 to 59 Minutes | 9 | 7.9% |
| 60 to 89 Minutes | 14 | 12.3% |
| 90 or more Minutes | 13 | 11.4% |
Commute Time by Sex in Bowler
The most common commute times in Bowler are 5 to 9 minutes (12 commuters, 21.8%) for males and 5 to 9 minutes (11 commuters, 18.6%) for females.
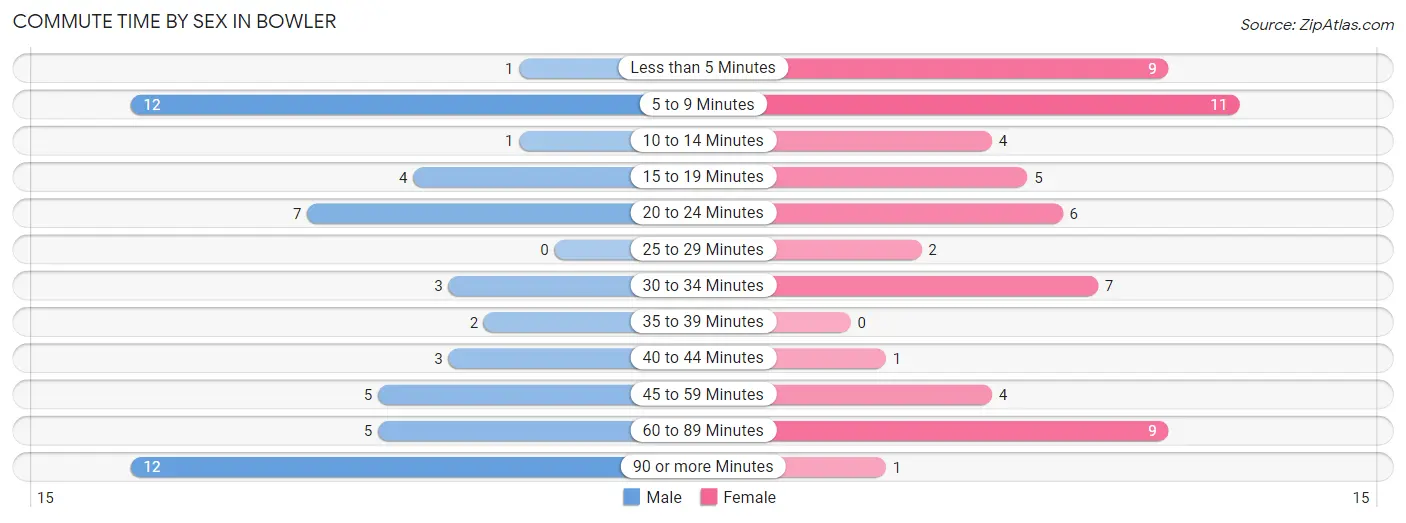
| Commute Time | Male | Female |
| Less than 5 Minutes | 1 (1.8%) | 9 (15.2%) |
| 5 to 9 Minutes | 12 (21.8%) | 11 (18.6%) |
| 10 to 14 Minutes | 1 (1.8%) | 4 (6.8%) |
| 15 to 19 Minutes | 4 (7.3%) | 5 (8.5%) |
| 20 to 24 Minutes | 7 (12.7%) | 6 (10.2%) |
| 25 to 29 Minutes | 0 (0.0%) | 2 (3.4%) |
| 30 to 34 Minutes | 3 (5.4%) | 7 (11.9%) |
| 35 to 39 Minutes | 2 (3.6%) | 0 (0.0%) |
| 40 to 44 Minutes | 3 (5.4%) | 1 (1.7%) |
| 45 to 59 Minutes | 5 (9.1%) | 4 (6.8%) |
| 60 to 89 Minutes | 5 (9.1%) | 9 (15.2%) |
| 90 or more Minutes | 12 (21.8%) | 1 (1.7%) |
Time of Departure to Work by Sex in Bowler
The most frequent times of departure to work in Bowler are 4:00 PM to 11:59 PM (15, 27.3%) for males and 7:30 AM to 7:59 AM (16, 27.1%) for females.
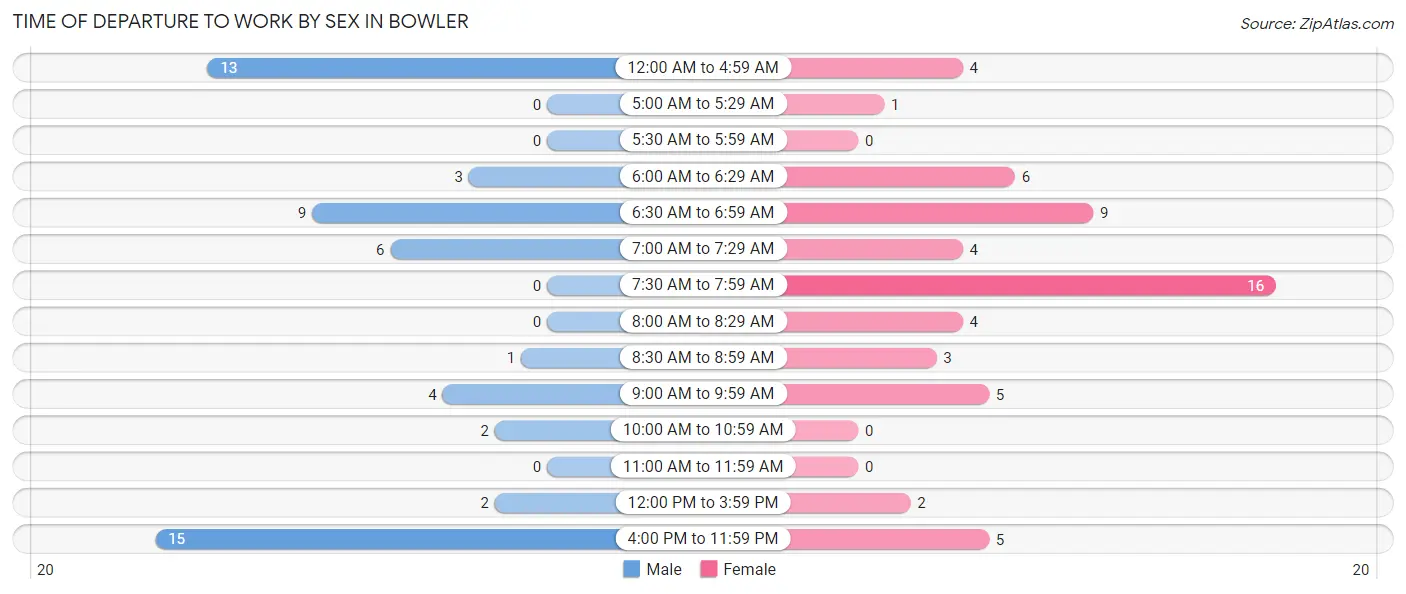
| Time of Departure | Male | Female |
| 12:00 AM to 4:59 AM | 13 (23.6%) | 4 (6.8%) |
| 5:00 AM to 5:29 AM | 0 (0.0%) | 1 (1.7%) |
| 5:30 AM to 5:59 AM | 0 (0.0%) | 0 (0.0%) |
| 6:00 AM to 6:29 AM | 3 (5.4%) | 6 (10.2%) |
| 6:30 AM to 6:59 AM | 9 (16.4%) | 9 (15.2%) |
| 7:00 AM to 7:29 AM | 6 (10.9%) | 4 (6.8%) |
| 7:30 AM to 7:59 AM | 0 (0.0%) | 16 (27.1%) |
| 8:00 AM to 8:29 AM | 0 (0.0%) | 4 (6.8%) |
| 8:30 AM to 8:59 AM | 1 (1.8%) | 3 (5.1%) |
| 9:00 AM to 9:59 AM | 4 (7.3%) | 5 (8.5%) |
| 10:00 AM to 10:59 AM | 2 (3.6%) | 0 (0.0%) |
| 11:00 AM to 11:59 AM | 0 (0.0%) | 0 (0.0%) |
| 12:00 PM to 3:59 PM | 2 (3.6%) | 2 (3.4%) |
| 4:00 PM to 11:59 PM | 15 (27.3%) | 5 (8.5%) |
| Total | 55 (100.0%) | 59 (100.0%) |
Housing Occupancy in Bowler
Occupancy by Ownership in Bowler
Of the total 124 dwellings in Bowler, owner-occupied units account for 95 (76.6%), while renter-occupied units make up 29 (23.4%).
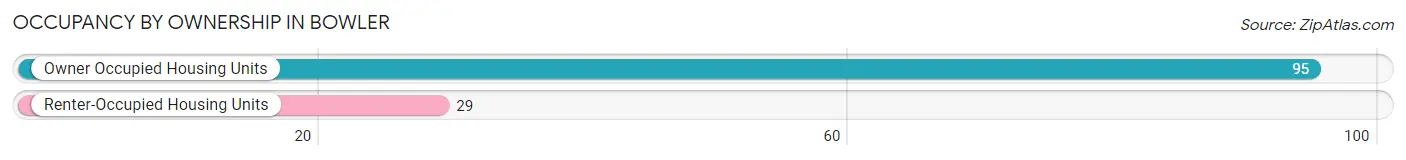
| Occupancy | # Housing Units | % Housing Units |
| Owner Occupied Housing Units | 95 | 76.6% |
| Renter-Occupied Housing Units | 29 | 23.4% |
| Total Occupied Housing Units | 124 | 100.0% |
Occupancy by Household Size in Bowler
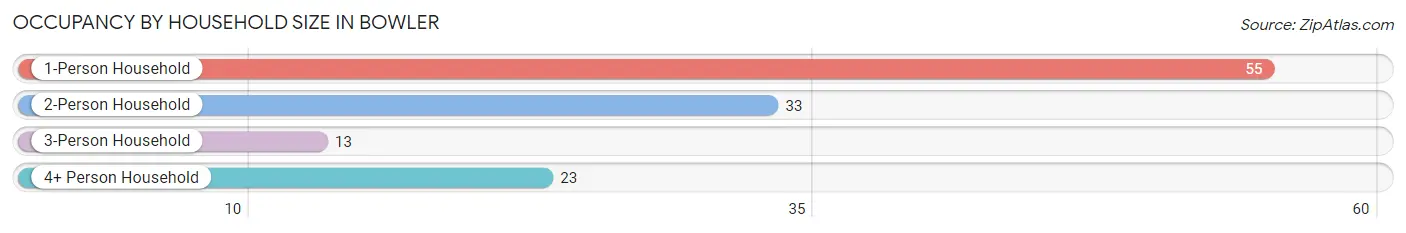
| Household Size | # Housing Units | % Housing Units |
| 1-Person Household | 55 | 44.4% |
| 2-Person Household | 33 | 26.6% |
| 3-Person Household | 13 | 10.5% |
| 4+ Person Household | 23 | 18.5% |
| Total Housing Units | 124 | 100.0% |
Occupancy by Ownership by Household Size in Bowler
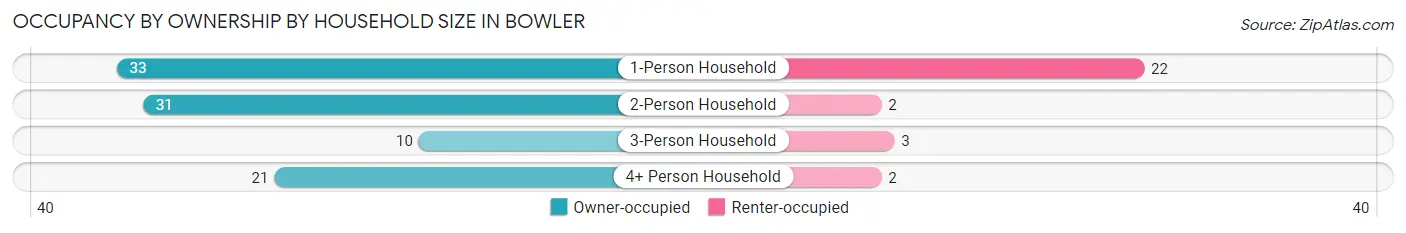
| Household Size | Owner-occupied | Renter-occupied |
| 1-Person Household | 33 (60.0%) | 22 (40.0%) |
| 2-Person Household | 31 (93.9%) | 2 (6.1%) |
| 3-Person Household | 10 (76.9%) | 3 (23.1%) |
| 4+ Person Household | 21 (91.3%) | 2 (8.7%) |
| Total Housing Units | 95 (76.6%) | 29 (23.4%) |
Occupancy by Educational Attainment in Bowler
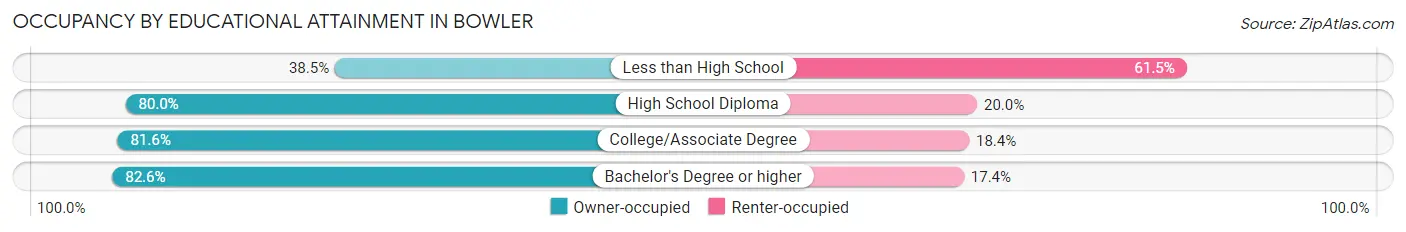
| Household Size | Owner-occupied | Renter-occupied |
| Less than High School | 5 (38.5%) | 8 (61.5%) |
| High School Diploma | 40 (80.0%) | 10 (20.0%) |
| College/Associate Degree | 31 (81.6%) | 7 (18.4%) |
| Bachelor's Degree or higher | 19 (82.6%) | 4 (17.4%) |
Occupancy by Age of Householder in Bowler
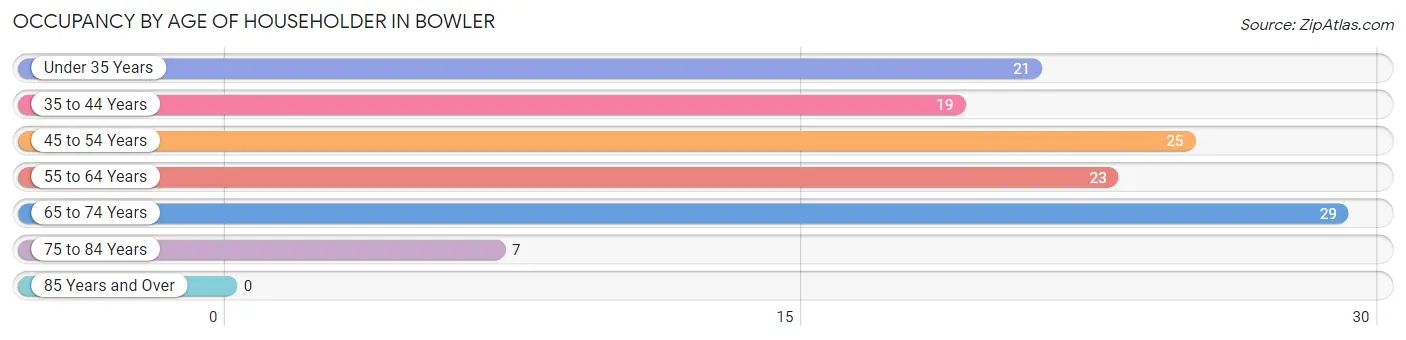
| Age Bracket | # Households | % Households |
| Under 35 Years | 21 | 16.9% |
| 35 to 44 Years | 19 | 15.3% |
| 45 to 54 Years | 25 | 20.2% |
| 55 to 64 Years | 23 | 18.5% |
| 65 to 74 Years | 29 | 23.4% |
| 75 to 84 Years | 7 | 5.7% |
| 85 Years and Over | 0 | 0.0% |
| Total | 124 | 100.0% |
Housing Finances in Bowler
Median Income by Occupancy in Bowler
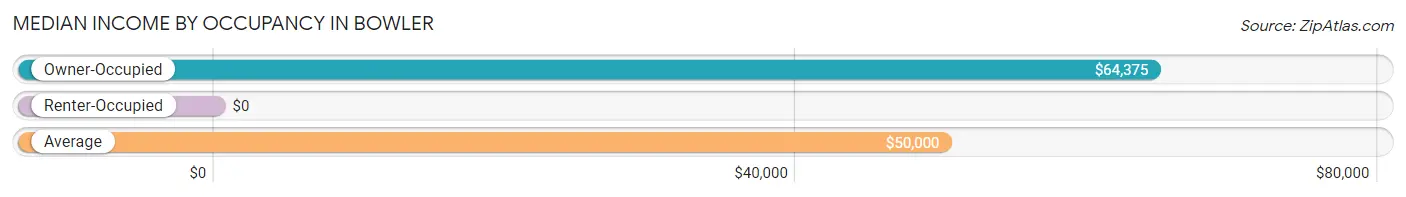
| Occupancy Type | # Households | Median Income |
| Owner-Occupied | 95 (76.6%) | $64,375 |
| Renter-Occupied | 29 (23.4%) | $0 |
| Average | 124 (100.0%) | $50,000 |
Occupancy by Householder Income Bracket in Bowler
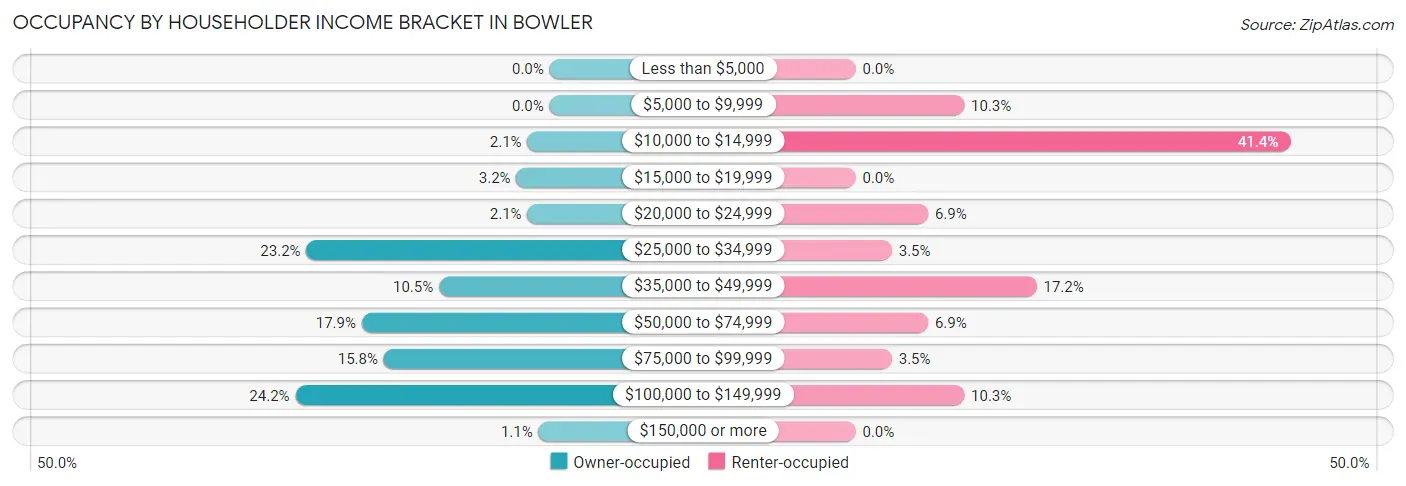
| Income Bracket | Owner-occupied | Renter-occupied |
| Less than $5,000 | 0 (0.0%) | 0 (0.0%) |
| $5,000 to $9,999 | 0 (0.0%) | 3 (10.3%) |
| $10,000 to $14,999 | 2 (2.1%) | 12 (41.4%) |
| $15,000 to $19,999 | 3 (3.2%) | 0 (0.0%) |
| $20,000 to $24,999 | 2 (2.1%) | 2 (6.9%) |
| $25,000 to $34,999 | 22 (23.2%) | 1 (3.5%) |
| $35,000 to $49,999 | 10 (10.5%) | 5 (17.2%) |
| $50,000 to $74,999 | 17 (17.9%) | 2 (6.9%) |
| $75,000 to $99,999 | 15 (15.8%) | 1 (3.5%) |
| $100,000 to $149,999 | 23 (24.2%) | 3 (10.3%) |
| $150,000 or more | 1 (1.1%) | 0 (0.0%) |
| Total | 95 (100.0%) | 29 (100.0%) |
Monthly Housing Cost Tiers in Bowler
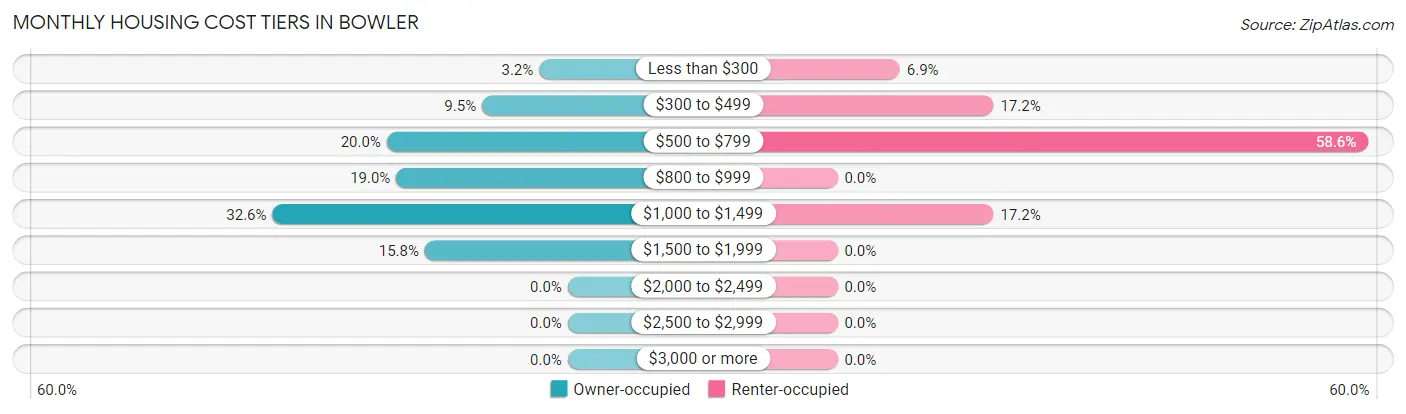
| Monthly Cost | Owner-occupied | Renter-occupied |
| Less than $300 | 3 (3.2%) | 2 (6.9%) |
| $300 to $499 | 9 (9.5%) | 5 (17.2%) |
| $500 to $799 | 19 (20.0%) | 17 (58.6%) |
| $800 to $999 | 18 (19.0%) | 0 (0.0%) |
| $1,000 to $1,499 | 31 (32.6%) | 5 (17.2%) |
| $1,500 to $1,999 | 15 (15.8%) | 0 (0.0%) |
| $2,000 to $2,499 | 0 (0.0%) | 0 (0.0%) |
| $2,500 to $2,999 | 0 (0.0%) | 0 (0.0%) |
| $3,000 or more | 0 (0.0%) | 0 (0.0%) |
| Total | 95 (100.0%) | 29 (100.0%) |
Physical Housing Characteristics in Bowler
Housing Structures in Bowler
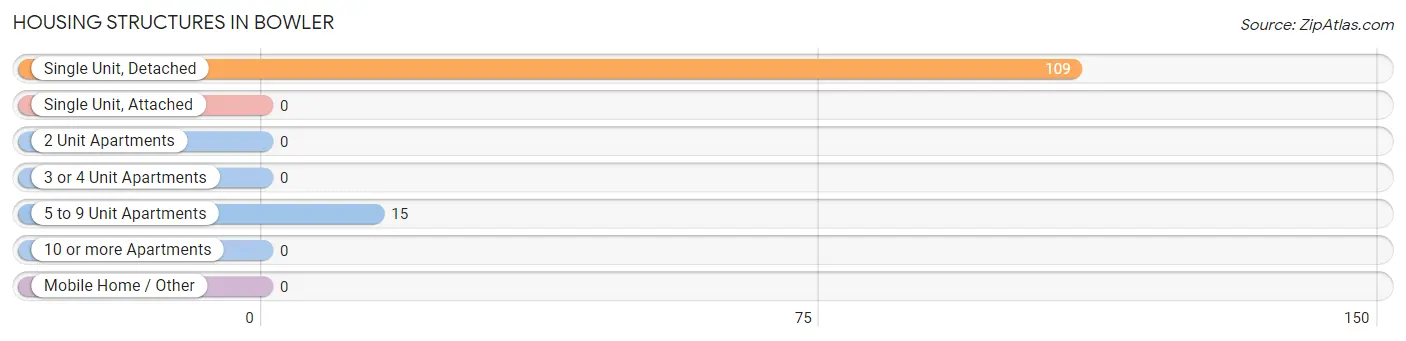
| Structure Type | # Housing Units | % Housing Units |
| Single Unit, Detached | 109 | 87.9% |
| Single Unit, Attached | 0 | 0.0% |
| 2 Unit Apartments | 0 | 0.0% |
| 3 or 4 Unit Apartments | 0 | 0.0% |
| 5 to 9 Unit Apartments | 15 | 12.1% |
| 10 or more Apartments | 0 | 0.0% |
| Mobile Home / Other | 0 | 0.0% |
| Total | 124 | 100.0% |
Housing Structures by Occupancy in Bowler
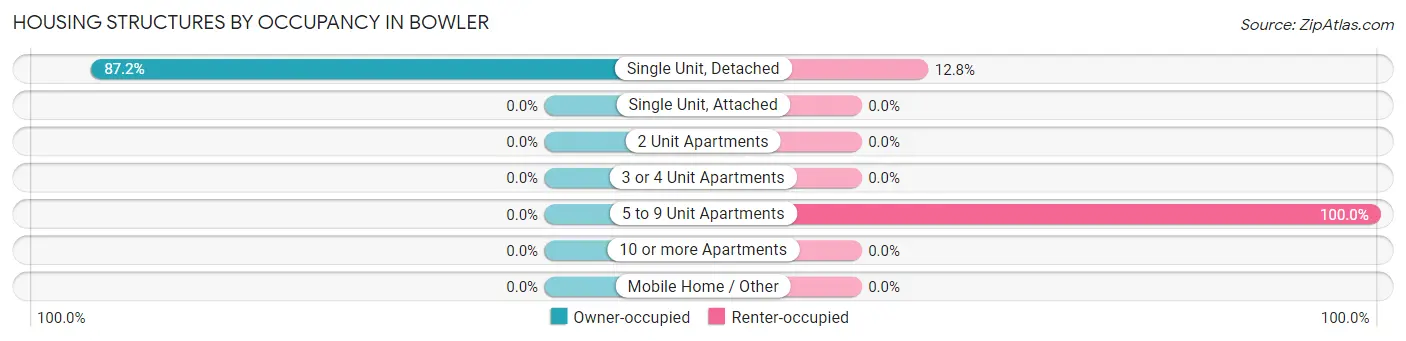
| Structure Type | Owner-occupied | Renter-occupied |
| Single Unit, Detached | 95 (87.2%) | 14 (12.8%) |
| Single Unit, Attached | 0 (0.0%) | 0 (0.0%) |
| 2 Unit Apartments | 0 (0.0%) | 0 (0.0%) |
| 3 or 4 Unit Apartments | 0 (0.0%) | 0 (0.0%) |
| 5 to 9 Unit Apartments | 0 (0.0%) | 15 (100.0%) |
| 10 or more Apartments | 0 (0.0%) | 0 (0.0%) |
| Mobile Home / Other | 0 (0.0%) | 0 (0.0%) |
| Total | 95 (76.6%) | 29 (23.4%) |
Housing Structures by Number of Rooms in Bowler
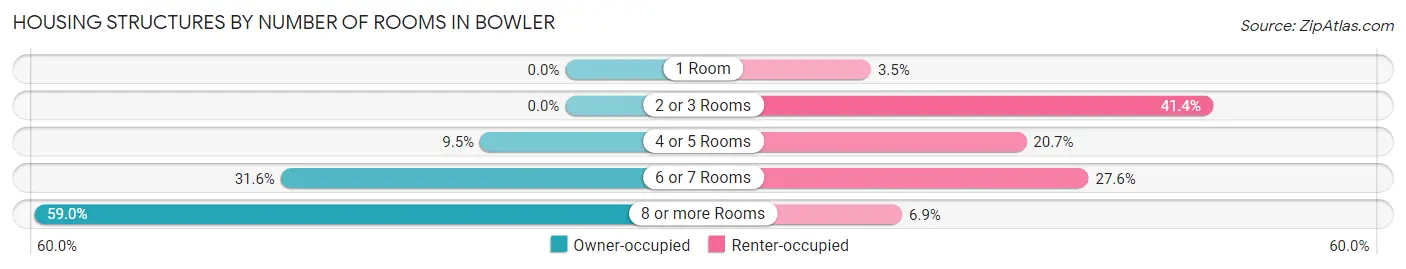
| Number of Rooms | Owner-occupied | Renter-occupied |
| 1 Room | 0 (0.0%) | 1 (3.5%) |
| 2 or 3 Rooms | 0 (0.0%) | 12 (41.4%) |
| 4 or 5 Rooms | 9 (9.5%) | 6 (20.7%) |
| 6 or 7 Rooms | 30 (31.6%) | 8 (27.6%) |
| 8 or more Rooms | 56 (59.0%) | 2 (6.9%) |
| Total | 95 (100.0%) | 29 (100.0%) |
Housing Structure by Heating Type in Bowler
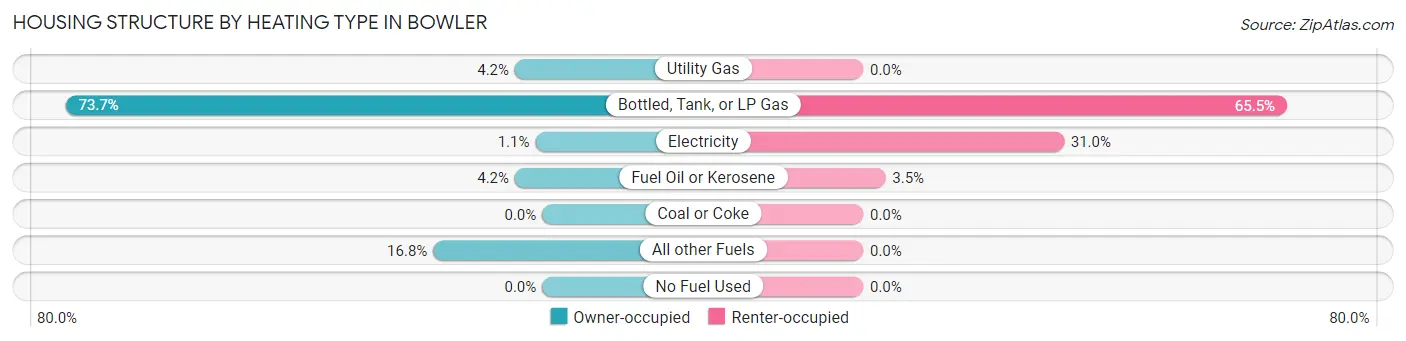
| Heating Type | Owner-occupied | Renter-occupied |
| Utility Gas | 4 (4.2%) | 0 (0.0%) |
| Bottled, Tank, or LP Gas | 70 (73.7%) | 19 (65.5%) |
| Electricity | 1 (1.1%) | 9 (31.0%) |
| Fuel Oil or Kerosene | 4 (4.2%) | 1 (3.5%) |
| Coal or Coke | 0 (0.0%) | 0 (0.0%) |
| All other Fuels | 16 (16.8%) | 0 (0.0%) |
| No Fuel Used | 0 (0.0%) | 0 (0.0%) |
| Total | 95 (100.0%) | 29 (100.0%) |
Household Vehicle Usage in Bowler
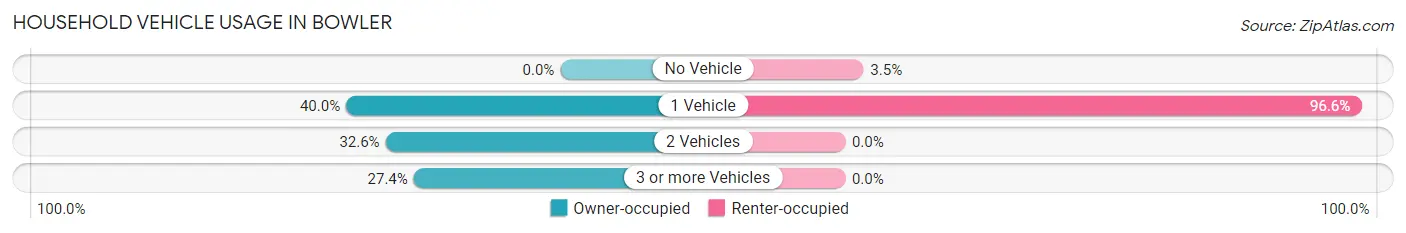
| Vehicles per Household | Owner-occupied | Renter-occupied |
| No Vehicle | 0 (0.0%) | 1 (3.5%) |
| 1 Vehicle | 38 (40.0%) | 28 (96.6%) |
| 2 Vehicles | 31 (32.6%) | 0 (0.0%) |
| 3 or more Vehicles | 26 (27.4%) | 0 (0.0%) |
| Total | 95 (100.0%) | 29 (100.0%) |
Real Estate & Mortgages in Bowler
Real Estate and Mortgage Overview in Bowler
| Characteristic | Without Mortgage | With Mortgage |
| Housing Units | 22 | 73 |
| Median Property Value | $129,200 | $126,000 |
| Median Household Income | $57,500 | $1 |
| Monthly Housing Costs | $500 | $0 |
| Real Estate Taxes | $1,429 | $5 |
Property Value by Mortgage Status in Bowler
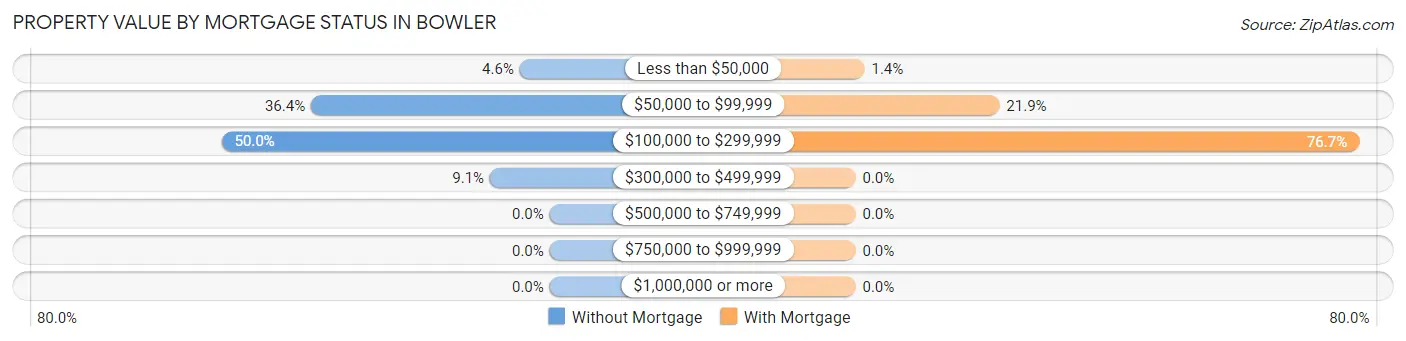
| Property Value | Without Mortgage | With Mortgage |
| Less than $50,000 | 1 (4.5%) | 1 (1.4%) |
| $50,000 to $99,999 | 8 (36.4%) | 16 (21.9%) |
| $100,000 to $299,999 | 11 (50.0%) | 56 (76.7%) |
| $300,000 to $499,999 | 2 (9.1%) | 0 (0.0%) |
| $500,000 to $749,999 | 0 (0.0%) | 0 (0.0%) |
| $750,000 to $999,999 | 0 (0.0%) | 0 (0.0%) |
| $1,000,000 or more | 0 (0.0%) | 0 (0.0%) |
| Total | 22 (100.0%) | 73 (100.0%) |
Household Income by Mortgage Status in Bowler
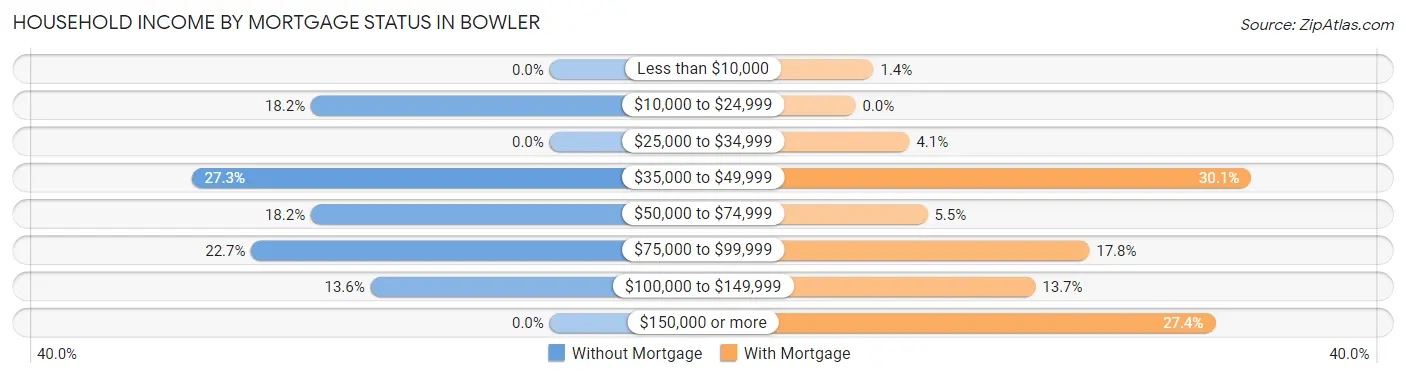
| Household Income | Without Mortgage | With Mortgage |
| Less than $10,000 | 0 (0.0%) | 1 (1.4%) |
| $10,000 to $24,999 | 4 (18.2%) | 0 (0.0%) |
| $25,000 to $34,999 | 0 (0.0%) | 3 (4.1%) |
| $35,000 to $49,999 | 6 (27.3%) | 22 (30.1%) |
| $50,000 to $74,999 | 4 (18.2%) | 4 (5.5%) |
| $75,000 to $99,999 | 5 (22.7%) | 13 (17.8%) |
| $100,000 to $149,999 | 3 (13.6%) | 10 (13.7%) |
| $150,000 or more | 0 (0.0%) | 20 (27.4%) |
| Total | 22 (100.0%) | 73 (100.0%) |
Property Value to Household Income Ratio in Bowler
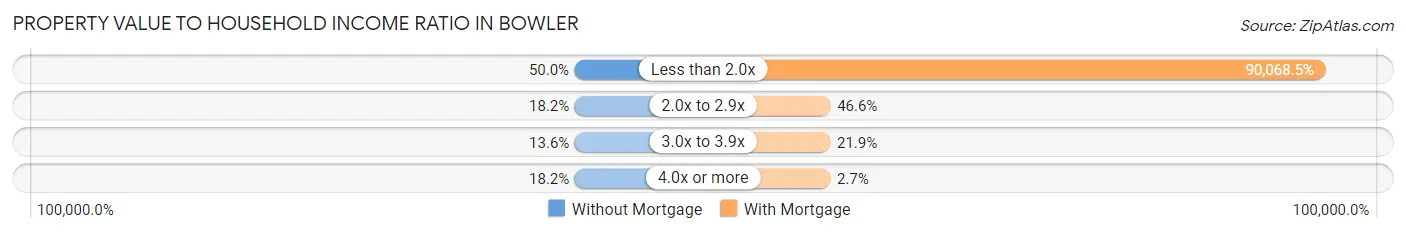
| Value-to-Income Ratio | Without Mortgage | With Mortgage |
| Less than 2.0x | 11 (50.0%) | 65,750 (90,068.5%) |
| 2.0x to 2.9x | 4 (18.2%) | 34 (46.6%) |
| 3.0x to 3.9x | 3 (13.6%) | 16 (21.9%) |
| 4.0x or more | 4 (18.2%) | 2 (2.7%) |
| Total | 22 (100.0%) | 73 (100.0%) |
Real Estate Taxes by Mortgage Status in Bowler
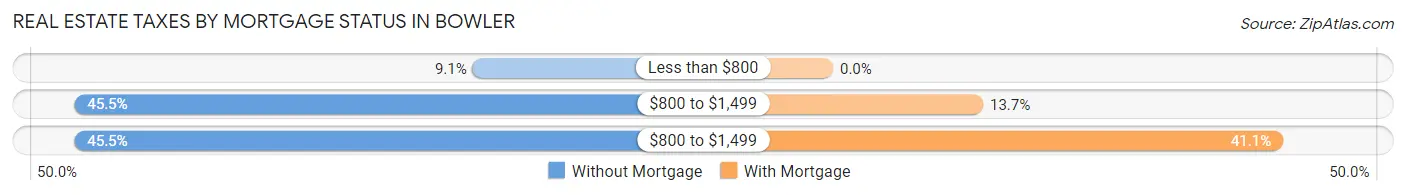
| Property Taxes | Without Mortgage | With Mortgage |
| Less than $800 | 2 (9.1%) | 0 (0.0%) |
| $800 to $1,499 | 10 (45.5%) | 10 (13.7%) |
| $800 to $1,499 | 10 (45.5%) | 30 (41.1%) |
| Total | 22 (100.0%) | 73 (100.0%) |
Health & Disability in Bowler
Health Insurance Coverage by Age in Bowler
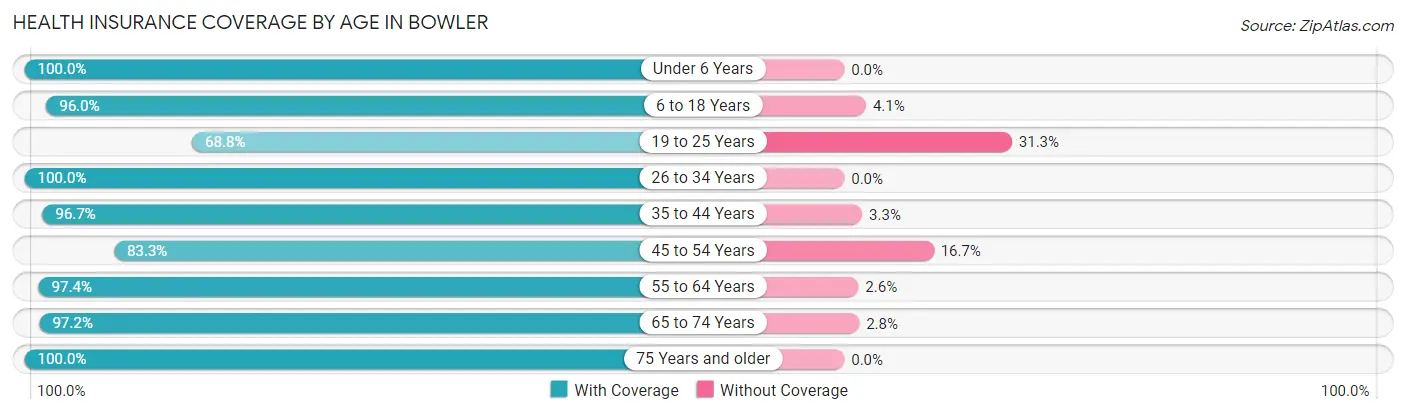
| Age Bracket | With Coverage | Without Coverage |
| Under 6 Years | 22 (100.0%) | 0 (0.0%) |
| 6 to 18 Years | 71 (96.0%) | 3 (4.1%) |
| 19 to 25 Years | 11 (68.8%) | 5 (31.2%) |
| 26 to 34 Years | 39 (100.0%) | 0 (0.0%) |
| 35 to 44 Years | 29 (96.7%) | 1 (3.3%) |
| 45 to 54 Years | 25 (83.3%) | 5 (16.7%) |
| 55 to 64 Years | 37 (97.4%) | 1 (2.6%) |
| 65 to 74 Years | 35 (97.2%) | 1 (2.8%) |
| 75 Years and older | 12 (100.0%) | 0 (0.0%) |
| Total | 281 (94.6%) | 16 (5.4%) |
Health Insurance Coverage by Citizenship Status in Bowler
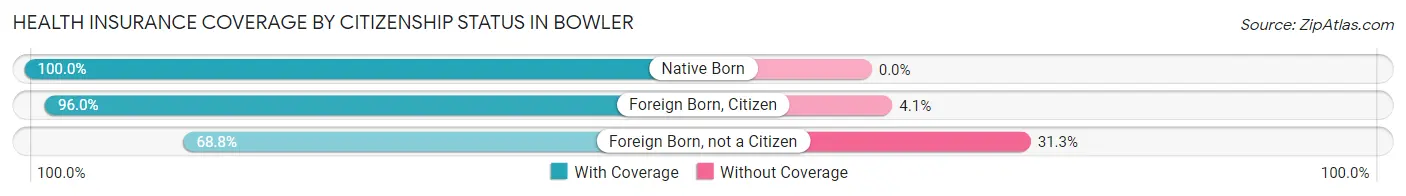
| Citizenship Status | With Coverage | Without Coverage |
| Native Born | 22 (100.0%) | 0 (0.0%) |
| Foreign Born, Citizen | 71 (96.0%) | 3 (4.1%) |
| Foreign Born, not a Citizen | 11 (68.8%) | 5 (31.2%) |
Health Insurance Coverage by Household Income in Bowler
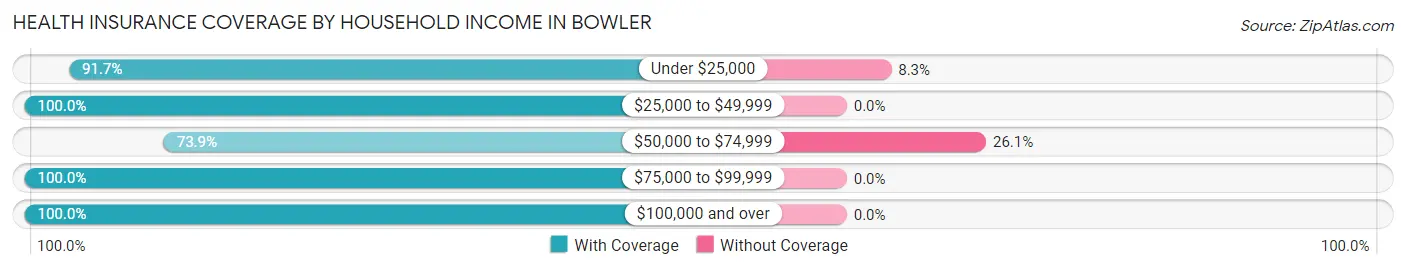
| Household Income | With Coverage | Without Coverage |
| Under $25,000 | 44 (91.7%) | 4 (8.3%) |
| $25,000 to $49,999 | 58 (100.0%) | 0 (0.0%) |
| $50,000 to $74,999 | 34 (73.9%) | 12 (26.1%) |
| $75,000 to $99,999 | 41 (100.0%) | 0 (0.0%) |
| $100,000 and over | 104 (100.0%) | 0 (0.0%) |
Public vs Private Health Insurance Coverage by Age in Bowler
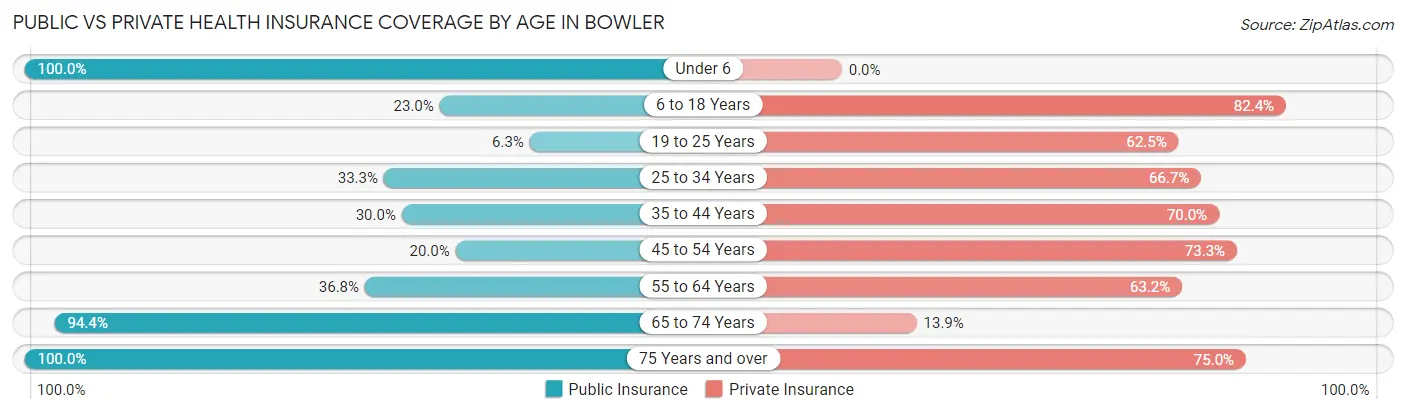
| Age Bracket | Public Insurance | Private Insurance |
| Under 6 | 22 (100.0%) | 0 (0.0%) |
| 6 to 18 Years | 17 (23.0%) | 61 (82.4%) |
| 19 to 25 Years | 1 (6.2%) | 10 (62.5%) |
| 25 to 34 Years | 13 (33.3%) | 26 (66.7%) |
| 35 to 44 Years | 9 (30.0%) | 21 (70.0%) |
| 45 to 54 Years | 6 (20.0%) | 22 (73.3%) |
| 55 to 64 Years | 14 (36.8%) | 24 (63.2%) |
| 65 to 74 Years | 34 (94.4%) | 5 (13.9%) |
| 75 Years and over | 12 (100.0%) | 9 (75.0%) |
| Total | 128 (43.1%) | 178 (59.9%) |
Disability Status by Sex by Age in Bowler
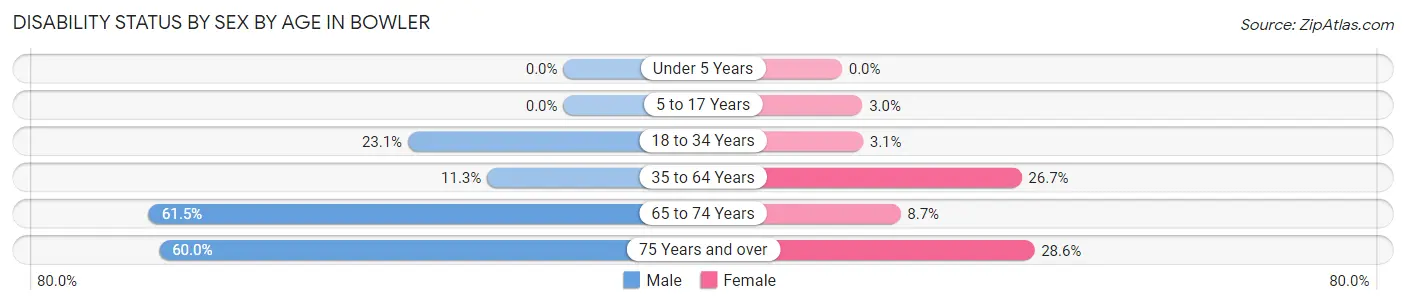
| Age Bracket | Male | Female |
| Under 5 Years | 0 (0.0%) | 0 (0.0%) |
| 5 to 17 Years | 0 (0.0%) | 1 (3.0%) |
| 18 to 34 Years | 6 (23.1%) | 1 (3.1%) |
| 35 to 64 Years | 6 (11.3%) | 12 (26.7%) |
| 65 to 74 Years | 8 (61.5%) | 2 (8.7%) |
| 75 Years and over | 3 (60.0%) | 2 (28.6%) |
Disability Class by Sex by Age in Bowler
Disability Class: Hearing Difficulty
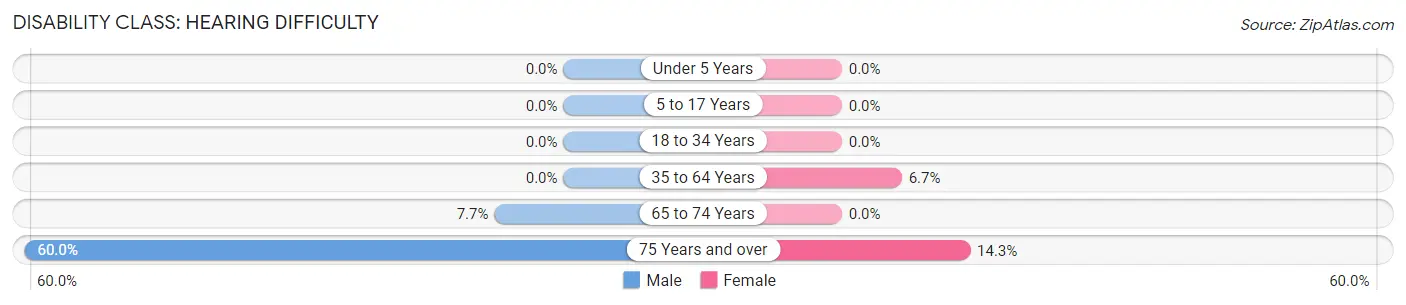
| Age Bracket | Male | Female |
| Under 5 Years | 0 (0.0%) | 0 (0.0%) |
| 5 to 17 Years | 0 (0.0%) | 0 (0.0%) |
| 18 to 34 Years | 0 (0.0%) | 0 (0.0%) |
| 35 to 64 Years | 0 (0.0%) | 3 (6.7%) |
| 65 to 74 Years | 1 (7.7%) | 0 (0.0%) |
| 75 Years and over | 3 (60.0%) | 1 (14.3%) |
Disability Class: Vision Difficulty
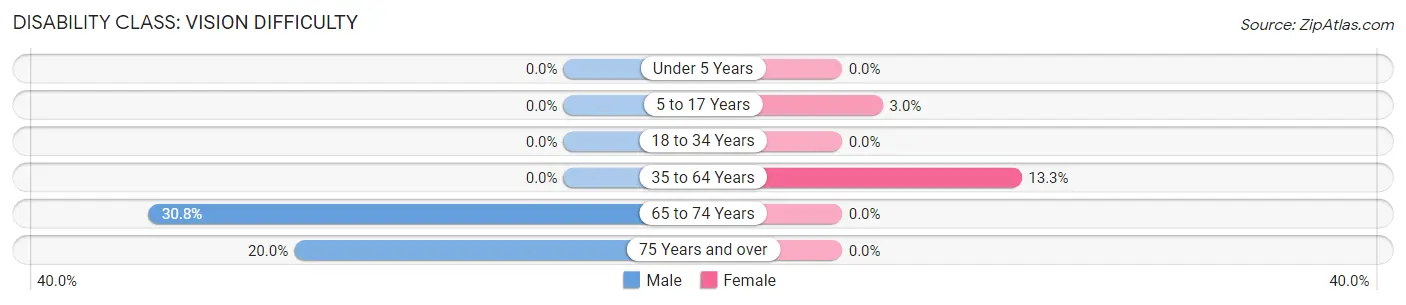
| Age Bracket | Male | Female |
| Under 5 Years | 0 (0.0%) | 0 (0.0%) |
| 5 to 17 Years | 0 (0.0%) | 1 (3.0%) |
| 18 to 34 Years | 0 (0.0%) | 0 (0.0%) |
| 35 to 64 Years | 0 (0.0%) | 6 (13.3%) |
| 65 to 74 Years | 4 (30.8%) | 0 (0.0%) |
| 75 Years and over | 1 (20.0%) | 0 (0.0%) |
Disability Class: Cognitive Difficulty
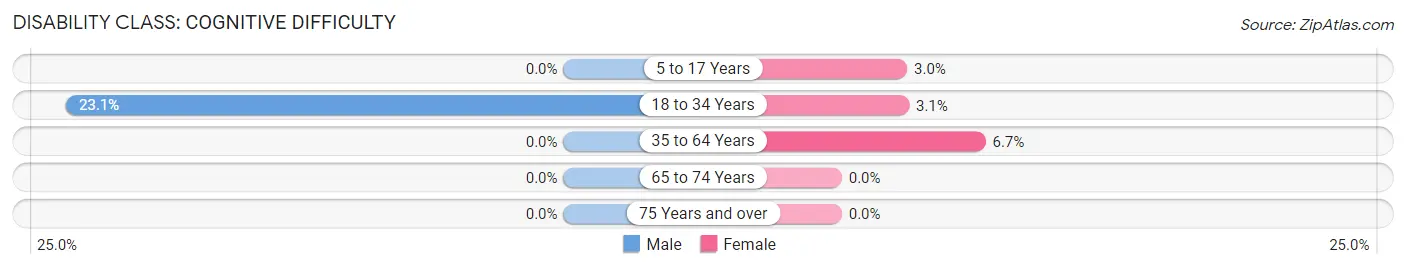
| Age Bracket | Male | Female |
| 5 to 17 Years | 0 (0.0%) | 1 (3.0%) |
| 18 to 34 Years | 6 (23.1%) | 1 (3.1%) |
| 35 to 64 Years | 0 (0.0%) | 3 (6.7%) |
| 65 to 74 Years | 0 (0.0%) | 0 (0.0%) |
| 75 Years and over | 0 (0.0%) | 0 (0.0%) |
Disability Class: Ambulatory Difficulty
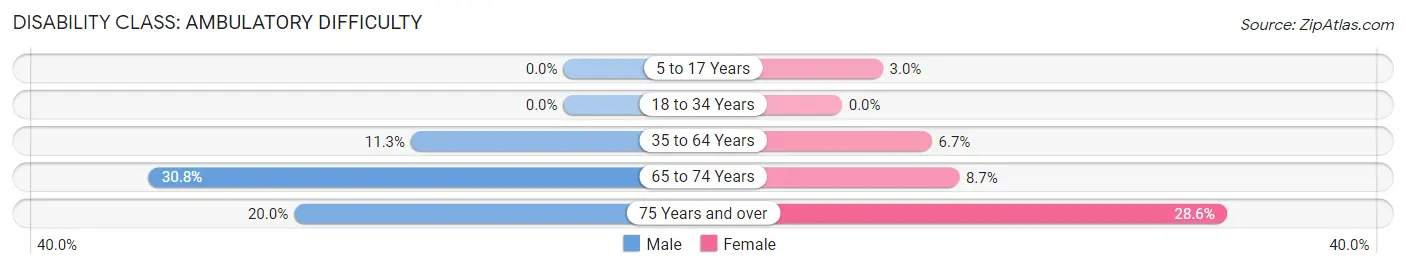
| Age Bracket | Male | Female |
| 5 to 17 Years | 0 (0.0%) | 1 (3.0%) |
| 18 to 34 Years | 0 (0.0%) | 0 (0.0%) |
| 35 to 64 Years | 6 (11.3%) | 3 (6.7%) |
| 65 to 74 Years | 4 (30.8%) | 2 (8.7%) |
| 75 Years and over | 1 (20.0%) | 2 (28.6%) |
Disability Class: Self-Care Difficulty
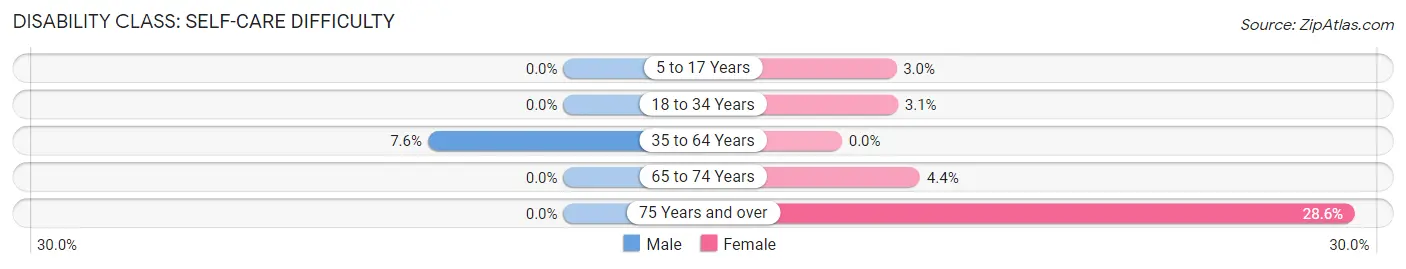
| Age Bracket | Male | Female |
| 5 to 17 Years | 0 (0.0%) | 1 (3.0%) |
| 18 to 34 Years | 0 (0.0%) | 1 (3.1%) |
| 35 to 64 Years | 4 (7.5%) | 0 (0.0%) |
| 65 to 74 Years | 0 (0.0%) | 1 (4.3%) |
| 75 Years and over | 0 (0.0%) | 2 (28.6%) |
Technology Access in Bowler
Computing Device Access in Bowler
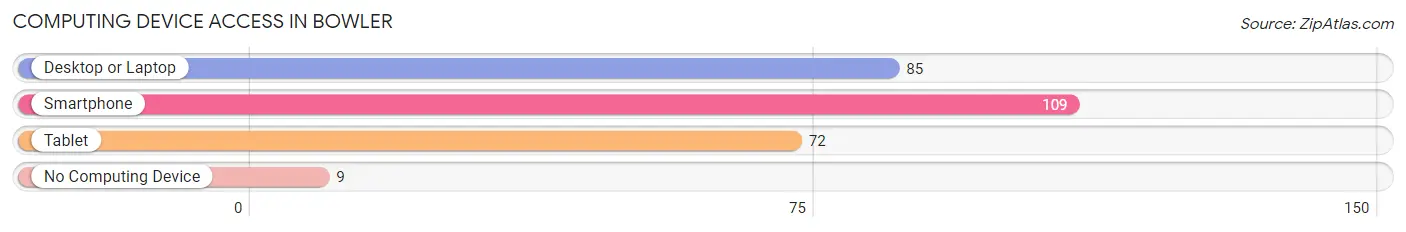
| Device Type | # Households | % Households |
| Desktop or Laptop | 85 | 68.5% |
| Smartphone | 109 | 87.9% |
| Tablet | 72 | 58.1% |
| No Computing Device | 9 | 7.3% |
| Total | 124 | 100.0% |
Internet Access in Bowler
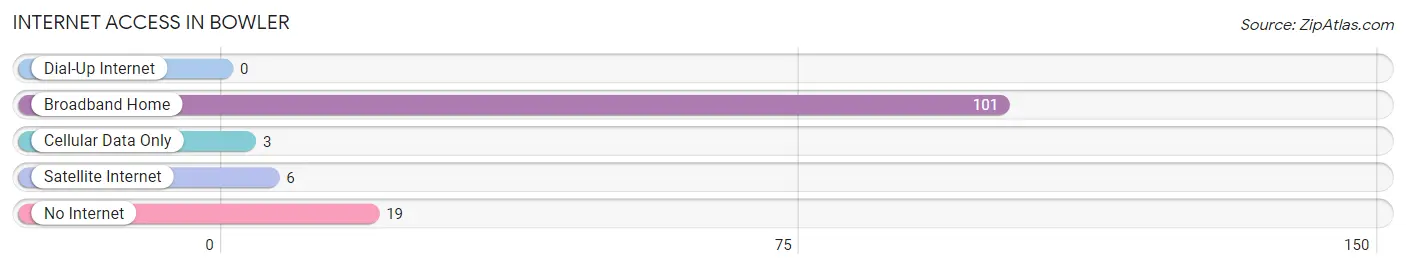
| Internet Type | # Households | % Households |
| Dial-Up Internet | 0 | 0.0% |
| Broadband Home | 101 | 81.5% |
| Cellular Data Only | 3 | 2.4% |
| Satellite Internet | 6 | 4.8% |
| No Internet | 19 | 15.3% |
| Total | 124 | 100.0% |
Bowler Summary
Bowler, Wisconsin is a small village located in Shawano County, Wisconsin. It is situated on the Wolf River, approximately 30 miles northwest of Green Bay. The village has a population of approximately 500 people and is part of the Shawano-Gresham School District.
History
The area that is now Bowler was first settled in the late 1840s by a group of German immigrants. The village was originally known as “Bauer”, which is German for “farmer”. The name was changed to Bowler in 1876 when the post office was established. The village was named after a local landowner, John Bowler.
The village was incorporated in 1891 and the first mayor was John Bowler. The village grew slowly over the years and by the early 1900s had a population of around 200 people. The village was primarily an agricultural community, with most of the residents working on farms or in the local sawmill.
In the 1950s, the village began to experience a population decline as many of the younger residents moved away in search of better job opportunities. This trend continued until the late 1980s when the village began to experience a population resurgence. This was due in part to the opening of a new paper mill in the area, which provided jobs for many of the local residents.
Geography
Bowler is located in Shawano County, Wisconsin. It is situated on the Wolf River, approximately 30 miles northwest of Green Bay. The village is surrounded by rolling hills and is located in a rural area. The nearest major city is Appleton, which is approximately 40 miles away.
The village has a total area of 0.6 square miles, all of which is land. The terrain is mostly flat, with some rolling hills in the surrounding area. The climate is humid continental, with cold winters and warm summers.
Economy
The economy of Bowler is primarily based on agriculture and manufacturing. The village is home to a paper mill, which provides jobs for many of the local residents. The village also has a few small businesses, including a grocery store, a hardware store, and a few restaurants.
The village is also home to a few tourist attractions, including the Wolf River State Trail and the Wolf River Wildlife Area. These attractions bring in visitors from all over the state and provide a boost to the local economy.
Demographics
As of the 2010 census, the population of Bowler was 498. The racial makeup of the village was 97.2% White, 0.2% African American, 0.4% Native American, 0.2% Asian, 0.2% from other races, and 1.9% from two or more races. Hispanic or Latino of any race were 0.8% of the population.
The median household income in Bowler was $41,250, and the median family income was $45,000. The per capita income for the village was $18,945. About 8.3% of families and 10.2% of the population were below the poverty line, including 11.3% of those under age 18 and 8.3% of those age 65 or over.
Bowler is a small village with a rich history and a bright future. The village has a strong agricultural and manufacturing base, and is home to a few tourist attractions. The village has a diverse population and a strong sense of community. Bowler is a great place to live, work, and raise a family.
Common Questions
What is Per Capita Income in Bowler?
Per Capita income in Bowler is $25,984.
What is the Median Family Income in Bowler?
Median Family Income in Bowler is $88,958.
What is the Median Household income in Bowler?
Median Household Income in Bowler is $50,000.
What is Income or Wage Gap in Bowler?
Income or Wage Gap in Bowler is 27.5%.
Women in Bowler earn 72.5 cents for every dollar earned by a man.
What is Inequality or Gini Index in Bowler?
Inequality or Gini Index in Bowler is 0.38.
What is the Total Population of Bowler?
Total Population of Bowler is 297.
What is the Total Male Population of Bowler?
Total Male Population of Bowler is 157.
What is the Total Female Population of Bowler?
Total Female Population of Bowler is 140.
What is the Ratio of Males per 100 Females in Bowler?
There are 112.14 Males per 100 Females in Bowler.
What is the Ratio of Females per 100 Males in Bowler?
There are 89.17 Females per 100 Males in Bowler.
What is the Median Population Age in Bowler?
Median Population Age in Bowler is 34.6 Years.
What is the Average Family Size in Bowler
Average Family Size in Bowler is 3.4 People.
What is the Average Household Size in Bowler
Average Household Size in Bowler is 2.4 People.
How Large is the Labor Force in Bowler?
There are 128 People in the Labor Forcein in Bowler.
What is the Percentage of People in the Labor Force in Bowler?
60.1% of People are in the Labor Force in Bowler.
What is the Unemployment Rate in Bowler?
Unemployment Rate in Bowler is 0.8%.