Boulder Junction, WI Map & Demographics
Boulder Junction Map
Boulder Junction Overview
$35,311
PER CAPITA INCOME
$69,875
AVG FAMILY INCOME
$57,188
AVG HOUSEHOLD INCOME
21.4%
WAGE / INCOME GAP [ % ]
78.6¢/ $1
WAGE / INCOME GAP [ $ ]
0.35
INEQUALITY / GINI INDEX
204
TOTAL POPULATION
115
MALE POPULATION
89
FEMALE POPULATION
129.21
MALES / 100 FEMALES
77.39
FEMALES / 100 MALES
44.2
MEDIAN AGE
3.1
AVG FAMILY SIZE
1.9
AVG HOUSEHOLD SIZE
103
LABOR FORCE [ PEOPLE ]
59.2%
PERCENT IN LABOR FORCE
Boulder Junction Zip Codes
Boulder Junction Area Codes
Income in Boulder Junction
Income Overview in Boulder Junction
Per Capita Income in Boulder Junction is $35,311, while median incomes of families and households are $69,875 and $57,188 respectively.
| Characteristic | Number | Measure |
| Per Capita Income | 204 | $35,311 |
| Median Family Income | 41 | $69,875 |
| Mean Family Income | 41 | $77,751 |
| Median Household Income | 110 | $57,188 |
| Mean Household Income | 110 | $66,025 |
| Income Deficit | 41 | $0 |
| Wage / Income Gap (%) | 204 | 21.43% |
| Wage / Income Gap ($) | 204 | 78.57¢ per $1 |
| Gini / Inequality Index | 204 | 0.35 |
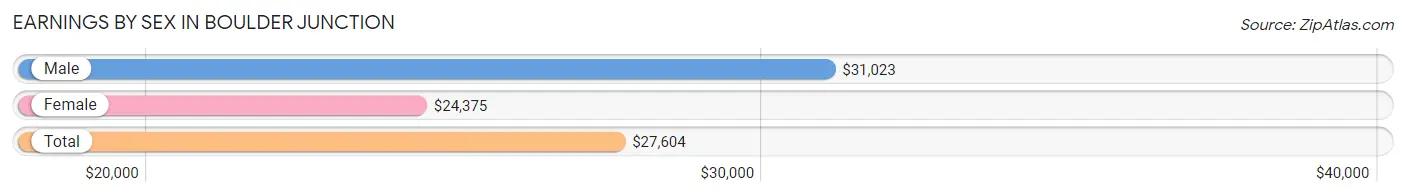
Earnings by Sex in Boulder Junction
Average Earnings in Boulder Junction are $27,604, $31,023 for men and $24,375 for women, a difference of 21.4%.
| Sex | Number | Average Earnings |
| Male | 69 (62.2%) | $31,023 |
| Female | 42 (37.8%) | $24,375 |
| Total | 111 (100.0%) | $27,604 |
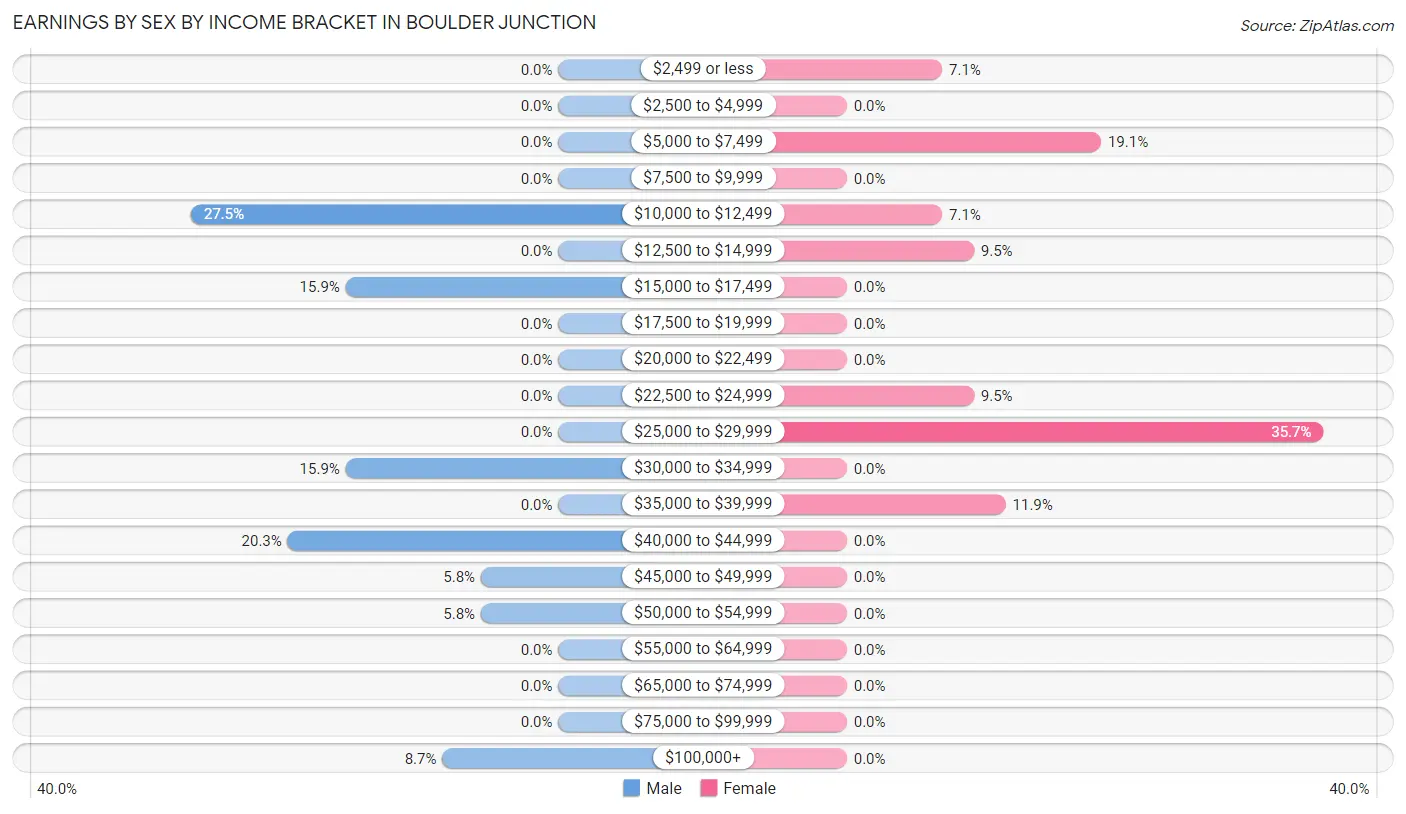
Earnings by Sex by Income Bracket in Boulder Junction
The most common earnings brackets in Boulder Junction are $10,000 to $12,499 for men (19 | 27.5%) and $25,000 to $29,999 for women (15 | 35.7%).
| Income | Male | Female |
| $2,499 or less | 0 (0.0%) | 3 (7.1%) |
| $2,500 to $4,999 | 0 (0.0%) | 0 (0.0%) |
| $5,000 to $7,499 | 0 (0.0%) | 8 (19.1%) |
| $7,500 to $9,999 | 0 (0.0%) | 0 (0.0%) |
| $10,000 to $12,499 | 19 (27.5%) | 3 (7.1%) |
| $12,500 to $14,999 | 0 (0.0%) | 4 (9.5%) |
| $15,000 to $17,499 | 11 (15.9%) | 0 (0.0%) |
| $17,500 to $19,999 | 0 (0.0%) | 0 (0.0%) |
| $20,000 to $22,499 | 0 (0.0%) | 0 (0.0%) |
| $22,500 to $24,999 | 0 (0.0%) | 4 (9.5%) |
| $25,000 to $29,999 | 0 (0.0%) | 15 (35.7%) |
| $30,000 to $34,999 | 11 (15.9%) | 0 (0.0%) |
| $35,000 to $39,999 | 0 (0.0%) | 5 (11.9%) |
| $40,000 to $44,999 | 14 (20.3%) | 0 (0.0%) |
| $45,000 to $49,999 | 4 (5.8%) | 0 (0.0%) |
| $50,000 to $54,999 | 4 (5.8%) | 0 (0.0%) |
| $55,000 to $64,999 | 0 (0.0%) | 0 (0.0%) |
| $65,000 to $74,999 | 0 (0.0%) | 0 (0.0%) |
| $75,000 to $99,999 | 0 (0.0%) | 0 (0.0%) |
| $100,000+ | 6 (8.7%) | 0 (0.0%) |
| Total | 69 (100.0%) | 42 (100.0%) |
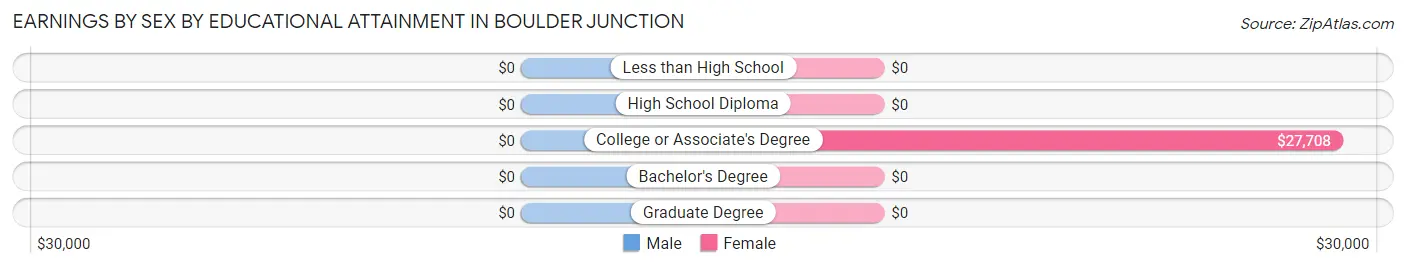
Earnings by Sex by Educational Attainment in Boulder Junction
| Educational Attainment | Male Income | Female Income |
| Less than High School | - | - |
| High School Diploma | - | - |
| College or Associate's Degree | - | - |
| Bachelor's Degree | - | - |
| Graduate Degree | - | - |
| Total | $32,273 | $25,417 |
Family Income in Boulder Junction
Family Income Brackets in Boulder Junction
According to the Boulder Junction family income data, there are 18 families falling into the $50,000 to $74,999 income range, which is the most common income bracket and makes up 43.9% of all families.
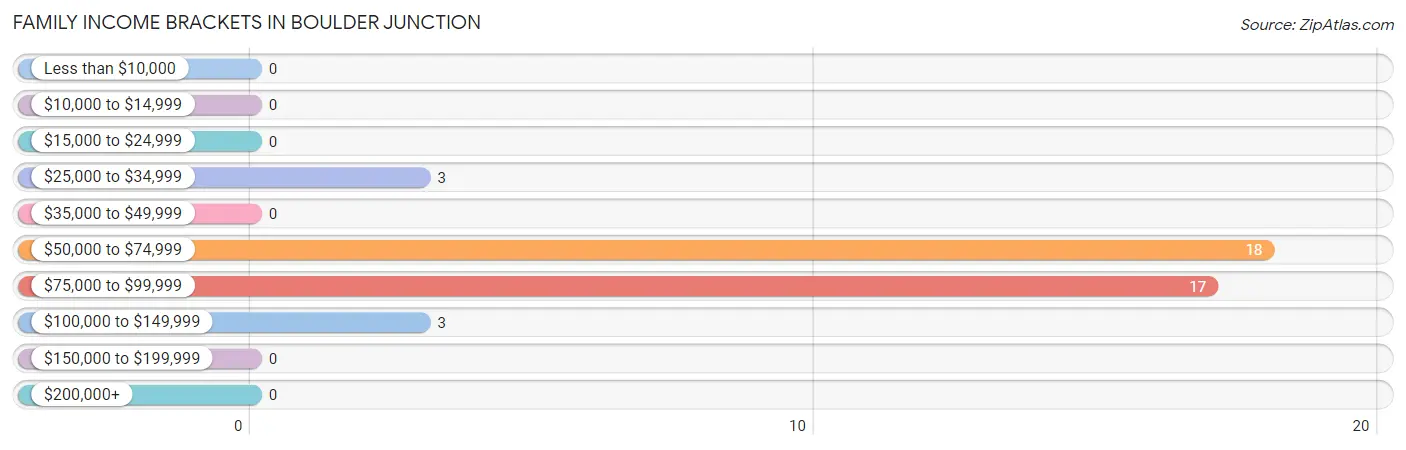
| Income Bracket | # Families | % Families |
| Less than $10,000 | 0 | 0.0% |
| $10,000 to $14,999 | 0 | 0.0% |
| $15,000 to $24,999 | 0 | 0.0% |
| $25,000 to $34,999 | 3 | 7.3% |
| $35,000 to $49,999 | 0 | 0.0% |
| $50,000 to $74,999 | 18 | 43.9% |
| $75,000 to $99,999 | 17 | 41.5% |
| $100,000 to $149,999 | 3 | 7.3% |
| $150,000 to $199,999 | 0 | 0.0% |
| $200,000+ | 0 | 0.0% |
Family Income by Famaliy Size in Boulder Junction
2-person families (21 | 51.2%) account for the highest median family income in Boulder Junction with $68,125 per family, while 2-person families (21 | 51.2%) have the highest median income of $34,062 per family member.
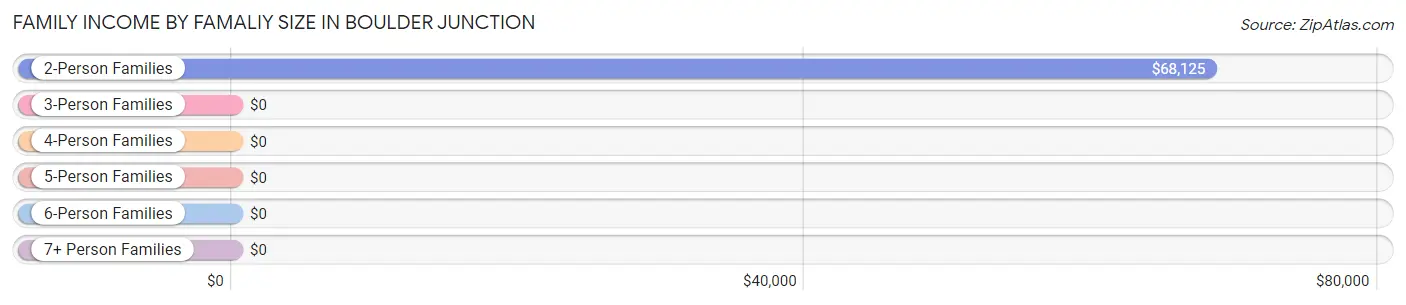
| Income Bracket | # Families | Median Income |
| 2-Person Families | 21 (51.2%) | $68,125 |
| 3-Person Families | 5 (12.2%) | $0 |
| 4-Person Families | 12 (29.3%) | $0 |
| 5-Person Families | 0 (0.0%) | $0 |
| 6-Person Families | 3 (7.3%) | $0 |
| 7+ Person Families | 0 (0.0%) | $0 |
| Total | 41 (100.0%) | $69,875 |
Family Income by Number of Earners in Boulder Junction
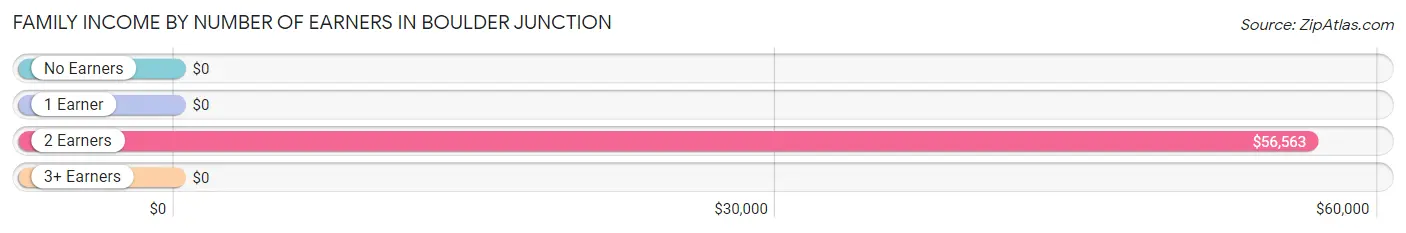
| Number of Earners | # Families | Median Income |
| No Earners | 13 (31.7%) | $0 |
| 1 Earner | 0 (0.0%) | $0 |
| 2 Earners | 16 (39.0%) | $56,563 |
| 3+ Earners | 12 (29.3%) | $0 |
| Total | 41 (100.0%) | $69,875 |
Household Income in Boulder Junction
Household Income Brackets in Boulder Junction
With 32 households falling in the category, the $75,000 to $99,999 income range is the most frequent in Boulder Junction, accounting for 29.1% of all households.
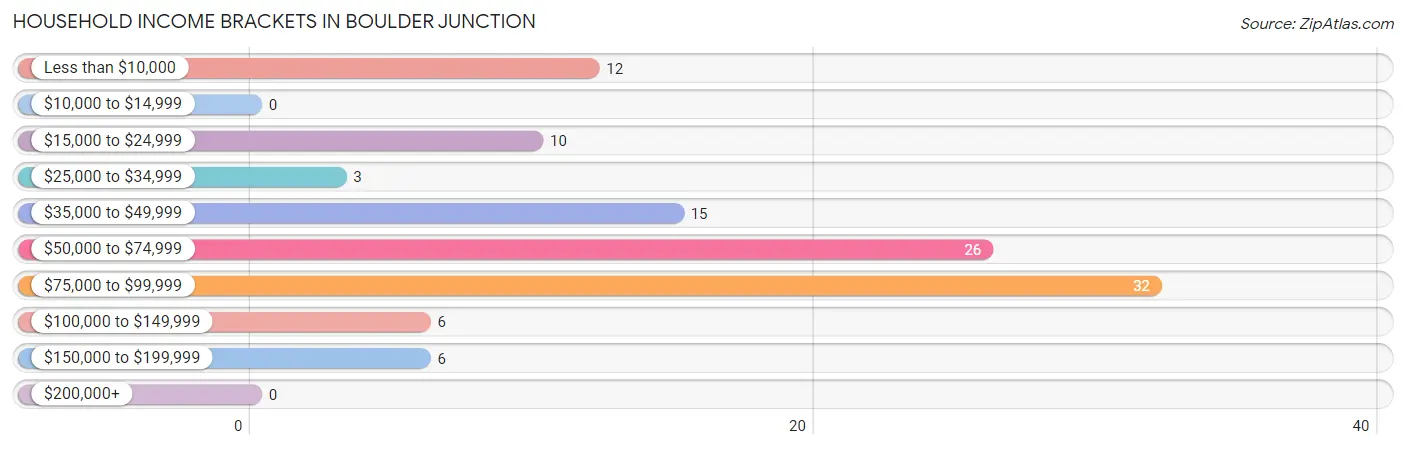
| Income Bracket | # Households | % Households |
| Less than $10,000 | 12 | 10.9% |
| $10,000 to $14,999 | 0 | 0.0% |
| $15,000 to $24,999 | 10 | 9.1% |
| $25,000 to $34,999 | 3 | 2.7% |
| $35,000 to $49,999 | 15 | 13.6% |
| $50,000 to $74,999 | 26 | 23.6% |
| $75,000 to $99,999 | 32 | 29.1% |
| $100,000 to $149,999 | 6 | 5.5% |
| $150,000 to $199,999 | 6 | 5.5% |
| $200,000+ | 0 | 0.0% |
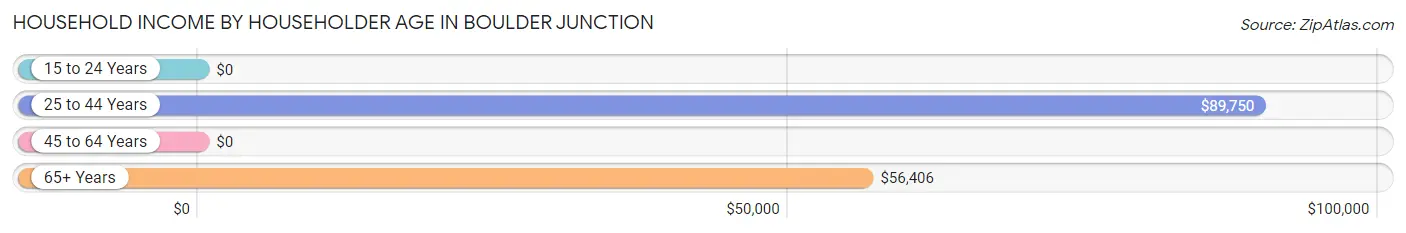
Household Income by Householder Age in Boulder Junction
The median household income in Boulder Junction is $57,188, with the highest median household income of $89,750 found in the 25 to 44 years age bracket for the primary householder. A total of 47 households (42.7%) fall into this category.
| Income Bracket | # Households | Median Income |
| 15 to 24 Years | 0 (0.0%) | $0 |
| 25 to 44 Years | 47 (42.7%) | $89,750 |
| 45 to 64 Years | 24 (21.8%) | $0 |
| 65+ Years | 39 (35.4%) | $56,406 |
| Total | 110 (100.0%) | $57,188 |
Poverty in Boulder Junction
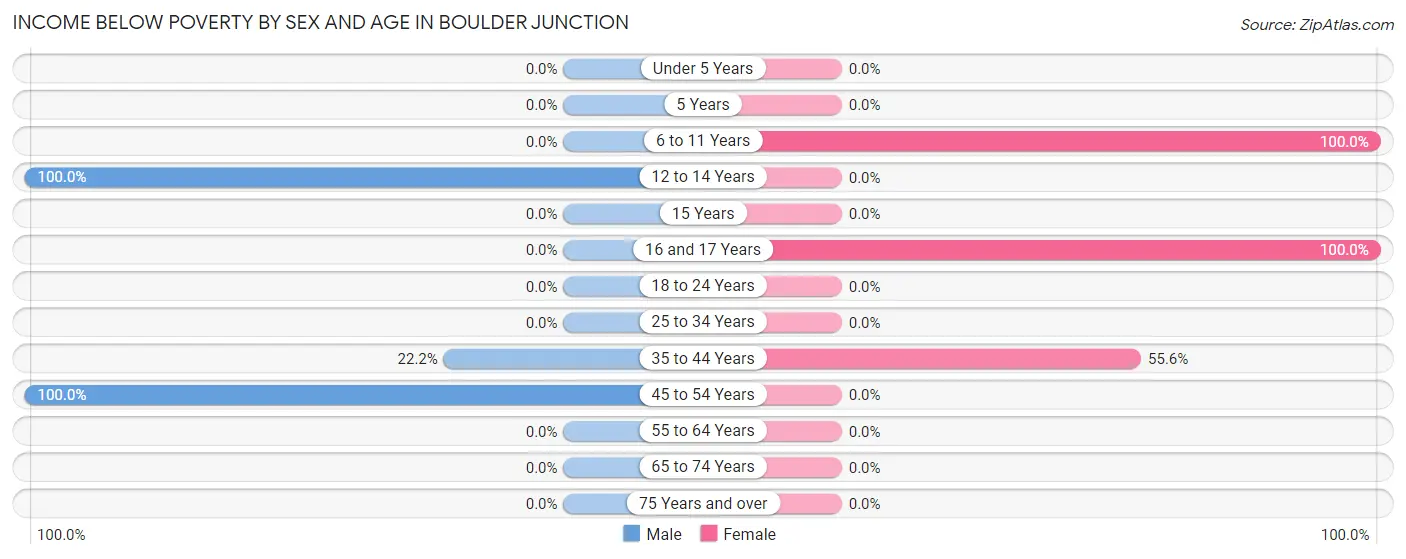
Income Below Poverty by Sex and Age in Boulder Junction
With 9.6% poverty level for males and 24.7% for females among the residents of Boulder Junction, 12 to 14 year old males and 6 to 11 year old females are the most vulnerable to poverty, with 4 males (100.0%) and 4 females (100.0%) in their respective age groups living below the poverty level.
| Age Bracket | Male | Female |
| Under 5 Years | 0 (0.0%) | 0 (0.0%) |
| 5 Years | 0 (0.0%) | 0 (0.0%) |
| 6 to 11 Years | 0 (0.0%) | 4 (100.0%) |
| 12 to 14 Years | 4 (100.0%) | 0 (0.0%) |
| 15 Years | 0 (0.0%) | 0 (0.0%) |
| 16 and 17 Years | 0 (0.0%) | 3 (100.0%) |
| 18 to 24 Years | 0 (0.0%) | 0 (0.0%) |
| 25 to 34 Years | 0 (0.0%) | 0 (0.0%) |
| 35 to 44 Years | 4 (22.2%) | 15 (55.6%) |
| 45 to 54 Years | 3 (100.0%) | 0 (0.0%) |
| 55 to 64 Years | 0 (0.0%) | 0 (0.0%) |
| 65 to 74 Years | 0 (0.0%) | 0 (0.0%) |
| 75 Years and over | 0 (0.0%) | 0 (0.0%) |
| Total | 11 (9.6%) | 22 (24.7%) |
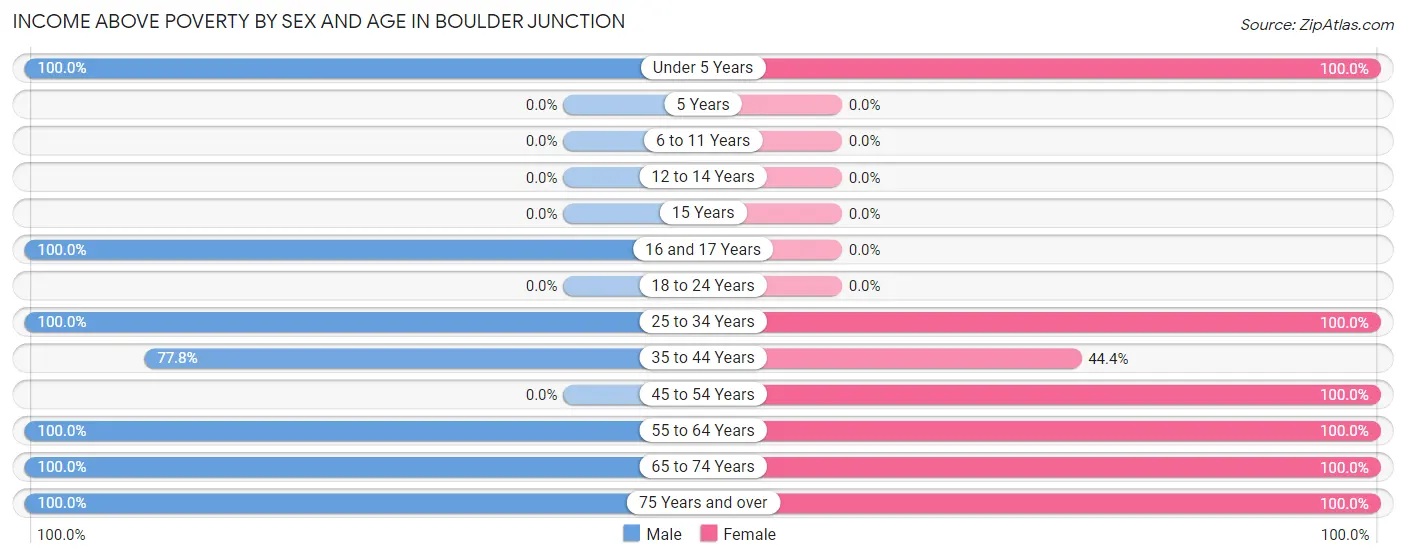
Income Above Poverty by Sex and Age in Boulder Junction
According to the poverty statistics in Boulder Junction, males aged under 5 years and females aged under 5 years are the age groups that are most secure financially, with 100.0% of males and 100.0% of females in these age groups living above the poverty line.
| Age Bracket | Male | Female |
| Under 5 Years | 18 (100.0%) | 4 (100.0%) |
| 5 Years | 0 (0.0%) | 0 (0.0%) |
| 6 to 11 Years | 0 (0.0%) | 0 (0.0%) |
| 12 to 14 Years | 0 (0.0%) | 0 (0.0%) |
| 15 Years | 0 (0.0%) | 0 (0.0%) |
| 16 and 17 Years | 11 (100.0%) | 0 (0.0%) |
| 18 to 24 Years | 0 (0.0%) | 0 (0.0%) |
| 25 to 34 Years | 19 (100.0%) | 5 (100.0%) |
| 35 to 44 Years | 14 (77.8%) | 12 (44.4%) |
| 45 to 54 Years | 0 (0.0%) | 4 (100.0%) |
| 55 to 64 Years | 10 (100.0%) | 14 (100.0%) |
| 65 to 74 Years | 13 (100.0%) | 16 (100.0%) |
| 75 Years and over | 19 (100.0%) | 12 (100.0%) |
| Total | 104 (90.4%) | 67 (75.3%) |
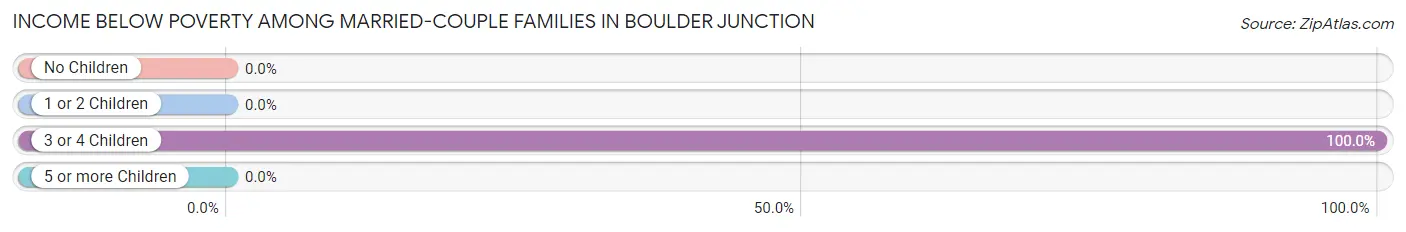
Income Below Poverty Among Married-Couple Families in Boulder Junction
The poverty statistics for married-couple families in Boulder Junction show that 7.3% or 3 of the total 41 families live below the poverty line. Families with 3 or 4 children have the highest poverty rate of 100.0%, comprising of 3 families. On the other hand, families with no children have the lowest poverty rate of 0.0%, which includes 0 families.
| Children | Above Poverty | Below Poverty |
| No Children | 21 (100.0%) | 0 (0.0%) |
| 1 or 2 Children | 17 (100.0%) | 0 (0.0%) |
| 3 or 4 Children | 0 (0.0%) | 3 (100.0%) |
| 5 or more Children | 0 (0.0%) | 0 (0.0%) |
| Total | 38 (92.7%) | 3 (7.3%) |
Income Below Poverty Among Single-Parent Households in Boulder Junction
| Children | Single Father | Single Mother |
| No Children | 0 (0.0%) | 0 (0.0%) |
| 1 or 2 Children | 0 (0.0%) | 0 (0.0%) |
| 3 or 4 Children | 0 (0.0%) | 0 (0.0%) |
| 5 or more Children | 0 (0.0%) | 0 (0.0%) |
| Total | 0 (0.0%) | 0 (0.0%) |
Income Below Poverty Among Married-Couple vs Single-Parent Households in Boulder Junction
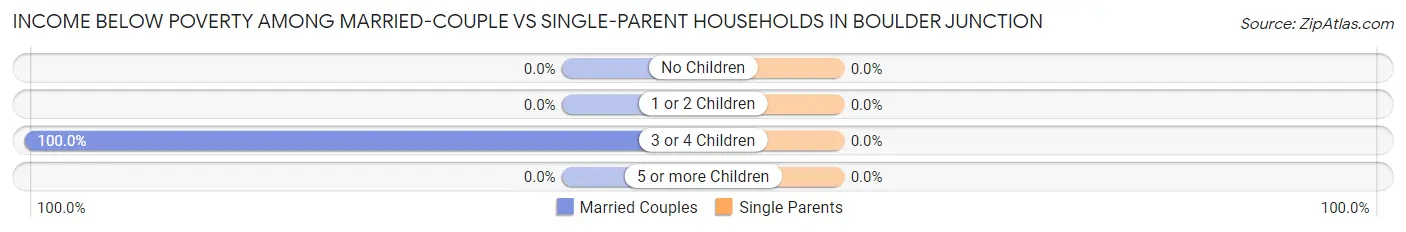
| Children | Married-Couple Families | Single-Parent Households |
| No Children | 0 (0.0%) | 0 (0.0%) |
| 1 or 2 Children | 0 (0.0%) | 0 (0.0%) |
| 3 or 4 Children | 3 (100.0%) | 0 (0.0%) |
| 5 or more Children | 0 (0.0%) | 0 (0.0%) |
| Total | 3 (7.3%) | 0 (0.0%) |
Race in Boulder Junction
The most populous races in Boulder Junction are , and White / Caucasian (204 | 100.0%).
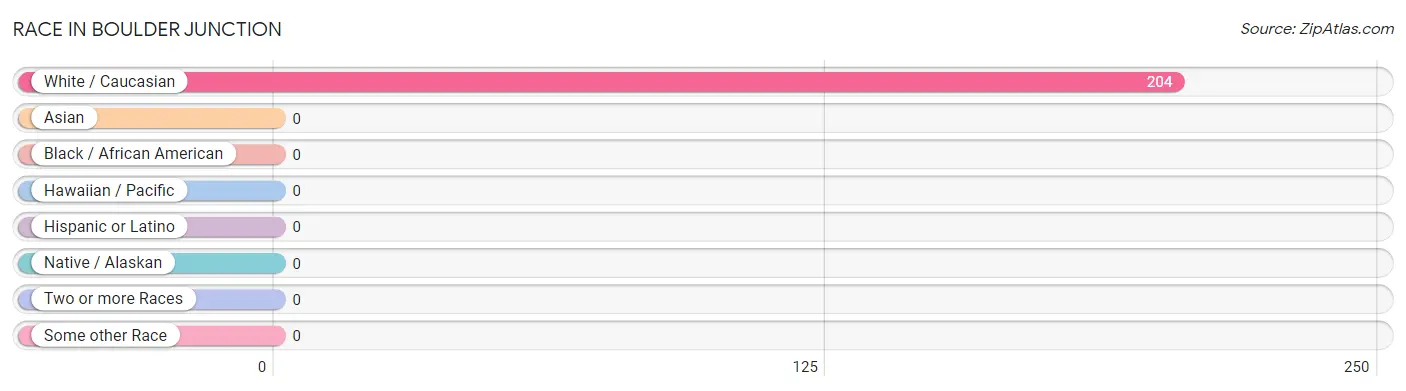
| Race | # Population | % Population |
| Asian | 0 | 0.0% |
| Black / African American | 0 | 0.0% |
| Hawaiian / Pacific | 0 | 0.0% |
| Hispanic or Latino | 0 | 0.0% |
| Native / Alaskan | 0 | 0.0% |
| White / Caucasian | 204 | 100.0% |
| Two or more Races | 0 | 0.0% |
| Some other Race | 0 | 0.0% |
| Total | 204 | 100.0% |
Ancestry in Boulder Junction
The most populous ancestries reported in Boulder Junction are German (74 | 36.3%), Irish (33 | 16.2%), Italian (14 | 6.9%), French Canadian (12 | 5.9%), and Slovene (12 | 5.9%), together accounting for 71.1% of all Boulder Junction residents.
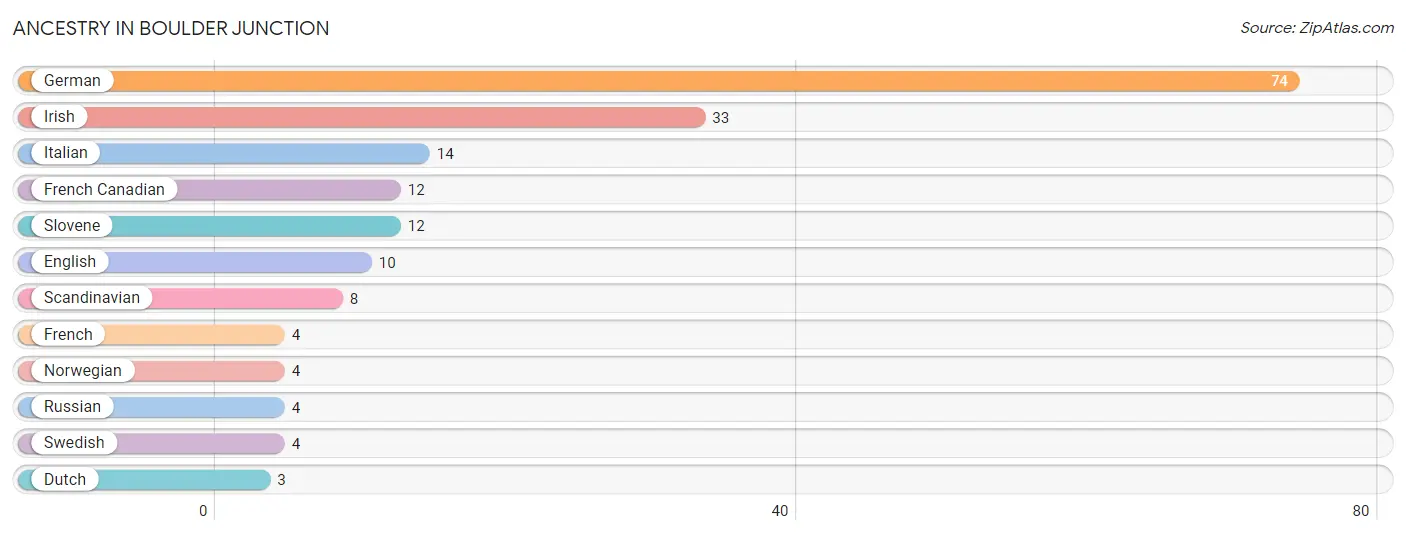
| Ancestry | # Population | % Population |
| Dutch | 3 | 1.5% |
| English | 10 | 4.9% |
| French | 4 | 2.0% |
| French Canadian | 12 | 5.9% |
| German | 74 | 36.3% |
| Irish | 33 | 16.2% |
| Italian | 14 | 6.9% |
| Norwegian | 4 | 2.0% |
| Russian | 4 | 2.0% |
| Scandinavian | 8 | 3.9% |
| Slovene | 12 | 5.9% |
| Swedish | 4 | 2.0% | View All 12 Rows |
Immigrants in Boulder Junction

| Immigration Origin | # Population | % Population | View All 0 Rows |
Sex and Age in Boulder Junction
Sex and Age in Boulder Junction
The most populous age groups in Boulder Junction are 30 to 34 Years (19 | 16.5%) for men and 35 to 39 Years (24 | 27.0%) for women.
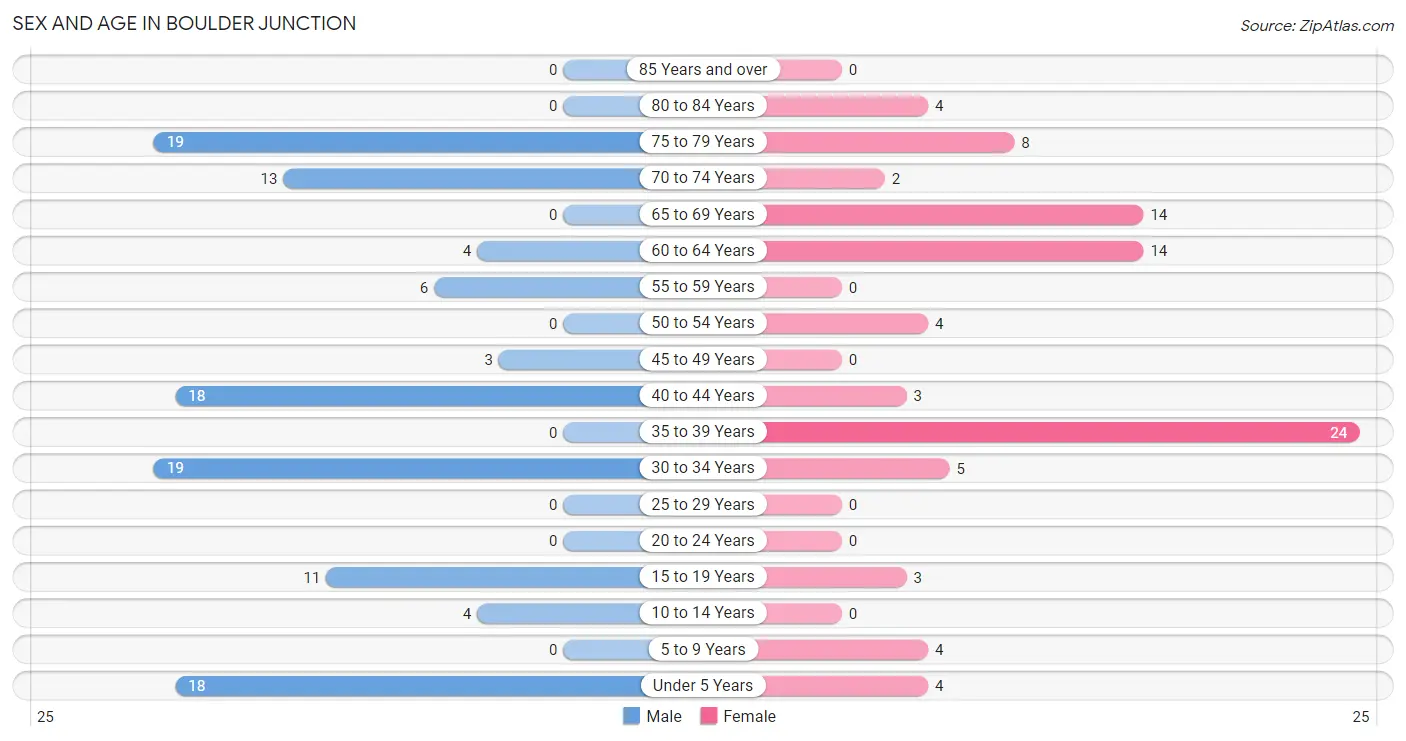
| Age Bracket | Male | Female |
| Under 5 Years | 18 (15.7%) | 4 (4.5%) |
| 5 to 9 Years | 0 (0.0%) | 4 (4.5%) |
| 10 to 14 Years | 4 (3.5%) | 0 (0.0%) |
| 15 to 19 Years | 11 (9.6%) | 3 (3.4%) |
| 20 to 24 Years | 0 (0.0%) | 0 (0.0%) |
| 25 to 29 Years | 0 (0.0%) | 0 (0.0%) |
| 30 to 34 Years | 19 (16.5%) | 5 (5.6%) |
| 35 to 39 Years | 0 (0.0%) | 24 (27.0%) |
| 40 to 44 Years | 18 (15.7%) | 3 (3.4%) |
| 45 to 49 Years | 3 (2.6%) | 0 (0.0%) |
| 50 to 54 Years | 0 (0.0%) | 4 (4.5%) |
| 55 to 59 Years | 6 (5.2%) | 0 (0.0%) |
| 60 to 64 Years | 4 (3.5%) | 14 (15.7%) |
| 65 to 69 Years | 0 (0.0%) | 14 (15.7%) |
| 70 to 74 Years | 13 (11.3%) | 2 (2.2%) |
| 75 to 79 Years | 19 (16.5%) | 8 (9.0%) |
| 80 to 84 Years | 0 (0.0%) | 4 (4.5%) |
| 85 Years and over | 0 (0.0%) | 0 (0.0%) |
| Total | 115 (100.0%) | 89 (100.0%) |
Families and Households in Boulder Junction
Median Family Size in Boulder Junction
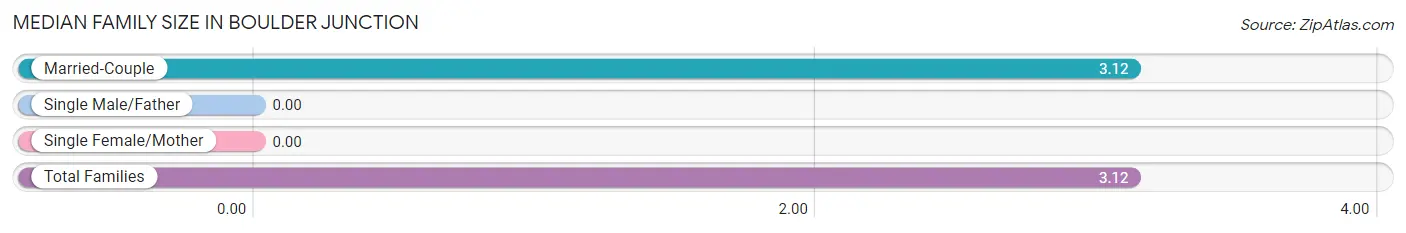
| Family Type | # Families | Family Size |
| Married-Couple | 41 (100.0%) | 3.12 |
| Single Male/Father | 0 (0.0%) | - |
| Single Female/Mother | 0 (0.0%) | - |
| Total Families | 41 (100.0%) | 3.12 |
Median Household Size in Boulder Junction
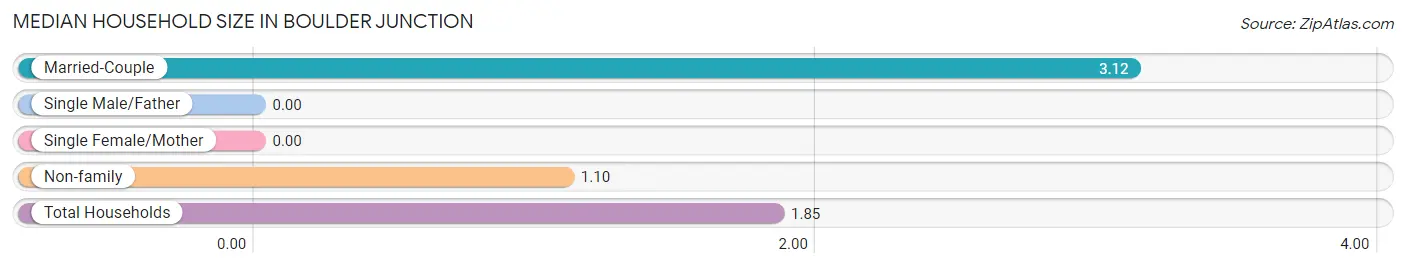
| Household Type | # Households | Household Size |
| Married-Couple | 41 (37.3%) | 3.12 |
| Single Male/Father | 0 (0.0%) | - |
| Single Female/Mother | 0 (0.0%) | - |
| Non-family | 69 (62.7%) | 1.10 |
| Total Households | 110 (100.0%) | 1.85 |
Household Size by Marriage Status in Boulder Junction
Out of a total of 110 households in Boulder Junction, 41 (37.3%) are family households, while 69 (62.7%) are nonfamily households. The most numerous type of family households are 2-person households, comprising 21, and the most common type of nonfamily households are 1-person households, comprising 61.
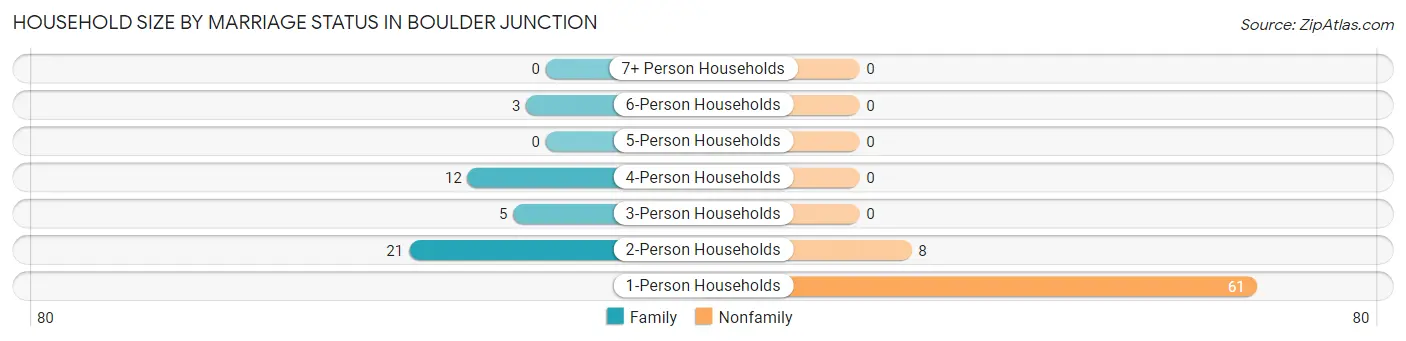
| Household Size | Family Households | Nonfamily Households |
| 1-Person Households | - | 61 (55.4%) |
| 2-Person Households | 21 (19.1%) | 8 (7.3%) |
| 3-Person Households | 5 (4.5%) | 0 (0.0%) |
| 4-Person Households | 12 (10.9%) | 0 (0.0%) |
| 5-Person Households | 0 (0.0%) | 0 (0.0%) |
| 6-Person Households | 3 (2.7%) | 0 (0.0%) |
| 7+ Person Households | 0 (0.0%) | 0 (0.0%) |
| Total | 41 (37.3%) | 69 (62.7%) |
Female Fertility in Boulder Junction
Fertility by Age in Boulder Junction
| Age Bracket | Women with Births | Births / 1,000 Women |
| 15 to 19 years | 0 (0.0%) | 0.0 |
| 20 to 34 years | 0 (0.0%) | 0.0 |
| 35 to 50 years | 0 (0.0%) | 0.0 |
| Total | 0 (0.0%) | 0.0 |
Fertility by Age by Marriage Status in Boulder Junction
| Age Bracket | Married | Unmarried |
| 15 to 19 years | 0 (0.0%) | 0 (0.0%) |
| 20 to 34 years | 0 (0.0%) | 0 (0.0%) |
| 35 to 50 years | 0 (0.0%) | 0 (0.0%) |
| Total | 0 (0.0%) | 0 (0.0%) |
Fertility by Education in Boulder Junction
| Educational Attainment | Women with Births | Births / 1,000 Women |
| Less than High School | 0 (0.0%) | 0.0 |
| High School Diploma | 0 (0.0%) | 0.0 |
| College or Associate's Degree | 0 (0.0%) | 0.0 |
| Bachelor's Degree | 0 (0.0%) | 0.0 |
| Graduate Degree | 0 (0.0%) | 0.0 |
| Total | 0 (0.0%) | 0.0 |
Fertility by Education by Marriage Status in Boulder Junction
| Educational Attainment | Married | Unmarried |
| Less than High School | 0 (0.0%) | 0 (0.0%) |
| High School Diploma | 0 (0.0%) | 0 (0.0%) |
| College or Associate's Degree | 0 (0.0%) | 0 (0.0%) |
| Bachelor's Degree | 0 (0.0%) | 0 (0.0%) |
| Graduate Degree | 0 (0.0%) | 0 (0.0%) |
| Total | 0 (0.0%) | 0 (0.0%) |
Employment Characteristics in Boulder Junction
Employment by Class of Employer in Boulder Junction
Among the 103 employed individuals in Boulder Junction, private company employees (78 | 75.7%), not-for-profit organizations (17 | 16.5%), and self-employed (not incorporated) (8 | 7.8%) make up the most common classes of employment.
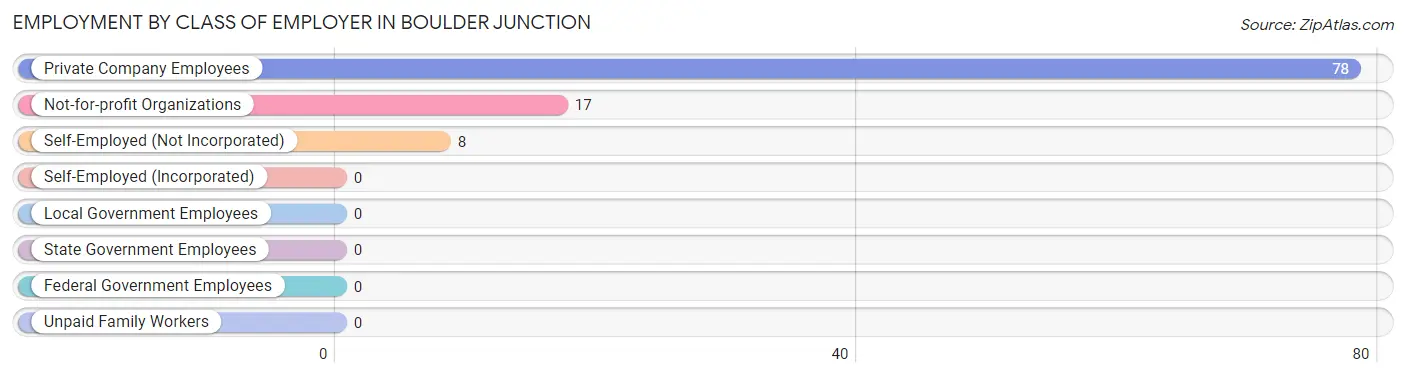
| Employer Class | # Employees | % Employees |
| Private Company Employees | 78 | 75.7% |
| Self-Employed (Incorporated) | 0 | 0.0% |
| Self-Employed (Not Incorporated) | 8 | 7.8% |
| Not-for-profit Organizations | 17 | 16.5% |
| Local Government Employees | 0 | 0.0% |
| State Government Employees | 0 | 0.0% |
| Federal Government Employees | 0 | 0.0% |
| Unpaid Family Workers | 0 | 0.0% |
| Total | 103 | 100.0% |
Employment Status by Age in Boulder Junction
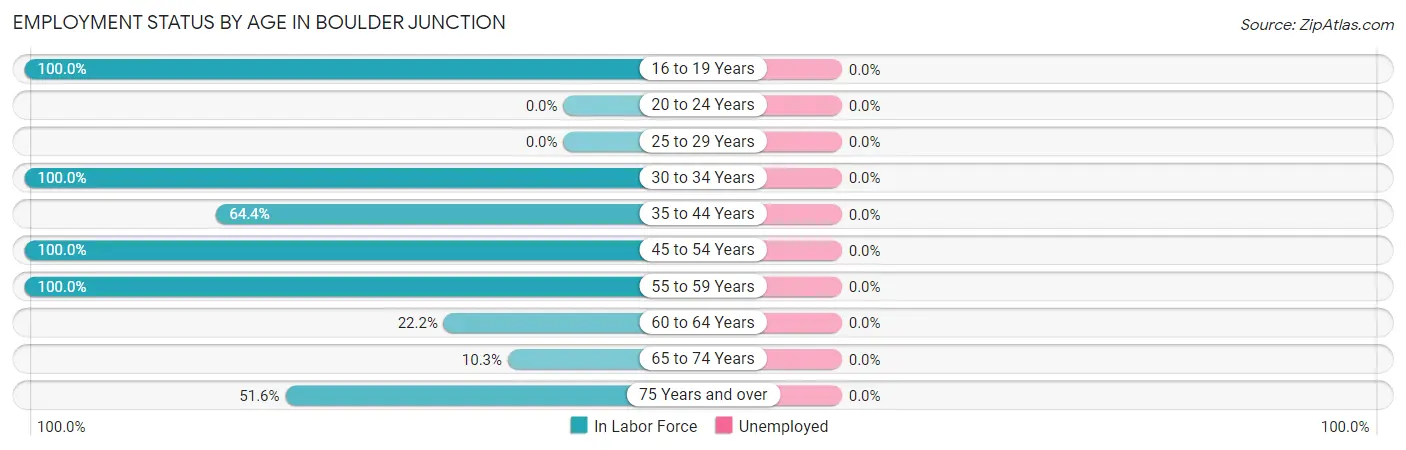
| Age Bracket | In Labor Force | Unemployed |
| 16 to 19 Years | 14 (100.0%) | 0 (0.0%) |
| 20 to 24 Years | 0 (0.0%) | 0 (0.0%) |
| 25 to 29 Years | 0 (0.0%) | 0 (0.0%) |
| 30 to 34 Years | 24 (100.0%) | 0 (0.0%) |
| 35 to 44 Years | 29 (64.4%) | 0 (0.0%) |
| 45 to 54 Years | 7 (100.0%) | 0 (0.0%) |
| 55 to 59 Years | 6 (100.0%) | 0 (0.0%) |
| 60 to 64 Years | 4 (22.2%) | 0 (0.0%) |
| 65 to 74 Years | 3 (10.3%) | 0 (0.0%) |
| 75 Years and over | 16 (51.6%) | 0 (0.0%) |
| Total | 103 (59.2%) | 0 (0.0%) |
Employment Status by Educational Attainment in Boulder Junction
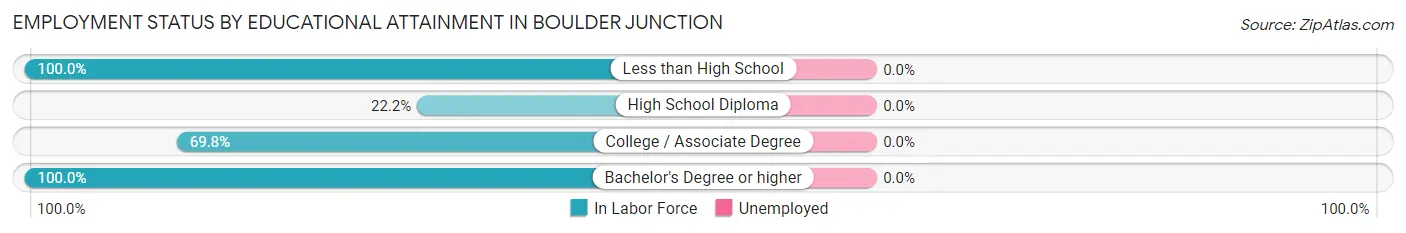
| Educational Attainment | In Labor Force | Unemployed |
| Less than High School | 3 (100.0%) | 0 (0.0%) |
| High School Diploma | 4 (22.2%) | 0 (0.0%) |
| College / Associate Degree | 37 (69.8%) | 0 (0.0%) |
| Bachelor's Degree or higher | 26 (100.0%) | 0 (0.0%) |
| Total | 70 (70.0%) | 0 (0.0%) |
Employment Occupations by Sex in Boulder Junction
Management, Business, Science and Arts Occupations
The most common Management, Business, Science and Arts occupations in Boulder Junction are , and Management (26 | 25.2%).
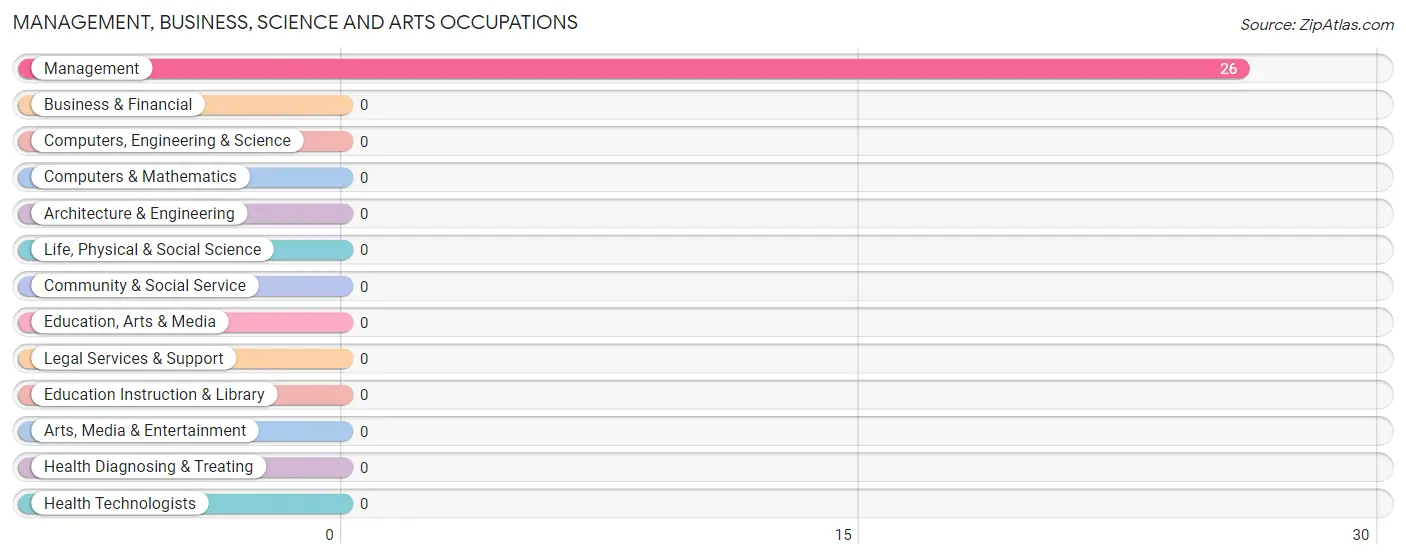
Management, Business, Science and Arts Occupations by Sex
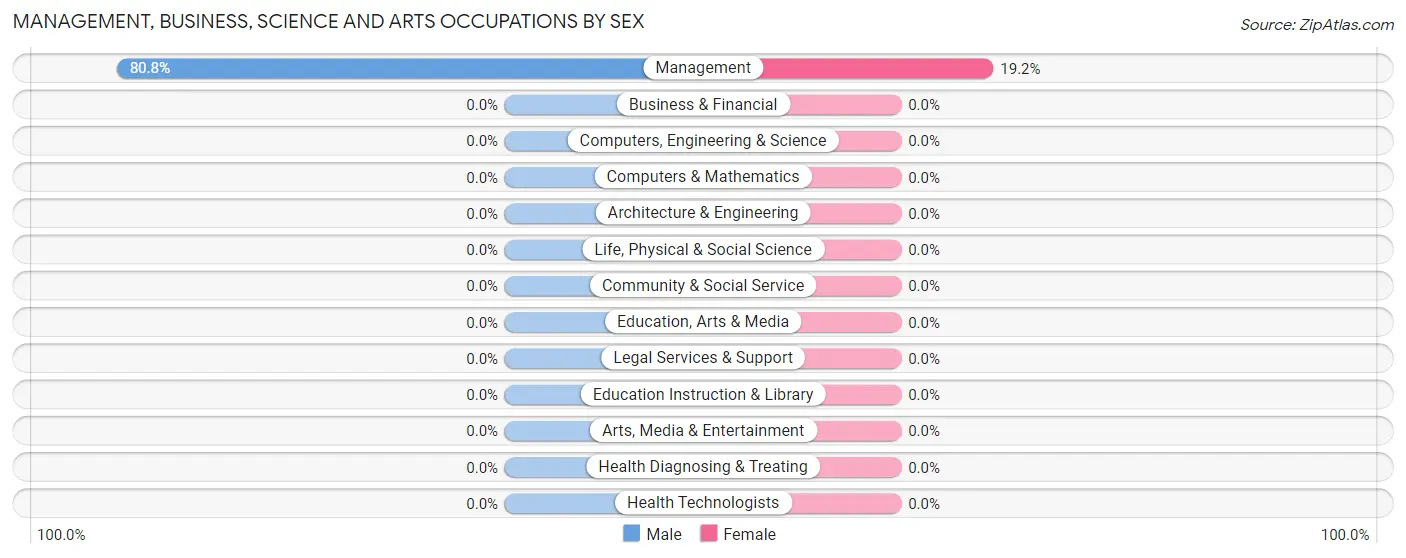
| Occupation | Male | Female |
| Management | 21 (80.8%) | 5 (19.2%) |
| Business & Financial | 0 (0.0%) | 0 (0.0%) |
| Computers, Engineering & Science | 0 (0.0%) | 0 (0.0%) |
| Computers & Mathematics | 0 (0.0%) | 0 (0.0%) |
| Architecture & Engineering | 0 (0.0%) | 0 (0.0%) |
| Life, Physical & Social Science | 0 (0.0%) | 0 (0.0%) |
| Community & Social Service | 0 (0.0%) | 0 (0.0%) |
| Education, Arts & Media | 0 (0.0%) | 0 (0.0%) |
| Legal Services & Support | 0 (0.0%) | 0 (0.0%) |
| Education Instruction & Library | 0 (0.0%) | 0 (0.0%) |
| Arts, Media & Entertainment | 0 (0.0%) | 0 (0.0%) |
| Health Diagnosing & Treating | 0 (0.0%) | 0 (0.0%) |
| Health Technologists | 0 (0.0%) | 0 (0.0%) |
| Total (Category) | 21 (80.8%) | 5 (19.2%) |
| Total (Overall) | 61 (59.2%) | 42 (40.8%) |
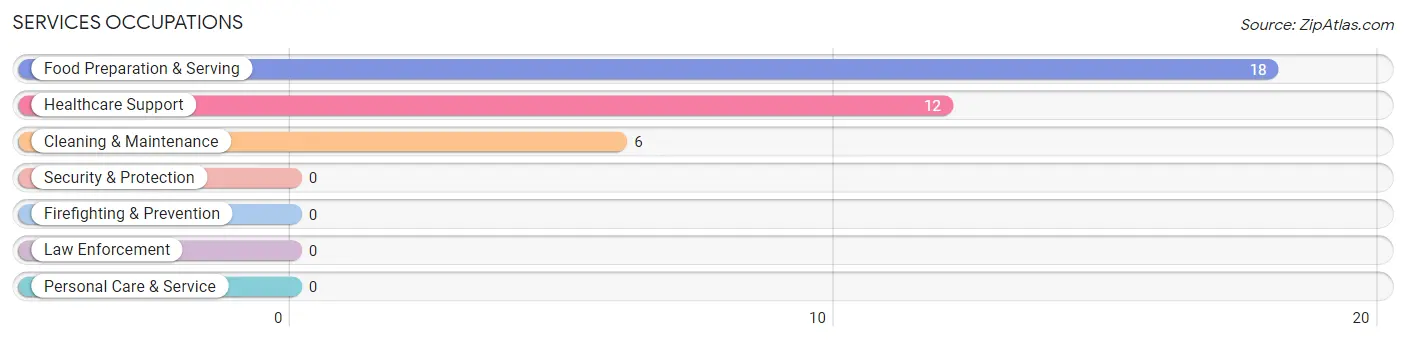
Services Occupations
The most common Services occupations in Boulder Junction are Food Preparation & Serving (18 | 17.5%), Healthcare Support (12 | 11.7%), and Cleaning & Maintenance (6 | 5.8%).
Services Occupations by Sex
Within the Services occupations in Boulder Junction, the most male-oriented occupations are Food Preparation & Serving (77.8%), and Cleaning & Maintenance (50.0%), while the most female-oriented occupations are Healthcare Support (100.0%), Cleaning & Maintenance (50.0%), and Food Preparation & Serving (22.2%).
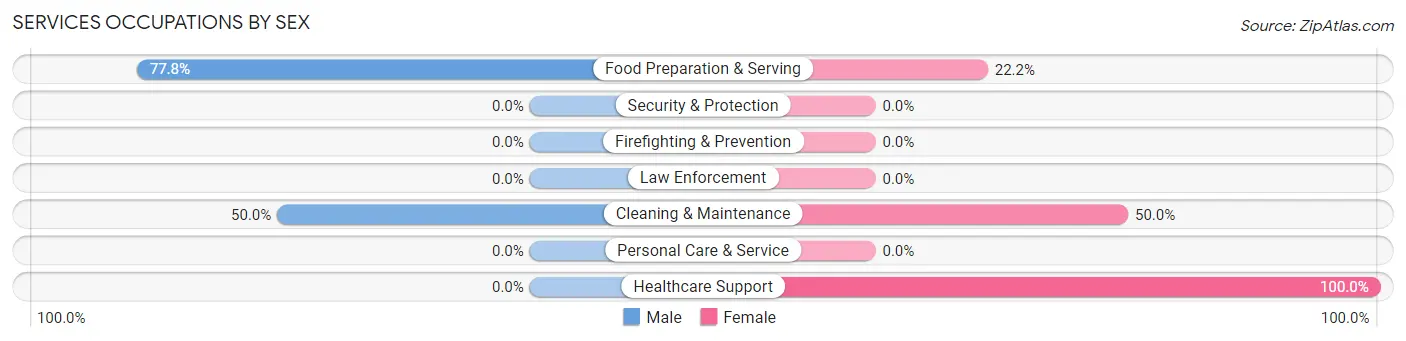
| Occupation | Male | Female |
| Healthcare Support | 0 (0.0%) | 12 (100.0%) |
| Security & Protection | 0 (0.0%) | 0 (0.0%) |
| Firefighting & Prevention | 0 (0.0%) | 0 (0.0%) |
| Law Enforcement | 0 (0.0%) | 0 (0.0%) |
| Food Preparation & Serving | 14 (77.8%) | 4 (22.2%) |
| Cleaning & Maintenance | 3 (50.0%) | 3 (50.0%) |
| Personal Care & Service | 0 (0.0%) | 0 (0.0%) |
| Total (Category) | 17 (47.2%) | 19 (52.8%) |
| Total (Overall) | 61 (59.2%) | 42 (40.8%) |
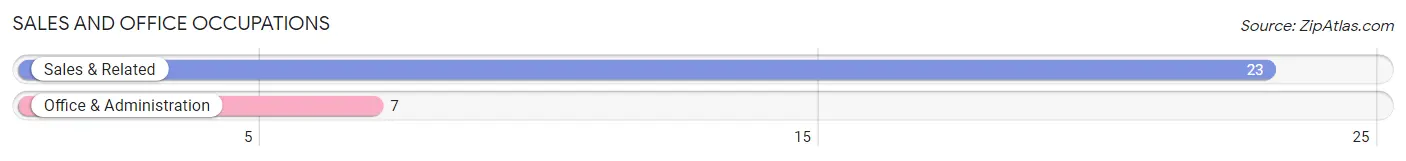
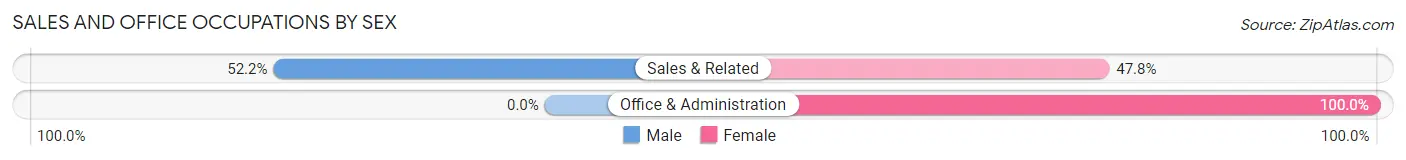
Sales and Office Occupations
The most common Sales and Office occupations in Boulder Junction are Sales & Related (23 | 22.3%), and Office & Administration (7 | 6.8%).
Sales and Office Occupations by Sex
| Occupation | Male | Female |
| Sales & Related | 12 (52.2%) | 11 (47.8%) |
| Office & Administration | 0 (0.0%) | 7 (100.0%) |
| Total (Category) | 12 (40.0%) | 18 (60.0%) |
| Total (Overall) | 61 (59.2%) | 42 (40.8%) |
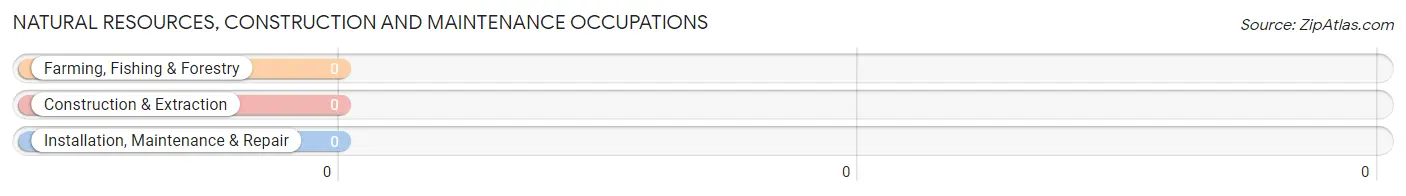
Natural Resources, Construction and Maintenance Occupations
Natural Resources, Construction and Maintenance Occupations by Sex
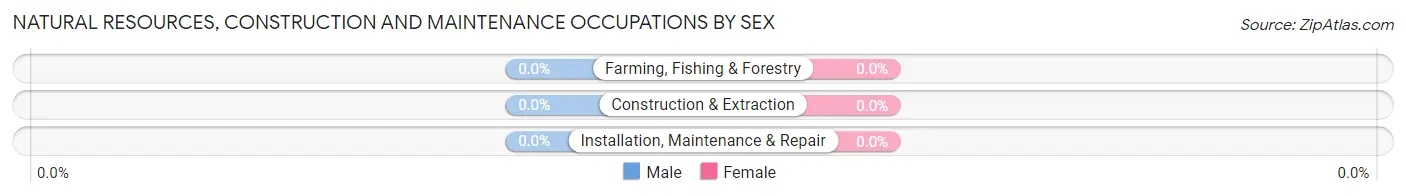
| Occupation | Male | Female |
| Farming, Fishing & Forestry | 0 (0.0%) | 0 (0.0%) |
| Construction & Extraction | 0 (0.0%) | 0 (0.0%) |
| Installation, Maintenance & Repair | 0 (0.0%) | 0 (0.0%) |
| Total (Category) | 0 (0.0%) | 0 (0.0%) |
| Total (Overall) | 61 (59.2%) | 42 (40.8%) |
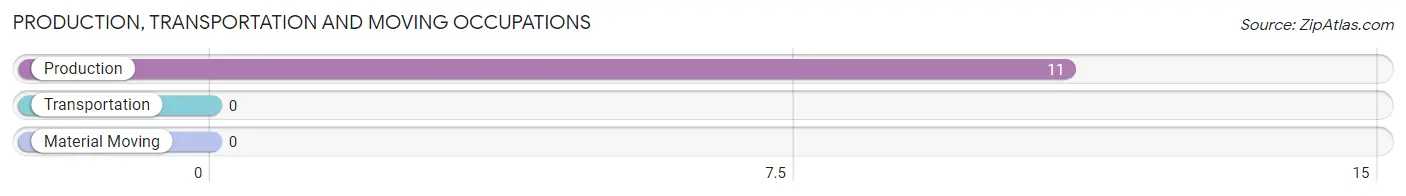
Production, Transportation and Moving Occupations
The most common Production, Transportation and Moving occupations in Boulder Junction are , and Production (11 | 10.7%).
Production, Transportation and Moving Occupations by Sex
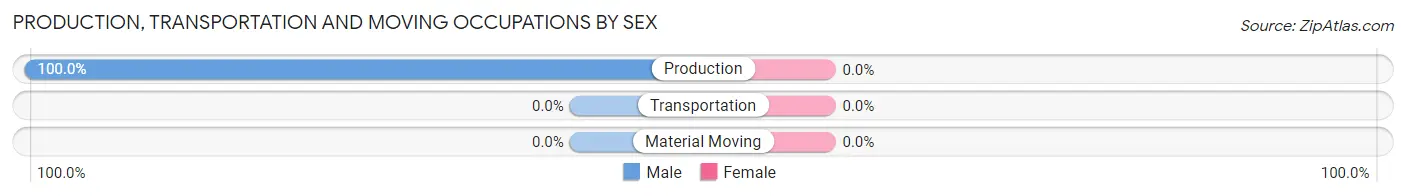
| Occupation | Male | Female |
| Production | 11 (100.0%) | 0 (0.0%) |
| Transportation | 0 (0.0%) | 0 (0.0%) |
| Material Moving | 0 (0.0%) | 0 (0.0%) |
| Total (Category) | 11 (100.0%) | 0 (0.0%) |
| Total (Overall) | 61 (59.2%) | 42 (40.8%) |
Employment Industries by Sex in Boulder Junction
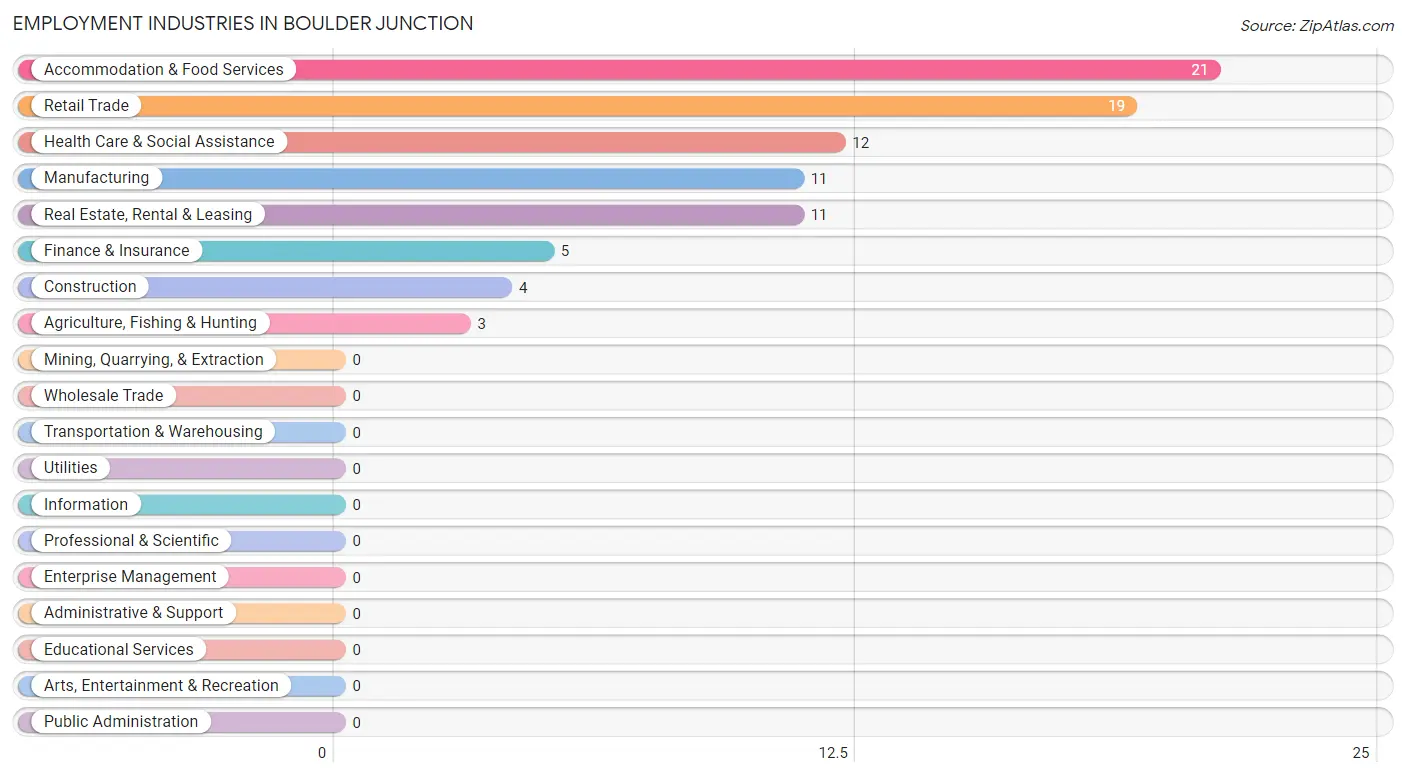
Employment Industries in Boulder Junction
The major employment industries in Boulder Junction include Accommodation & Food Services (21 | 20.4%), Retail Trade (19 | 18.4%), Health Care & Social Assistance (12 | 11.7%), Manufacturing (11 | 10.7%), and Real Estate, Rental & Leasing (11 | 10.7%).
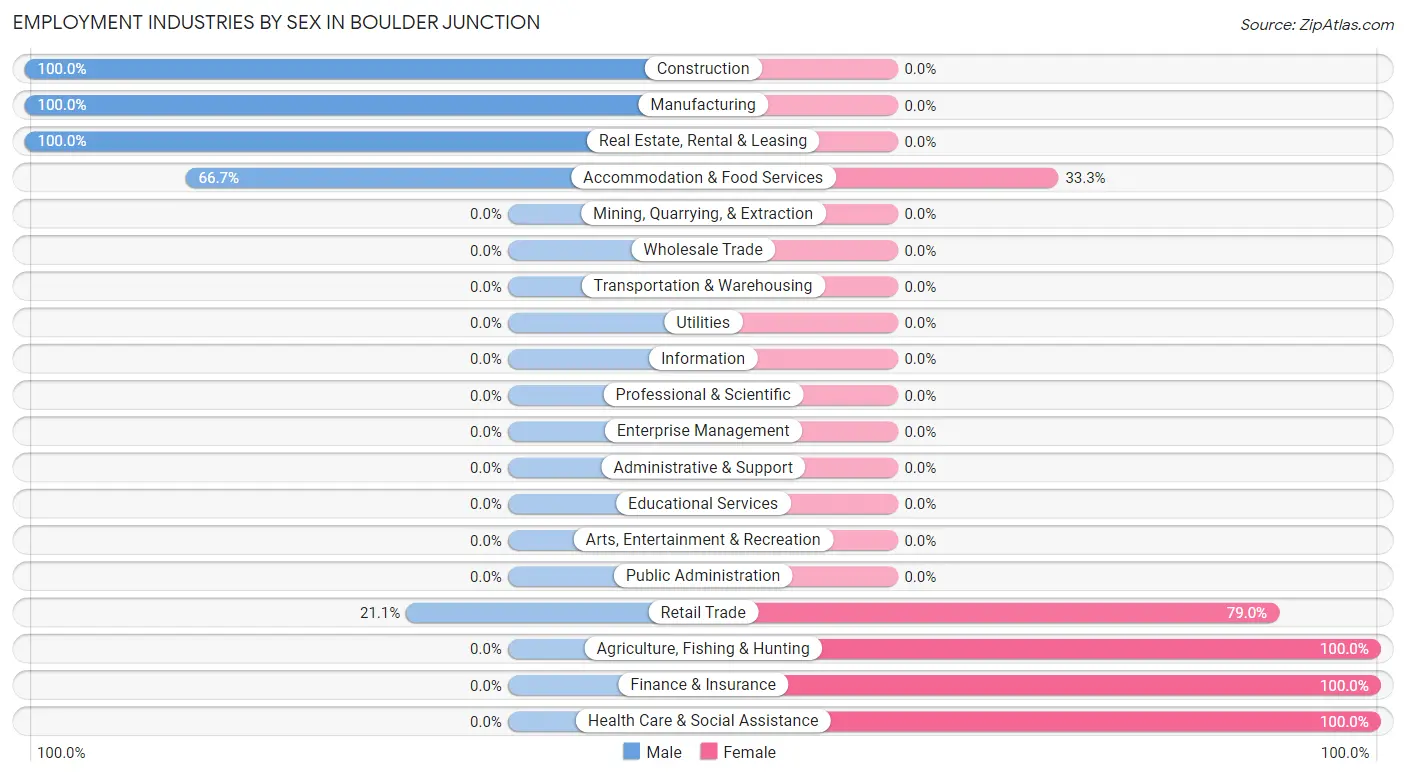
Employment Industries by Sex in Boulder Junction
The Boulder Junction industries that see more men than women are Construction (100.0%), Manufacturing (100.0%), and Real Estate, Rental & Leasing (100.0%), whereas the industries that tend to have a higher number of women are Agriculture, Fishing & Hunting (100.0%), Finance & Insurance (100.0%), and Health Care & Social Assistance (100.0%).
| Industry | Male | Female |
| Agriculture, Fishing & Hunting | 0 (0.0%) | 3 (100.0%) |
| Mining, Quarrying, & Extraction | 0 (0.0%) | 0 (0.0%) |
| Construction | 4 (100.0%) | 0 (0.0%) |
| Manufacturing | 11 (100.0%) | 0 (0.0%) |
| Wholesale Trade | 0 (0.0%) | 0 (0.0%) |
| Retail Trade | 4 (21.0%) | 15 (78.9%) |
| Transportation & Warehousing | 0 (0.0%) | 0 (0.0%) |
| Utilities | 0 (0.0%) | 0 (0.0%) |
| Information | 0 (0.0%) | 0 (0.0%) |
| Finance & Insurance | 0 (0.0%) | 5 (100.0%) |
| Real Estate, Rental & Leasing | 11 (100.0%) | 0 (0.0%) |
| Professional & Scientific | 0 (0.0%) | 0 (0.0%) |
| Enterprise Management | 0 (0.0%) | 0 (0.0%) |
| Administrative & Support | 0 (0.0%) | 0 (0.0%) |
| Educational Services | 0 (0.0%) | 0 (0.0%) |
| Health Care & Social Assistance | 0 (0.0%) | 12 (100.0%) |
| Arts, Entertainment & Recreation | 0 (0.0%) | 0 (0.0%) |
| Accommodation & Food Services | 14 (66.7%) | 7 (33.3%) |
| Public Administration | 0 (0.0%) | 0 (0.0%) |
| Total | 61 (59.2%) | 42 (40.8%) |
Education in Boulder Junction
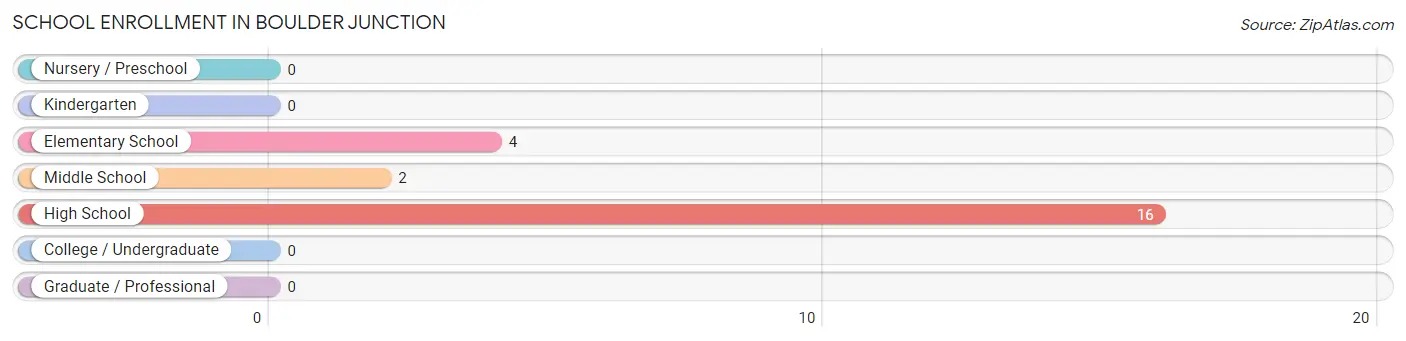
School Enrollment in Boulder Junction
The most common levels of schooling among the 22 students in Boulder Junction are high school (16 | 72.7%), elementary school (4 | 18.2%), and middle school (2 | 9.1%).
| School Level | # Students | % Students |
| Nursery / Preschool | 0 | 0.0% |
| Kindergarten | 0 | 0.0% |
| Elementary School | 4 | 18.2% |
| Middle School | 2 | 9.1% |
| High School | 16 | 72.7% |
| College / Undergraduate | 0 | 0.0% |
| Graduate / Professional | 0 | 0.0% |
| Total | 22 | 100.0% |
School Enrollment by Age by Funding Source in Boulder Junction
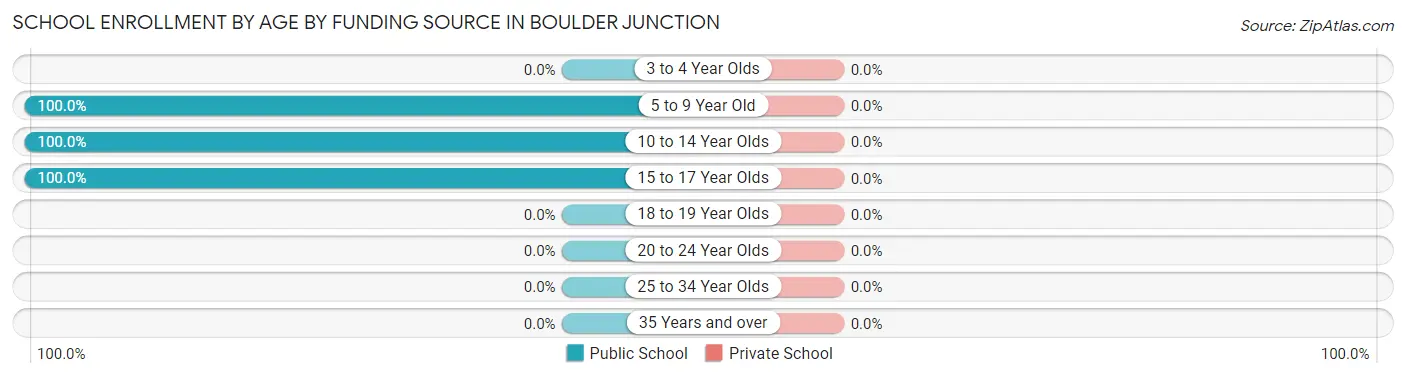
| Age Bracket | Public School | Private School |
| 3 to 4 Year Olds | 0 (0.0%) | 0 (0.0%) |
| 5 to 9 Year Old | 4 (100.0%) | 0 (0.0%) |
| 10 to 14 Year Olds | 4 (100.0%) | 0 (0.0%) |
| 15 to 17 Year Olds | 14 (100.0%) | 0 (0.0%) |
| 18 to 19 Year Olds | 0 (0.0%) | 0 (0.0%) |
| 20 to 24 Year Olds | 0 (0.0%) | 0 (0.0%) |
| 25 to 34 Year Olds | 0 (0.0%) | 0 (0.0%) |
| 35 Years and over | 0 (0.0%) | 0 (0.0%) |
| Total | 22 (100.0%) | 0 (0.0%) |
Educational Attainment by Field of Study in Boulder Junction
Liberal arts & history (11 | 17.7%), communications (11 | 17.7%), arts & humanities (11 | 17.7%), bio, nature & agricultural (8 | 12.9%), and physical & health sciences (6 | 9.7%) are the most common fields of study among 62 individuals in Boulder Junction who have obtained a bachelor's degree or higher.
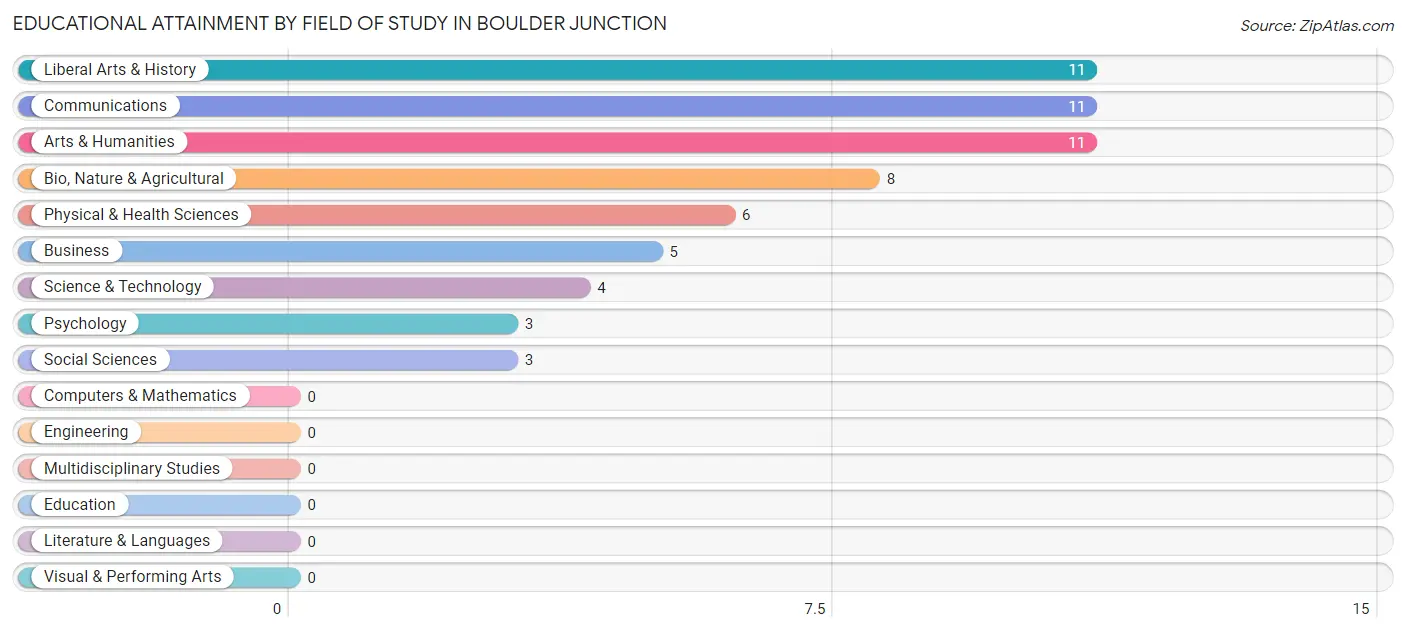
| Field of Study | # Graduates | % Graduates |
| Computers & Mathematics | 0 | 0.0% |
| Bio, Nature & Agricultural | 8 | 12.9% |
| Physical & Health Sciences | 6 | 9.7% |
| Psychology | 3 | 4.8% |
| Social Sciences | 3 | 4.8% |
| Engineering | 0 | 0.0% |
| Multidisciplinary Studies | 0 | 0.0% |
| Science & Technology | 4 | 6.5% |
| Business | 5 | 8.1% |
| Education | 0 | 0.0% |
| Literature & Languages | 0 | 0.0% |
| Liberal Arts & History | 11 | 17.7% |
| Visual & Performing Arts | 0 | 0.0% |
| Communications | 11 | 17.7% |
| Arts & Humanities | 11 | 17.7% |
| Total | 62 | 100.0% |
Transportation & Commute in Boulder Junction
Vehicle Availability by Sex in Boulder Junction
The most prevalent vehicle ownership categories in Boulder Junction are males with 1 vehicle (32, accounting for 52.5%) and females with 1 vehicle (7, making up 76.2%).
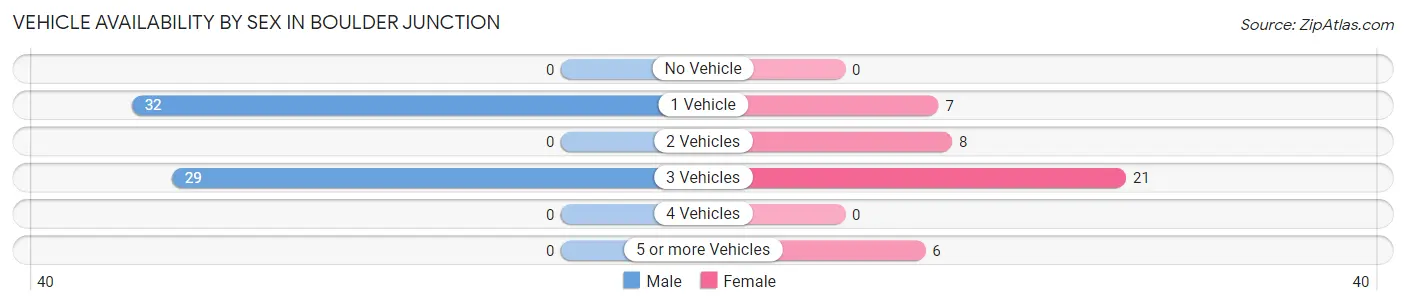
| Vehicles Available | Male | Female |
| No Vehicle | 0 (0.0%) | 0 (0.0%) |
| 1 Vehicle | 32 (52.5%) | 7 (16.7%) |
| 2 Vehicles | 0 (0.0%) | 8 (19.1%) |
| 3 Vehicles | 29 (47.5%) | 21 (50.0%) |
| 4 Vehicles | 0 (0.0%) | 0 (0.0%) |
| 5 or more Vehicles | 0 (0.0%) | 6 (14.3%) |
| Total | 61 (100.0%) | 42 (100.0%) |
Commute Time in Boulder Junction
The most frequently occuring commute durations in Boulder Junction are 5 to 9 minutes (19 commuters, 18.4%), 10 to 14 minutes (19 commuters, 18.4%), and 45 to 59 minutes (17 commuters, 16.5%).
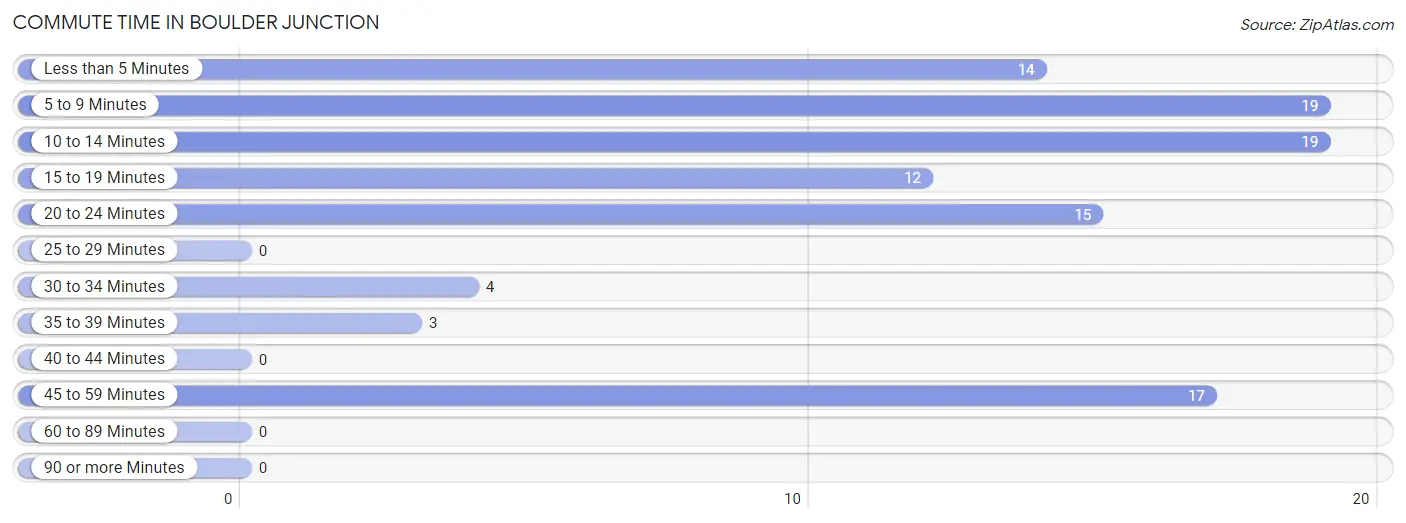
| Commute Time | # Commuters | % Commuters |
| Less than 5 Minutes | 14 | 13.6% |
| 5 to 9 Minutes | 19 | 18.4% |
| 10 to 14 Minutes | 19 | 18.4% |
| 15 to 19 Minutes | 12 | 11.7% |
| 20 to 24 Minutes | 15 | 14.6% |
| 25 to 29 Minutes | 0 | 0.0% |
| 30 to 34 Minutes | 4 | 3.9% |
| 35 to 39 Minutes | 3 | 2.9% |
| 40 to 44 Minutes | 0 | 0.0% |
| 45 to 59 Minutes | 17 | 16.5% |
| 60 to 89 Minutes | 0 | 0.0% |
| 90 or more Minutes | 0 | 0.0% |
Commute Time by Sex in Boulder Junction
The most common commute times in Boulder Junction are 10 to 14 minutes (19 commuters, 31.1%) for males and 5 to 9 minutes (12 commuters, 28.6%) for females.
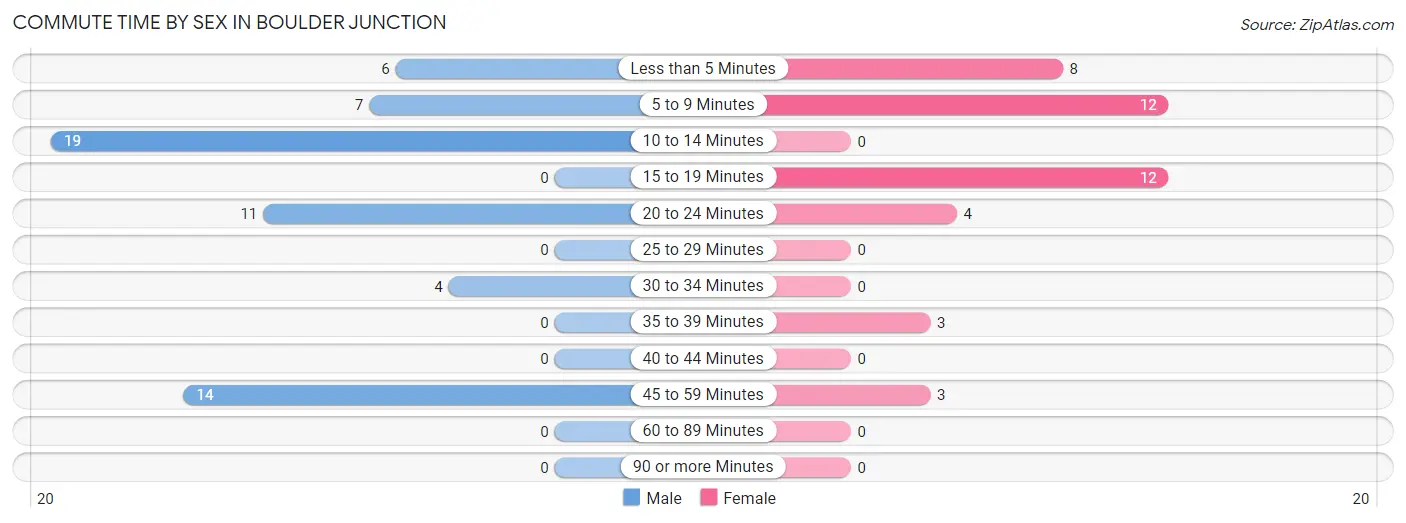
| Commute Time | Male | Female |
| Less than 5 Minutes | 6 (9.8%) | 8 (19.1%) |
| 5 to 9 Minutes | 7 (11.5%) | 12 (28.6%) |
| 10 to 14 Minutes | 19 (31.1%) | 0 (0.0%) |
| 15 to 19 Minutes | 0 (0.0%) | 12 (28.6%) |
| 20 to 24 Minutes | 11 (18.0%) | 4 (9.5%) |
| 25 to 29 Minutes | 0 (0.0%) | 0 (0.0%) |
| 30 to 34 Minutes | 4 (6.6%) | 0 (0.0%) |
| 35 to 39 Minutes | 0 (0.0%) | 3 (7.1%) |
| 40 to 44 Minutes | 0 (0.0%) | 0 (0.0%) |
| 45 to 59 Minutes | 14 (23.0%) | 3 (7.1%) |
| 60 to 89 Minutes | 0 (0.0%) | 0 (0.0%) |
| 90 or more Minutes | 0 (0.0%) | 0 (0.0%) |
Time of Departure to Work by Sex in Boulder Junction
The most frequent times of departure to work in Boulder Junction are 12:00 PM to 3:59 PM (33, 54.1%) for males and 10:00 AM to 10:59 AM (15, 35.7%) for females.
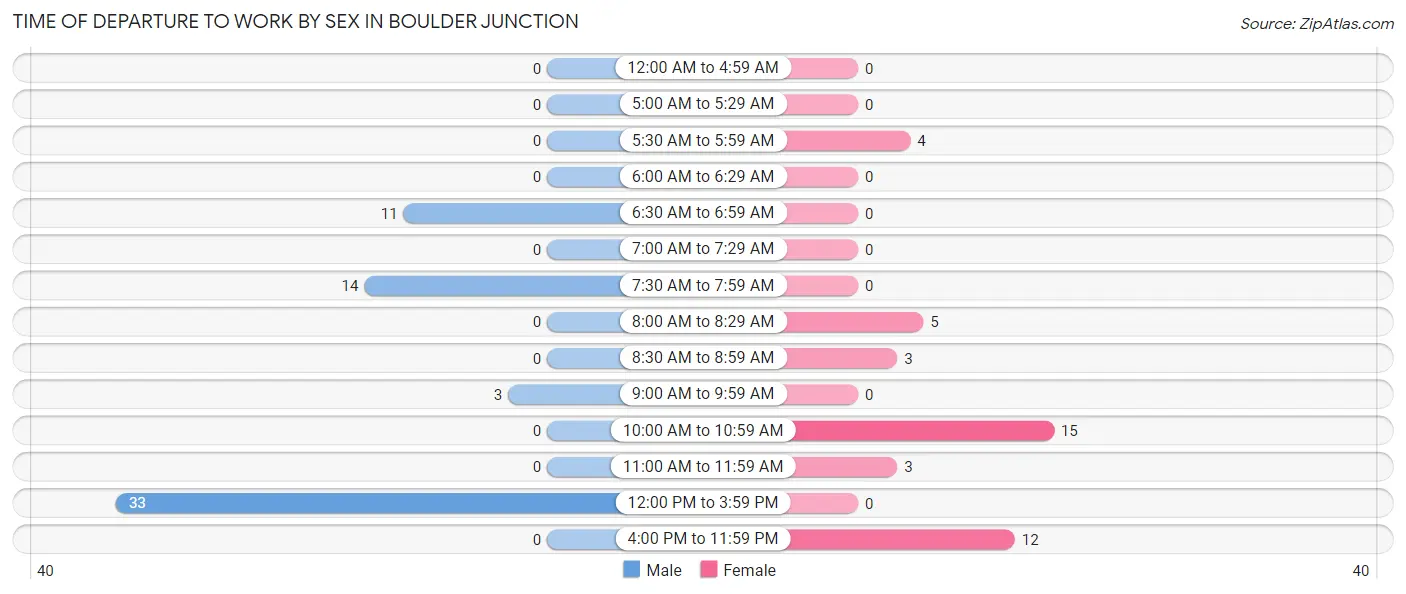
| Time of Departure | Male | Female |
| 12:00 AM to 4:59 AM | 0 (0.0%) | 0 (0.0%) |
| 5:00 AM to 5:29 AM | 0 (0.0%) | 0 (0.0%) |
| 5:30 AM to 5:59 AM | 0 (0.0%) | 4 (9.5%) |
| 6:00 AM to 6:29 AM | 0 (0.0%) | 0 (0.0%) |
| 6:30 AM to 6:59 AM | 11 (18.0%) | 0 (0.0%) |
| 7:00 AM to 7:29 AM | 0 (0.0%) | 0 (0.0%) |
| 7:30 AM to 7:59 AM | 14 (23.0%) | 0 (0.0%) |
| 8:00 AM to 8:29 AM | 0 (0.0%) | 5 (11.9%) |
| 8:30 AM to 8:59 AM | 0 (0.0%) | 3 (7.1%) |
| 9:00 AM to 9:59 AM | 3 (4.9%) | 0 (0.0%) |
| 10:00 AM to 10:59 AM | 0 (0.0%) | 15 (35.7%) |
| 11:00 AM to 11:59 AM | 0 (0.0%) | 3 (7.1%) |
| 12:00 PM to 3:59 PM | 33 (54.1%) | 0 (0.0%) |
| 4:00 PM to 11:59 PM | 0 (0.0%) | 12 (28.6%) |
| Total | 61 (100.0%) | 42 (100.0%) |
Housing Occupancy in Boulder Junction
Occupancy by Ownership in Boulder Junction
Of the total 110 dwellings in Boulder Junction, owner-occupied units account for 45 (40.9%), while renter-occupied units make up 65 (59.1%).
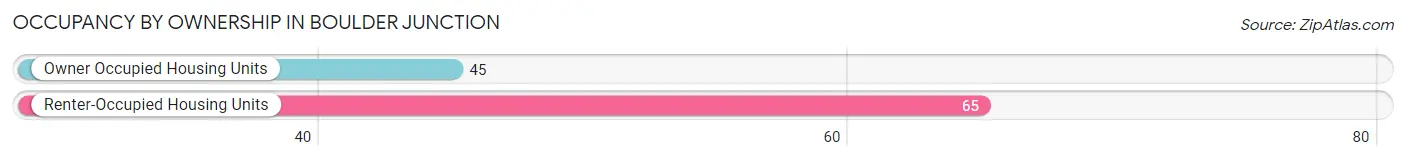
| Occupancy | # Housing Units | % Housing Units |
| Owner Occupied Housing Units | 45 | 40.9% |
| Renter-Occupied Housing Units | 65 | 59.1% |
| Total Occupied Housing Units | 110 | 100.0% |
Occupancy by Household Size in Boulder Junction
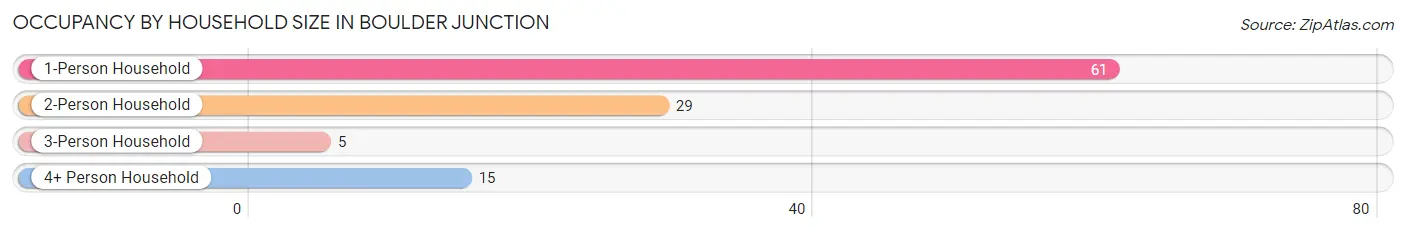
| Household Size | # Housing Units | % Housing Units |
| 1-Person Household | 61 | 55.4% |
| 2-Person Household | 29 | 26.4% |
| 3-Person Household | 5 | 4.5% |
| 4+ Person Household | 15 | 13.6% |
| Total Housing Units | 110 | 100.0% |
Occupancy by Ownership by Household Size in Boulder Junction
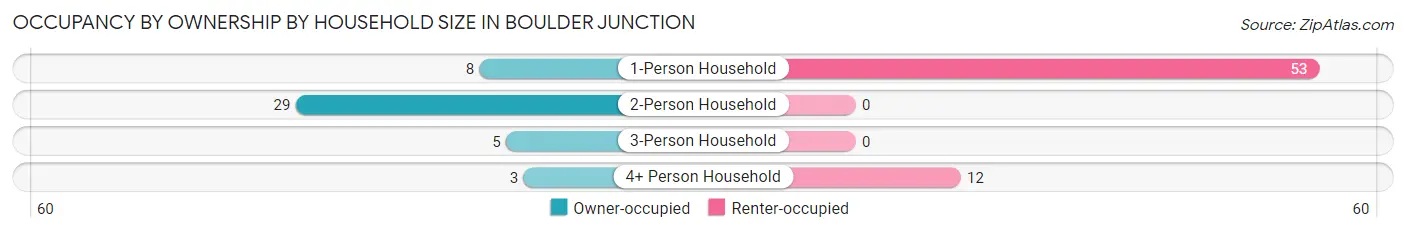
| Household Size | Owner-occupied | Renter-occupied |
| 1-Person Household | 8 (13.1%) | 53 (86.9%) |
| 2-Person Household | 29 (100.0%) | 0 (0.0%) |
| 3-Person Household | 5 (100.0%) | 0 (0.0%) |
| 4+ Person Household | 3 (20.0%) | 12 (80.0%) |
| Total Housing Units | 45 (40.9%) | 65 (59.1%) |
Occupancy by Educational Attainment in Boulder Junction
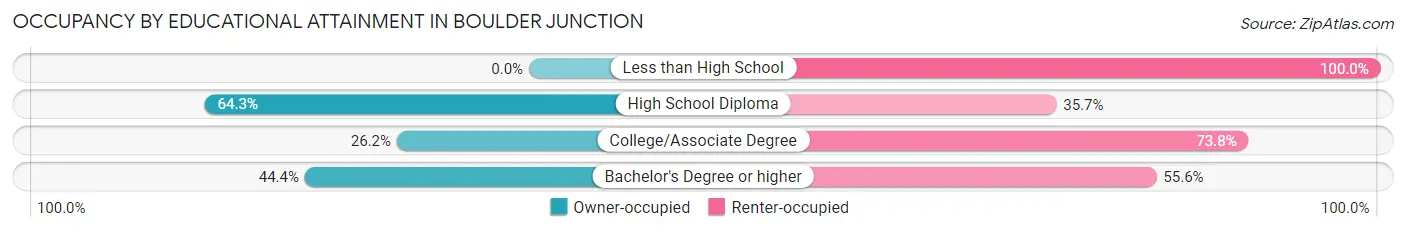
| Household Size | Owner-occupied | Renter-occupied |
| Less than High School | 0 (0.0%) | 4 (100.0%) |
| High School Diploma | 18 (64.3%) | 10 (35.7%) |
| College/Associate Degree | 11 (26.2%) | 31 (73.8%) |
| Bachelor's Degree or higher | 16 (44.4%) | 20 (55.6%) |
Occupancy by Age of Householder in Boulder Junction
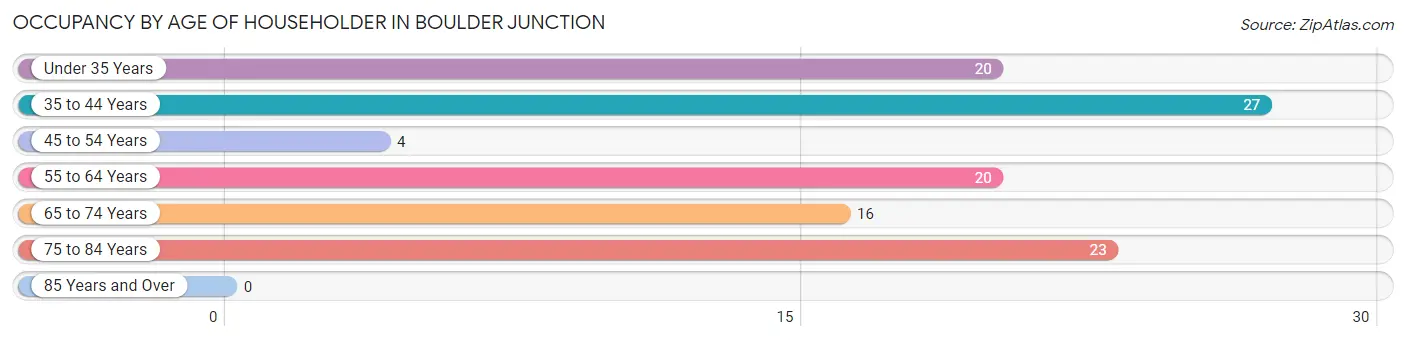
| Age Bracket | # Households | % Households |
| Under 35 Years | 20 | 18.2% |
| 35 to 44 Years | 27 | 24.5% |
| 45 to 54 Years | 4 | 3.6% |
| 55 to 64 Years | 20 | 18.2% |
| 65 to 74 Years | 16 | 14.5% |
| 75 to 84 Years | 23 | 20.9% |
| 85 Years and Over | 0 | 0.0% |
| Total | 110 | 100.0% |
Housing Finances in Boulder Junction
Median Income by Occupancy in Boulder Junction
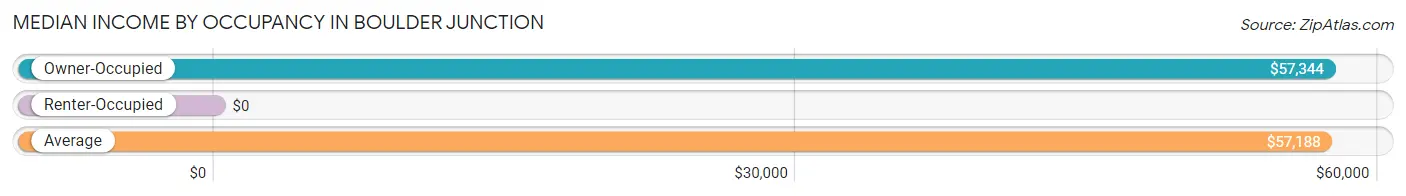
| Occupancy Type | # Households | Median Income |
| Owner-Occupied | 45 (40.9%) | $57,344 |
| Renter-Occupied | 65 (59.1%) | $0 |
| Average | 110 (100.0%) | $57,188 |
Occupancy by Householder Income Bracket in Boulder Junction
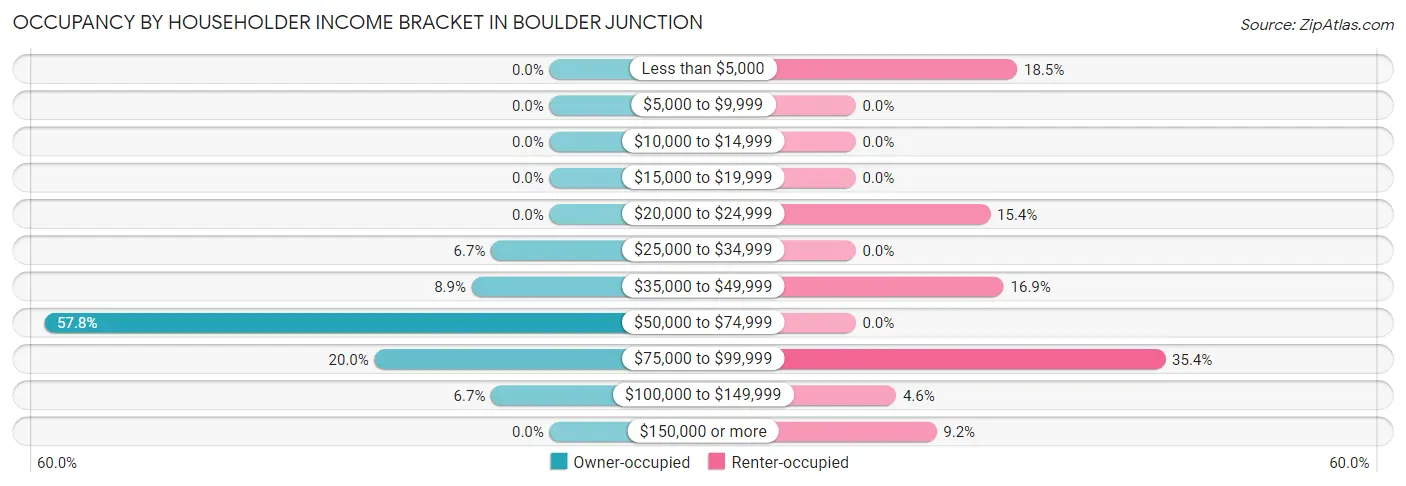
| Income Bracket | Owner-occupied | Renter-occupied |
| Less than $5,000 | 0 (0.0%) | 12 (18.5%) |
| $5,000 to $9,999 | 0 (0.0%) | 0 (0.0%) |
| $10,000 to $14,999 | 0 (0.0%) | 0 (0.0%) |
| $15,000 to $19,999 | 0 (0.0%) | 0 (0.0%) |
| $20,000 to $24,999 | 0 (0.0%) | 10 (15.4%) |
| $25,000 to $34,999 | 3 (6.7%) | 0 (0.0%) |
| $35,000 to $49,999 | 4 (8.9%) | 11 (16.9%) |
| $50,000 to $74,999 | 26 (57.8%) | 0 (0.0%) |
| $75,000 to $99,999 | 9 (20.0%) | 23 (35.4%) |
| $100,000 to $149,999 | 3 (6.7%) | 3 (4.6%) |
| $150,000 or more | 0 (0.0%) | 6 (9.2%) |
| Total | 45 (100.0%) | 65 (100.0%) |
Monthly Housing Cost Tiers in Boulder Junction
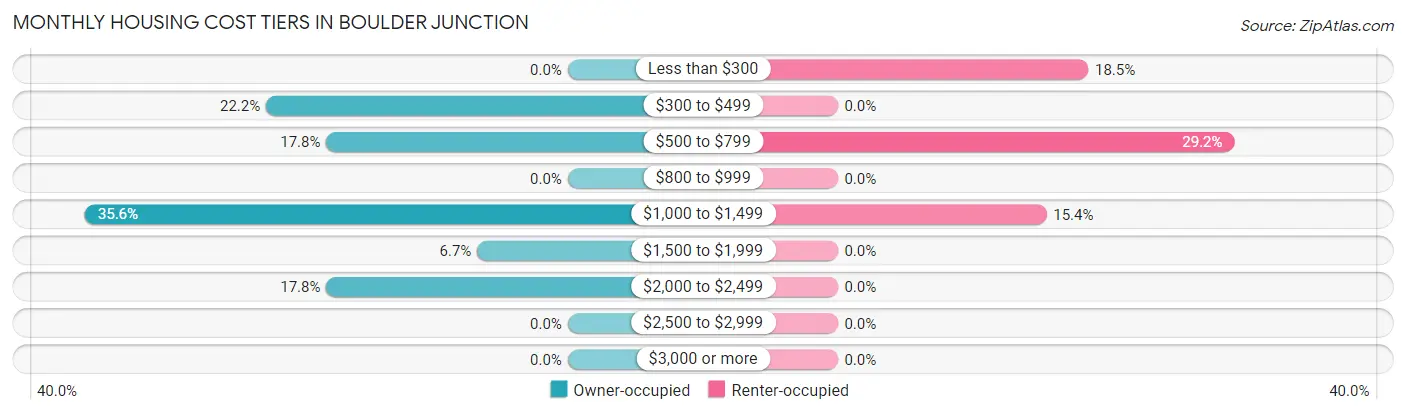
| Monthly Cost | Owner-occupied | Renter-occupied |
| Less than $300 | 0 (0.0%) | 12 (18.5%) |
| $300 to $499 | 10 (22.2%) | 0 (0.0%) |
| $500 to $799 | 8 (17.8%) | 19 (29.2%) |
| $800 to $999 | 0 (0.0%) | 0 (0.0%) |
| $1,000 to $1,499 | 16 (35.6%) | 10 (15.4%) |
| $1,500 to $1,999 | 3 (6.7%) | 0 (0.0%) |
| $2,000 to $2,499 | 8 (17.8%) | 0 (0.0%) |
| $2,500 to $2,999 | 0 (0.0%) | 0 (0.0%) |
| $3,000 or more | 0 (0.0%) | 0 (0.0%) |
| Total | 45 (100.0%) | 65 (100.0%) |
Physical Housing Characteristics in Boulder Junction
Housing Structures in Boulder Junction
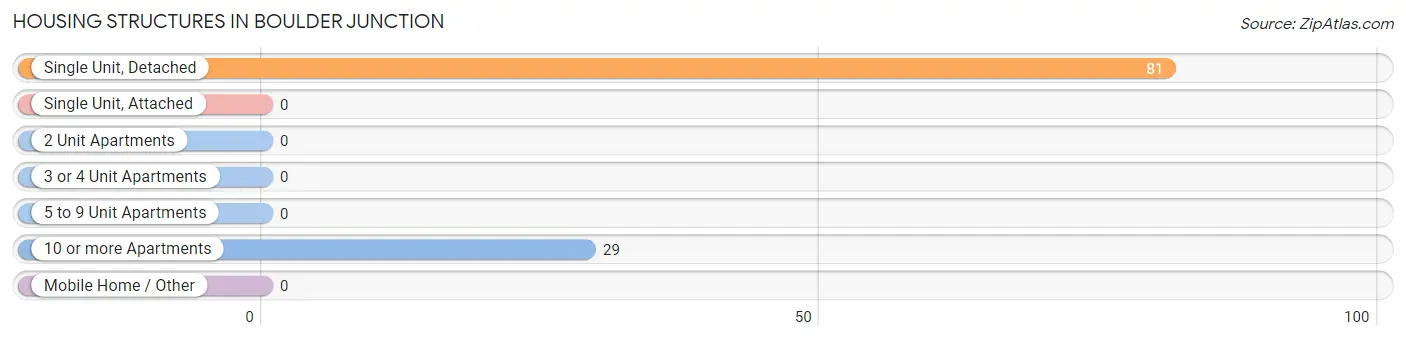
| Structure Type | # Housing Units | % Housing Units |
| Single Unit, Detached | 81 | 73.6% |
| Single Unit, Attached | 0 | 0.0% |
| 2 Unit Apartments | 0 | 0.0% |
| 3 or 4 Unit Apartments | 0 | 0.0% |
| 5 to 9 Unit Apartments | 0 | 0.0% |
| 10 or more Apartments | 29 | 26.4% |
| Mobile Home / Other | 0 | 0.0% |
| Total | 110 | 100.0% |
Housing Structures by Occupancy in Boulder Junction
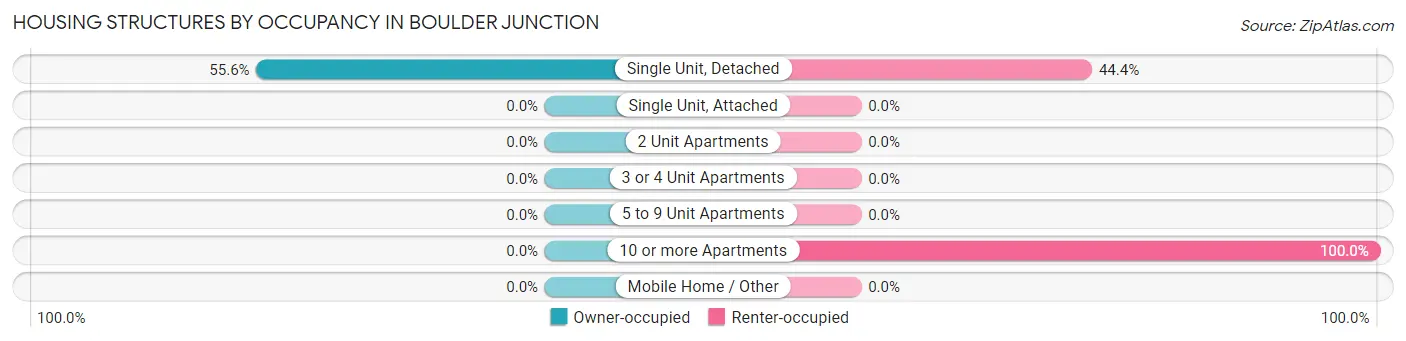
| Structure Type | Owner-occupied | Renter-occupied |
| Single Unit, Detached | 45 (55.6%) | 36 (44.4%) |
| Single Unit, Attached | 0 (0.0%) | 0 (0.0%) |
| 2 Unit Apartments | 0 (0.0%) | 0 (0.0%) |
| 3 or 4 Unit Apartments | 0 (0.0%) | 0 (0.0%) |
| 5 to 9 Unit Apartments | 0 (0.0%) | 0 (0.0%) |
| 10 or more Apartments | 0 (0.0%) | 29 (100.0%) |
| Mobile Home / Other | 0 (0.0%) | 0 (0.0%) |
| Total | 45 (40.9%) | 65 (59.1%) |
Housing Structures by Number of Rooms in Boulder Junction
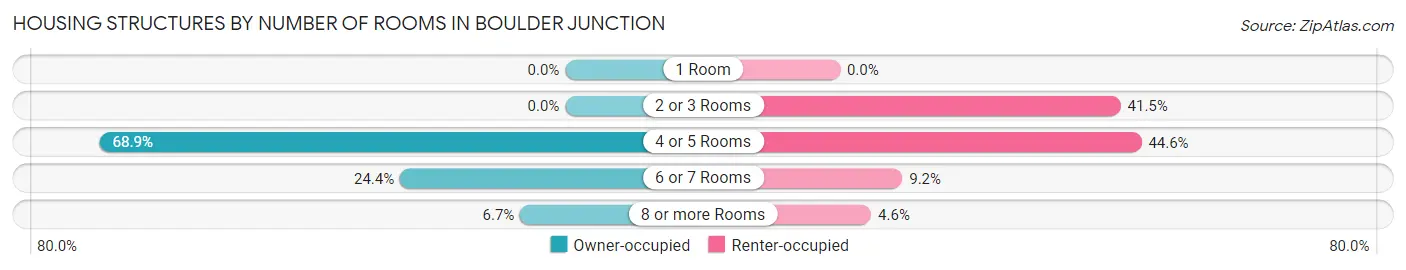
| Number of Rooms | Owner-occupied | Renter-occupied |
| 1 Room | 0 (0.0%) | 0 (0.0%) |
| 2 or 3 Rooms | 0 (0.0%) | 27 (41.5%) |
| 4 or 5 Rooms | 31 (68.9%) | 29 (44.6%) |
| 6 or 7 Rooms | 11 (24.4%) | 6 (9.2%) |
| 8 or more Rooms | 3 (6.7%) | 3 (4.6%) |
| Total | 45 (100.0%) | 65 (100.0%) |
Housing Structure by Heating Type in Boulder Junction
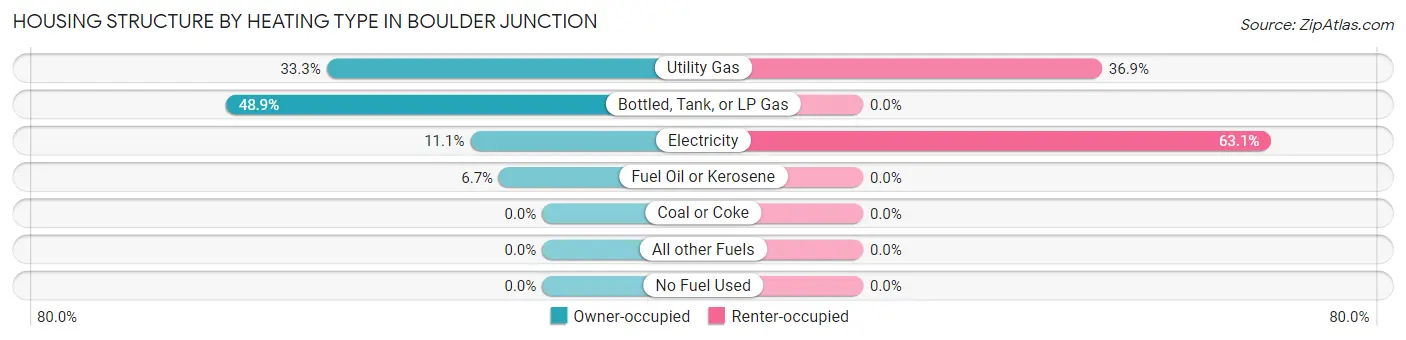
| Heating Type | Owner-occupied | Renter-occupied |
| Utility Gas | 15 (33.3%) | 24 (36.9%) |
| Bottled, Tank, or LP Gas | 22 (48.9%) | 0 (0.0%) |
| Electricity | 5 (11.1%) | 41 (63.1%) |
| Fuel Oil or Kerosene | 3 (6.7%) | 0 (0.0%) |
| Coal or Coke | 0 (0.0%) | 0 (0.0%) |
| All other Fuels | 0 (0.0%) | 0 (0.0%) |
| No Fuel Used | 0 (0.0%) | 0 (0.0%) |
| Total | 45 (100.0%) | 65 (100.0%) |
Household Vehicle Usage in Boulder Junction
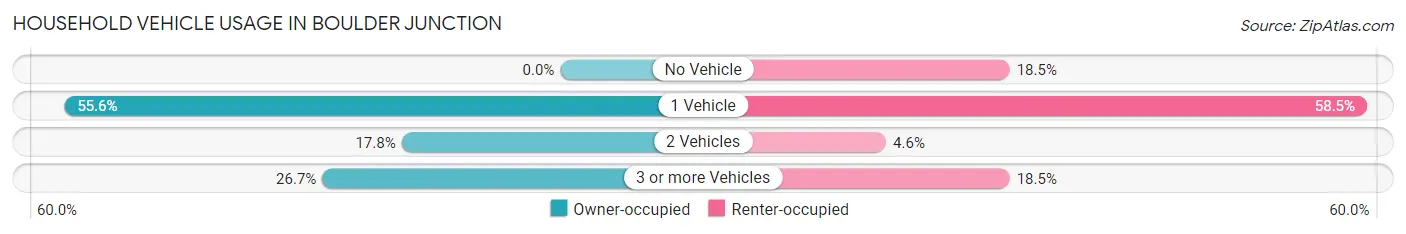
| Vehicles per Household | Owner-occupied | Renter-occupied |
| No Vehicle | 0 (0.0%) | 12 (18.5%) |
| 1 Vehicle | 25 (55.6%) | 38 (58.5%) |
| 2 Vehicles | 8 (17.8%) | 3 (4.6%) |
| 3 or more Vehicles | 12 (26.7%) | 12 (18.5%) |
| Total | 45 (100.0%) | 65 (100.0%) |
Real Estate & Mortgages in Boulder Junction
Real Estate and Mortgage Overview in Boulder Junction
| Characteristic | Without Mortgage | With Mortgage |
| Housing Units | 18 | 27 |
| Median Property Value | - | - |
| Median Household Income | - | - |
| Monthly Housing Costs | - | - |
| Real Estate Taxes | - | - |
Property Value by Mortgage Status in Boulder Junction
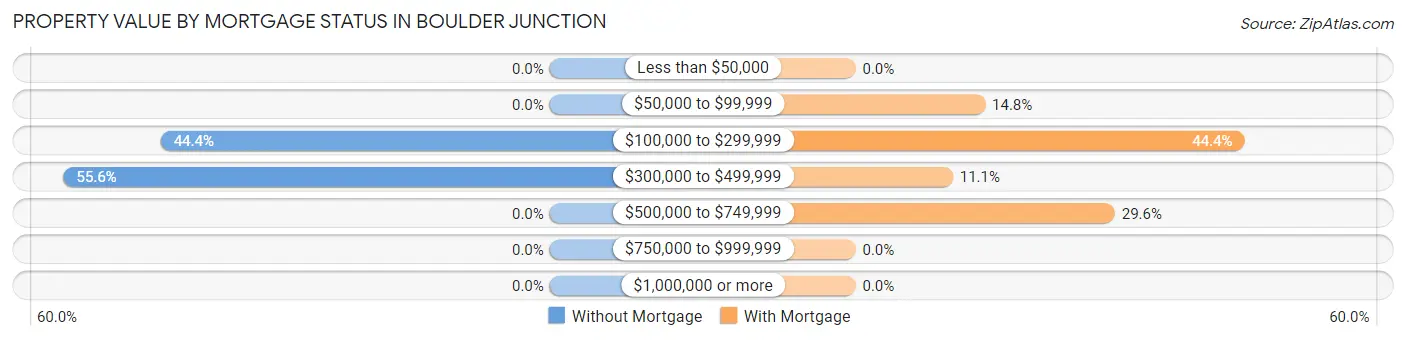
| Property Value | Without Mortgage | With Mortgage |
| Less than $50,000 | 0 (0.0%) | 0 (0.0%) |
| $50,000 to $99,999 | 0 (0.0%) | 4 (14.8%) |
| $100,000 to $299,999 | 8 (44.4%) | 12 (44.4%) |
| $300,000 to $499,999 | 10 (55.6%) | 3 (11.1%) |
| $500,000 to $749,999 | 0 (0.0%) | 8 (29.6%) |
| $750,000 to $999,999 | 0 (0.0%) | 0 (0.0%) |
| $1,000,000 or more | 0 (0.0%) | 0 (0.0%) |
| Total | 18 (100.0%) | 27 (100.0%) |
Household Income by Mortgage Status in Boulder Junction
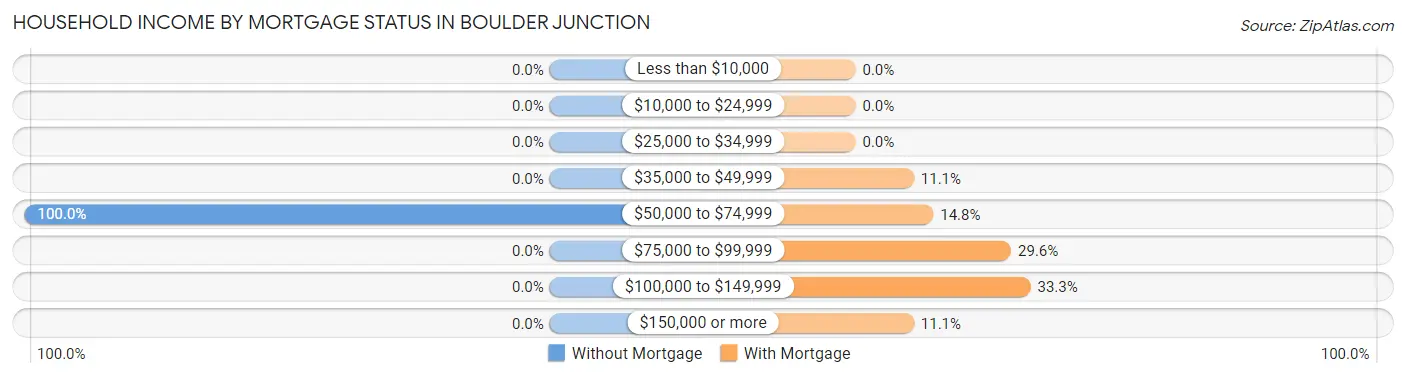
| Household Income | Without Mortgage | With Mortgage |
| Less than $10,000 | 0 (0.0%) | 0 (0.0%) |
| $10,000 to $24,999 | 0 (0.0%) | 0 (0.0%) |
| $25,000 to $34,999 | 0 (0.0%) | 0 (0.0%) |
| $35,000 to $49,999 | 0 (0.0%) | 3 (11.1%) |
| $50,000 to $74,999 | 18 (100.0%) | 4 (14.8%) |
| $75,000 to $99,999 | 0 (0.0%) | 8 (29.6%) |
| $100,000 to $149,999 | 0 (0.0%) | 9 (33.3%) |
| $150,000 or more | 0 (0.0%) | 3 (11.1%) |
| Total | 18 (100.0%) | 27 (100.0%) |
Property Value to Household Income Ratio in Boulder Junction
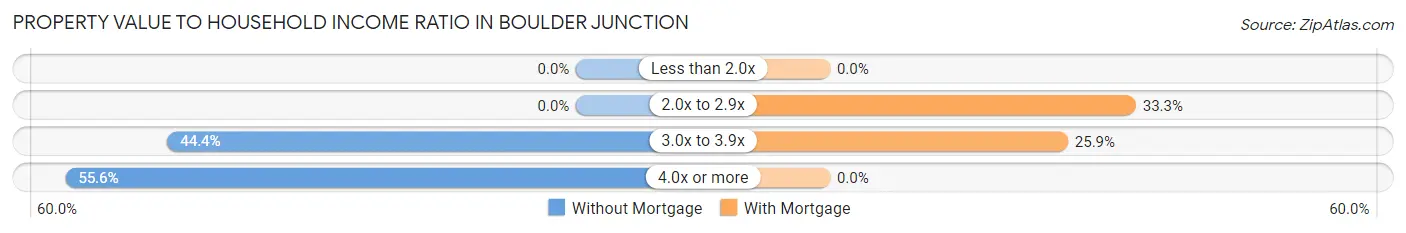
| Value-to-Income Ratio | Without Mortgage | With Mortgage |
| Less than 2.0x | 0 (0.0%) | 0 (0.0%) |
| 2.0x to 2.9x | 0 (0.0%) | 9 (33.3%) |
| 3.0x to 3.9x | 8 (44.4%) | 7 (25.9%) |
| 4.0x or more | 10 (55.6%) | 0 (0.0%) |
| Total | 18 (100.0%) | 27 (100.0%) |
Real Estate Taxes by Mortgage Status in Boulder Junction
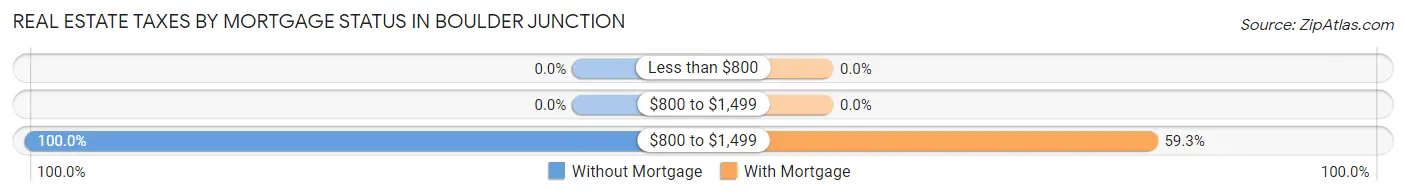
| Property Taxes | Without Mortgage | With Mortgage |
| Less than $800 | 0 (0.0%) | 0 (0.0%) |
| $800 to $1,499 | 0 (0.0%) | 0 (0.0%) |
| $800 to $1,499 | 18 (100.0%) | 16 (59.3%) |
| Total | 18 (100.0%) | 27 (100.0%) |
Health & Disability in Boulder Junction
Health Insurance Coverage by Age in Boulder Junction
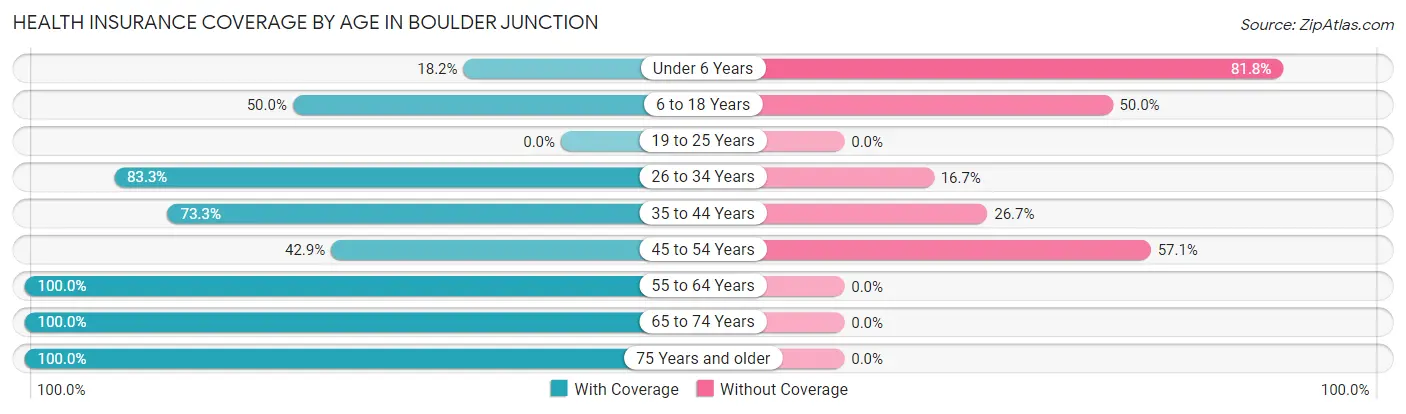
| Age Bracket | With Coverage | Without Coverage |
| Under 6 Years | 4 (18.2%) | 18 (81.8%) |
| 6 to 18 Years | 11 (50.0%) | 11 (50.0%) |
| 19 to 25 Years | 0 (0.0%) | 0 (0.0%) |
| 26 to 34 Years | 20 (83.3%) | 4 (16.7%) |
| 35 to 44 Years | 33 (73.3%) | 12 (26.7%) |
| 45 to 54 Years | 3 (42.9%) | 4 (57.1%) |
| 55 to 64 Years | 24 (100.0%) | 0 (0.0%) |
| 65 to 74 Years | 29 (100.0%) | 0 (0.0%) |
| 75 Years and older | 31 (100.0%) | 0 (0.0%) |
| Total | 155 (76.0%) | 49 (24.0%) |
Health Insurance Coverage by Citizenship Status in Boulder Junction
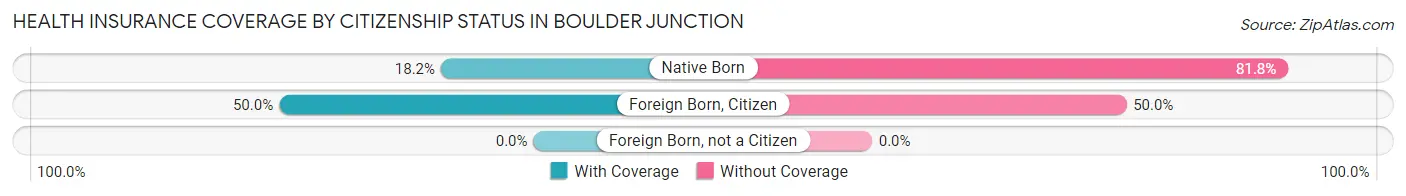
| Citizenship Status | With Coverage | Without Coverage |
| Native Born | 4 (18.2%) | 18 (81.8%) |
| Foreign Born, Citizen | 11 (50.0%) | 11 (50.0%) |
| Foreign Born, not a Citizen | 0 (0.0%) | 0 (0.0%) |
Health Insurance Coverage by Household Income in Boulder Junction
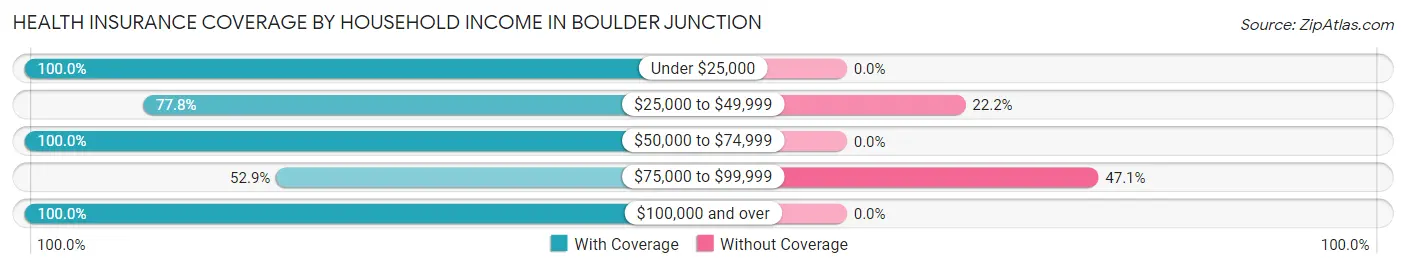
| Household Income | With Coverage | Without Coverage |
| Under $25,000 | 22 (100.0%) | 0 (0.0%) |
| $25,000 to $49,999 | 28 (77.8%) | 8 (22.2%) |
| $50,000 to $74,999 | 45 (100.0%) | 0 (0.0%) |
| $75,000 to $99,999 | 46 (52.9%) | 41 (47.1%) |
| $100,000 and over | 14 (100.0%) | 0 (0.0%) |
Public vs Private Health Insurance Coverage by Age in Boulder Junction
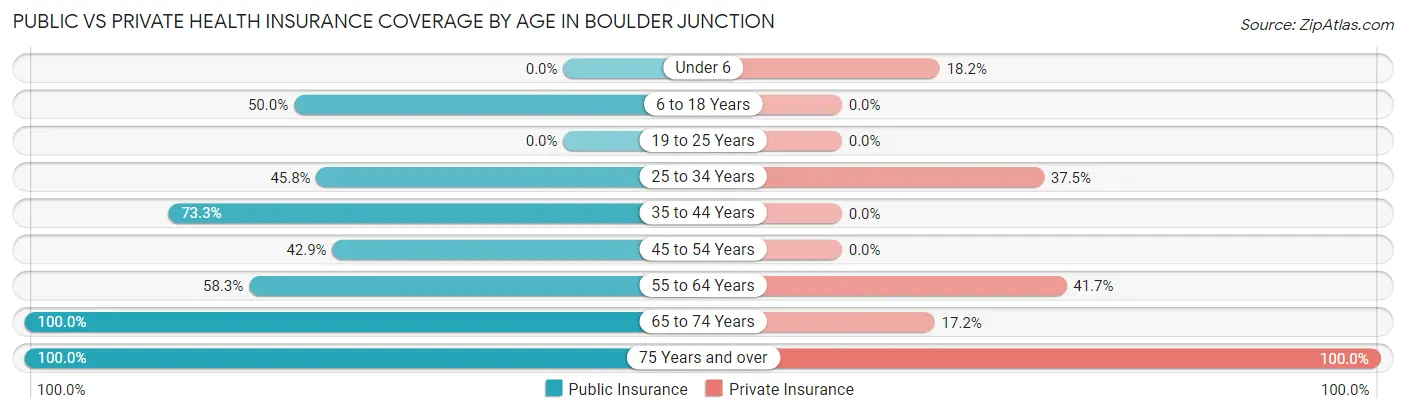
| Age Bracket | Public Insurance | Private Insurance |
| Under 6 | 0 (0.0%) | 4 (18.2%) |
| 6 to 18 Years | 11 (50.0%) | 0 (0.0%) |
| 19 to 25 Years | 0 (0.0%) | 0 (0.0%) |
| 25 to 34 Years | 11 (45.8%) | 9 (37.5%) |
| 35 to 44 Years | 33 (73.3%) | 0 (0.0%) |
| 45 to 54 Years | 3 (42.9%) | 0 (0.0%) |
| 55 to 64 Years | 14 (58.3%) | 10 (41.7%) |
| 65 to 74 Years | 29 (100.0%) | 5 (17.2%) |
| 75 Years and over | 31 (100.0%) | 31 (100.0%) |
| Total | 132 (64.7%) | 59 (28.9%) |
Disability Status by Sex by Age in Boulder Junction
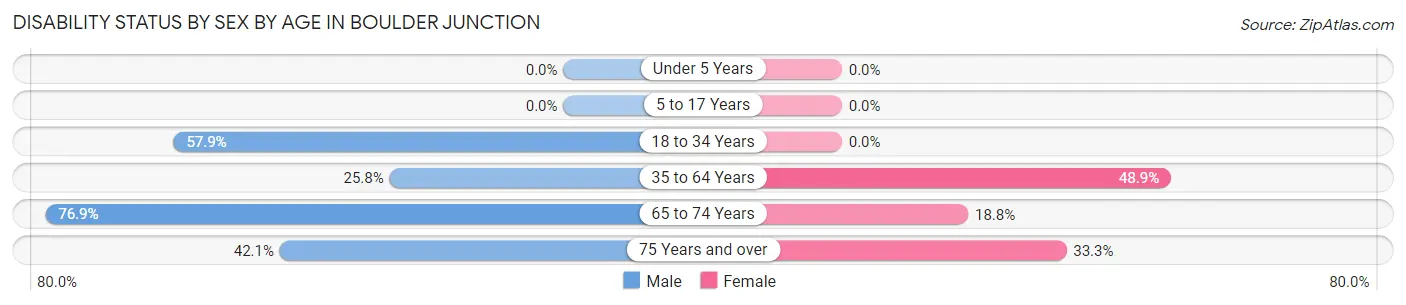
| Age Bracket | Male | Female |
| Under 5 Years | 0 (0.0%) | 0 (0.0%) |
| 5 to 17 Years | 0 (0.0%) | 0 (0.0%) |
| 18 to 34 Years | 11 (57.9%) | 0 (0.0%) |
| 35 to 64 Years | 8 (25.8%) | 22 (48.9%) |
| 65 to 74 Years | 10 (76.9%) | 3 (18.8%) |
| 75 Years and over | 8 (42.1%) | 4 (33.3%) |
Disability Class by Sex by Age in Boulder Junction
Disability Class: Hearing Difficulty
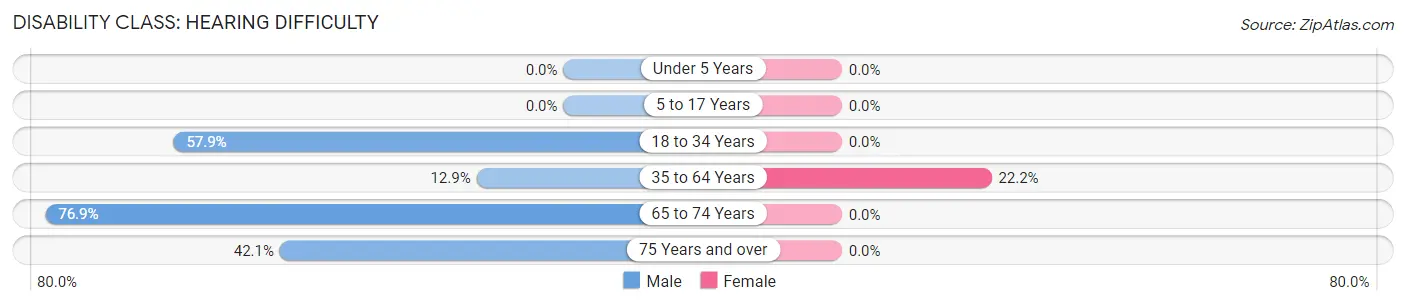
| Age Bracket | Male | Female |
| Under 5 Years | 0 (0.0%) | 0 (0.0%) |
| 5 to 17 Years | 0 (0.0%) | 0 (0.0%) |
| 18 to 34 Years | 11 (57.9%) | 0 (0.0%) |
| 35 to 64 Years | 4 (12.9%) | 10 (22.2%) |
| 65 to 74 Years | 10 (76.9%) | 0 (0.0%) |
| 75 Years and over | 8 (42.1%) | 0 (0.0%) |
Disability Class: Vision Difficulty
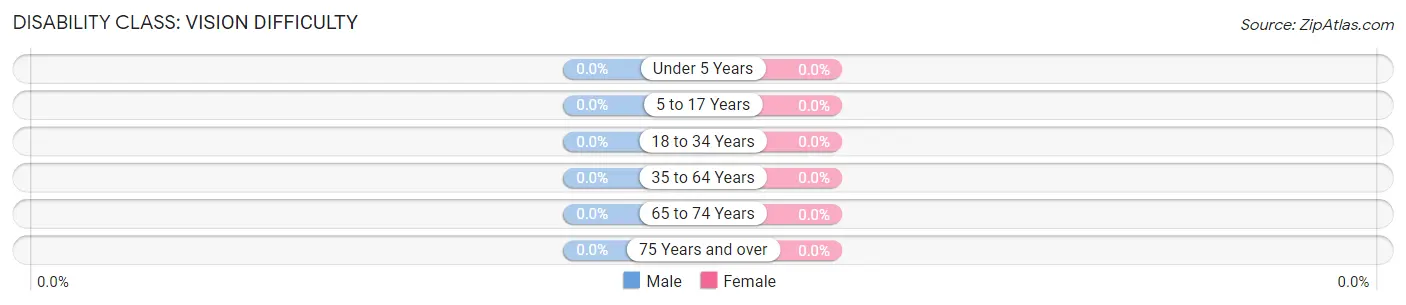
| Age Bracket | Male | Female |
| Under 5 Years | 0 (0.0%) | 0 (0.0%) |
| 5 to 17 Years | 0 (0.0%) | 0 (0.0%) |
| 18 to 34 Years | 0 (0.0%) | 0 (0.0%) |
| 35 to 64 Years | 0 (0.0%) | 0 (0.0%) |
| 65 to 74 Years | 0 (0.0%) | 0 (0.0%) |
| 75 Years and over | 0 (0.0%) | 0 (0.0%) |
Disability Class: Cognitive Difficulty
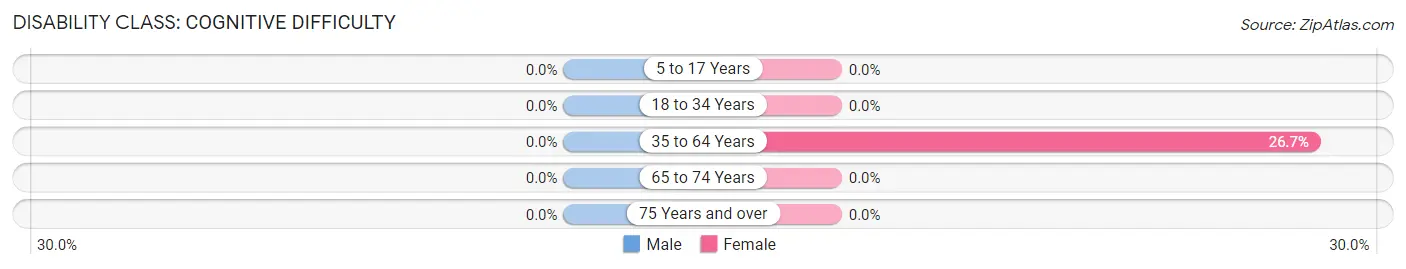
| Age Bracket | Male | Female |
| 5 to 17 Years | 0 (0.0%) | 0 (0.0%) |
| 18 to 34 Years | 0 (0.0%) | 0 (0.0%) |
| 35 to 64 Years | 0 (0.0%) | 12 (26.7%) |
| 65 to 74 Years | 0 (0.0%) | 0 (0.0%) |
| 75 Years and over | 0 (0.0%) | 0 (0.0%) |
Disability Class: Ambulatory Difficulty
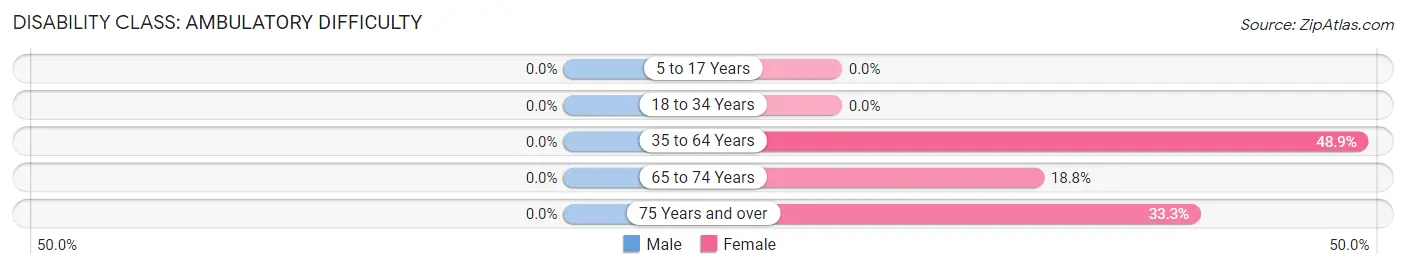
| Age Bracket | Male | Female |
| 5 to 17 Years | 0 (0.0%) | 0 (0.0%) |
| 18 to 34 Years | 0 (0.0%) | 0 (0.0%) |
| 35 to 64 Years | 0 (0.0%) | 22 (48.9%) |
| 65 to 74 Years | 0 (0.0%) | 3 (18.8%) |
| 75 Years and over | 0 (0.0%) | 4 (33.3%) |
Disability Class: Self-Care Difficulty
| Age Bracket | Male | Female |
| 5 to 17 Years | 0 (0.0%) | 0 (0.0%) |
| 18 to 34 Years | 0 (0.0%) | 0 (0.0%) |
| 35 to 64 Years | 0 (0.0%) | 0 (0.0%) |
| 65 to 74 Years | 0 (0.0%) | 0 (0.0%) |
| 75 Years and over | 0 (0.0%) | 0 (0.0%) |
Technology Access in Boulder Junction
Computing Device Access in Boulder Junction
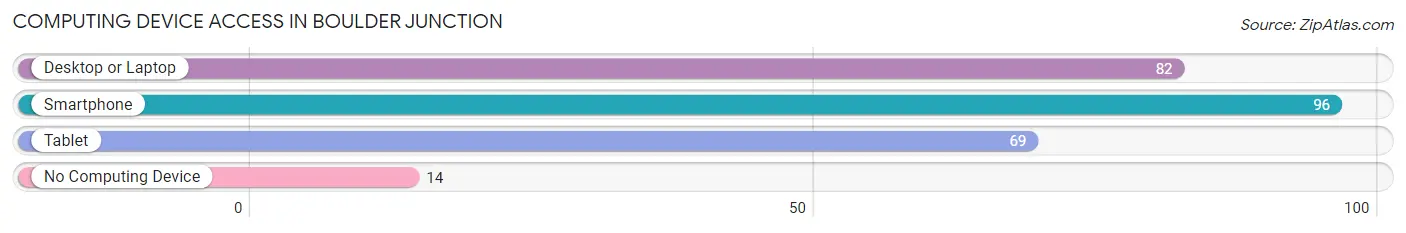
| Device Type | # Households | % Households |
| Desktop or Laptop | 82 | 74.6% |
| Smartphone | 96 | 87.3% |
| Tablet | 69 | 62.7% |
| No Computing Device | 14 | 12.7% |
| Total | 110 | 100.0% |
Internet Access in Boulder Junction
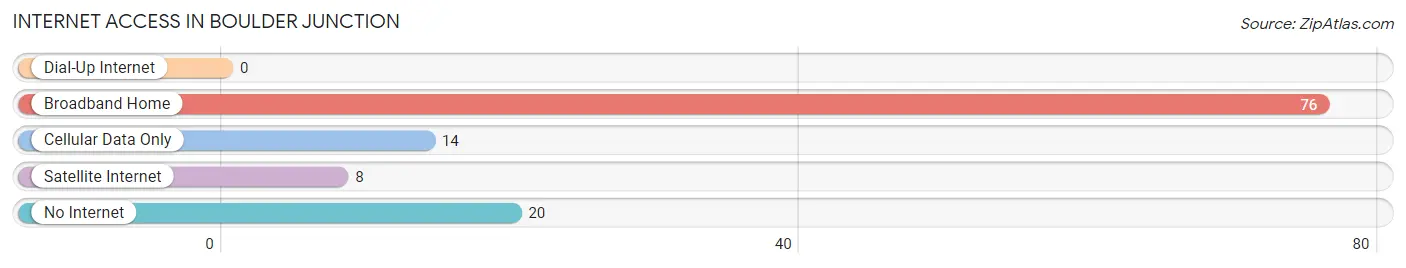
| Internet Type | # Households | % Households |
| Dial-Up Internet | 0 | 0.0% |
| Broadband Home | 76 | 69.1% |
| Cellular Data Only | 14 | 12.7% |
| Satellite Internet | 8 | 7.3% |
| No Internet | 20 | 18.2% |
| Total | 110 | 100.0% |
Boulder Junction Summary
Boulder Junction, Wisconsin is a small town located in Vilas County in the north-central part of the state. It is situated on the banks of the Manitowish River and is surrounded by the Chequamegon-Nicolet National Forest. The town was founded in the late 1800s and has a population of approximately 500 people.
History
Boulder Junction was founded in the late 1800s by a group of lumberjacks who were looking for a place to settle down. The town was named after the large boulders that were found in the area. The first settlers built a sawmill and a general store, and the town quickly grew. By the early 1900s, the town had a post office, a school, and several other businesses.
In the 1920s, the town began to attract tourists who were looking to enjoy the outdoors. The area was known for its excellent fishing and hunting, and the town soon became a popular destination for vacationers. In the 1950s, the town began to attract more permanent residents, and the population began to grow.
Geography
Boulder Junction is located in Vilas County in the north-central part of Wisconsin. It is situated on the banks of the Manitowish River and is surrounded by the Chequamegon-Nicolet National Forest. The town is located approximately 30 miles north of Minocqua and 40 miles west of Rhinelander.
The town is located in a heavily forested area, and the terrain is mostly flat. The area is known for its lakes, rivers, and streams, and the town is surrounded by several large lakes, including Trout Lake, Big Lake, and Little Lake.
Economy
The economy of Boulder Junction is largely based on tourism. The town is a popular destination for outdoor enthusiasts, and it is known for its excellent fishing and hunting. The town also has several restaurants, bars, and shops that cater to tourists.
In addition to tourism, the town also has several small businesses, including a sawmill, a general store, and a post office. The town also has a few small manufacturing businesses, including a furniture factory and a woodworking shop.
Demographics
As of the 2010 census, the population of Boulder Junction was 498 people. The town is predominantly white, with 95.2% of the population identifying as white. The median household income is $41,250, and the median age is 48.7 years.
Conclusion
Boulder Junction, Wisconsin is a small town located in Vilas County in the north-central part of the state. It was founded in the late 1800s and has a population of approximately 500 people. The town is known for its excellent fishing and hunting, and it is a popular destination for outdoor enthusiasts. The economy of Boulder Junction is largely based on tourism, and the town also has several small businesses. The population of Boulder Junction is predominantly white, with a median household income of $41,250 and a median age of 48.7 years.
Common Questions
What is Per Capita Income in Boulder Junction?
Per Capita income in Boulder Junction is $35,311.
What is the Median Family Income in Boulder Junction?
Median Family Income in Boulder Junction is $69,875.
What is the Median Household income in Boulder Junction?
Median Household Income in Boulder Junction is $57,188.
What is Income or Wage Gap in Boulder Junction?
Income or Wage Gap in Boulder Junction is 21.4%.
Women in Boulder Junction earn 78.6 cents for every dollar earned by a man.
What is Inequality or Gini Index in Boulder Junction?
Inequality or Gini Index in Boulder Junction is 0.35.
What is the Total Population of Boulder Junction?
Total Population of Boulder Junction is 204.
What is the Total Male Population of Boulder Junction?
Total Male Population of Boulder Junction is 115.
What is the Total Female Population of Boulder Junction?
Total Female Population of Boulder Junction is 89.
What is the Ratio of Males per 100 Females in Boulder Junction?
There are 129.21 Males per 100 Females in Boulder Junction.
What is the Ratio of Females per 100 Males in Boulder Junction?
There are 77.39 Females per 100 Males in Boulder Junction.
What is the Median Population Age in Boulder Junction?
Median Population Age in Boulder Junction is 44.2 Years.
What is the Average Family Size in Boulder Junction
Average Family Size in Boulder Junction is 3.1 People.
What is the Average Household Size in Boulder Junction
Average Household Size in Boulder Junction is 1.9 People.
How Large is the Labor Force in Boulder Junction?
There are 103 People in the Labor Forcein in Boulder Junction.
What is the Percentage of People in the Labor Force in Boulder Junction?
59.2% of People are in the Labor Force in Boulder Junction.