Bloomington, WI Map & Demographics
Bloomington Map
Bloomington Overview
$31,979
PER CAPITA INCOME
$75,893
AVG FAMILY INCOME
$67,768
AVG HOUSEHOLD INCOME
27.4%
WAGE / INCOME GAP [ % ]
72.6¢/ $1
WAGE / INCOME GAP [ $ ]
0.39
INEQUALITY / GINI INDEX
751
TOTAL POPULATION
356
MALE POPULATION
395
FEMALE POPULATION
90.13
MALES / 100 FEMALES
110.96
FEMALES / 100 MALES
38.8
MEDIAN AGE
2.9
AVG FAMILY SIZE
2.5
AVG HOUSEHOLD SIZE
399
LABOR FORCE [ PEOPLE ]
72.4%
PERCENT IN LABOR FORCE
1.5%
UNEMPLOYMENT RATE
Bloomington Zip Codes
Bloomington Area Codes
Income in Bloomington
Income Overview in Bloomington
Per Capita Income in Bloomington is $31,979, while median incomes of families and households are $75,893 and $67,768 respectively.
| Characteristic | Number | Measure |
| Per Capita Income | 751 | $31,979 |
| Median Family Income | 223 | $75,893 |
| Mean Family Income | 223 | $91,727 |
| Median Household Income | 297 | $67,768 |
| Mean Household Income | 297 | $79,676 |
| Income Deficit | 223 | $0 |
| Wage / Income Gap (%) | 751 | 27.43% |
| Wage / Income Gap ($) | 751 | 72.57¢ per $1 |
| Gini / Inequality Index | 751 | 0.39 |
Earnings by Sex in Bloomington
Average Earnings in Bloomington are $37,639, $45,648 for men and $33,125 for women, a difference of 27.4%.
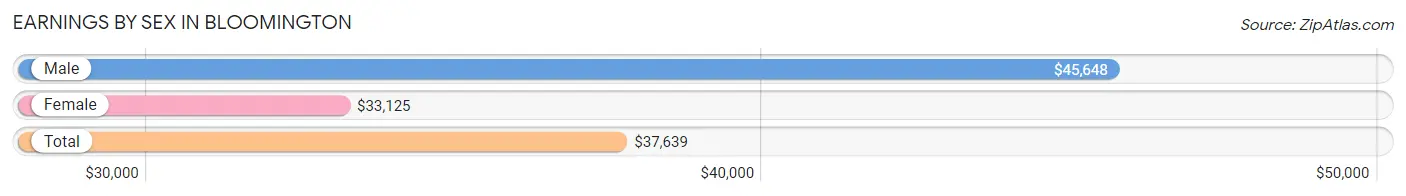
| Sex | Number | Average Earnings |
| Male | 196 (48.5%) | $45,648 |
| Female | 208 (51.5%) | $33,125 |
| Total | 404 (100.0%) | $37,639 |
Earnings by Sex by Income Bracket in Bloomington
The most common earnings brackets in Bloomington are $55,000 to $64,999 for men (35 | 17.9%) and $30,000 to $34,999 for women (50 | 24.0%).
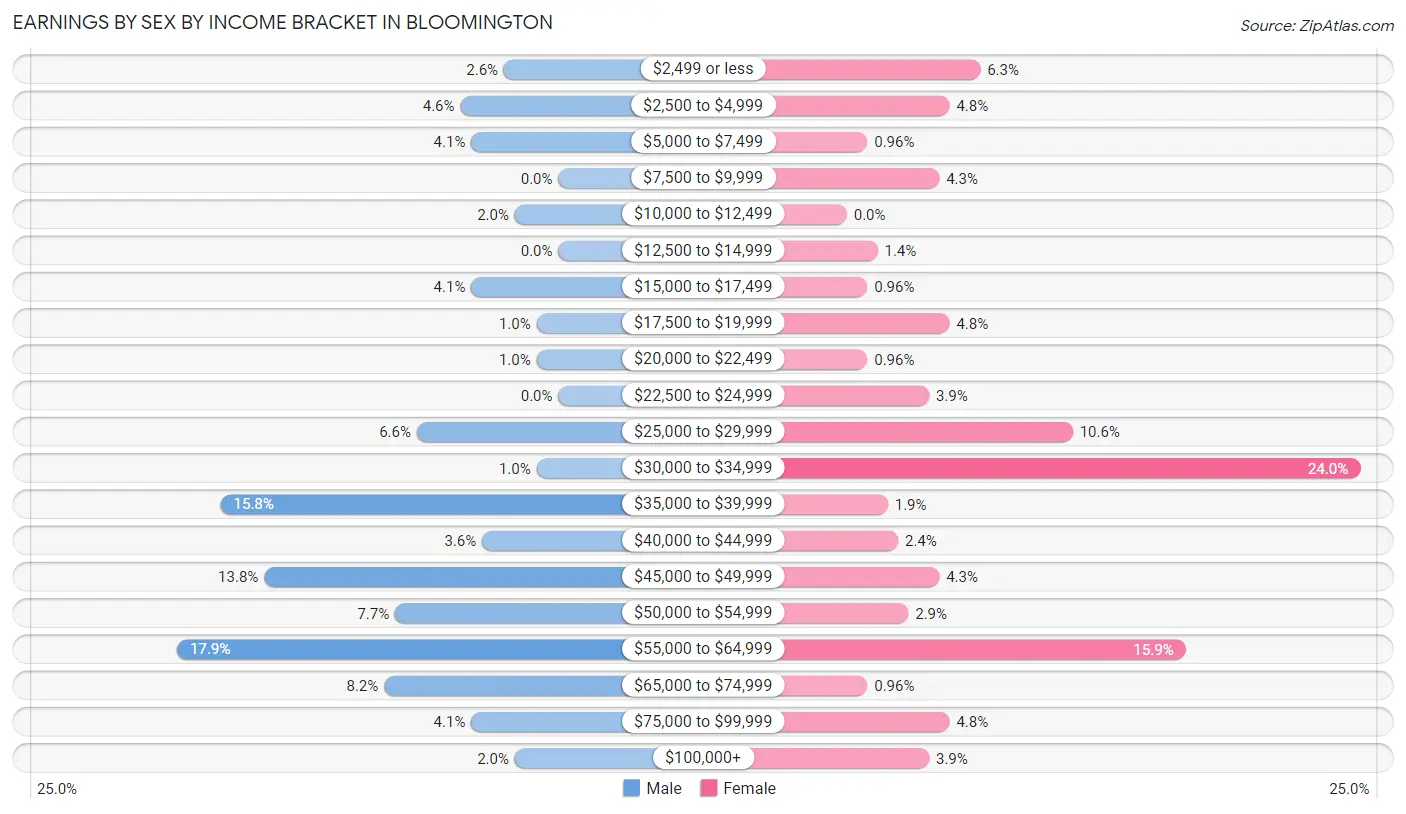
| Income | Male | Female |
| $2,499 or less | 5 (2.5%) | 13 (6.2%) |
| $2,500 to $4,999 | 9 (4.6%) | 10 (4.8%) |
| $5,000 to $7,499 | 8 (4.1%) | 2 (1.0%) |
| $7,500 to $9,999 | 0 (0.0%) | 9 (4.3%) |
| $10,000 to $12,499 | 4 (2.0%) | 0 (0.0%) |
| $12,500 to $14,999 | 0 (0.0%) | 3 (1.4%) |
| $15,000 to $17,499 | 8 (4.1%) | 2 (1.0%) |
| $17,500 to $19,999 | 2 (1.0%) | 10 (4.8%) |
| $20,000 to $22,499 | 2 (1.0%) | 2 (1.0%) |
| $22,500 to $24,999 | 0 (0.0%) | 8 (3.8%) |
| $25,000 to $29,999 | 13 (6.6%) | 22 (10.6%) |
| $30,000 to $34,999 | 2 (1.0%) | 50 (24.0%) |
| $35,000 to $39,999 | 31 (15.8%) | 4 (1.9%) |
| $40,000 to $44,999 | 7 (3.6%) | 5 (2.4%) |
| $45,000 to $49,999 | 27 (13.8%) | 9 (4.3%) |
| $50,000 to $54,999 | 15 (7.6%) | 6 (2.9%) |
| $55,000 to $64,999 | 35 (17.9%) | 33 (15.9%) |
| $65,000 to $74,999 | 16 (8.2%) | 2 (1.0%) |
| $75,000 to $99,999 | 8 (4.1%) | 10 (4.8%) |
| $100,000+ | 4 (2.0%) | 8 (3.8%) |
| Total | 196 (100.0%) | 208 (100.0%) |
Earnings by Sex by Educational Attainment in Bloomington
Average earnings in Bloomington are $46,574 for men and $33,681 for women, a difference of 27.7%. Men with an educational attainment of college or associate's degree enjoy the highest average annual earnings of $52,692, while those with high school diploma education earn the least with $45,795. Women with an educational attainment of graduate degree earn the most with the average annual earnings of $68,750, while those with high school diploma education have the smallest earnings of $31,000.
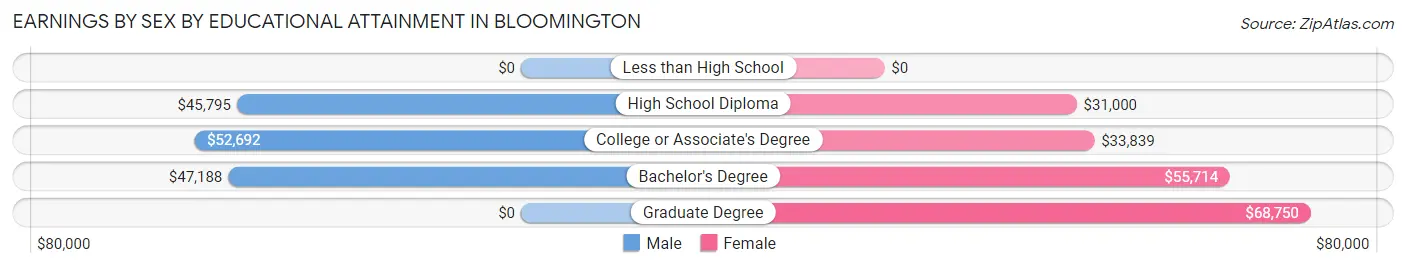
| Educational Attainment | Male Income | Female Income |
| Less than High School | - | - |
| High School Diploma | $45,795 | $31,000 |
| College or Associate's Degree | $52,692 | $33,839 |
| Bachelor's Degree | $47,188 | $55,714 |
| Graduate Degree | - | - |
| Total | $46,574 | $33,681 |
Family Income in Bloomington
Family Income Brackets in Bloomington
According to the Bloomington family income data, there are 65 families falling into the $50,000 to $74,999 income range, which is the most common income bracket and makes up 29.1% of all families.
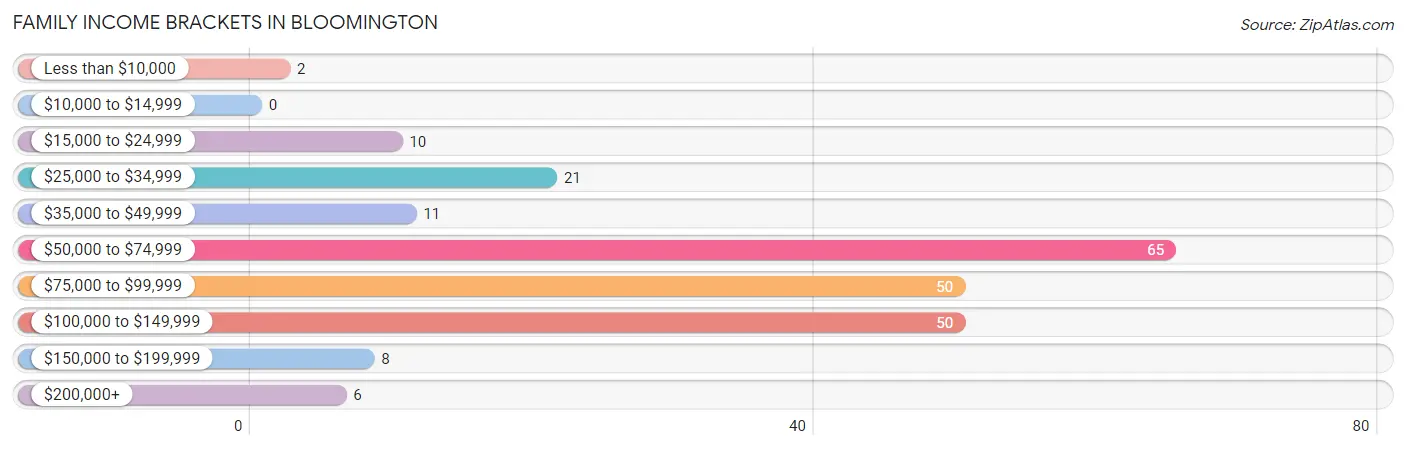
| Income Bracket | # Families | % Families |
| Less than $10,000 | 2 | 0.9% |
| $10,000 to $14,999 | 0 | 0.0% |
| $15,000 to $24,999 | 10 | 4.5% |
| $25,000 to $34,999 | 21 | 9.4% |
| $35,000 to $49,999 | 11 | 4.9% |
| $50,000 to $74,999 | 65 | 29.1% |
| $75,000 to $99,999 | 50 | 22.4% |
| $100,000 to $149,999 | 50 | 22.4% |
| $150,000 to $199,999 | 8 | 3.6% |
| $200,000+ | 6 | 2.7% |
Family Income by Famaliy Size in Bloomington
3-person families (19 | 8.5%) account for the highest median family income in Bloomington with $120,417 per family, while 3-person families (19 | 8.5%) have the highest median income of $40,139 per family member.
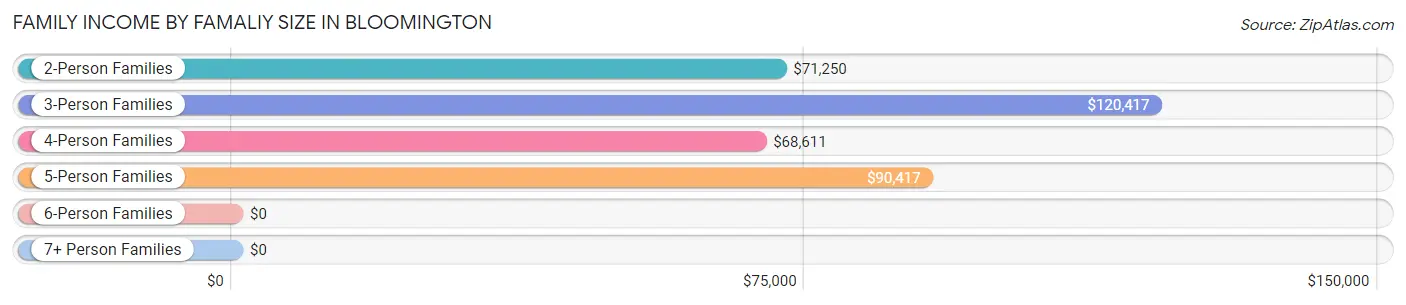
| Income Bracket | # Families | Median Income |
| 2-Person Families | 120 (53.8%) | $71,250 |
| 3-Person Families | 19 (8.5%) | $120,417 |
| 4-Person Families | 62 (27.8%) | $68,611 |
| 5-Person Families | 19 (8.5%) | $90,417 |
| 6-Person Families | 0 (0.0%) | $0 |
| 7+ Person Families | 3 (1.3%) | $0 |
| Total | 223 (100.0%) | $75,893 |
Family Income by Number of Earners in Bloomington
The median family income in Bloomington is $75,893, with families comprising 3+ earners (14) having the highest median family income of $115,000, while families with no earners (32) have the lowest median family income of $53,750, accounting for 6.3% and 14.3% of families, respectively.
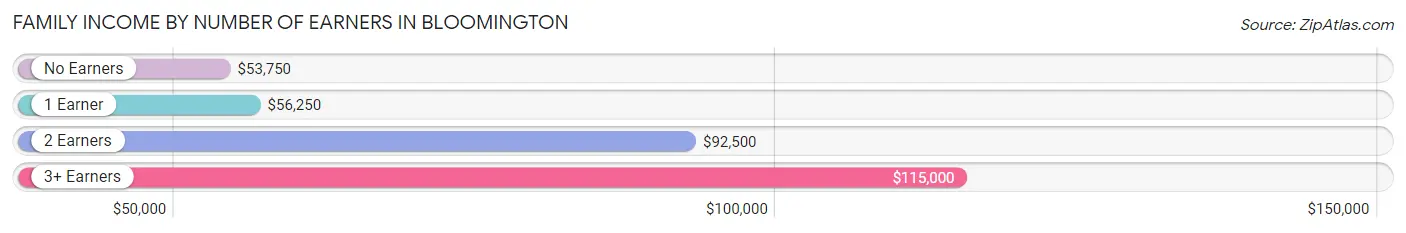
| Number of Earners | # Families | Median Income |
| No Earners | 32 (14.3%) | $53,750 |
| 1 Earner | 49 (22.0%) | $56,250 |
| 2 Earners | 128 (57.4%) | $92,500 |
| 3+ Earners | 14 (6.3%) | $115,000 |
| Total | 223 (100.0%) | $75,893 |
Household Income in Bloomington
Household Income Brackets in Bloomington
With 74 households falling in the category, the $50,000 to $74,999 income range is the most frequent in Bloomington, accounting for 24.9% of all households. In contrast, only 3 households (1.0%) fall into the $10,000 to $14,999 income bracket, making it the least populous group.
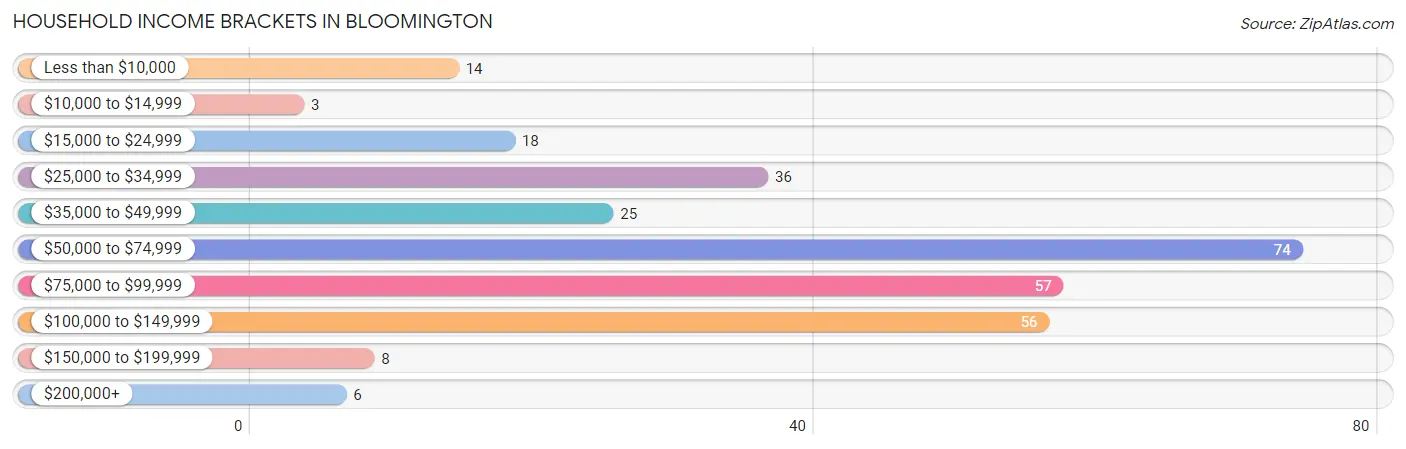
| Income Bracket | # Households | % Households |
| Less than $10,000 | 14 | 4.7% |
| $10,000 to $14,999 | 3 | 1.0% |
| $15,000 to $24,999 | 18 | 6.1% |
| $25,000 to $34,999 | 36 | 12.1% |
| $35,000 to $49,999 | 25 | 8.4% |
| $50,000 to $74,999 | 74 | 24.9% |
| $75,000 to $99,999 | 57 | 19.2% |
| $100,000 to $149,999 | 56 | 18.9% |
| $150,000 to $199,999 | 8 | 2.7% |
| $200,000+ | 6 | 2.0% |
Household Income by Householder Age in Bloomington
The median household income in Bloomington is $67,768, with the highest median household income of $93,056 found in the 45 to 64 years age bracket for the primary householder. A total of 110 households (37.0%) fall into this category. Meanwhile, the 65+ years age bracket for the primary householder has the lowest median household income of $35,000, with 92 households (31.0%) in this group.
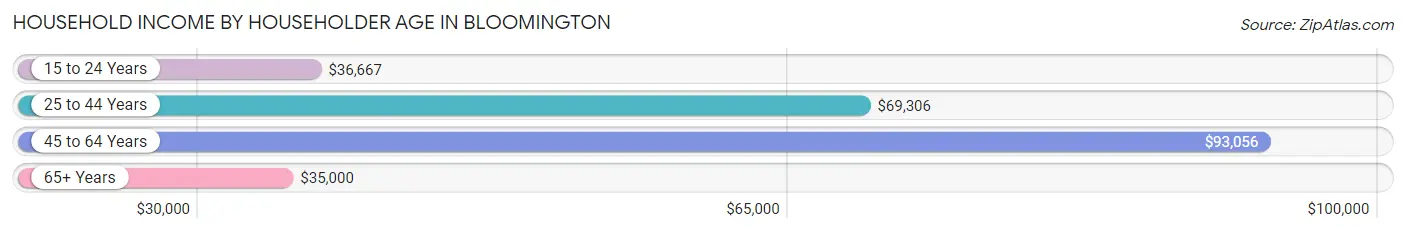
| Income Bracket | # Households | Median Income |
| 15 to 24 Years | 12 (4.0%) | $36,667 |
| 25 to 44 Years | 83 (28.0%) | $69,306 |
| 45 to 64 Years | 110 (37.0%) | $93,056 |
| 65+ Years | 92 (31.0%) | $35,000 |
| Total | 297 (100.0%) | $67,768 |
Poverty in Bloomington
Income Below Poverty by Sex and Age in Bloomington
With 7.6% poverty level for males and 10.9% for females among the residents of Bloomington, 18 to 24 year old males and 15 year old females are the most vulnerable to poverty, with 7 males (41.2%) and 7 females (77.8%) in their respective age groups living below the poverty level.
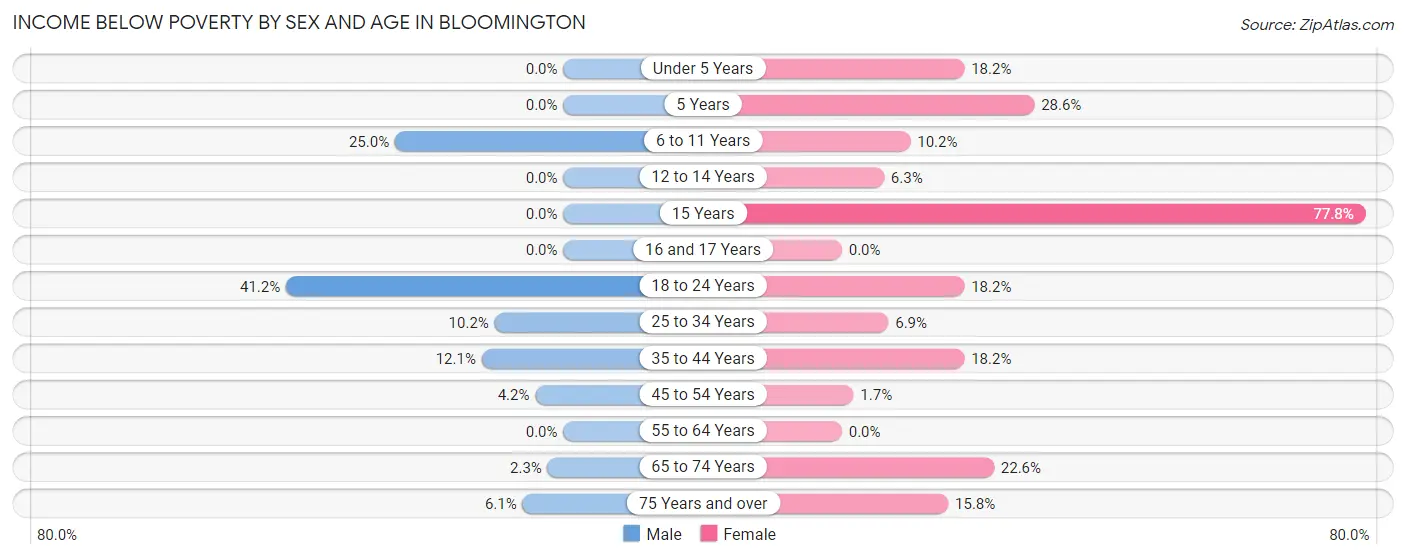
| Age Bracket | Male | Female |
| Under 5 Years | 0 (0.0%) | 2 (18.2%) |
| 5 Years | 0 (0.0%) | 2 (28.6%) |
| 6 to 11 Years | 6 (25.0%) | 6 (10.2%) |
| 12 to 14 Years | 0 (0.0%) | 2 (6.2%) |
| 15 Years | 0 (0.0%) | 7 (77.8%) |
| 16 and 17 Years | 0 (0.0%) | 0 (0.0%) |
| 18 to 24 Years | 7 (41.2%) | 2 (18.2%) |
| 25 to 34 Years | 5 (10.2%) | 4 (6.9%) |
| 35 to 44 Years | 4 (12.1%) | 4 (18.2%) |
| 45 to 54 Years | 2 (4.2%) | 1 (1.7%) |
| 55 to 64 Years | 0 (0.0%) | 0 (0.0%) |
| 65 to 74 Years | 1 (2.3%) | 7 (22.6%) |
| 75 Years and over | 2 (6.1%) | 6 (15.8%) |
| Total | 27 (7.6%) | 43 (10.9%) |
Income Above Poverty by Sex and Age in Bloomington
According to the poverty statistics in Bloomington, males aged under 5 years and females aged 16 and 17 years are the age groups that are most secure financially, with 100.0% of males and 100.0% of females in these age groups living above the poverty line.
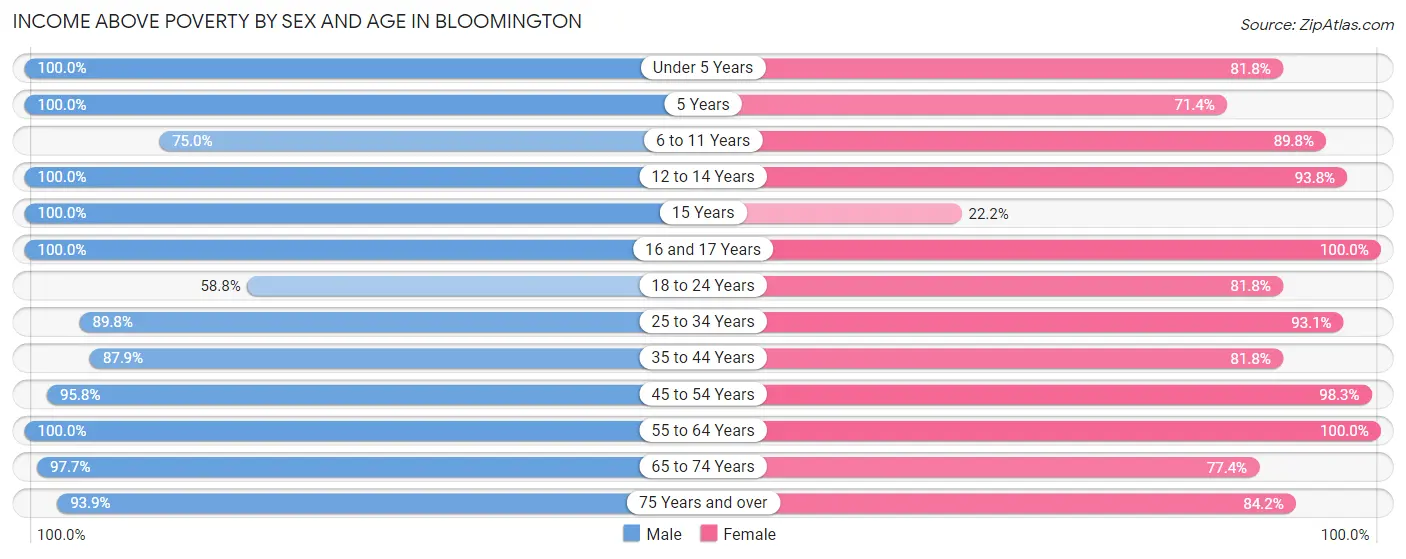
| Age Bracket | Male | Female |
| Under 5 Years | 25 (100.0%) | 9 (81.8%) |
| 5 Years | 10 (100.0%) | 5 (71.4%) |
| 6 to 11 Years | 18 (75.0%) | 53 (89.8%) |
| 12 to 14 Years | 11 (100.0%) | 30 (93.8%) |
| 15 Years | 9 (100.0%) | 2 (22.2%) |
| 16 and 17 Years | 10 (100.0%) | 12 (100.0%) |
| 18 to 24 Years | 10 (58.8%) | 9 (81.8%) |
| 25 to 34 Years | 44 (89.8%) | 54 (93.1%) |
| 35 to 44 Years | 29 (87.9%) | 18 (81.8%) |
| 45 to 54 Years | 46 (95.8%) | 57 (98.3%) |
| 55 to 64 Years | 41 (100.0%) | 47 (100.0%) |
| 65 to 74 Years | 42 (97.7%) | 24 (77.4%) |
| 75 Years and over | 31 (93.9%) | 32 (84.2%) |
| Total | 326 (92.3%) | 352 (89.1%) |
Income Below Poverty Among Married-Couple Families in Bloomington
The poverty statistics for married-couple families in Bloomington show that 2.3% or 4 of the total 175 families live below the poverty line. Families with 1 or 2 children have the highest poverty rate of 8.5%, comprising of 4 families. On the other hand, families with no children have the lowest poverty rate of 0.0%, which includes 0 families.
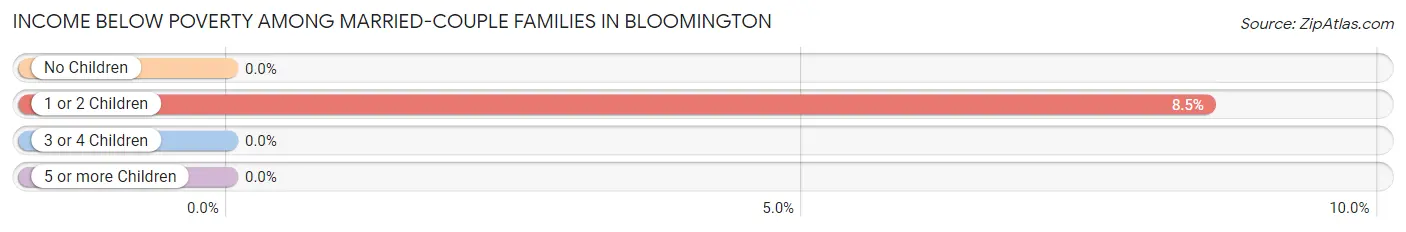
| Children | Above Poverty | Below Poverty |
| No Children | 114 (100.0%) | 0 (0.0%) |
| 1 or 2 Children | 43 (91.5%) | 4 (8.5%) |
| 3 or 4 Children | 12 (100.0%) | 0 (0.0%) |
| 5 or more Children | 2 (100.0%) | 0 (0.0%) |
| Total | 171 (97.7%) | 4 (2.3%) |
Income Below Poverty Among Single-Parent Households in Bloomington
According to the poverty data in Bloomington, 13.0% or 3 single-father households and 24.0% or 6 single-mother households are living below the poverty line. Among single-father households, those with 1 or 2 children have the highest poverty rate, with 3 households (20.0%) experiencing poverty. Likewise, among single-mother households, those with 1 or 2 children have the highest poverty rate, with 6 households (100.0%) falling below the poverty line.
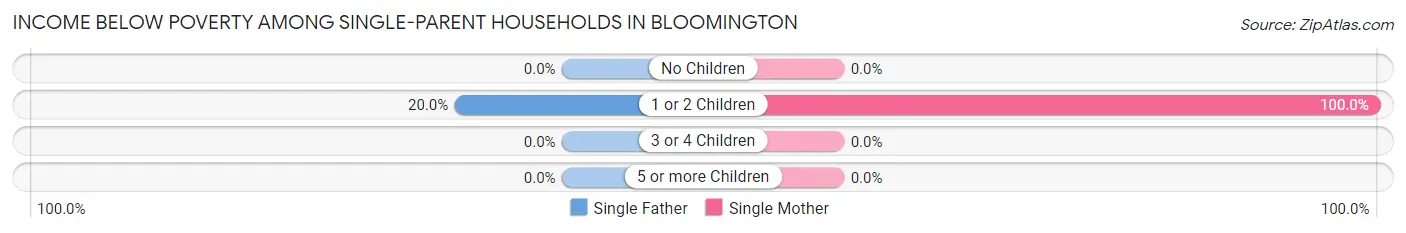
| Children | Single Father | Single Mother |
| No Children | 0 (0.0%) | 0 (0.0%) |
| 1 or 2 Children | 3 (20.0%) | 6 (100.0%) |
| 3 or 4 Children | 0 (0.0%) | 0 (0.0%) |
| 5 or more Children | 0 (0.0%) | 0 (0.0%) |
| Total | 3 (13.0%) | 6 (24.0%) |
Income Below Poverty Among Married-Couple vs Single-Parent Households in Bloomington
The poverty data for Bloomington shows that 4 of the married-couple family households (2.3%) and 9 of the single-parent households (18.8%) are living below the poverty level. Within the married-couple family households, those with 1 or 2 children have the highest poverty rate, with 4 households (8.5%) falling below the poverty line. Among the single-parent households, those with 1 or 2 children have the highest poverty rate, with 9 household (42.9%) living below poverty.
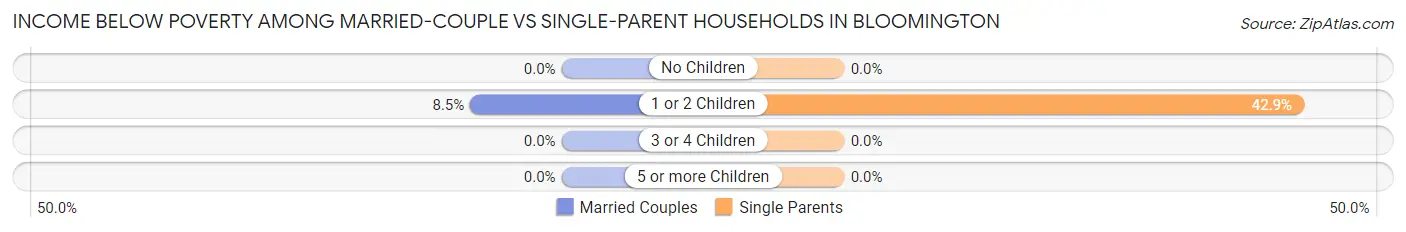
| Children | Married-Couple Families | Single-Parent Households |
| No Children | 0 (0.0%) | 0 (0.0%) |
| 1 or 2 Children | 4 (8.5%) | 9 (42.9%) |
| 3 or 4 Children | 0 (0.0%) | 0 (0.0%) |
| 5 or more Children | 0 (0.0%) | 0 (0.0%) |
| Total | 4 (2.3%) | 9 (18.8%) |
Race in Bloomington
The most populous races in Bloomington are White / Caucasian (721 | 96.0%), Two or more Races (23 | 3.1%), and Asian (5 | 0.7%).
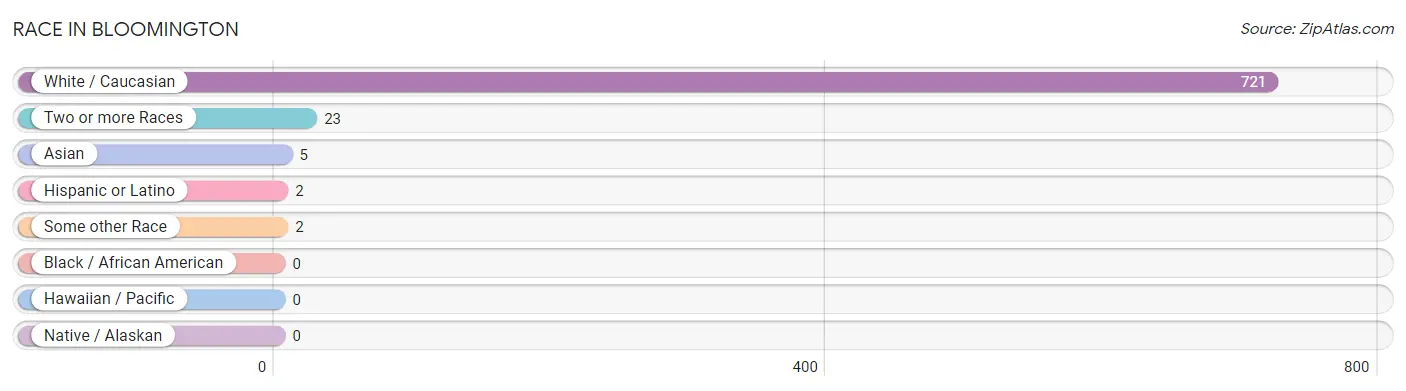
| Race | # Population | % Population |
| Asian | 5 | 0.7% |
| Black / African American | 0 | 0.0% |
| Hawaiian / Pacific | 0 | 0.0% |
| Hispanic or Latino | 2 | 0.3% |
| Native / Alaskan | 0 | 0.0% |
| White / Caucasian | 721 | 96.0% |
| Two or more Races | 23 | 3.1% |
| Some other Race | 2 | 0.3% |
| Total | 751 | 100.0% |
Ancestry in Bloomington
The most populous ancestries reported in Bloomington are German (284 | 37.8%), English (123 | 16.4%), Irish (97 | 12.9%), American (40 | 5.3%), and Norwegian (28 | 3.7%), together accounting for 76.2% of all Bloomington residents.
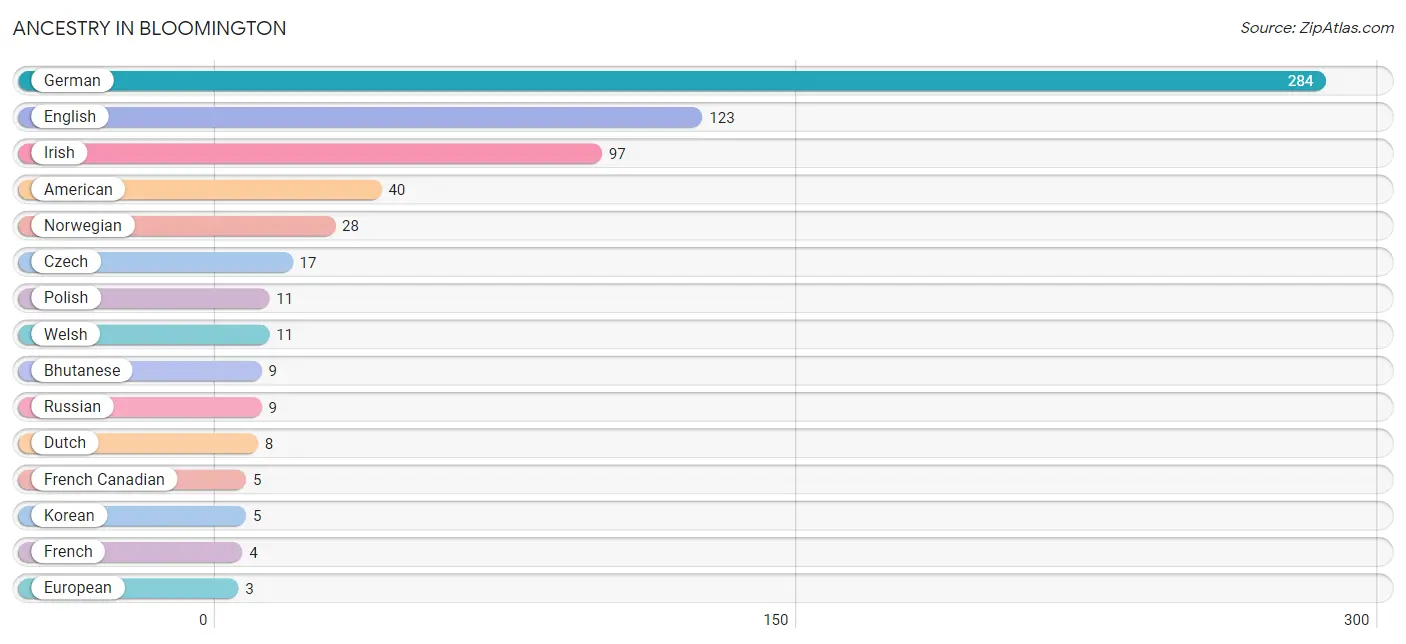
| Ancestry | # Population | % Population |
| American | 40 | 5.3% |
| Belgian | 2 | 0.3% |
| Bhutanese | 9 | 1.2% |
| Czech | 17 | 2.3% |
| Czechoslovakian | 2 | 0.3% |
| Dutch | 8 | 1.1% |
| English | 123 | 16.4% |
| European | 3 | 0.4% |
| French | 4 | 0.5% |
| French Canadian | 5 | 0.7% |
| German | 284 | 37.8% |
| Irish | 97 | 12.9% |
| Korean | 5 | 0.7% |
| Mexican | 2 | 0.3% |
| Norwegian | 28 | 3.7% |
| Polish | 11 | 1.5% |
| Russian | 9 | 1.2% |
| Scottish | 1 | 0.1% |
| Slavic | 2 | 0.3% |
| Slovene | 2 | 0.3% |
| Swedish | 1 | 0.1% |
| Swiss | 1 | 0.1% |
| Welsh | 11 | 1.5% | View All 23 Rows |
Immigrants in Bloomington
The most numerous immigrant groups reported in Bloomington came from Asia (5 | 0.7%), Philippines (5 | 0.7%), South Eastern Asia (5 | 0.7%), Europe (2 | 0.3%), and Germany (2 | 0.3%), together accounting for 2.6% of all Bloomington residents.
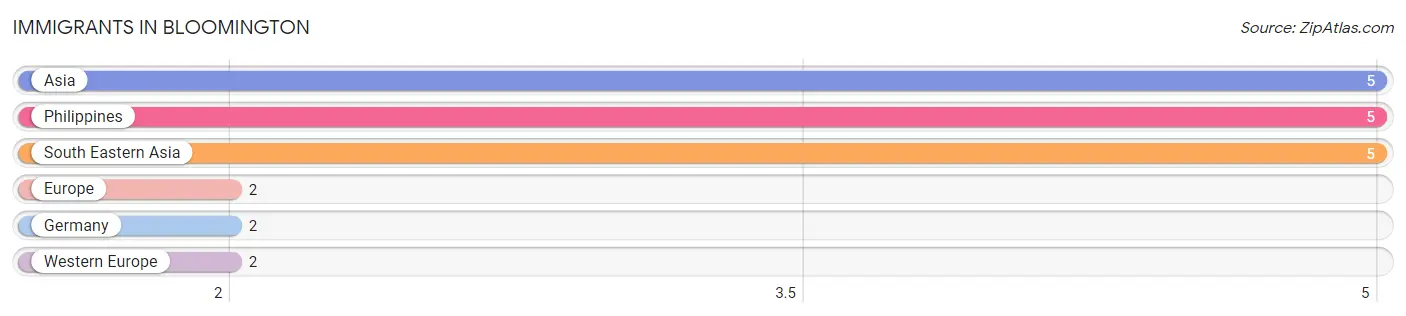
| Immigration Origin | # Population | % Population |
| Asia | 5 | 0.7% |
| Europe | 2 | 0.3% |
| Germany | 2 | 0.3% |
| Philippines | 5 | 0.7% |
| South Eastern Asia | 5 | 0.7% |
| Western Europe | 2 | 0.3% | View All 6 Rows |
Sex and Age in Bloomington
Sex and Age in Bloomington
The most populous age groups in Bloomington are 25 to 29 Years (28 | 7.9%) for men and 10 to 14 Years (56 | 14.2%) for women.
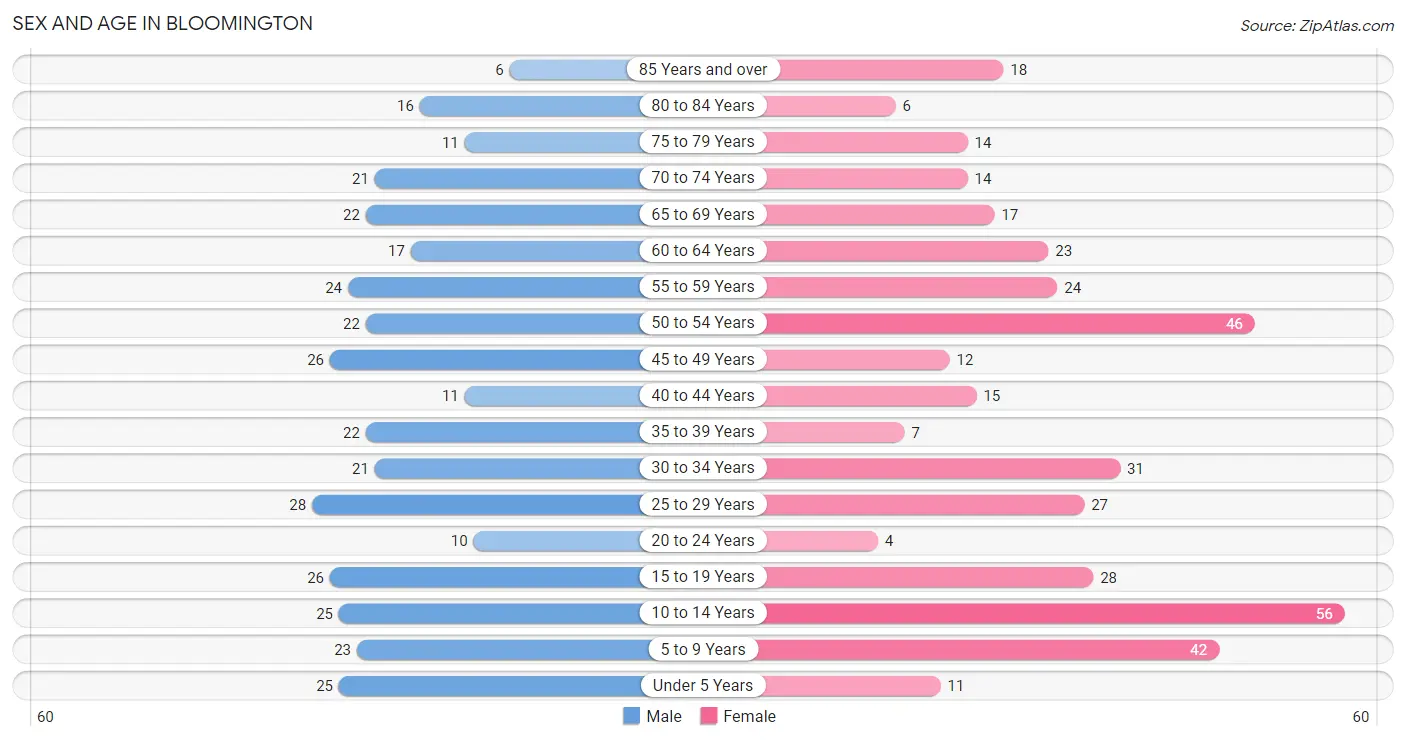
| Age Bracket | Male | Female |
| Under 5 Years | 25 (7.0%) | 11 (2.8%) |
| 5 to 9 Years | 23 (6.5%) | 42 (10.6%) |
| 10 to 14 Years | 25 (7.0%) | 56 (14.2%) |
| 15 to 19 Years | 26 (7.3%) | 28 (7.1%) |
| 20 to 24 Years | 10 (2.8%) | 4 (1.0%) |
| 25 to 29 Years | 28 (7.9%) | 27 (6.8%) |
| 30 to 34 Years | 21 (5.9%) | 31 (7.9%) |
| 35 to 39 Years | 22 (6.2%) | 7 (1.8%) |
| 40 to 44 Years | 11 (3.1%) | 15 (3.8%) |
| 45 to 49 Years | 26 (7.3%) | 12 (3.0%) |
| 50 to 54 Years | 22 (6.2%) | 46 (11.7%) |
| 55 to 59 Years | 24 (6.7%) | 24 (6.1%) |
| 60 to 64 Years | 17 (4.8%) | 23 (5.8%) |
| 65 to 69 Years | 22 (6.2%) | 17 (4.3%) |
| 70 to 74 Years | 21 (5.9%) | 14 (3.5%) |
| 75 to 79 Years | 11 (3.1%) | 14 (3.5%) |
| 80 to 84 Years | 16 (4.5%) | 6 (1.5%) |
| 85 Years and over | 6 (1.7%) | 18 (4.6%) |
| Total | 356 (100.0%) | 395 (100.0%) |
Families and Households in Bloomington
Median Family Size in Bloomington
The median family size in Bloomington is 2.94 persons per family, with single female/mother families (25 | 11.2%) accounting for the largest median family size of 3.84 persons per family. On the other hand, married-couple families (175 | 78.5%) represent the smallest median family size with 2.78 persons per family.
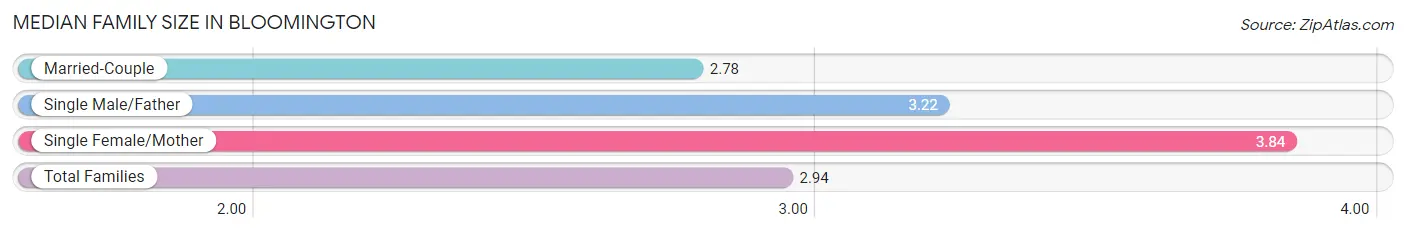
| Family Type | # Families | Family Size |
| Married-Couple | 175 (78.5%) | 2.78 |
| Single Male/Father | 23 (10.3%) | 3.22 |
| Single Female/Mother | 25 (11.2%) | 3.84 |
| Total Families | 223 (100.0%) | 2.94 |
Median Household Size in Bloomington
The median household size in Bloomington is 2.53 persons per household, with single female/mother households (25 | 8.4%) accounting for the largest median household size of 4.12 persons per household. non-family households (74 | 24.9%) represent the smallest median household size with 1.12 persons per household.
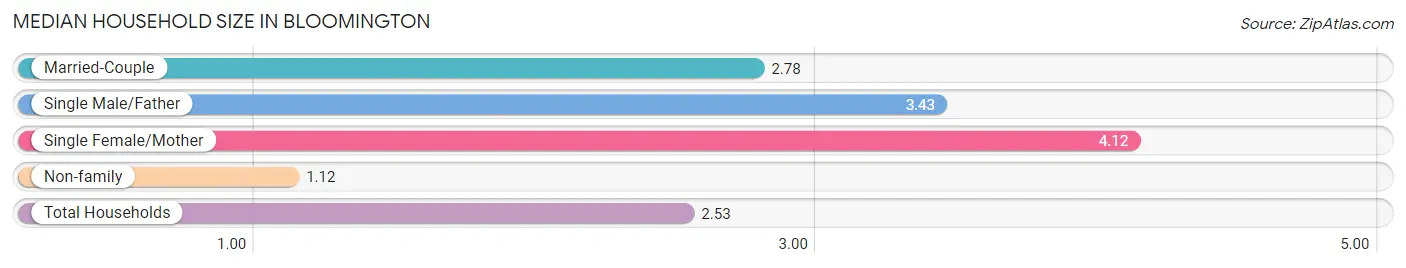
| Household Type | # Households | Household Size |
| Married-Couple | 175 (58.9%) | 2.78 |
| Single Male/Father | 23 (7.7%) | 3.43 |
| Single Female/Mother | 25 (8.4%) | 4.12 |
| Non-family | 74 (24.9%) | 1.12 |
| Total Households | 297 (100.0%) | 2.53 |
Household Size by Marriage Status in Bloomington
Out of a total of 297 households in Bloomington, 223 (75.1%) are family households, while 74 (24.9%) are nonfamily households. The most numerous type of family households are 2-person households, comprising 114, and the most common type of nonfamily households are 1-person households, comprising 66.
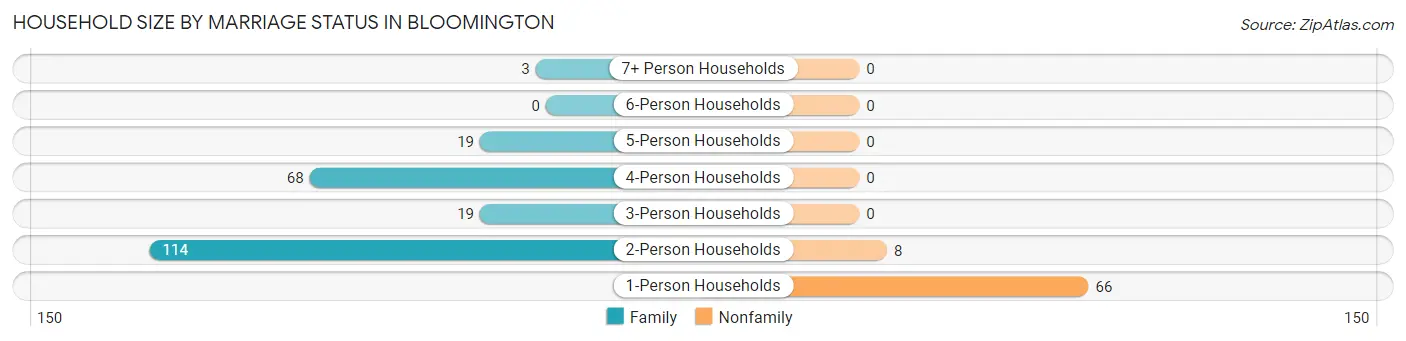
| Household Size | Family Households | Nonfamily Households |
| 1-Person Households | - | 66 (22.2%) |
| 2-Person Households | 114 (38.4%) | 8 (2.7%) |
| 3-Person Households | 19 (6.4%) | 0 (0.0%) |
| 4-Person Households | 68 (22.9%) | 0 (0.0%) |
| 5-Person Households | 19 (6.4%) | 0 (0.0%) |
| 6-Person Households | 0 (0.0%) | 0 (0.0%) |
| 7+ Person Households | 3 (1.0%) | 0 (0.0%) |
| Total | 223 (75.1%) | 74 (24.9%) |
Female Fertility in Bloomington
Fertility by Age in Bloomington
Average fertility rate in Bloomington is 88.0 births per 1,000 women. Women in the age bracket of 20 to 34 years have the highest fertility rate with 161.0 births per 1,000 women. Women in the age bracket of 20 to 34 years acount for 83.3% of all women with births.
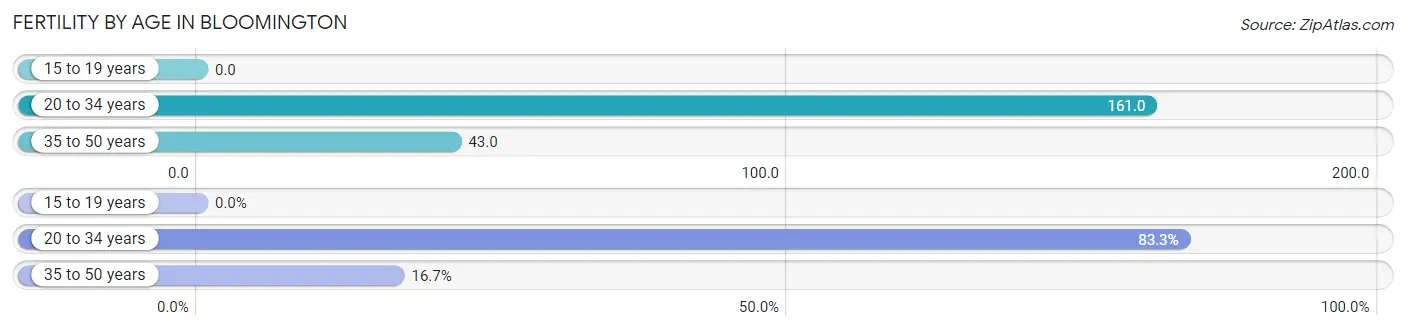
| Age Bracket | Women with Births | Births / 1,000 Women |
| 15 to 19 years | 0 (0.0%) | 0.0 |
| 20 to 34 years | 10 (83.3%) | 161.0 |
| 35 to 50 years | 2 (16.7%) | 43.0 |
| Total | 12 (100.0%) | 88.0 |
Fertility by Age by Marriage Status in Bloomington
83.3% of women with births (12) in Bloomington are married. The highest percentage of unmarried women with births falls into 35 to 50 years age bracket with 100.0% of them unmarried at the time of birth, while the lowest percentage of unmarried women with births belong to 20 to 34 years age bracket with 0.0% of them unmarried.
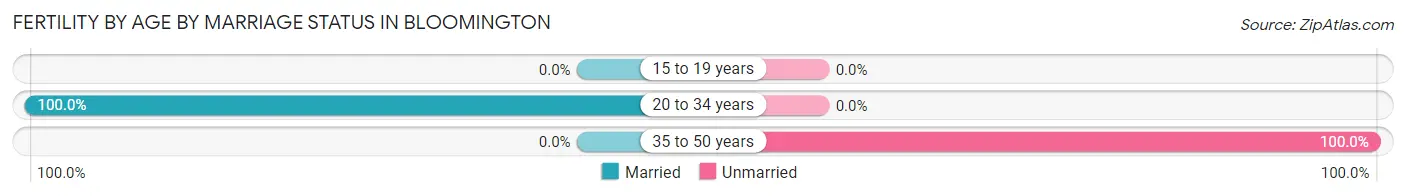
| Age Bracket | Married | Unmarried |
| 15 to 19 years | 0 (0.0%) | 0 (0.0%) |
| 20 to 34 years | 10 (100.0%) | 0 (0.0%) |
| 35 to 50 years | 0 (0.0%) | 2 (100.0%) |
| Total | 10 (83.3%) | 2 (16.7%) |
Fertility by Education in Bloomington
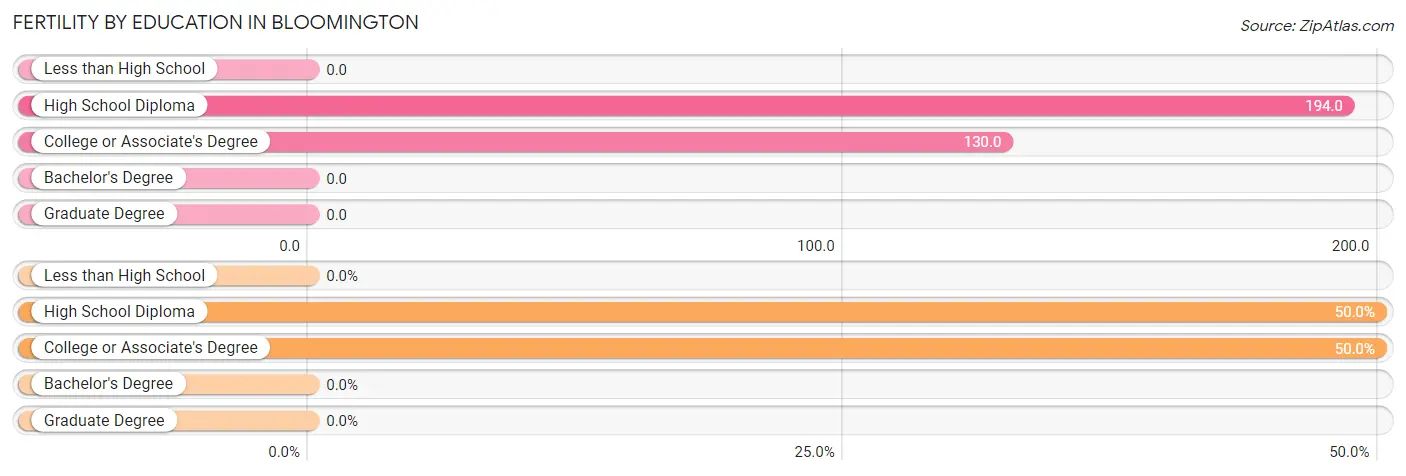
| Educational Attainment | Women with Births | Births / 1,000 Women |
| Less than High School | 0 (0.0%) | 0.0 |
| High School Diploma | 6 (50.0%) | 194.0 |
| College or Associate's Degree | 6 (50.0%) | 130.0 |
| Bachelor's Degree | 0 (0.0%) | 0.0 |
| Graduate Degree | 0 (0.0%) | 0.0 |
| Total | 12 (100.0%) | 88.0 |
Fertility by Education by Marriage Status in Bloomington
16.7% of women with births in Bloomington are unmarried. Women with the educational attainment of high school diploma are most likely to be married with 100.0% of them married at childbirth, while women with the educational attainment of college or associate's degree are least likely to be married with 33.3% of them unmarried at childbirth.
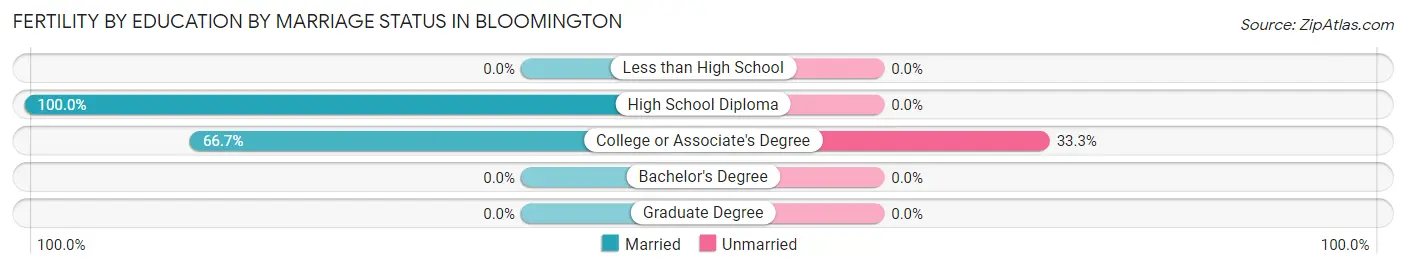
| Educational Attainment | Married | Unmarried |
| Less than High School | 0 (0.0%) | 0 (0.0%) |
| High School Diploma | 6 (100.0%) | 0 (0.0%) |
| College or Associate's Degree | 4 (66.7%) | 2 (33.3%) |
| Bachelor's Degree | 0 (0.0%) | 0 (0.0%) |
| Graduate Degree | 0 (0.0%) | 0 (0.0%) |
| Total | 10 (83.3%) | 2 (16.7%) |
Employment Characteristics in Bloomington
Employment by Class of Employer in Bloomington
Among the 392 employed individuals in Bloomington, private company employees (257 | 65.6%), state government employees (38 | 9.7%), and local government employees (36 | 9.2%) make up the most common classes of employment.
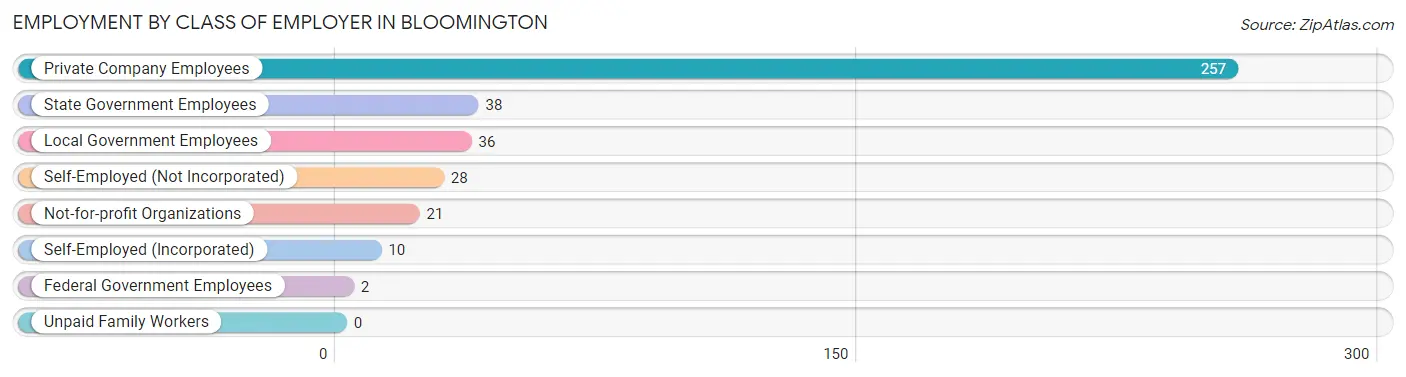
| Employer Class | # Employees | % Employees |
| Private Company Employees | 257 | 65.6% |
| Self-Employed (Incorporated) | 10 | 2.5% |
| Self-Employed (Not Incorporated) | 28 | 7.1% |
| Not-for-profit Organizations | 21 | 5.4% |
| Local Government Employees | 36 | 9.2% |
| State Government Employees | 38 | 9.7% |
| Federal Government Employees | 2 | 0.5% |
| Unpaid Family Workers | 0 | 0.0% |
| Total | 392 | 100.0% |
Employment Status by Age in Bloomington
According to the labor force statistics for Bloomington, out of the total population over 16 years of age (551), 72.4% or 399 individuals are in the labor force, with 1.5% or 6 of them unemployed. The age group with the highest labor force participation rate is 20 to 24 years, with 100.0% or 14 individuals in the labor force. Within the labor force, the 20 to 24 years age range has the highest percentage of unemployed individuals, with 14.3% or 2 of them being unemployed.
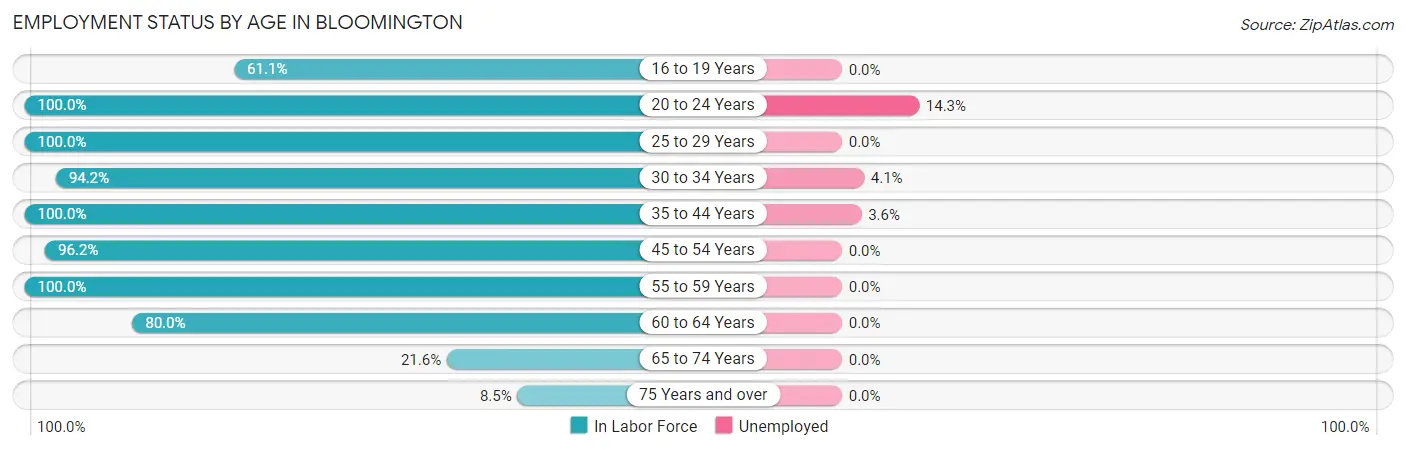
| Age Bracket | In Labor Force | Unemployed |
| 16 to 19 Years | 22 (61.1%) | 0 (0.0%) |
| 20 to 24 Years | 14 (100.0%) | 2 (14.3%) |
| 25 to 29 Years | 55 (100.0%) | 0 (0.0%) |
| 30 to 34 Years | 49 (94.2%) | 2 (4.1%) |
| 35 to 44 Years | 55 (100.0%) | 2 (3.6%) |
| 45 to 54 Years | 102 (96.2%) | 0 (0.0%) |
| 55 to 59 Years | 48 (100.0%) | 0 (0.0%) |
| 60 to 64 Years | 32 (80.0%) | 0 (0.0%) |
| 65 to 74 Years | 16 (21.6%) | 0 (0.0%) |
| 75 Years and over | 6 (8.5%) | 0 (0.0%) |
| Total | 399 (72.4%) | 6 (1.5%) |
Employment Status by Educational Attainment in Bloomington
According to labor force statistics for Bloomington, 95.8% of individuals (341) out of the total population between 25 and 64 years of age (356) are in the labor force, with 1.2% or 4 of them being unemployed. The group with the highest labor force participation rate are those with the educational attainment of bachelor's degree or higher, with 100.0% or 63 individuals in the labor force. Within the labor force, individuals with college / associate degree education have the highest percentage of unemployment, with 1.5% or 2 of them being unemployed.
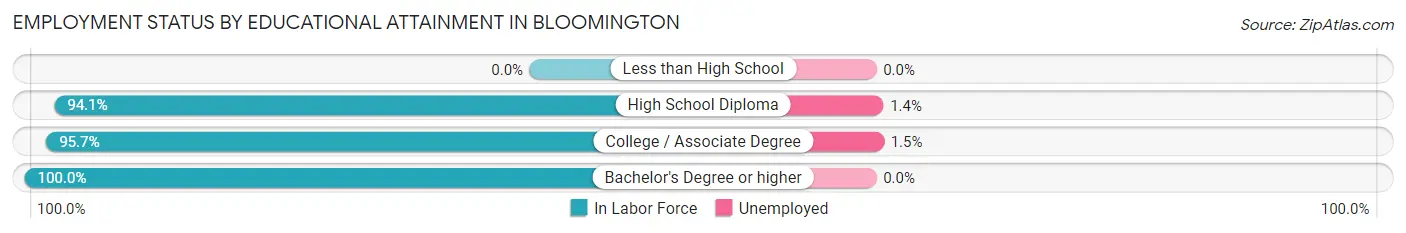
| Educational Attainment | In Labor Force | Unemployed |
| Less than High School | 0 (0.0%) | 0 (0.0%) |
| High School Diploma | 143 (94.1%) | 2 (1.4%) |
| College / Associate Degree | 135 (95.7%) | 2 (1.5%) |
| Bachelor's Degree or higher | 63 (100.0%) | 0 (0.0%) |
| Total | 341 (95.8%) | 4 (1.2%) |
Employment Occupations by Sex in Bloomington
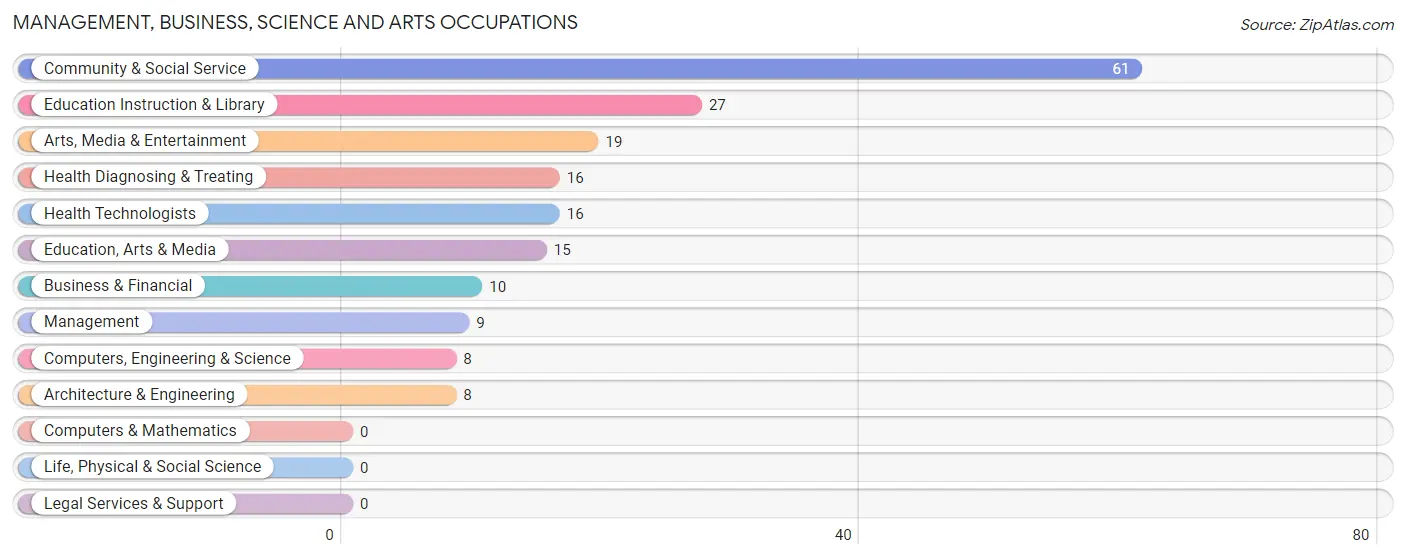
Management, Business, Science and Arts Occupations
The most common Management, Business, Science and Arts occupations in Bloomington are Community & Social Service (61 | 15.5%), Education Instruction & Library (27 | 6.9%), Arts, Media & Entertainment (19 | 4.8%), Health Diagnosing & Treating (16 | 4.1%), and Health Technologists (16 | 4.1%).
Management, Business, Science and Arts Occupations by Sex
Within the Management, Business, Science and Arts occupations in Bloomington, the most male-oriented occupations are Computers, Engineering & Science (100.0%), Architecture & Engineering (100.0%), and Management (55.6%), while the most female-oriented occupations are Arts, Media & Entertainment (100.0%), Health Diagnosing & Treating (100.0%), and Health Technologists (100.0%).
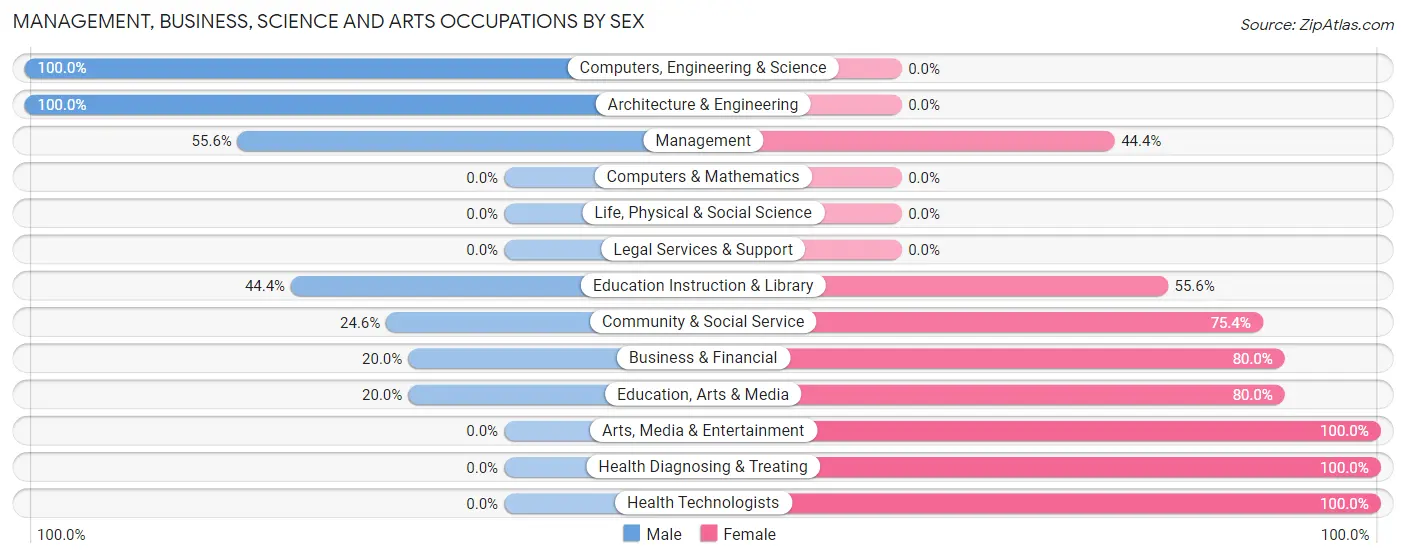
| Occupation | Male | Female |
| Management | 5 (55.6%) | 4 (44.4%) |
| Business & Financial | 2 (20.0%) | 8 (80.0%) |
| Computers, Engineering & Science | 8 (100.0%) | 0 (0.0%) |
| Computers & Mathematics | 0 (0.0%) | 0 (0.0%) |
| Architecture & Engineering | 8 (100.0%) | 0 (0.0%) |
| Life, Physical & Social Science | 0 (0.0%) | 0 (0.0%) |
| Community & Social Service | 15 (24.6%) | 46 (75.4%) |
| Education, Arts & Media | 3 (20.0%) | 12 (80.0%) |
| Legal Services & Support | 0 (0.0%) | 0 (0.0%) |
| Education Instruction & Library | 12 (44.4%) | 15 (55.6%) |
| Arts, Media & Entertainment | 0 (0.0%) | 19 (100.0%) |
| Health Diagnosing & Treating | 0 (0.0%) | 16 (100.0%) |
| Health Technologists | 0 (0.0%) | 16 (100.0%) |
| Total (Category) | 30 (28.8%) | 74 (71.2%) |
| Total (Overall) | 187 (47.6%) | 206 (52.4%) |
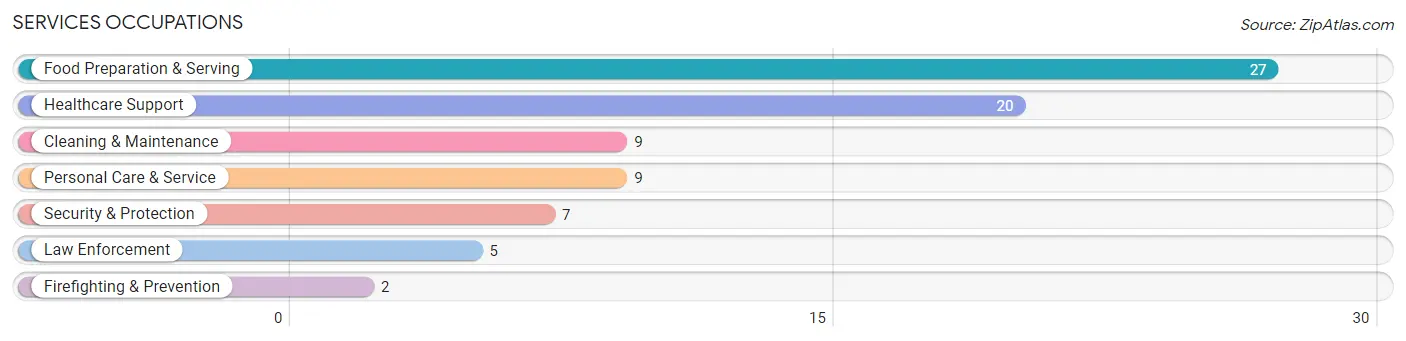
Services Occupations
The most common Services occupations in Bloomington are Food Preparation & Serving (27 | 6.9%), Healthcare Support (20 | 5.1%), Cleaning & Maintenance (9 | 2.3%), Personal Care & Service (9 | 2.3%), and Security & Protection (7 | 1.8%).
Services Occupations by Sex
Within the Services occupations in Bloomington, the most male-oriented occupations are Security & Protection (100.0%), Firefighting & Prevention (100.0%), and Law Enforcement (100.0%), while the most female-oriented occupations are Personal Care & Service (100.0%), Healthcare Support (80.0%), and Cleaning & Maintenance (77.8%).
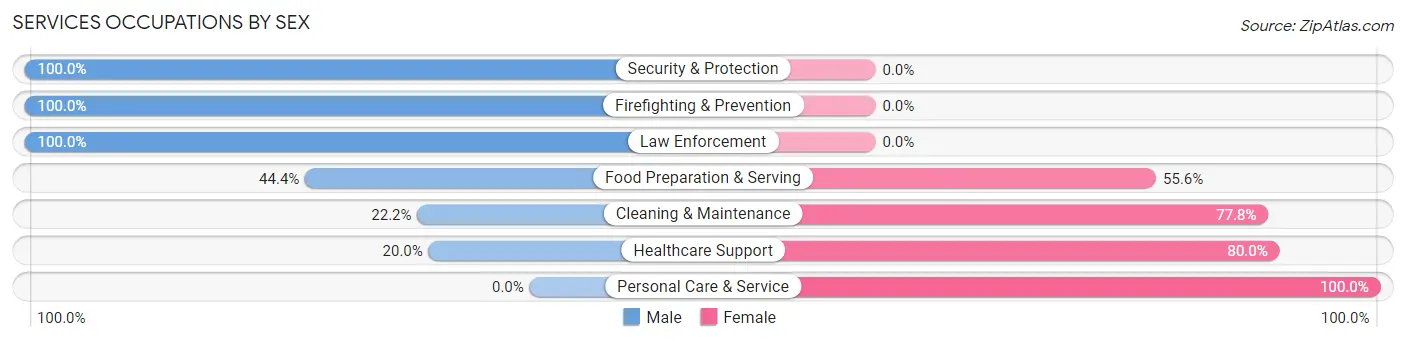
| Occupation | Male | Female |
| Healthcare Support | 4 (20.0%) | 16 (80.0%) |
| Security & Protection | 7 (100.0%) | 0 (0.0%) |
| Firefighting & Prevention | 2 (100.0%) | 0 (0.0%) |
| Law Enforcement | 5 (100.0%) | 0 (0.0%) |
| Food Preparation & Serving | 12 (44.4%) | 15 (55.6%) |
| Cleaning & Maintenance | 2 (22.2%) | 7 (77.8%) |
| Personal Care & Service | 0 (0.0%) | 9 (100.0%) |
| Total (Category) | 25 (34.7%) | 47 (65.3%) |
| Total (Overall) | 187 (47.6%) | 206 (52.4%) |
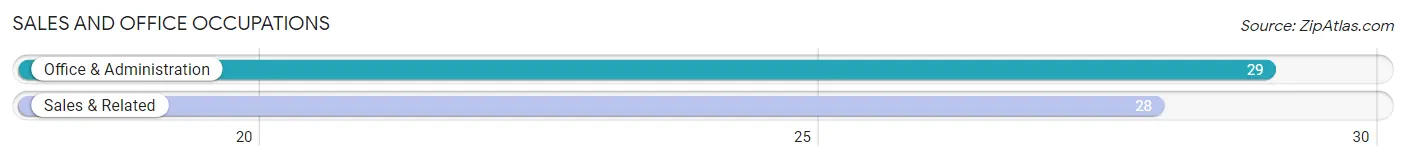
Sales and Office Occupations
The most common Sales and Office occupations in Bloomington are Office & Administration (29 | 7.4%), and Sales & Related (28 | 7.1%).
Sales and Office Occupations by Sex
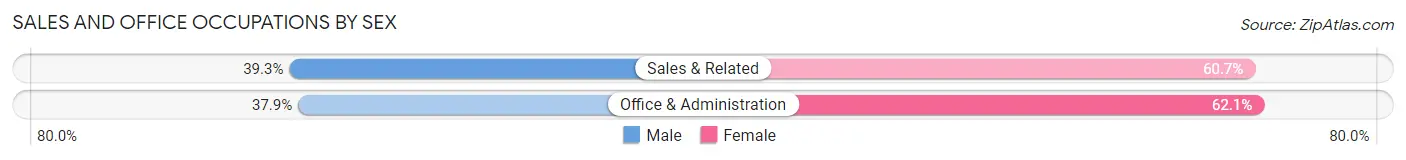
| Occupation | Male | Female |
| Sales & Related | 11 (39.3%) | 17 (60.7%) |
| Office & Administration | 11 (37.9%) | 18 (62.1%) |
| Total (Category) | 22 (38.6%) | 35 (61.4%) |
| Total (Overall) | 187 (47.6%) | 206 (52.4%) |
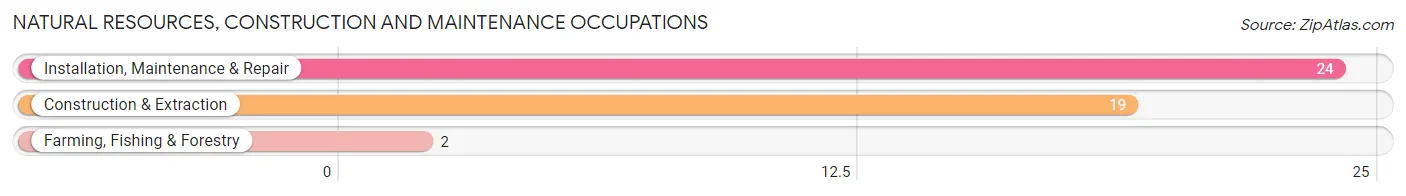
Natural Resources, Construction and Maintenance Occupations
The most common Natural Resources, Construction and Maintenance occupations in Bloomington are Installation, Maintenance & Repair (24 | 6.1%), Construction & Extraction (19 | 4.8%), and Farming, Fishing & Forestry (2 | 0.5%).
Natural Resources, Construction and Maintenance Occupations by Sex
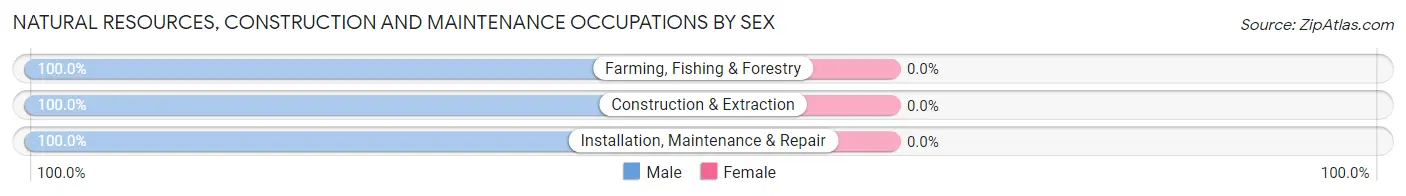
| Occupation | Male | Female |
| Farming, Fishing & Forestry | 2 (100.0%) | 0 (0.0%) |
| Construction & Extraction | 19 (100.0%) | 0 (0.0%) |
| Installation, Maintenance & Repair | 24 (100.0%) | 0 (0.0%) |
| Total (Category) | 45 (100.0%) | 0 (0.0%) |
| Total (Overall) | 187 (47.6%) | 206 (52.4%) |
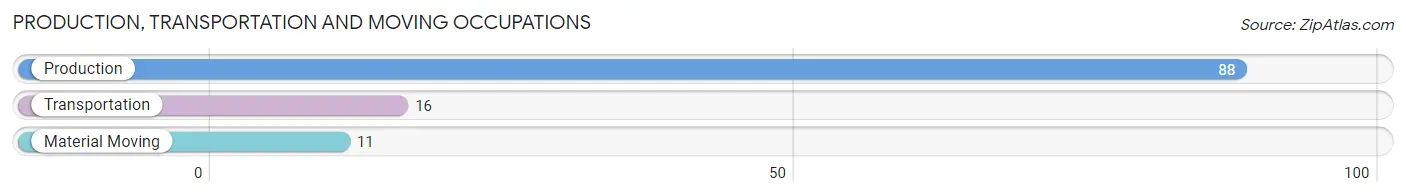
Production, Transportation and Moving Occupations
The most common Production, Transportation and Moving occupations in Bloomington are Production (88 | 22.4%), Transportation (16 | 4.1%), and Material Moving (11 | 2.8%).
Production, Transportation and Moving Occupations by Sex
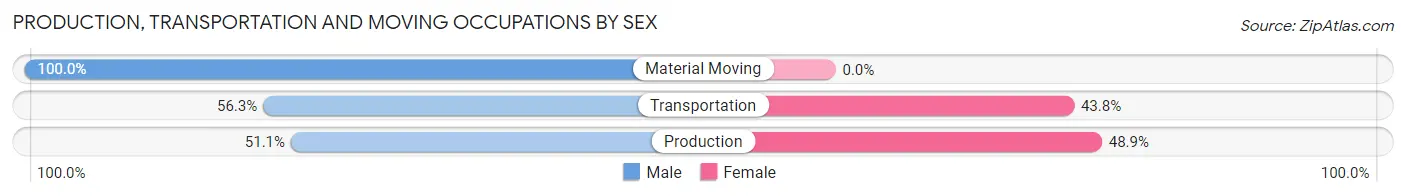
| Occupation | Male | Female |
| Production | 45 (51.1%) | 43 (48.9%) |
| Transportation | 9 (56.2%) | 7 (43.8%) |
| Material Moving | 11 (100.0%) | 0 (0.0%) |
| Total (Category) | 65 (56.5%) | 50 (43.5%) |
| Total (Overall) | 187 (47.6%) | 206 (52.4%) |
Employment Industries by Sex in Bloomington
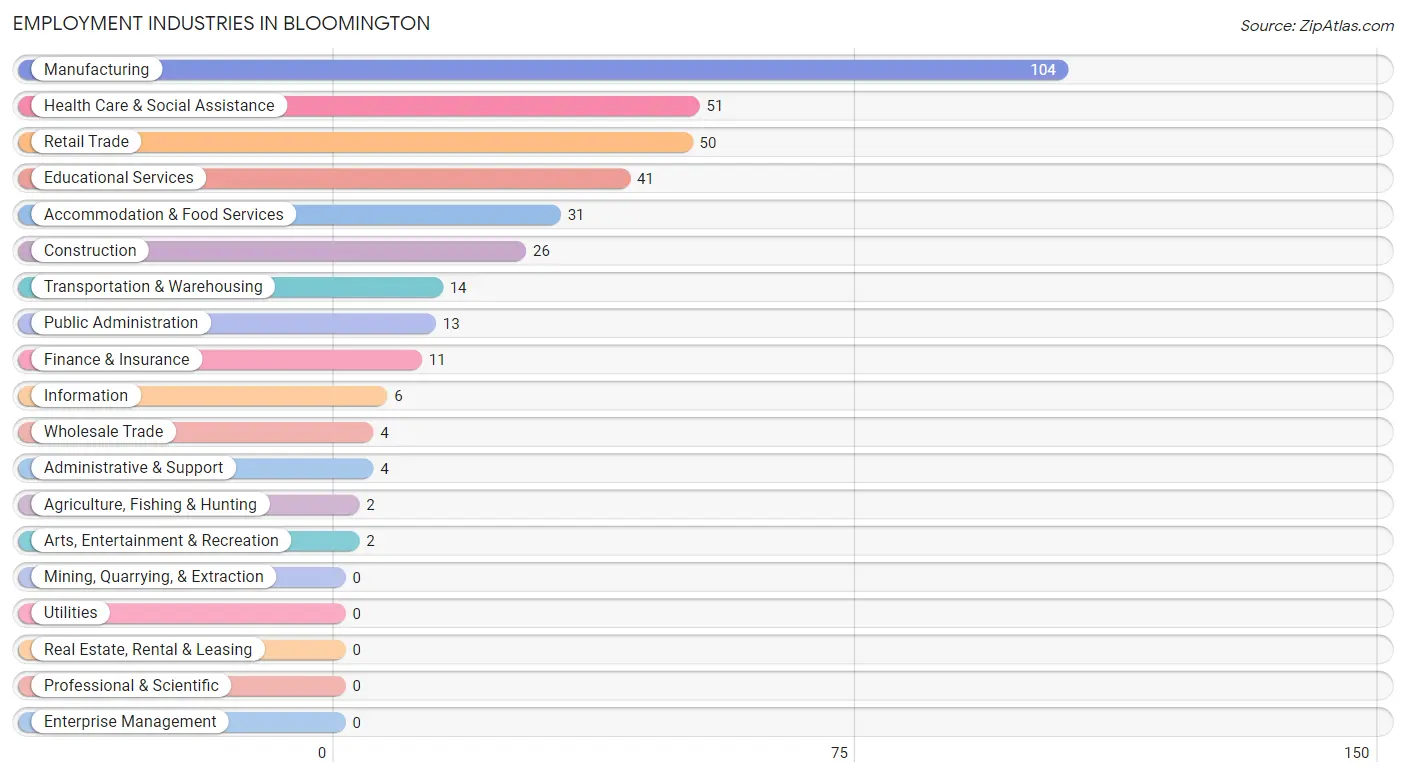
Employment Industries in Bloomington
The major employment industries in Bloomington include Manufacturing (104 | 26.5%), Health Care & Social Assistance (51 | 13.0%), Retail Trade (50 | 12.7%), Educational Services (41 | 10.4%), and Accommodation & Food Services (31 | 7.9%).
Employment Industries by Sex in Bloomington
The Bloomington industries that see more men than women are Agriculture, Fishing & Hunting (100.0%), Construction (100.0%), and Manufacturing (61.5%), whereas the industries that tend to have a higher number of women are Arts, Entertainment & Recreation (100.0%), Health Care & Social Assistance (90.2%), and Finance & Insurance (81.8%).
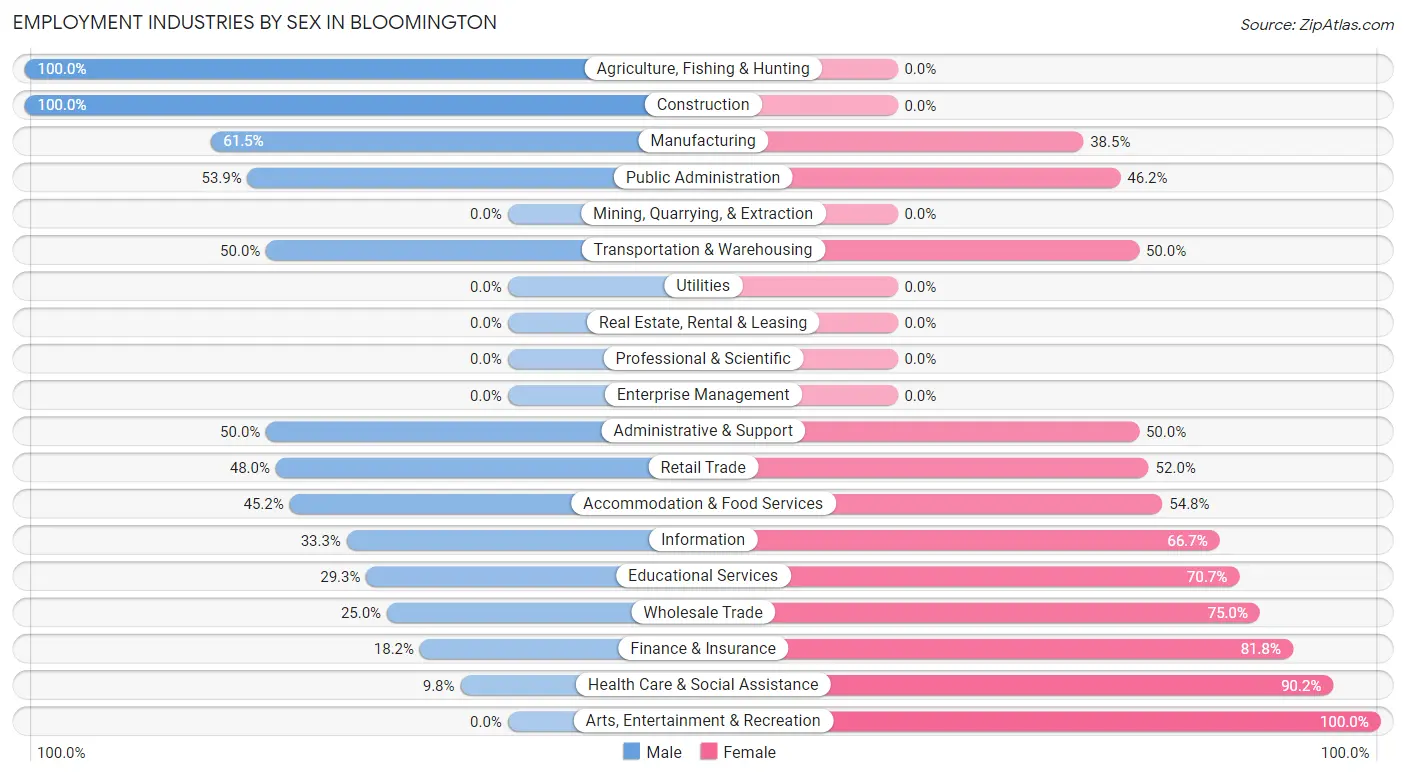
| Industry | Male | Female |
| Agriculture, Fishing & Hunting | 2 (100.0%) | 0 (0.0%) |
| Mining, Quarrying, & Extraction | 0 (0.0%) | 0 (0.0%) |
| Construction | 26 (100.0%) | 0 (0.0%) |
| Manufacturing | 64 (61.5%) | 40 (38.5%) |
| Wholesale Trade | 1 (25.0%) | 3 (75.0%) |
| Retail Trade | 24 (48.0%) | 26 (52.0%) |
| Transportation & Warehousing | 7 (50.0%) | 7 (50.0%) |
| Utilities | 0 (0.0%) | 0 (0.0%) |
| Information | 2 (33.3%) | 4 (66.7%) |
| Finance & Insurance | 2 (18.2%) | 9 (81.8%) |
| Real Estate, Rental & Leasing | 0 (0.0%) | 0 (0.0%) |
| Professional & Scientific | 0 (0.0%) | 0 (0.0%) |
| Enterprise Management | 0 (0.0%) | 0 (0.0%) |
| Administrative & Support | 2 (50.0%) | 2 (50.0%) |
| Educational Services | 12 (29.3%) | 29 (70.7%) |
| Health Care & Social Assistance | 5 (9.8%) | 46 (90.2%) |
| Arts, Entertainment & Recreation | 0 (0.0%) | 2 (100.0%) |
| Accommodation & Food Services | 14 (45.2%) | 17 (54.8%) |
| Public Administration | 7 (53.8%) | 6 (46.2%) |
| Total | 187 (47.6%) | 206 (52.4%) |
Education in Bloomington
School Enrollment in Bloomington
The most common levels of schooling among the 205 students in Bloomington are middle school (71 | 34.6%), elementary school (54 | 26.3%), and high school (51 | 24.9%).
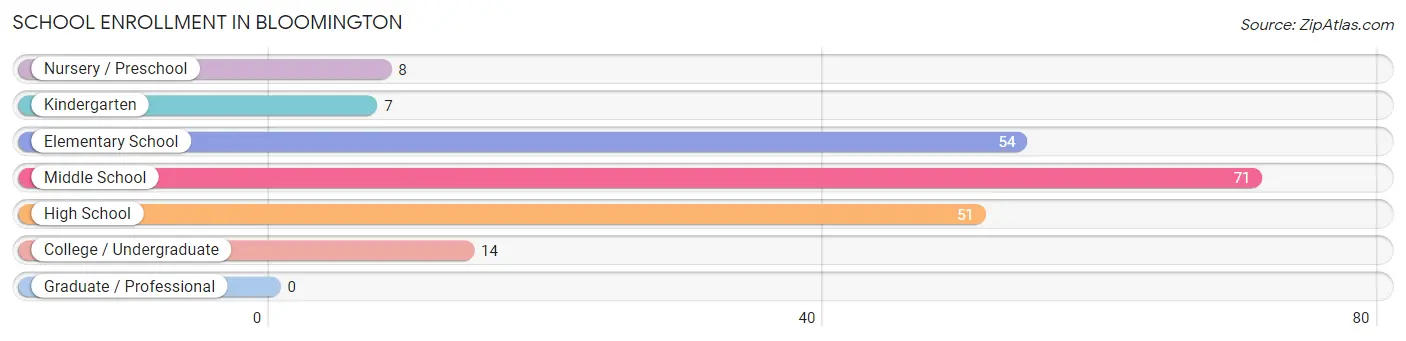
| School Level | # Students | % Students |
| Nursery / Preschool | 8 | 3.9% |
| Kindergarten | 7 | 3.4% |
| Elementary School | 54 | 26.3% |
| Middle School | 71 | 34.6% |
| High School | 51 | 24.9% |
| College / Undergraduate | 14 | 6.8% |
| Graduate / Professional | 0 | 0.0% |
| Total | 205 | 100.0% |
School Enrollment by Age by Funding Source in Bloomington
Out of a total of 205 students who are enrolled in schools in Bloomington, 22 (10.7%) attend a private institution, while the remaining 183 (89.3%) are enrolled in public schools. The age group of 3 to 4 year olds has the highest likelihood of being enrolled in private schools, with 2 (33.3% in the age bracket) enrolled. Conversely, the age group of 18 to 19 year olds has the lowest likelihood of being enrolled in a private school, with 9 (100.0% in the age bracket) attending a public institution.
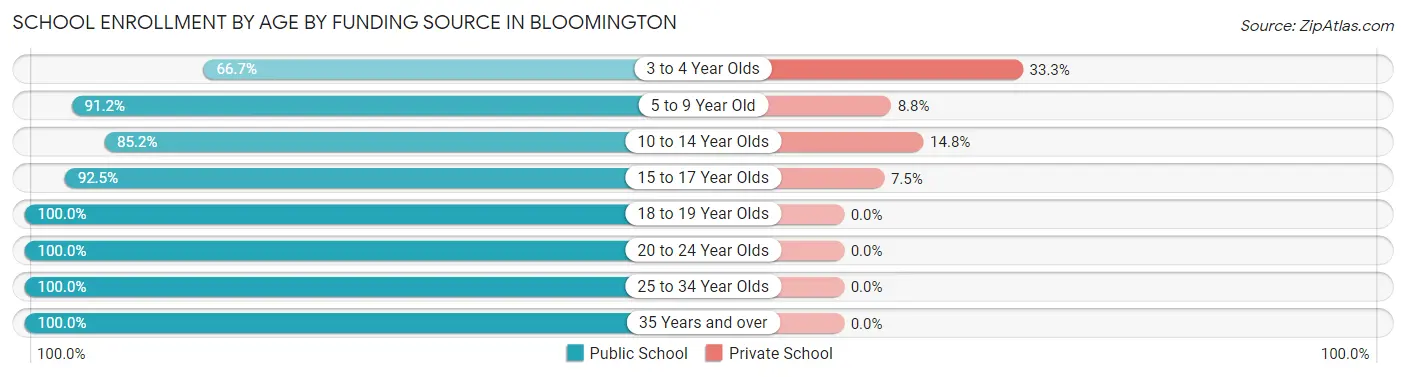
| Age Bracket | Public School | Private School |
| 3 to 4 Year Olds | 4 (66.7%) | 2 (33.3%) |
| 5 to 9 Year Old | 52 (91.2%) | 5 (8.8%) |
| 10 to 14 Year Olds | 69 (85.2%) | 12 (14.8%) |
| 15 to 17 Year Olds | 37 (92.5%) | 3 (7.5%) |
| 18 to 19 Year Olds | 9 (100.0%) | 0 (0.0%) |
| 20 to 24 Year Olds | 4 (100.0%) | 0 (0.0%) |
| 25 to 34 Year Olds | 6 (100.0%) | 0 (0.0%) |
| 35 Years and over | 2 (100.0%) | 0 (0.0%) |
| Total | 183 (89.3%) | 22 (10.7%) |
Educational Attainment by Field of Study in Bloomington
Science & technology (25 | 29.1%), education (23 | 26.7%), arts & humanities (11 | 12.8%), bio, nature & agricultural (8 | 9.3%), and business (7 | 8.1%) are the most common fields of study among 86 individuals in Bloomington who have obtained a bachelor's degree or higher.
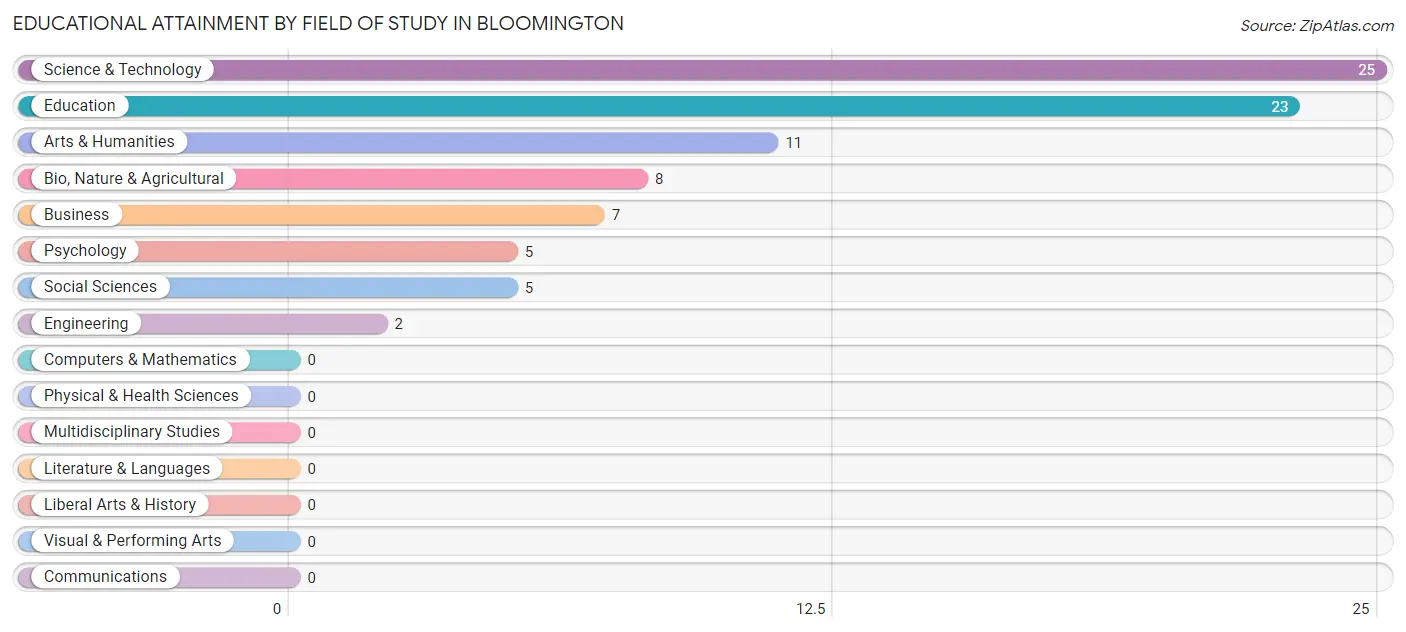
| Field of Study | # Graduates | % Graduates |
| Computers & Mathematics | 0 | 0.0% |
| Bio, Nature & Agricultural | 8 | 9.3% |
| Physical & Health Sciences | 0 | 0.0% |
| Psychology | 5 | 5.8% |
| Social Sciences | 5 | 5.8% |
| Engineering | 2 | 2.3% |
| Multidisciplinary Studies | 0 | 0.0% |
| Science & Technology | 25 | 29.1% |
| Business | 7 | 8.1% |
| Education | 23 | 26.7% |
| Literature & Languages | 0 | 0.0% |
| Liberal Arts & History | 0 | 0.0% |
| Visual & Performing Arts | 0 | 0.0% |
| Communications | 0 | 0.0% |
| Arts & Humanities | 11 | 12.8% |
| Total | 86 | 100.0% |
Transportation & Commute in Bloomington
Vehicle Availability by Sex in Bloomington
The most prevalent vehicle ownership categories in Bloomington are males with 2 vehicles (77, accounting for 41.4%) and females with 2 vehicles (90, making up 37.4%).
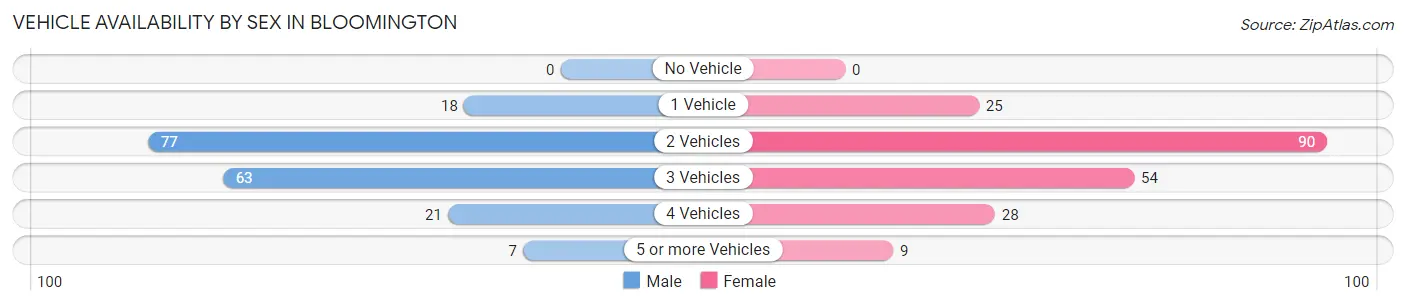
| Vehicles Available | Male | Female |
| No Vehicle | 0 (0.0%) | 0 (0.0%) |
| 1 Vehicle | 18 (9.7%) | 25 (12.1%) |
| 2 Vehicles | 77 (41.4%) | 90 (43.7%) |
| 3 Vehicles | 63 (33.9%) | 54 (26.2%) |
| 4 Vehicles | 21 (11.3%) | 28 (13.6%) |
| 5 or more Vehicles | 7 (3.8%) | 9 (4.4%) |
| Total | 186 (100.0%) | 206 (100.0%) |
Commute Time in Bloomington
The most frequently occuring commute durations in Bloomington are 25 to 29 minutes (69 commuters, 18.2%), 20 to 24 minutes (66 commuters, 17.4%), and 30 to 34 minutes (56 commuters, 14.7%).
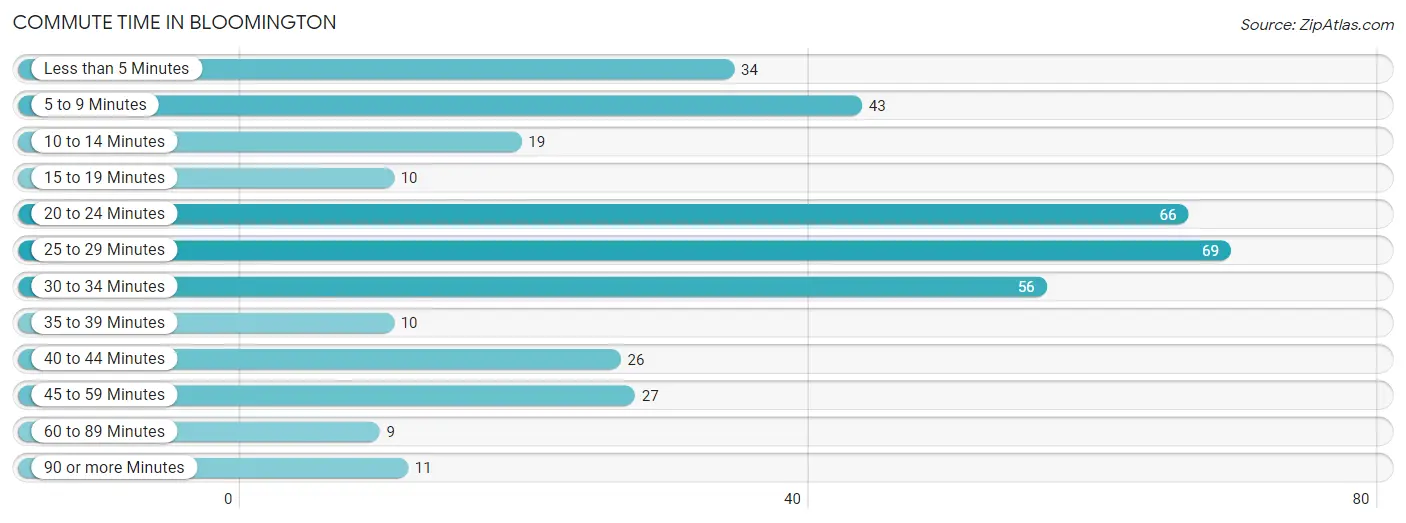
| Commute Time | # Commuters | % Commuters |
| Less than 5 Minutes | 34 | 8.9% |
| 5 to 9 Minutes | 43 | 11.3% |
| 10 to 14 Minutes | 19 | 5.0% |
| 15 to 19 Minutes | 10 | 2.6% |
| 20 to 24 Minutes | 66 | 17.4% |
| 25 to 29 Minutes | 69 | 18.2% |
| 30 to 34 Minutes | 56 | 14.7% |
| 35 to 39 Minutes | 10 | 2.6% |
| 40 to 44 Minutes | 26 | 6.8% |
| 45 to 59 Minutes | 27 | 7.1% |
| 60 to 89 Minutes | 9 | 2.4% |
| 90 or more Minutes | 11 | 2.9% |
Commute Time by Sex in Bloomington
The most common commute times in Bloomington are 20 to 24 minutes (32 commuters, 17.4%) for males and 25 to 29 minutes (44 commuters, 22.5%) for females.
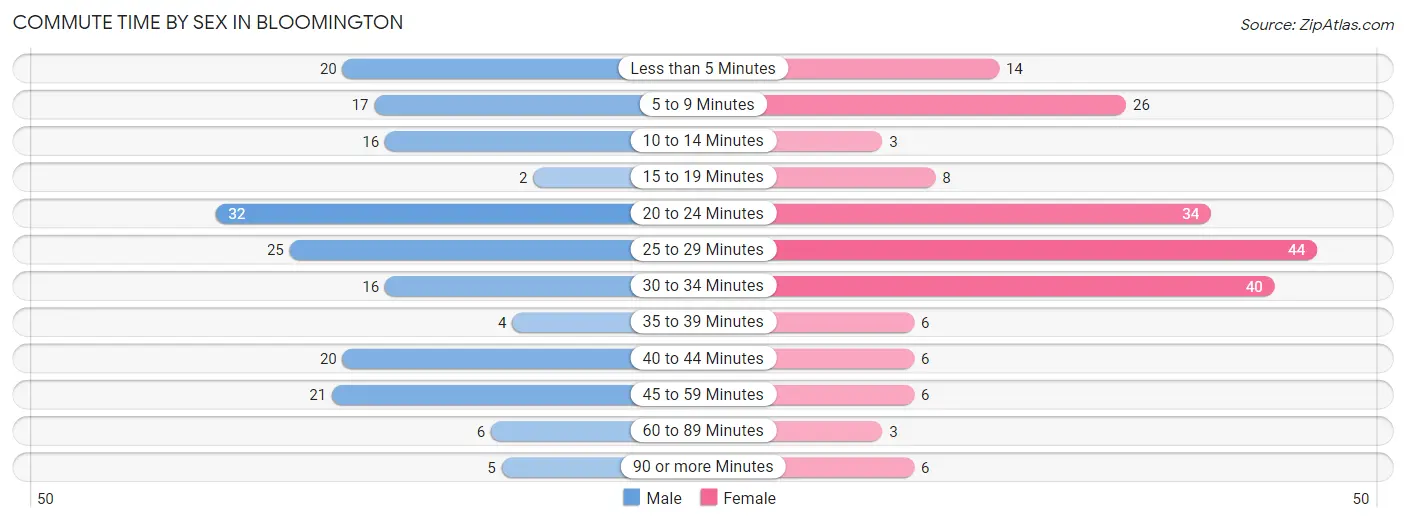
| Commute Time | Male | Female |
| Less than 5 Minutes | 20 (10.9%) | 14 (7.1%) |
| 5 to 9 Minutes | 17 (9.2%) | 26 (13.3%) |
| 10 to 14 Minutes | 16 (8.7%) | 3 (1.5%) |
| 15 to 19 Minutes | 2 (1.1%) | 8 (4.1%) |
| 20 to 24 Minutes | 32 (17.4%) | 34 (17.3%) |
| 25 to 29 Minutes | 25 (13.6%) | 44 (22.5%) |
| 30 to 34 Minutes | 16 (8.7%) | 40 (20.4%) |
| 35 to 39 Minutes | 4 (2.2%) | 6 (3.1%) |
| 40 to 44 Minutes | 20 (10.9%) | 6 (3.1%) |
| 45 to 59 Minutes | 21 (11.4%) | 6 (3.1%) |
| 60 to 89 Minutes | 6 (3.3%) | 3 (1.5%) |
| 90 or more Minutes | 5 (2.7%) | 6 (3.1%) |
Time of Departure to Work by Sex in Bloomington
The most frequent times of departure to work in Bloomington are 7:00 AM to 7:29 AM (30, 16.3%) for males and 7:00 AM to 7:29 AM (64, 32.7%) for females.
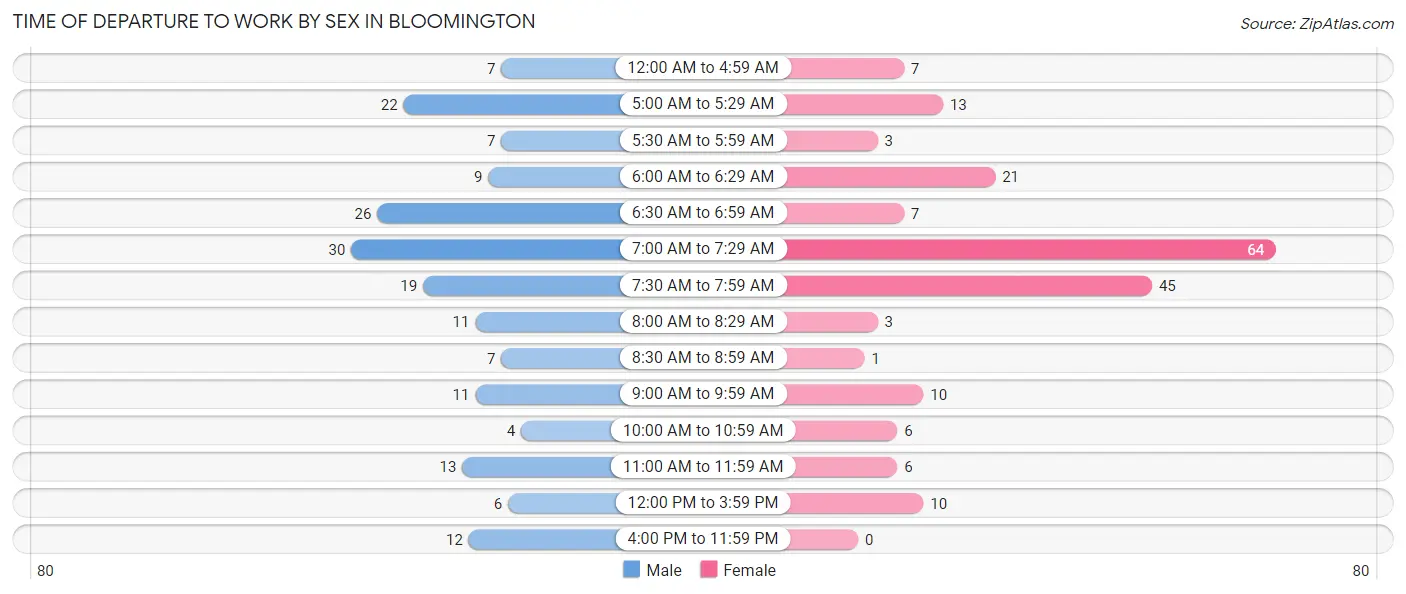
| Time of Departure | Male | Female |
| 12:00 AM to 4:59 AM | 7 (3.8%) | 7 (3.6%) |
| 5:00 AM to 5:29 AM | 22 (12.0%) | 13 (6.6%) |
| 5:30 AM to 5:59 AM | 7 (3.8%) | 3 (1.5%) |
| 6:00 AM to 6:29 AM | 9 (4.9%) | 21 (10.7%) |
| 6:30 AM to 6:59 AM | 26 (14.1%) | 7 (3.6%) |
| 7:00 AM to 7:29 AM | 30 (16.3%) | 64 (32.7%) |
| 7:30 AM to 7:59 AM | 19 (10.3%) | 45 (23.0%) |
| 8:00 AM to 8:29 AM | 11 (6.0%) | 3 (1.5%) |
| 8:30 AM to 8:59 AM | 7 (3.8%) | 1 (0.5%) |
| 9:00 AM to 9:59 AM | 11 (6.0%) | 10 (5.1%) |
| 10:00 AM to 10:59 AM | 4 (2.2%) | 6 (3.1%) |
| 11:00 AM to 11:59 AM | 13 (7.1%) | 6 (3.1%) |
| 12:00 PM to 3:59 PM | 6 (3.3%) | 10 (5.1%) |
| 4:00 PM to 11:59 PM | 12 (6.5%) | 0 (0.0%) |
| Total | 184 (100.0%) | 196 (100.0%) |
Housing Occupancy in Bloomington
Occupancy by Ownership in Bloomington
Of the total 297 dwellings in Bloomington, owner-occupied units account for 248 (83.5%), while renter-occupied units make up 49 (16.5%).
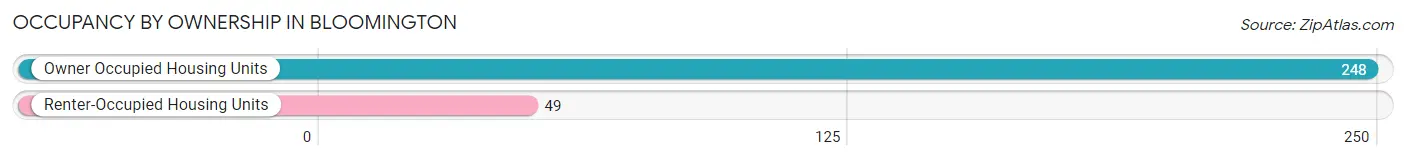
| Occupancy | # Housing Units | % Housing Units |
| Owner Occupied Housing Units | 248 | 83.5% |
| Renter-Occupied Housing Units | 49 | 16.5% |
| Total Occupied Housing Units | 297 | 100.0% |
Occupancy by Household Size in Bloomington
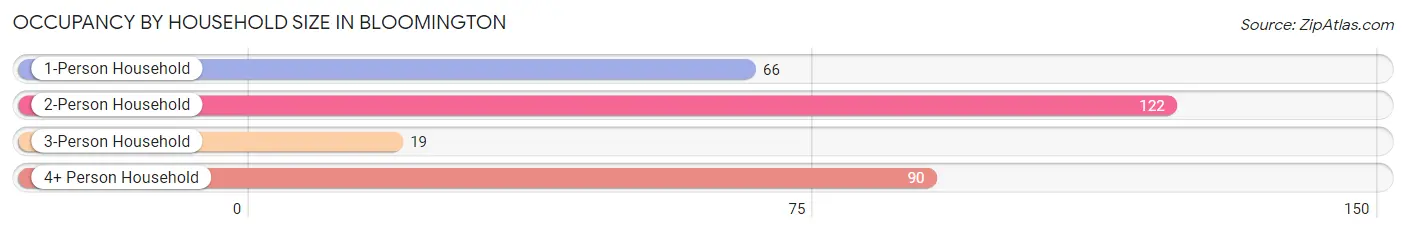
| Household Size | # Housing Units | % Housing Units |
| 1-Person Household | 66 | 22.2% |
| 2-Person Household | 122 | 41.1% |
| 3-Person Household | 19 | 6.4% |
| 4+ Person Household | 90 | 30.3% |
| Total Housing Units | 297 | 100.0% |
Occupancy by Ownership by Household Size in Bloomington
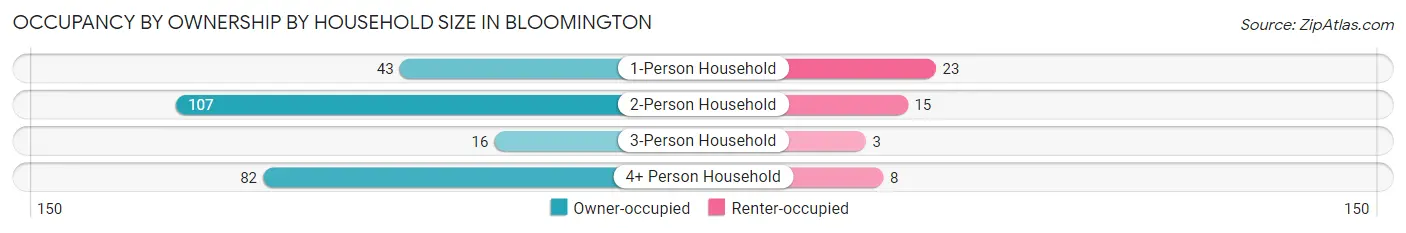
| Household Size | Owner-occupied | Renter-occupied |
| 1-Person Household | 43 (65.1%) | 23 (34.8%) |
| 2-Person Household | 107 (87.7%) | 15 (12.3%) |
| 3-Person Household | 16 (84.2%) | 3 (15.8%) |
| 4+ Person Household | 82 (91.1%) | 8 (8.9%) |
| Total Housing Units | 248 (83.5%) | 49 (16.5%) |
Occupancy by Educational Attainment in Bloomington
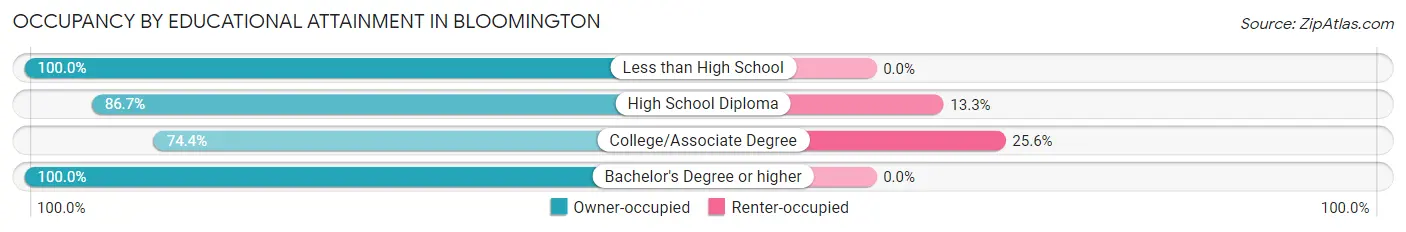
| Household Size | Owner-occupied | Renter-occupied |
| Less than High School | 3 (100.0%) | 0 (0.0%) |
| High School Diploma | 117 (86.7%) | 18 (13.3%) |
| College/Associate Degree | 90 (74.4%) | 31 (25.6%) |
| Bachelor's Degree or higher | 38 (100.0%) | 0 (0.0%) |
Occupancy by Age of Householder in Bloomington
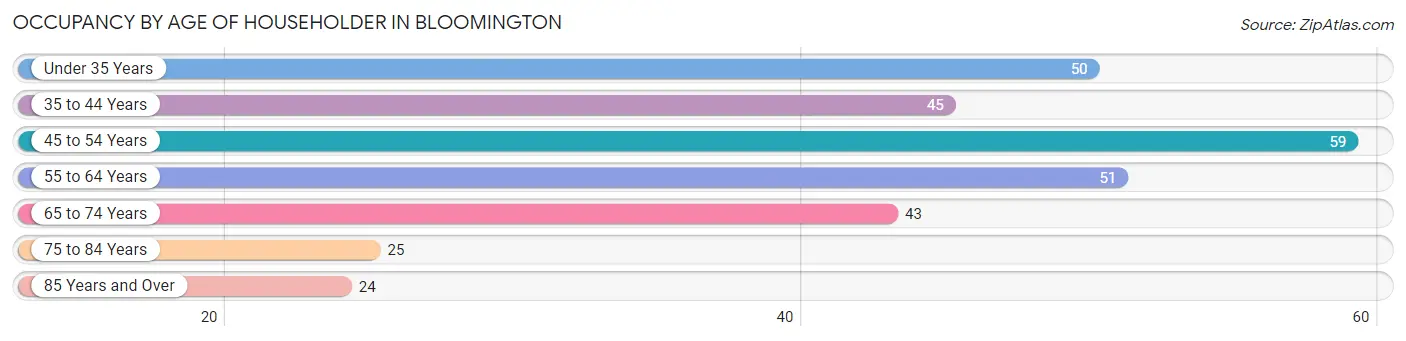
| Age Bracket | # Households | % Households |
| Under 35 Years | 50 | 16.8% |
| 35 to 44 Years | 45 | 15.1% |
| 45 to 54 Years | 59 | 19.9% |
| 55 to 64 Years | 51 | 17.2% |
| 65 to 74 Years | 43 | 14.5% |
| 75 to 84 Years | 25 | 8.4% |
| 85 Years and Over | 24 | 8.1% |
| Total | 297 | 100.0% |
Housing Finances in Bloomington
Median Income by Occupancy in Bloomington
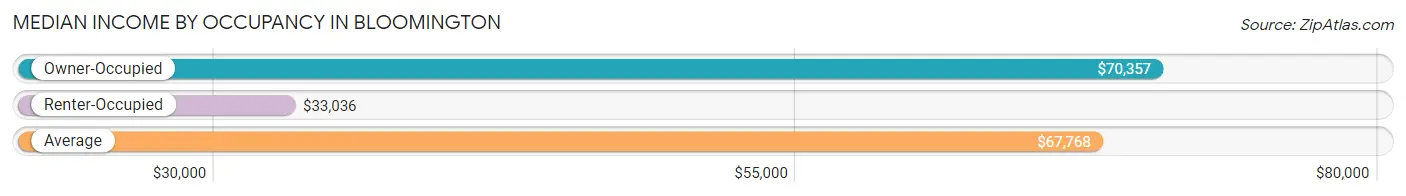
| Occupancy Type | # Households | Median Income |
| Owner-Occupied | 248 (83.5%) | $70,357 |
| Renter-Occupied | 49 (16.5%) | $33,036 |
| Average | 297 (100.0%) | $67,768 |
Occupancy by Householder Income Bracket in Bloomington
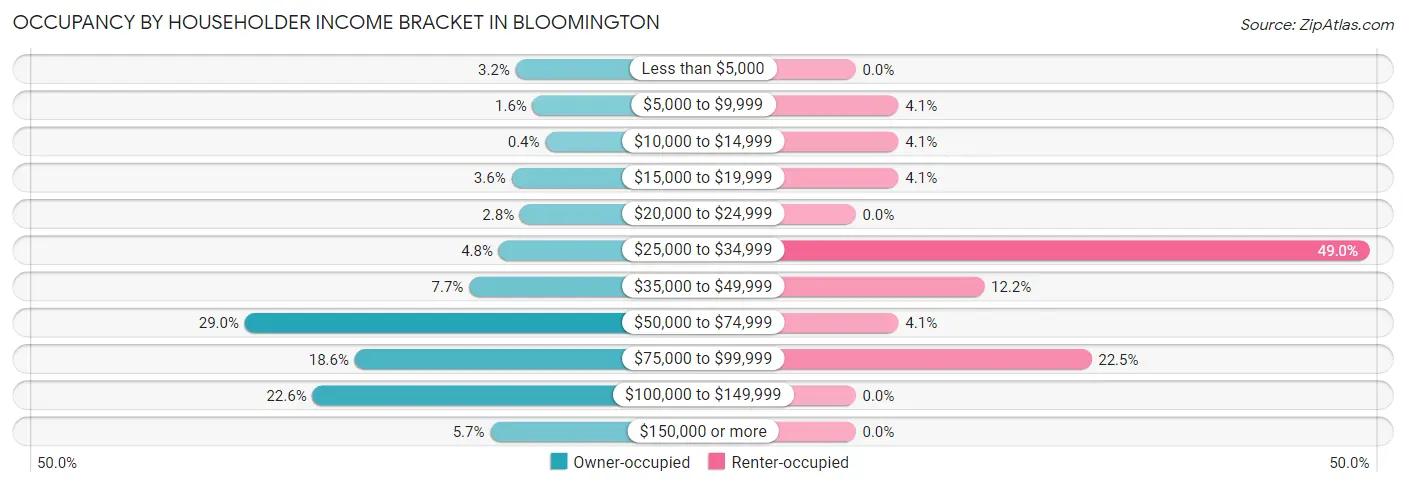
| Income Bracket | Owner-occupied | Renter-occupied |
| Less than $5,000 | 8 (3.2%) | 0 (0.0%) |
| $5,000 to $9,999 | 4 (1.6%) | 2 (4.1%) |
| $10,000 to $14,999 | 1 (0.4%) | 2 (4.1%) |
| $15,000 to $19,999 | 9 (3.6%) | 2 (4.1%) |
| $20,000 to $24,999 | 7 (2.8%) | 0 (0.0%) |
| $25,000 to $34,999 | 12 (4.8%) | 24 (49.0%) |
| $35,000 to $49,999 | 19 (7.7%) | 6 (12.2%) |
| $50,000 to $74,999 | 72 (29.0%) | 2 (4.1%) |
| $75,000 to $99,999 | 46 (18.5%) | 11 (22.5%) |
| $100,000 to $149,999 | 56 (22.6%) | 0 (0.0%) |
| $150,000 or more | 14 (5.7%) | 0 (0.0%) |
| Total | 248 (100.0%) | 49 (100.0%) |
Monthly Housing Cost Tiers in Bloomington
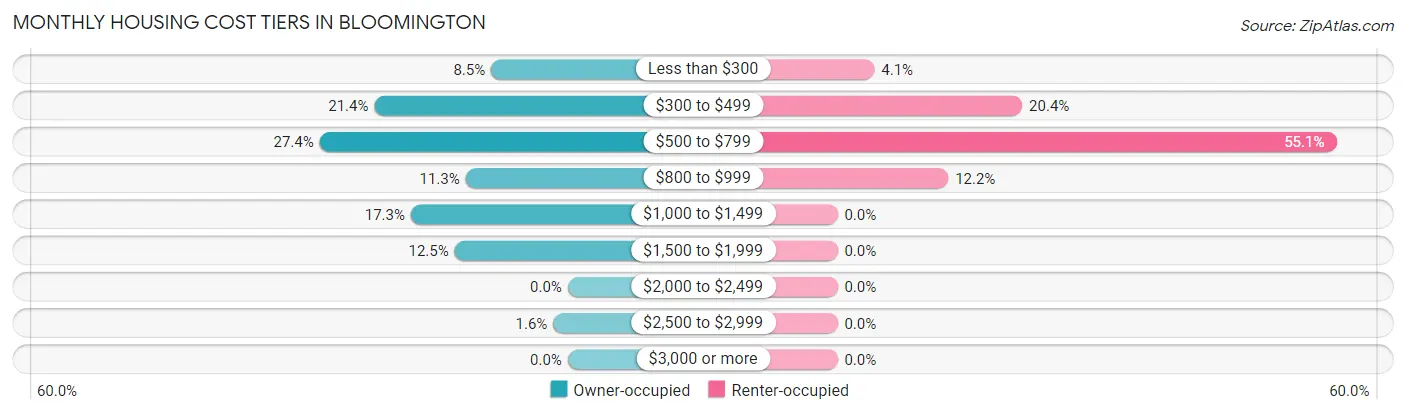
| Monthly Cost | Owner-occupied | Renter-occupied |
| Less than $300 | 21 (8.5%) | 2 (4.1%) |
| $300 to $499 | 53 (21.4%) | 10 (20.4%) |
| $500 to $799 | 68 (27.4%) | 27 (55.1%) |
| $800 to $999 | 28 (11.3%) | 6 (12.2%) |
| $1,000 to $1,499 | 43 (17.3%) | 0 (0.0%) |
| $1,500 to $1,999 | 31 (12.5%) | 0 (0.0%) |
| $2,000 to $2,499 | 0 (0.0%) | 0 (0.0%) |
| $2,500 to $2,999 | 4 (1.6%) | 0 (0.0%) |
| $3,000 or more | 0 (0.0%) | 0 (0.0%) |
| Total | 248 (100.0%) | 49 (100.0%) |
Physical Housing Characteristics in Bloomington
Housing Structures in Bloomington
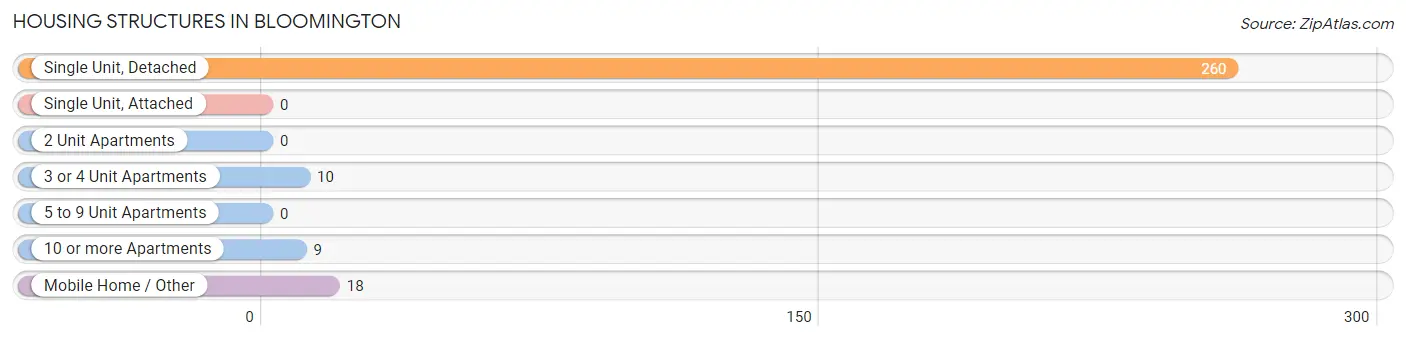
| Structure Type | # Housing Units | % Housing Units |
| Single Unit, Detached | 260 | 87.5% |
| Single Unit, Attached | 0 | 0.0% |
| 2 Unit Apartments | 0 | 0.0% |
| 3 or 4 Unit Apartments | 10 | 3.4% |
| 5 to 9 Unit Apartments | 0 | 0.0% |
| 10 or more Apartments | 9 | 3.0% |
| Mobile Home / Other | 18 | 6.1% |
| Total | 297 | 100.0% |
Housing Structures by Occupancy in Bloomington
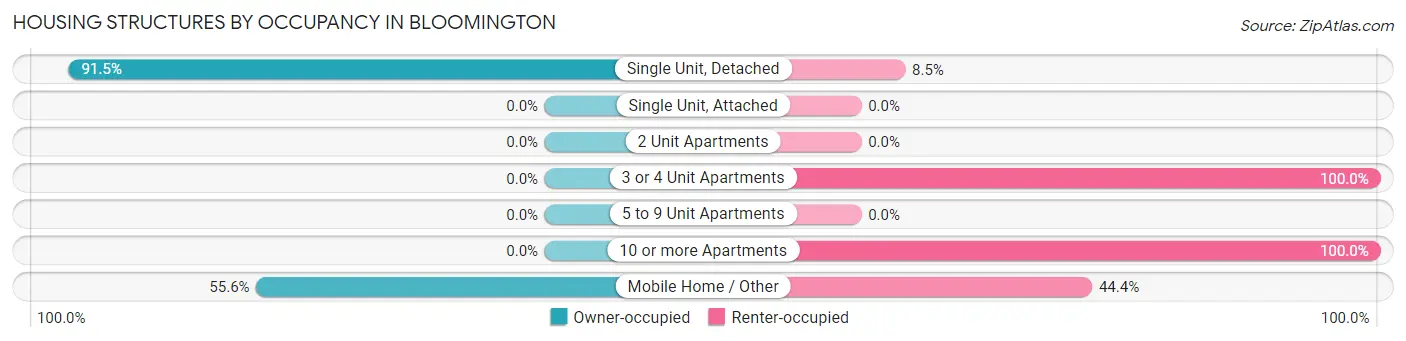
| Structure Type | Owner-occupied | Renter-occupied |
| Single Unit, Detached | 238 (91.5%) | 22 (8.5%) |
| Single Unit, Attached | 0 (0.0%) | 0 (0.0%) |
| 2 Unit Apartments | 0 (0.0%) | 0 (0.0%) |
| 3 or 4 Unit Apartments | 0 (0.0%) | 10 (100.0%) |
| 5 to 9 Unit Apartments | 0 (0.0%) | 0 (0.0%) |
| 10 or more Apartments | 0 (0.0%) | 9 (100.0%) |
| Mobile Home / Other | 10 (55.6%) | 8 (44.4%) |
| Total | 248 (83.5%) | 49 (16.5%) |
Housing Structures by Number of Rooms in Bloomington
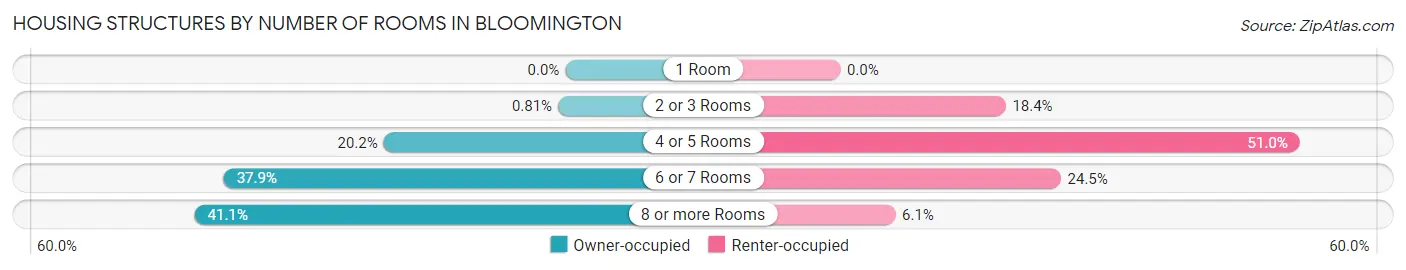
| Number of Rooms | Owner-occupied | Renter-occupied |
| 1 Room | 0 (0.0%) | 0 (0.0%) |
| 2 or 3 Rooms | 2 (0.8%) | 9 (18.4%) |
| 4 or 5 Rooms | 50 (20.2%) | 25 (51.0%) |
| 6 or 7 Rooms | 94 (37.9%) | 12 (24.5%) |
| 8 or more Rooms | 102 (41.1%) | 3 (6.1%) |
| Total | 248 (100.0%) | 49 (100.0%) |
Housing Structure by Heating Type in Bloomington
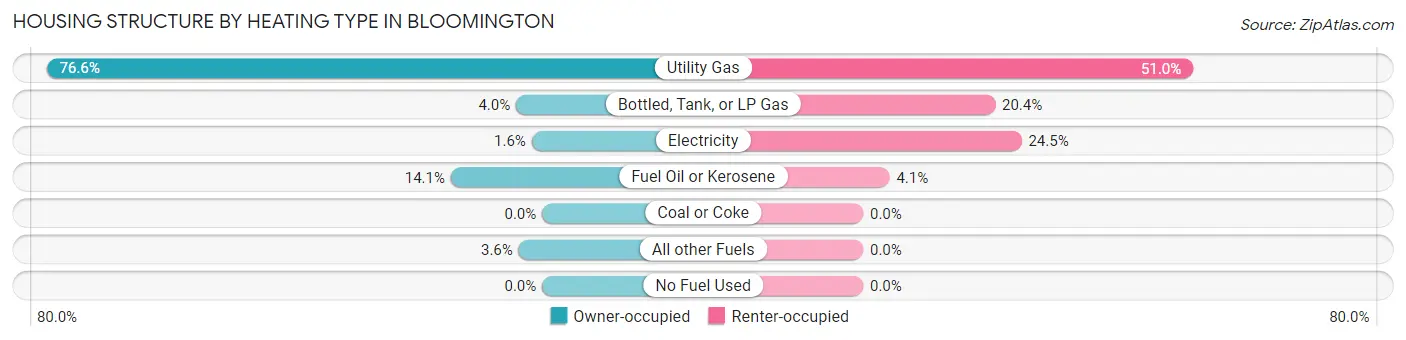
| Heating Type | Owner-occupied | Renter-occupied |
| Utility Gas | 190 (76.6%) | 25 (51.0%) |
| Bottled, Tank, or LP Gas | 10 (4.0%) | 10 (20.4%) |
| Electricity | 4 (1.6%) | 12 (24.5%) |
| Fuel Oil or Kerosene | 35 (14.1%) | 2 (4.1%) |
| Coal or Coke | 0 (0.0%) | 0 (0.0%) |
| All other Fuels | 9 (3.6%) | 0 (0.0%) |
| No Fuel Used | 0 (0.0%) | 0 (0.0%) |
| Total | 248 (100.0%) | 49 (100.0%) |
Household Vehicle Usage in Bloomington
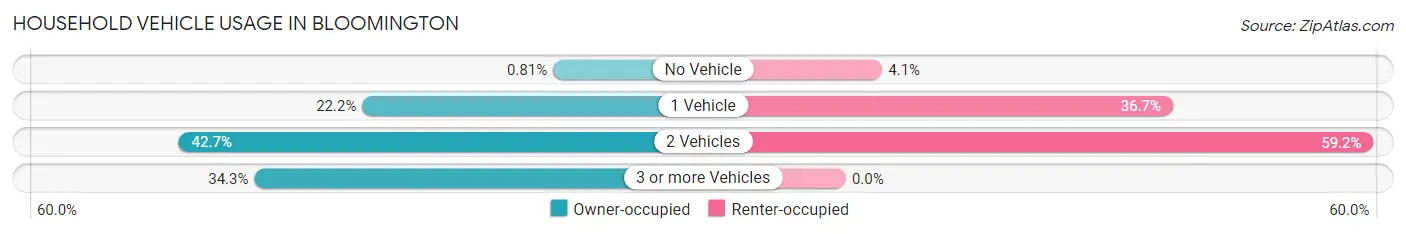
| Vehicles per Household | Owner-occupied | Renter-occupied |
| No Vehicle | 2 (0.8%) | 2 (4.1%) |
| 1 Vehicle | 55 (22.2%) | 18 (36.7%) |
| 2 Vehicles | 106 (42.7%) | 29 (59.2%) |
| 3 or more Vehicles | 85 (34.3%) | 0 (0.0%) |
| Total | 248 (100.0%) | 49 (100.0%) |
Real Estate & Mortgages in Bloomington
Real Estate and Mortgage Overview in Bloomington
| Characteristic | Without Mortgage | With Mortgage |
| Housing Units | 132 | 116 |
| Median Property Value | $131,300 | $135,500 |
| Median Household Income | $64,444 | $3 |
| Monthly Housing Costs | $480 | $0 |
| Real Estate Taxes | $2,000 | $0 |
Property Value by Mortgage Status in Bloomington
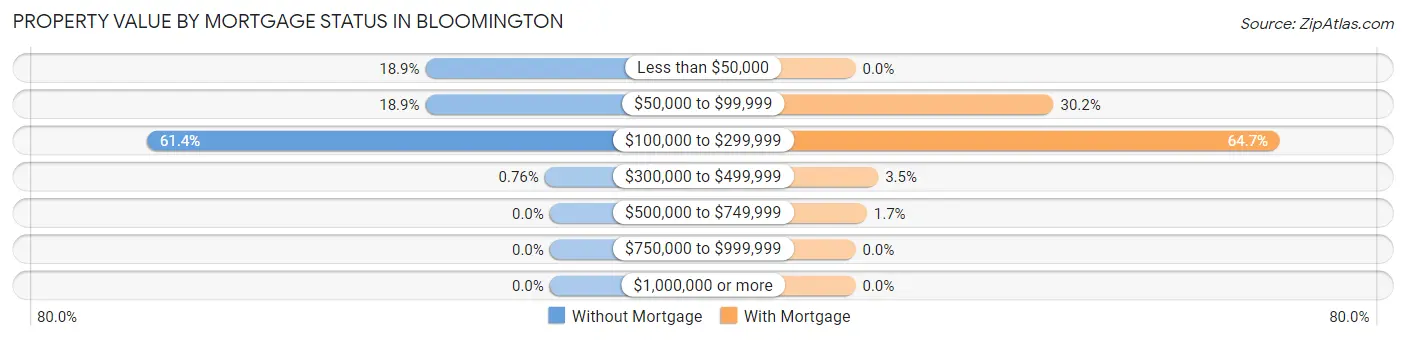
| Property Value | Without Mortgage | With Mortgage |
| Less than $50,000 | 25 (18.9%) | 0 (0.0%) |
| $50,000 to $99,999 | 25 (18.9%) | 35 (30.2%) |
| $100,000 to $299,999 | 81 (61.4%) | 75 (64.7%) |
| $300,000 to $499,999 | 1 (0.8%) | 4 (3.5%) |
| $500,000 to $749,999 | 0 (0.0%) | 2 (1.7%) |
| $750,000 to $999,999 | 0 (0.0%) | 0 (0.0%) |
| $1,000,000 or more | 0 (0.0%) | 0 (0.0%) |
| Total | 132 (100.0%) | 116 (100.0%) |
Household Income by Mortgage Status in Bloomington
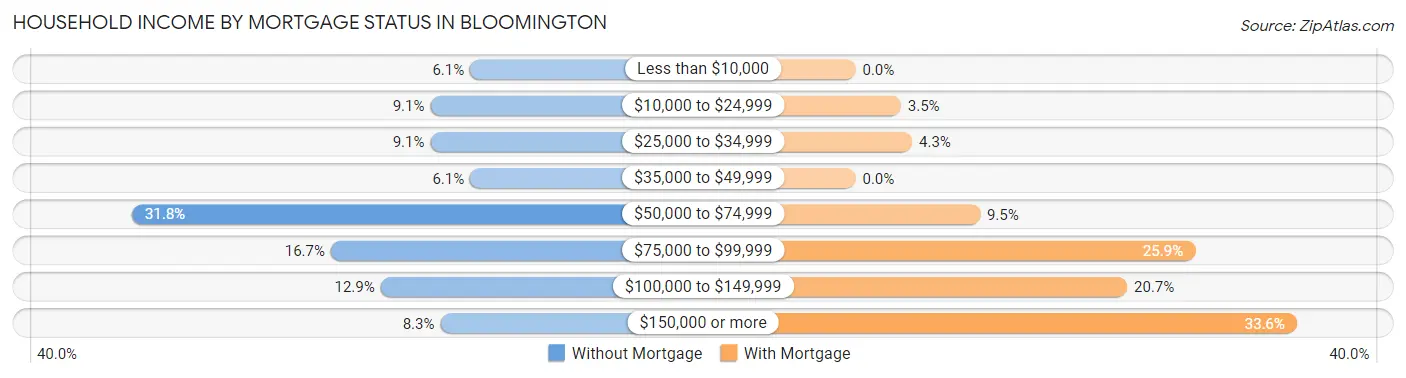
| Household Income | Without Mortgage | With Mortgage |
| Less than $10,000 | 8 (6.1%) | 0 (0.0%) |
| $10,000 to $24,999 | 12 (9.1%) | 4 (3.5%) |
| $25,000 to $34,999 | 12 (9.1%) | 5 (4.3%) |
| $35,000 to $49,999 | 8 (6.1%) | 0 (0.0%) |
| $50,000 to $74,999 | 42 (31.8%) | 11 (9.5%) |
| $75,000 to $99,999 | 22 (16.7%) | 30 (25.9%) |
| $100,000 to $149,999 | 17 (12.9%) | 24 (20.7%) |
| $150,000 or more | 11 (8.3%) | 39 (33.6%) |
| Total | 132 (100.0%) | 116 (100.0%) |
Property Value to Household Income Ratio in Bloomington
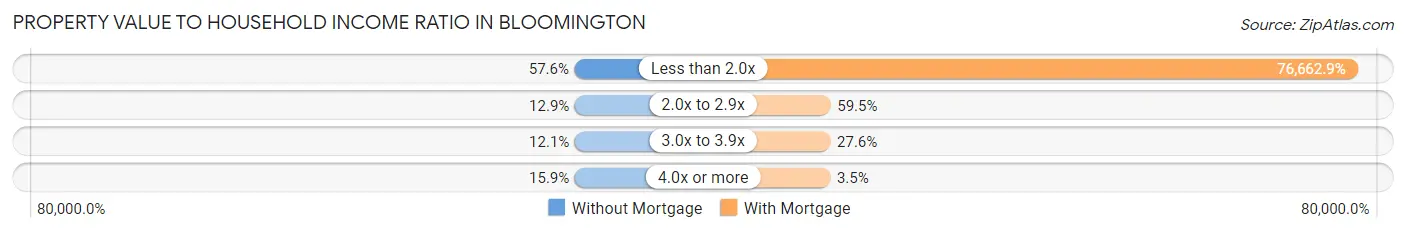
| Value-to-Income Ratio | Without Mortgage | With Mortgage |
| Less than 2.0x | 76 (57.6%) | 88,929 (76,662.9%) |
| 2.0x to 2.9x | 17 (12.9%) | 69 (59.5%) |
| 3.0x to 3.9x | 16 (12.1%) | 32 (27.6%) |
| 4.0x or more | 21 (15.9%) | 4 (3.5%) |
| Total | 132 (100.0%) | 116 (100.0%) |
Real Estate Taxes by Mortgage Status in Bloomington
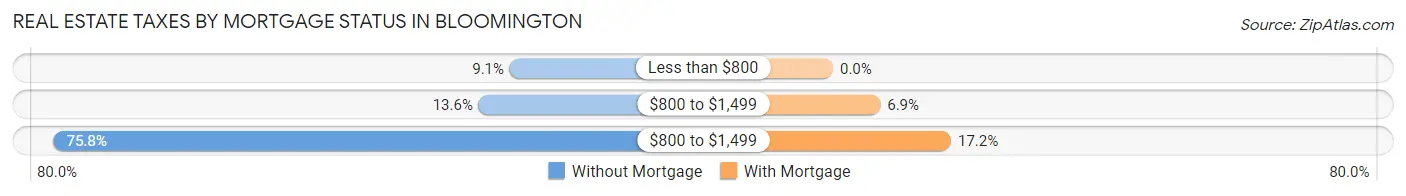
| Property Taxes | Without Mortgage | With Mortgage |
| Less than $800 | 12 (9.1%) | 0 (0.0%) |
| $800 to $1,499 | 18 (13.6%) | 8 (6.9%) |
| $800 to $1,499 | 100 (75.8%) | 20 (17.2%) |
| Total | 132 (100.0%) | 116 (100.0%) |
Health & Disability in Bloomington
Health Insurance Coverage by Age in Bloomington
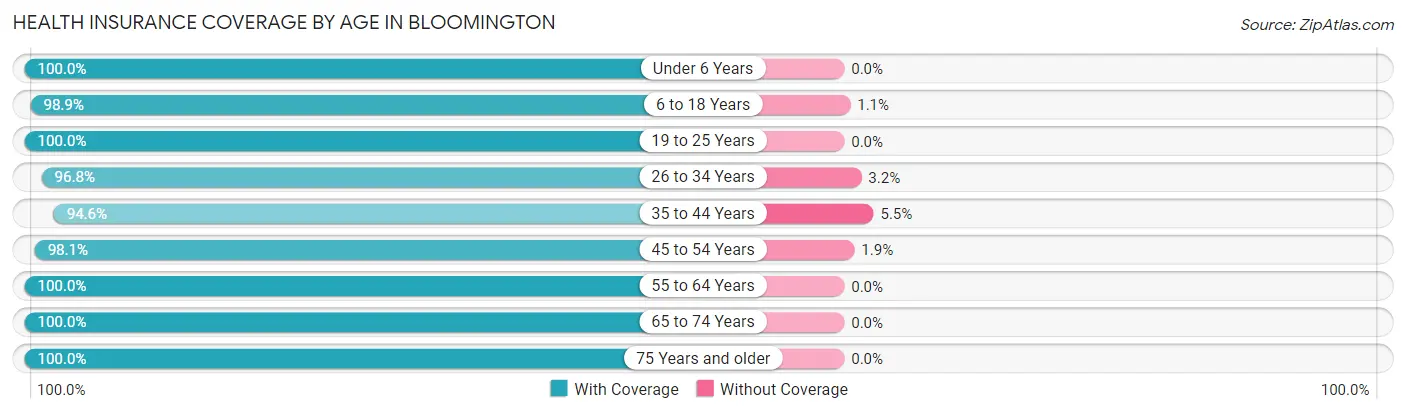
| Age Bracket | With Coverage | Without Coverage |
| Under 6 Years | 53 (100.0%) | 0 (0.0%) |
| 6 to 18 Years | 176 (98.9%) | 2 (1.1%) |
| 19 to 25 Years | 32 (100.0%) | 0 (0.0%) |
| 26 to 34 Years | 91 (96.8%) | 3 (3.2%) |
| 35 to 44 Years | 52 (94.6%) | 3 (5.4%) |
| 45 to 54 Years | 104 (98.1%) | 2 (1.9%) |
| 55 to 64 Years | 88 (100.0%) | 0 (0.0%) |
| 65 to 74 Years | 74 (100.0%) | 0 (0.0%) |
| 75 Years and older | 71 (100.0%) | 0 (0.0%) |
| Total | 741 (98.7%) | 10 (1.3%) |
Health Insurance Coverage by Citizenship Status in Bloomington
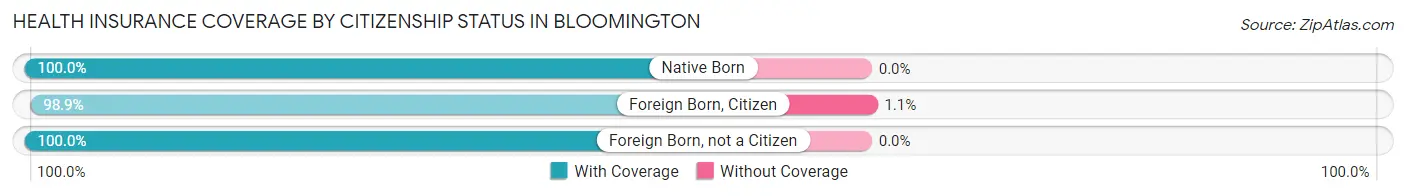
| Citizenship Status | With Coverage | Without Coverage |
| Native Born | 53 (100.0%) | 0 (0.0%) |
| Foreign Born, Citizen | 176 (98.9%) | 2 (1.1%) |
| Foreign Born, not a Citizen | 32 (100.0%) | 0 (0.0%) |
Health Insurance Coverage by Household Income in Bloomington
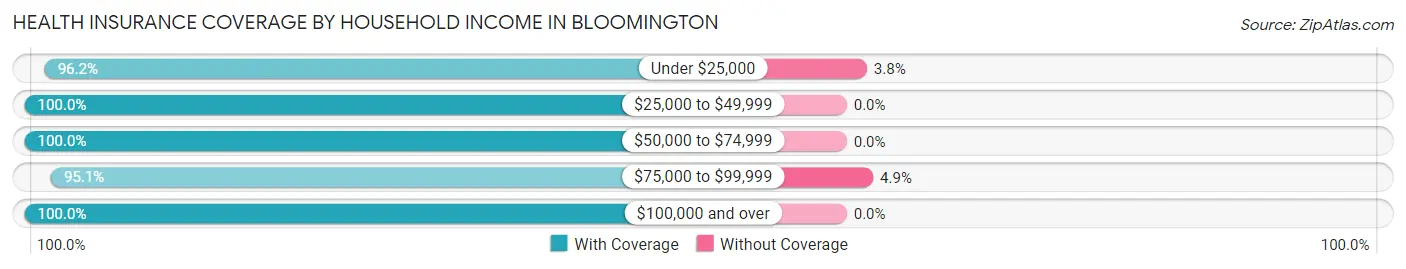
| Household Income | With Coverage | Without Coverage |
| Under $25,000 | 51 (96.2%) | 2 (3.8%) |
| $25,000 to $49,999 | 128 (100.0%) | 0 (0.0%) |
| $50,000 to $74,999 | 188 (100.0%) | 0 (0.0%) |
| $75,000 to $99,999 | 154 (95.1%) | 8 (4.9%) |
| $100,000 and over | 220 (100.0%) | 0 (0.0%) |
Public vs Private Health Insurance Coverage by Age in Bloomington
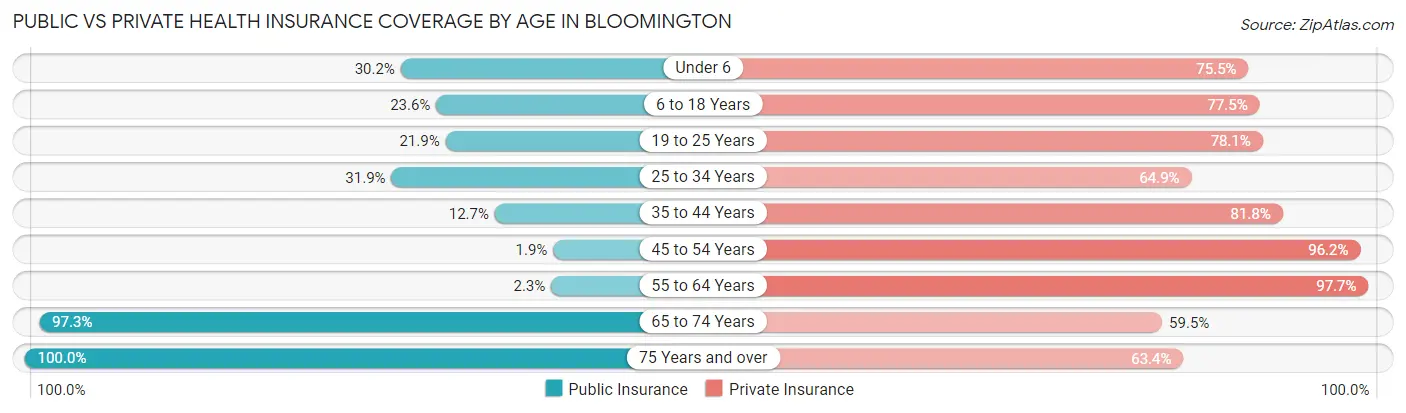
| Age Bracket | Public Insurance | Private Insurance |
| Under 6 | 16 (30.2%) | 40 (75.5%) |
| 6 to 18 Years | 42 (23.6%) | 138 (77.5%) |
| 19 to 25 Years | 7 (21.9%) | 25 (78.1%) |
| 25 to 34 Years | 30 (31.9%) | 61 (64.9%) |
| 35 to 44 Years | 7 (12.7%) | 45 (81.8%) |
| 45 to 54 Years | 2 (1.9%) | 102 (96.2%) |
| 55 to 64 Years | 2 (2.3%) | 86 (97.7%) |
| 65 to 74 Years | 72 (97.3%) | 44 (59.5%) |
| 75 Years and over | 71 (100.0%) | 45 (63.4%) |
| Total | 249 (33.2%) | 586 (78.0%) |
Disability Status by Sex by Age in Bloomington
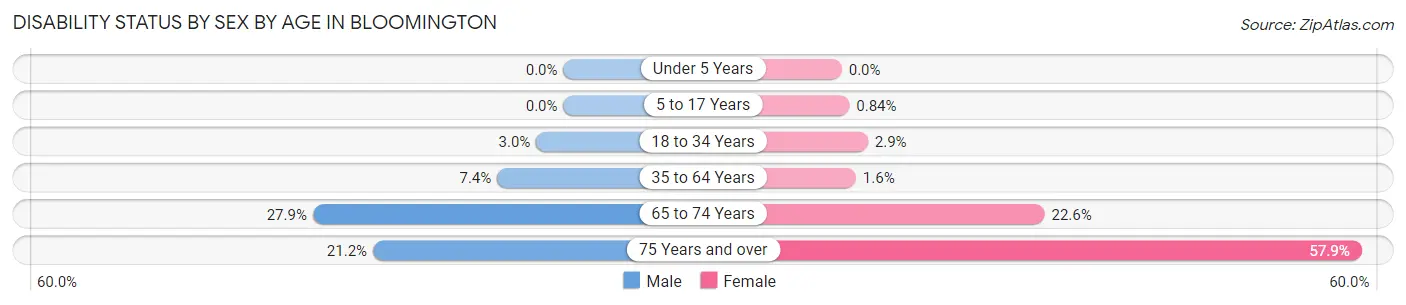
| Age Bracket | Male | Female |
| Under 5 Years | 0 (0.0%) | 0 (0.0%) |
| 5 to 17 Years | 0 (0.0%) | 1 (0.8%) |
| 18 to 34 Years | 2 (3.0%) | 2 (2.9%) |
| 35 to 64 Years | 9 (7.4%) | 2 (1.6%) |
| 65 to 74 Years | 12 (27.9%) | 7 (22.6%) |
| 75 Years and over | 7 (21.2%) | 22 (57.9%) |
Disability Class by Sex by Age in Bloomington
Disability Class: Hearing Difficulty
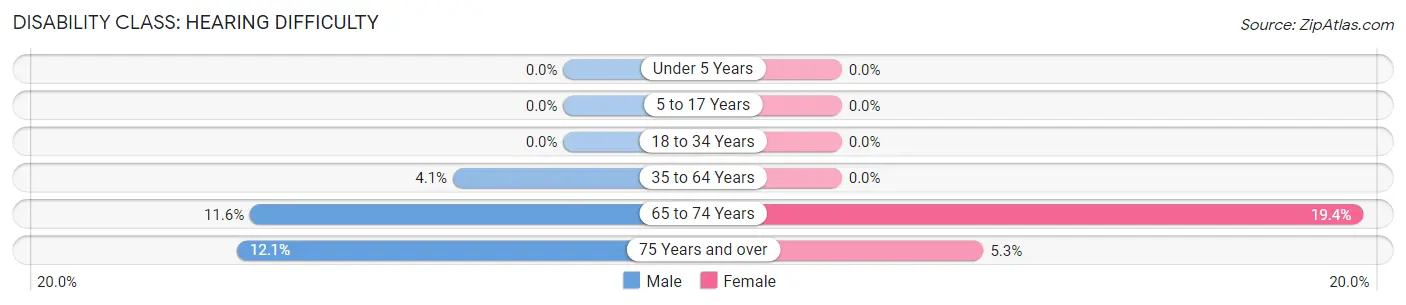
| Age Bracket | Male | Female |
| Under 5 Years | 0 (0.0%) | 0 (0.0%) |
| 5 to 17 Years | 0 (0.0%) | 0 (0.0%) |
| 18 to 34 Years | 0 (0.0%) | 0 (0.0%) |
| 35 to 64 Years | 5 (4.1%) | 0 (0.0%) |
| 65 to 74 Years | 5 (11.6%) | 6 (19.4%) |
| 75 Years and over | 4 (12.1%) | 2 (5.3%) |
Disability Class: Vision Difficulty
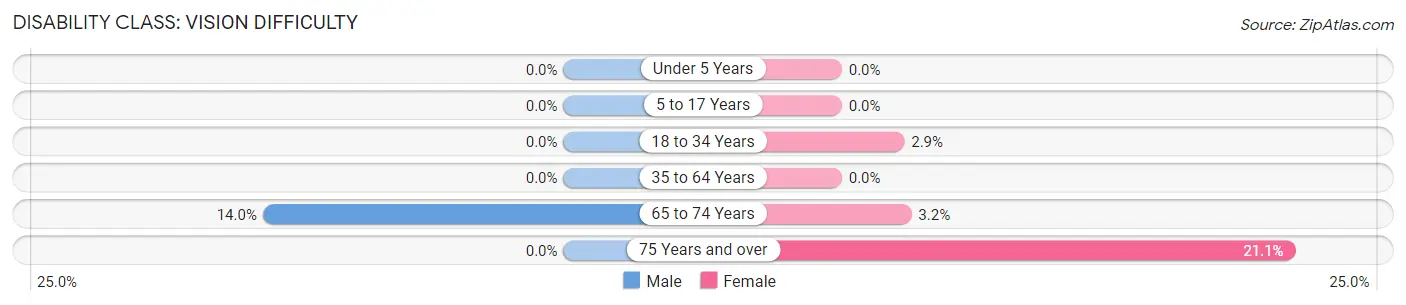
| Age Bracket | Male | Female |
| Under 5 Years | 0 (0.0%) | 0 (0.0%) |
| 5 to 17 Years | 0 (0.0%) | 0 (0.0%) |
| 18 to 34 Years | 0 (0.0%) | 2 (2.9%) |
| 35 to 64 Years | 0 (0.0%) | 0 (0.0%) |
| 65 to 74 Years | 6 (14.0%) | 1 (3.2%) |
| 75 Years and over | 0 (0.0%) | 8 (21.0%) |
Disability Class: Cognitive Difficulty
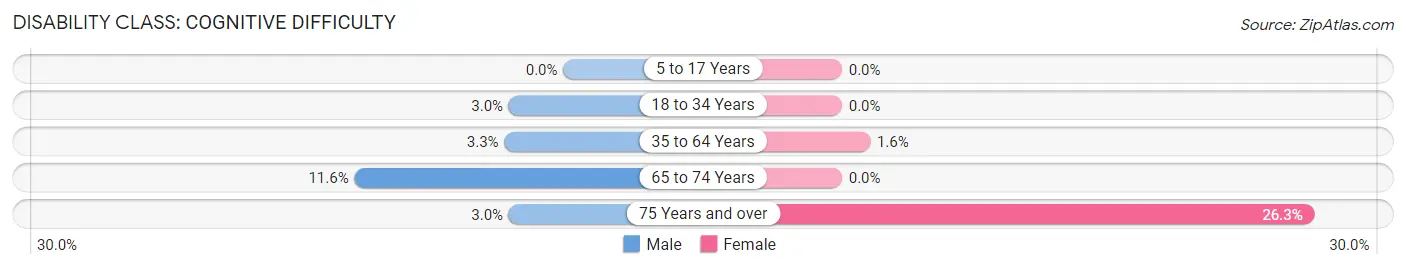
| Age Bracket | Male | Female |
| 5 to 17 Years | 0 (0.0%) | 0 (0.0%) |
| 18 to 34 Years | 2 (3.0%) | 0 (0.0%) |
| 35 to 64 Years | 4 (3.3%) | 2 (1.6%) |
| 65 to 74 Years | 5 (11.6%) | 0 (0.0%) |
| 75 Years and over | 1 (3.0%) | 10 (26.3%) |
Disability Class: Ambulatory Difficulty
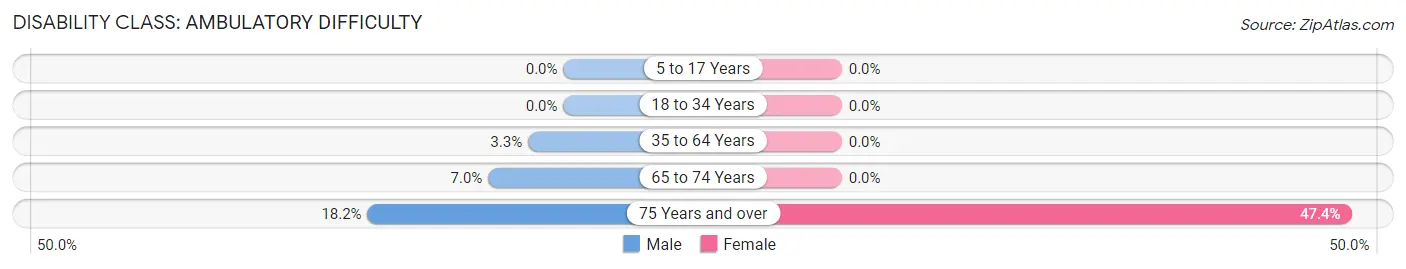
| Age Bracket | Male | Female |
| 5 to 17 Years | 0 (0.0%) | 0 (0.0%) |
| 18 to 34 Years | 0 (0.0%) | 0 (0.0%) |
| 35 to 64 Years | 4 (3.3%) | 0 (0.0%) |
| 65 to 74 Years | 3 (7.0%) | 0 (0.0%) |
| 75 Years and over | 6 (18.2%) | 18 (47.4%) |
Disability Class: Self-Care Difficulty
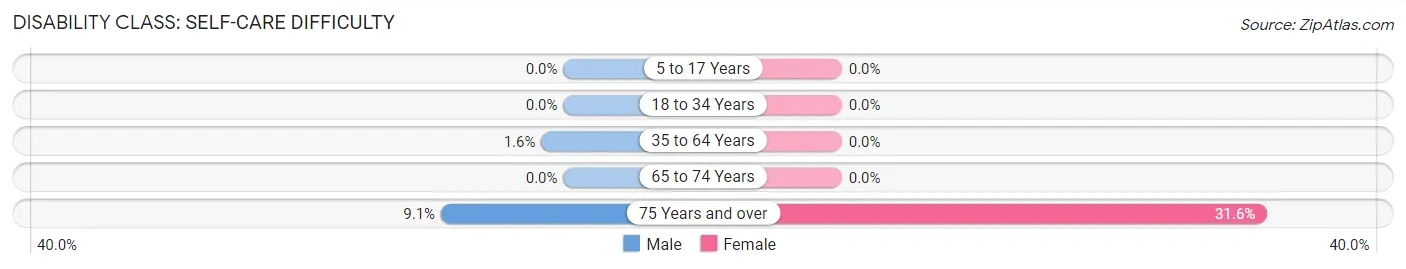
| Age Bracket | Male | Female |
| 5 to 17 Years | 0 (0.0%) | 0 (0.0%) |
| 18 to 34 Years | 0 (0.0%) | 0 (0.0%) |
| 35 to 64 Years | 2 (1.6%) | 0 (0.0%) |
| 65 to 74 Years | 0 (0.0%) | 0 (0.0%) |
| 75 Years and over | 3 (9.1%) | 12 (31.6%) |
Technology Access in Bloomington
Computing Device Access in Bloomington
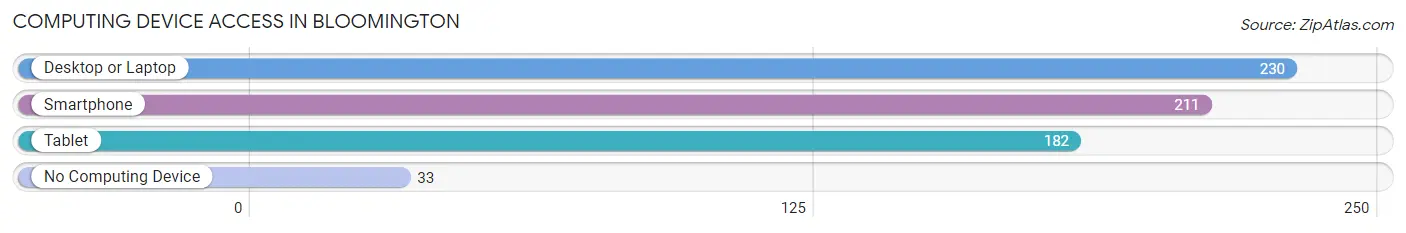
| Device Type | # Households | % Households |
| Desktop or Laptop | 230 | 77.4% |
| Smartphone | 211 | 71.0% |
| Tablet | 182 | 61.3% |
| No Computing Device | 33 | 11.1% |
| Total | 297 | 100.0% |
Internet Access in Bloomington
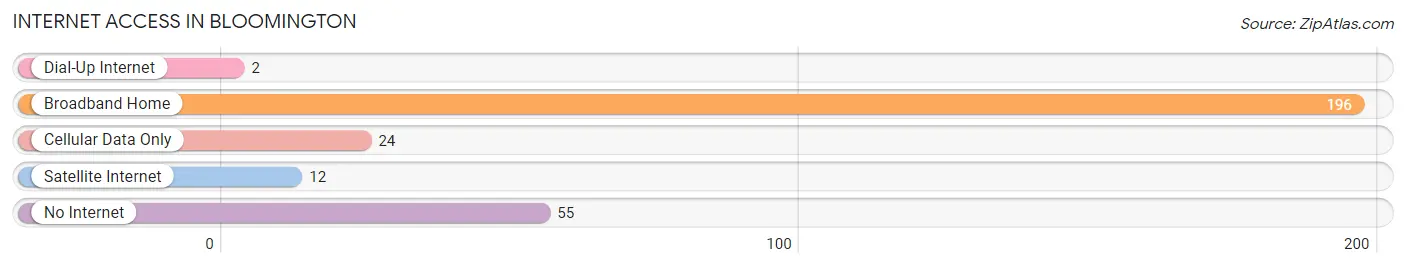
| Internet Type | # Households | % Households |
| Dial-Up Internet | 2 | 0.7% |
| Broadband Home | 196 | 66.0% |
| Cellular Data Only | 24 | 8.1% |
| Satellite Internet | 12 | 4.0% |
| No Internet | 55 | 18.5% |
| Total | 297 | 100.0% |
Bloomington Summary
Bloomington is a small village located in the south-central part of Wisconsin, in the county of Rock. It is situated on the banks of the Sugar River, and is surrounded by rolling hills and lush farmland. The village has a population of just over 1,000 people, and is part of the larger Janesville-Beloit metropolitan area.
History
The area that is now Bloomington was first settled in the early 1800s by a group of settlers from New York. The village was originally known as “New York Settlement”, and was later renamed Bloomington in 1845. The name was chosen to honor the many wildflowers that grew in the area.
The village was incorporated in 1848, and the first post office was established in 1849. The village grew slowly over the years, and by the turn of the century, it had a population of just over 500 people.
In the early 1900s, the village began to experience a period of growth and development. The first bank was established in 1906, and the first telephone service was established in 1908. The village also saw the construction of a number of new businesses, including a creamery, a cheese factory, and a canning factory.
Geography
Bloomington is located in the south-central part of Wisconsin, in the county of Rock. It is situated on the banks of the Sugar River, and is surrounded by rolling hills and lush farmland. The village is located approximately 25 miles south of Madison, and is part of the larger Janesville-Beloit metropolitan area.
The village has a total area of 1.2 square miles, all of which is land. The terrain is mostly flat, with some rolling hills in the surrounding area. The climate is generally mild, with cold winters and warm summers.
Economy
The economy of Bloomington is largely based on agriculture. The village is home to a number of farms, which produce a variety of crops, including corn, soybeans, and hay. The village also has a number of small businesses, including a grocery store, a hardware store, and a restaurant.
The village is also home to a number of manufacturing companies, including a plastics factory and a metal fabrication plant. The village is also home to a number of small businesses, including a bakery, a florist, and a furniture store.
Demographics
As of the 2010 census, the population of Bloomington was 1,072. The racial makeup of the village was 97.3% White, 0.7% African American, 0.2% Native American, 0.2% Asian, 0.1% Pacific Islander, 0.7% from other races, and 0.9% from two or more races. Hispanic or Latino of any race were 1.7% of the population.
The median income for a household in the village was $45,000, and the median income for a family was $50,000. The per capita income for the village was $20,000. About 8.3% of families and 10.2% of the population were below the poverty line, including 14.3% of those under age 18 and 6.3% of those age 65 or over.
Common Questions
What is Per Capita Income in Bloomington?
Per Capita income in Bloomington is $31,979.
What is the Median Family Income in Bloomington?
Median Family Income in Bloomington is $75,893.
What is the Median Household income in Bloomington?
Median Household Income in Bloomington is $67,768.
What is Income or Wage Gap in Bloomington?
Income or Wage Gap in Bloomington is 27.4%.
Women in Bloomington earn 72.6 cents for every dollar earned by a man.
What is Inequality or Gini Index in Bloomington?
Inequality or Gini Index in Bloomington is 0.39.
What is the Total Population of Bloomington?
Total Population of Bloomington is 751.
What is the Total Male Population of Bloomington?
Total Male Population of Bloomington is 356.
What is the Total Female Population of Bloomington?
Total Female Population of Bloomington is 395.
What is the Ratio of Males per 100 Females in Bloomington?
There are 90.13 Males per 100 Females in Bloomington.
What is the Ratio of Females per 100 Males in Bloomington?
There are 110.96 Females per 100 Males in Bloomington.
What is the Median Population Age in Bloomington?
Median Population Age in Bloomington is 38.8 Years.
What is the Average Family Size in Bloomington
Average Family Size in Bloomington is 2.9 People.
What is the Average Household Size in Bloomington
Average Household Size in Bloomington is 2.5 People.
How Large is the Labor Force in Bloomington?
There are 399 People in the Labor Forcein in Bloomington.
What is the Percentage of People in the Labor Force in Bloomington?
72.4% of People are in the Labor Force in Bloomington.
What is the Unemployment Rate in Bloomington?
Unemployment Rate in Bloomington is 1.5%.