Bloomer, WI Map & Demographics
Bloomer Map
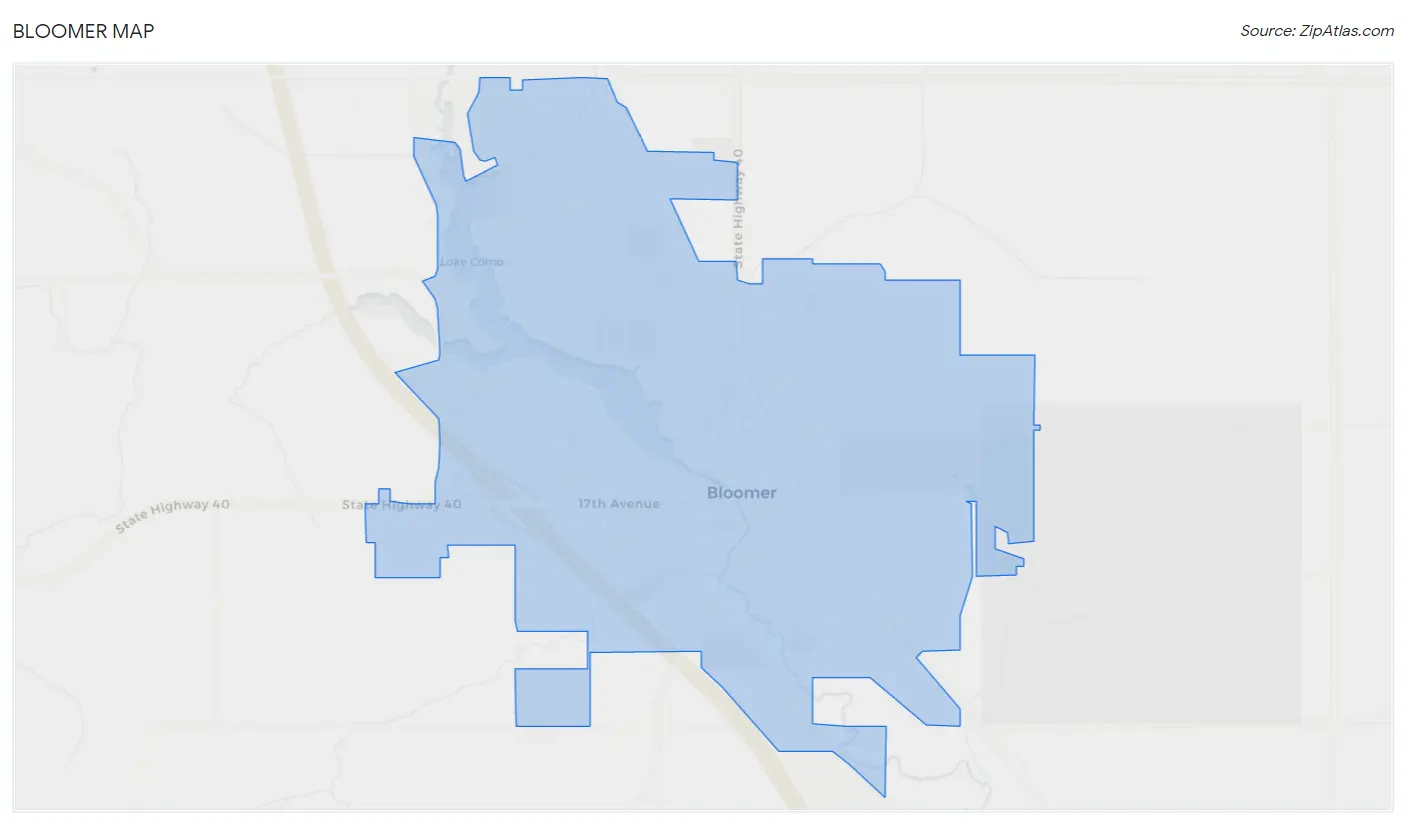
Bloomer Overview
$28,918
PER CAPITA INCOME
$78,320
AVG FAMILY INCOME
$48,398
AVG HOUSEHOLD INCOME
37.6%
WAGE / INCOME GAP [ % ]
62.4¢/ $1
WAGE / INCOME GAP [ $ ]
0.43
INEQUALITY / GINI INDEX
3,679
TOTAL POPULATION
1,573
MALE POPULATION
2,106
FEMALE POPULATION
74.69
MALES / 100 FEMALES
133.88
FEMALES / 100 MALES
34.7
MEDIAN AGE
3.4
AVG FAMILY SIZE
2.4
AVG HOUSEHOLD SIZE
1,890
LABOR FORCE [ PEOPLE ]
70.3%
PERCENT IN LABOR FORCE
2.3%
UNEMPLOYMENT RATE
Bloomer Zip Codes
Bloomer Area Codes
Income in Bloomer
Income Overview in Bloomer
Per Capita Income in Bloomer is $28,918, while median incomes of families and households are $78,320 and $48,398 respectively.
| Characteristic | Number | Measure |
| Per Capita Income | 3,679 | $28,918 |
| Median Family Income | 835 | $78,320 |
| Mean Family Income | 835 | $89,227 |
| Median Household Income | 1,487 | $48,398 |
| Mean Household Income | 1,487 | $67,683 |
| Income Deficit | 835 | $0 |
| Wage / Income Gap (%) | 3,679 | 37.64% |
| Wage / Income Gap ($) | 3,679 | 62.36¢ per $1 |
| Gini / Inequality Index | 3,679 | 0.43 |
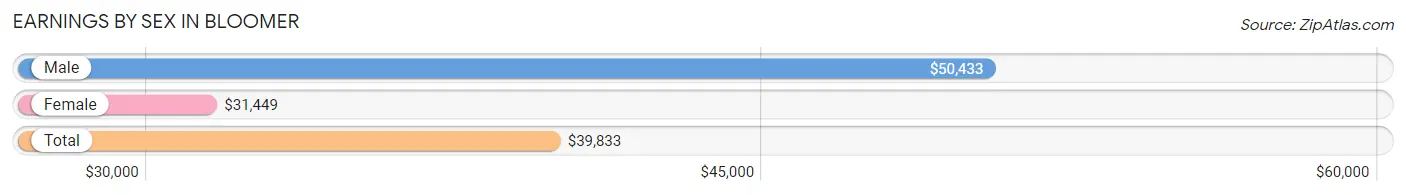
Earnings by Sex in Bloomer
Average Earnings in Bloomer are $39,833, $50,433 for men and $31,449 for women, a difference of 37.6%.
| Sex | Number | Average Earnings |
| Male | 887 (45.1%) | $50,433 |
| Female | 1,081 (54.9%) | $31,449 |
| Total | 1,968 (100.0%) | $39,833 |
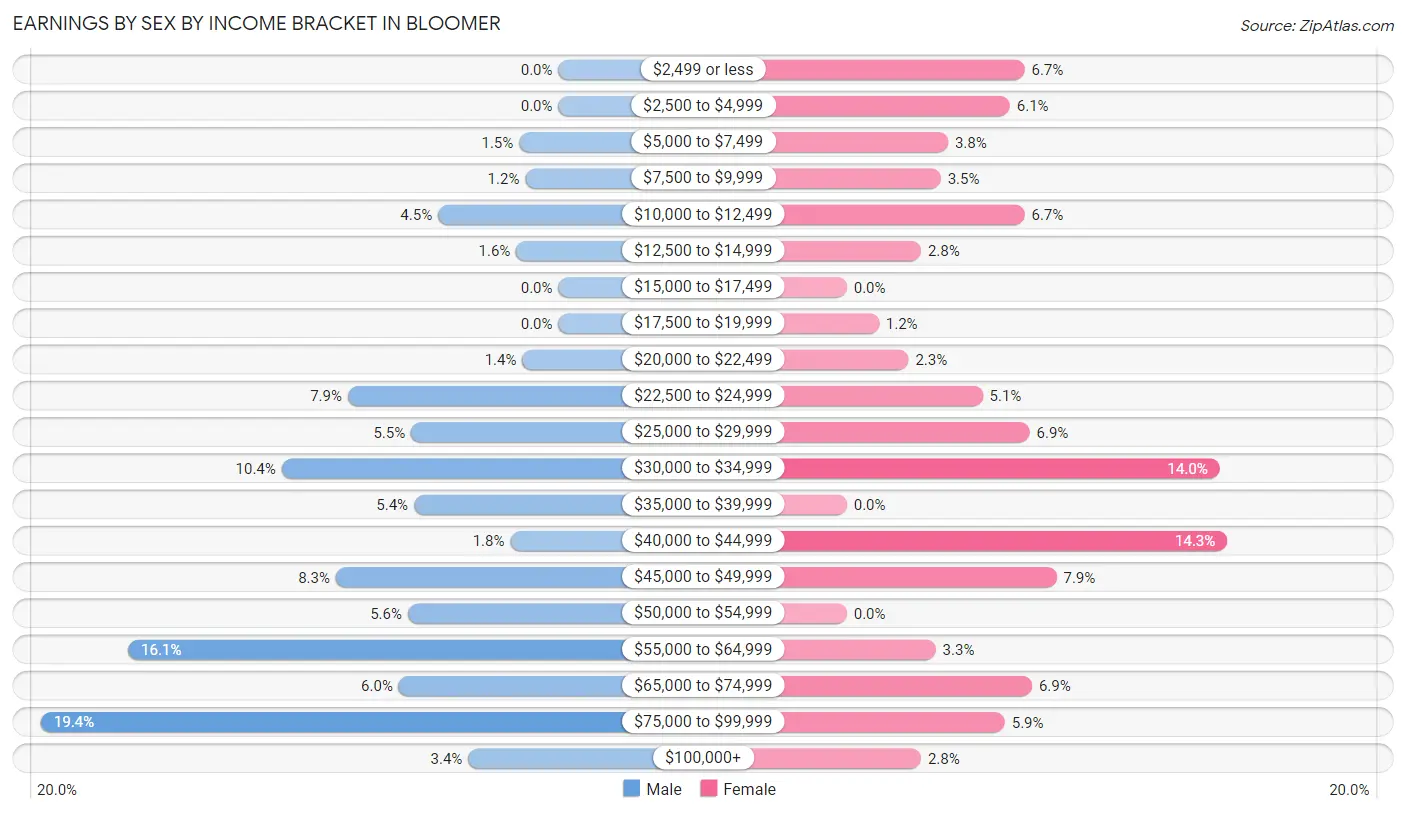
Earnings by Sex by Income Bracket in Bloomer
The most common earnings brackets in Bloomer are $75,000 to $99,999 for men (172 | 19.4%) and $40,000 to $44,999 for women (154 | 14.2%).
| Income | Male | Female |
| $2,499 or less | 0 (0.0%) | 72 (6.7%) |
| $2,500 to $4,999 | 0 (0.0%) | 66 (6.1%) |
| $5,000 to $7,499 | 13 (1.5%) | 41 (3.8%) |
| $7,500 to $9,999 | 11 (1.2%) | 38 (3.5%) |
| $10,000 to $12,499 | 40 (4.5%) | 72 (6.7%) |
| $12,500 to $14,999 | 14 (1.6%) | 30 (2.8%) |
| $15,000 to $17,499 | 0 (0.0%) | 0 (0.0%) |
| $17,500 to $19,999 | 0 (0.0%) | 13 (1.2%) |
| $20,000 to $22,499 | 12 (1.3%) | 25 (2.3%) |
| $22,500 to $24,999 | 70 (7.9%) | 55 (5.1%) |
| $25,000 to $29,999 | 49 (5.5%) | 74 (6.9%) |
| $30,000 to $34,999 | 92 (10.4%) | 151 (14.0%) |
| $35,000 to $39,999 | 48 (5.4%) | 0 (0.0%) |
| $40,000 to $44,999 | 16 (1.8%) | 154 (14.2%) |
| $45,000 to $49,999 | 74 (8.3%) | 85 (7.9%) |
| $50,000 to $54,999 | 50 (5.6%) | 0 (0.0%) |
| $55,000 to $64,999 | 143 (16.1%) | 36 (3.3%) |
| $65,000 to $74,999 | 53 (6.0%) | 75 (6.9%) |
| $75,000 to $99,999 | 172 (19.4%) | 64 (5.9%) |
| $100,000+ | 30 (3.4%) | 30 (2.8%) |
| Total | 887 (100.0%) | 1,081 (100.0%) |
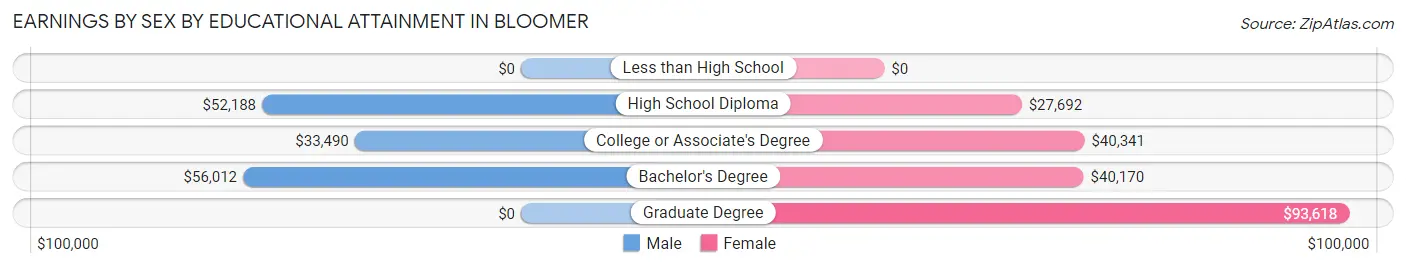
Earnings by Sex by Educational Attainment in Bloomer
Average earnings in Bloomer are $53,698 for men and $33,807 for women, a difference of 37.0%. Men with an educational attainment of bachelor's degree enjoy the highest average annual earnings of $56,012, while those with college or associate's degree education earn the least with $33,490. Women with an educational attainment of graduate degree earn the most with the average annual earnings of $93,618, while those with high school diploma education have the smallest earnings of $27,692.
| Educational Attainment | Male Income | Female Income |
| Less than High School | - | - |
| High School Diploma | $52,188 | $27,692 |
| College or Associate's Degree | $33,490 | $40,341 |
| Bachelor's Degree | $56,012 | $40,170 |
| Graduate Degree | - | - |
| Total | $53,698 | $33,807 |
Family Income in Bloomer
Family Income Brackets in Bloomer
According to the Bloomer family income data, there are 181 families falling into the $100,000 to $149,999 income range, which is the most common income bracket and makes up 21.7% of all families. Conversely, the $10,000 to $14,999 income bracket is the least frequent group with only 10 families (1.2%) belonging to this category.
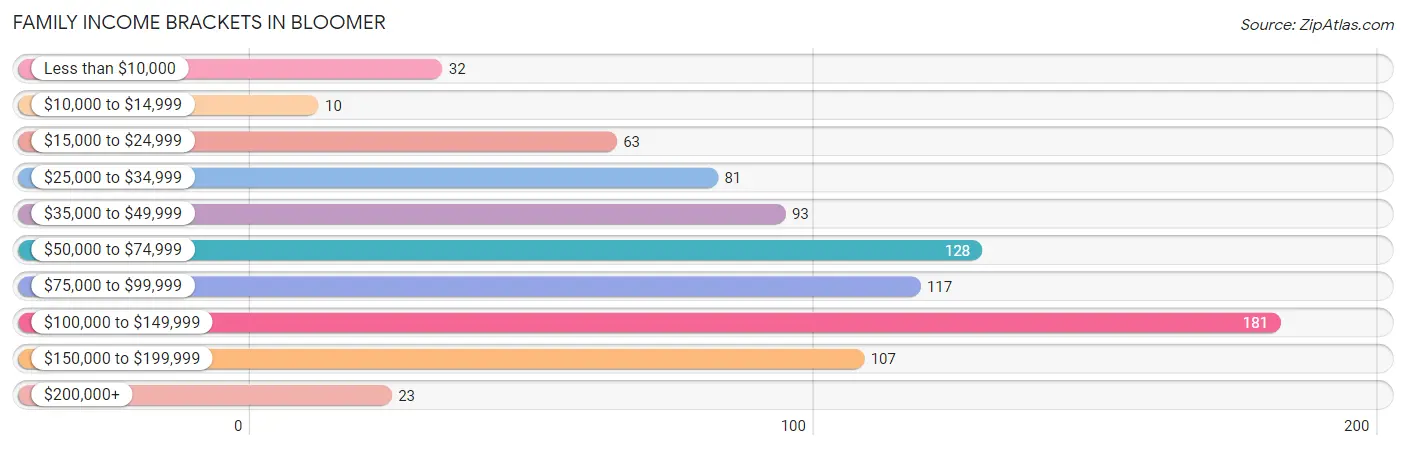
| Income Bracket | # Families | % Families |
| Less than $10,000 | 32 | 3.8% |
| $10,000 to $14,999 | 10 | 1.2% |
| $15,000 to $24,999 | 63 | 7.5% |
| $25,000 to $34,999 | 81 | 9.7% |
| $35,000 to $49,999 | 93 | 11.1% |
| $50,000 to $74,999 | 128 | 15.3% |
| $75,000 to $99,999 | 117 | 14.0% |
| $100,000 to $149,999 | 181 | 21.7% |
| $150,000 to $199,999 | 107 | 12.8% |
| $200,000+ | 23 | 2.8% |
Family Income by Famaliy Size in Bloomer
4-person families (174 | 20.8%) account for the highest median family income in Bloomer with $138,452 per family, while 4-person families (174 | 20.8%) have the highest median income of $34,613 per family member.
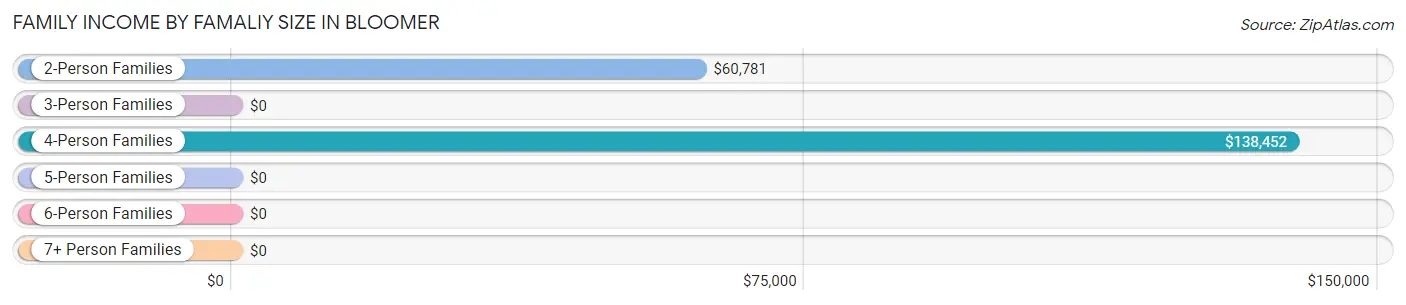
| Income Bracket | # Families | Median Income |
| 2-Person Families | 376 (45.0%) | $60,781 |
| 3-Person Families | 166 (19.9%) | $0 |
| 4-Person Families | 174 (20.8%) | $138,452 |
| 5-Person Families | 38 (4.5%) | $0 |
| 6-Person Families | 28 (3.4%) | $0 |
| 7+ Person Families | 53 (6.4%) | $0 |
| Total | 835 (100.0%) | $78,320 |
Family Income by Number of Earners in Bloomer
The median family income in Bloomer is $78,320, with families comprising 3+ earners (161) having the highest median family income of $155,332, while families with no earners (81) have the lowest median family income of $29,632, accounting for 19.3% and 9.7% of families, respectively.
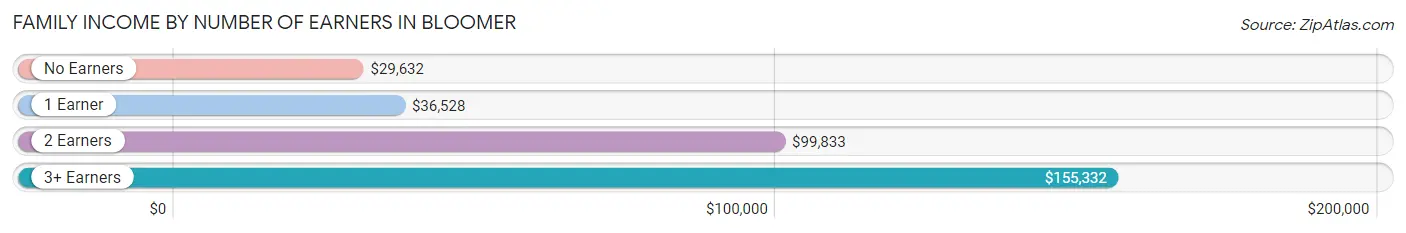
| Number of Earners | # Families | Median Income |
| No Earners | 81 (9.7%) | $29,632 |
| 1 Earner | 229 (27.4%) | $36,528 |
| 2 Earners | 364 (43.6%) | $99,833 |
| 3+ Earners | 161 (19.3%) | $155,332 |
| Total | 835 (100.0%) | $78,320 |
Household Income in Bloomer
Household Income Brackets in Bloomer
With 297 households falling in the category, the $25,000 to $34,999 income range is the most frequent in Bloomer, accounting for 20.0% of all households. In contrast, only 22 households (1.5%) fall into the $200,000+ income bracket, making it the least populous group.
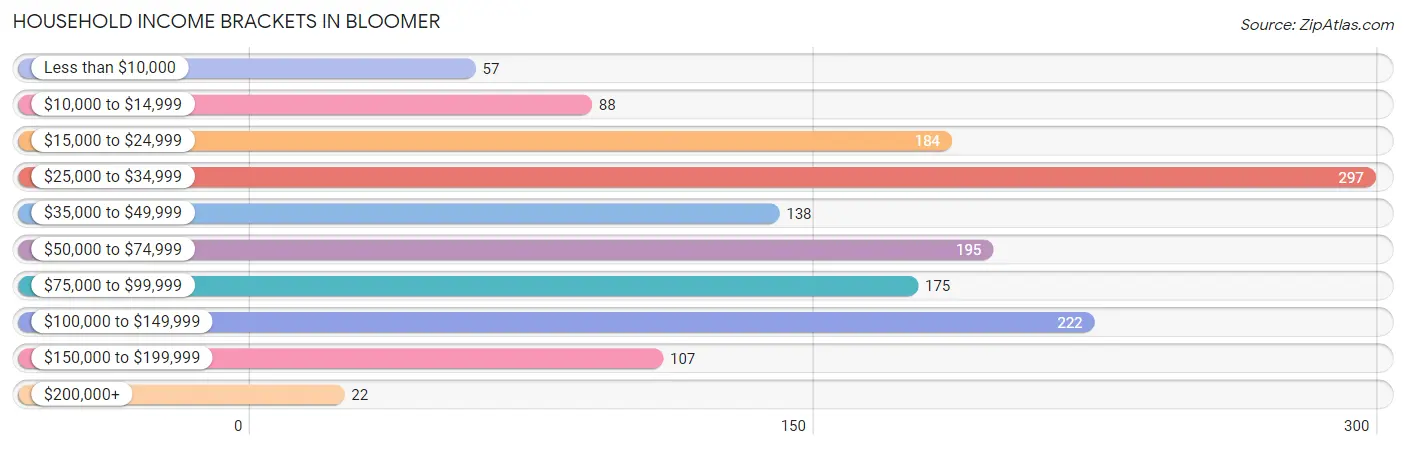
| Income Bracket | # Households | % Households |
| Less than $10,000 | 57 | 3.8% |
| $10,000 to $14,999 | 88 | 5.9% |
| $15,000 to $24,999 | 184 | 12.4% |
| $25,000 to $34,999 | 297 | 20.0% |
| $35,000 to $49,999 | 138 | 9.3% |
| $50,000 to $74,999 | 195 | 13.1% |
| $75,000 to $99,999 | 175 | 11.8% |
| $100,000 to $149,999 | 222 | 14.9% |
| $150,000 to $199,999 | 107 | 7.2% |
| $200,000+ | 22 | 1.5% |
Household Income by Householder Age in Bloomer
The median household income in Bloomer is $48,398, with the highest median household income of $82,820 found in the 45 to 64 years age bracket for the primary householder. A total of 521 households (35.0%) fall into this category. Meanwhile, the 15 to 24 years age bracket for the primary householder has the lowest median household income of $0, with 82 households (5.5%) in this group.
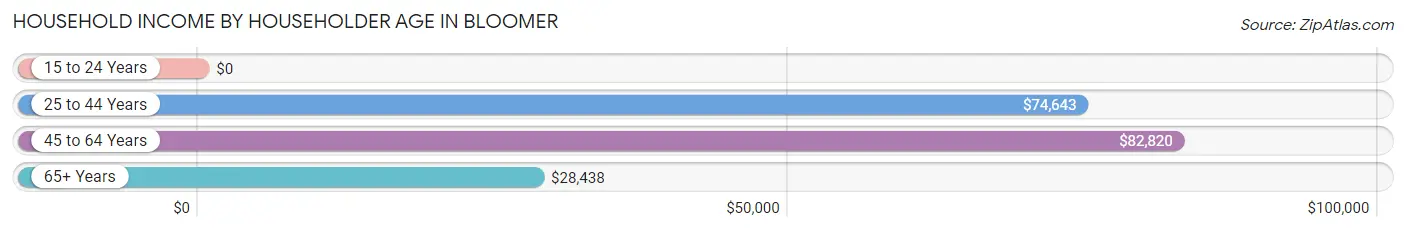
| Income Bracket | # Households | Median Income |
| 15 to 24 Years | 82 (5.5%) | $0 |
| 25 to 44 Years | 460 (30.9%) | $74,643 |
| 45 to 64 Years | 521 (35.0%) | $82,820 |
| 65+ Years | 424 (28.5%) | $28,438 |
| Total | 1,487 (100.0%) | $48,398 |
Poverty in Bloomer
Income Below Poverty by Sex and Age in Bloomer
With 3.7% poverty level for males and 7.7% for females among the residents of Bloomer, 65 to 74 year old males and 18 to 24 year old females are the most vulnerable to poverty, with 13 males (14.4%) and 35 females (34.0%) in their respective age groups living below the poverty level.
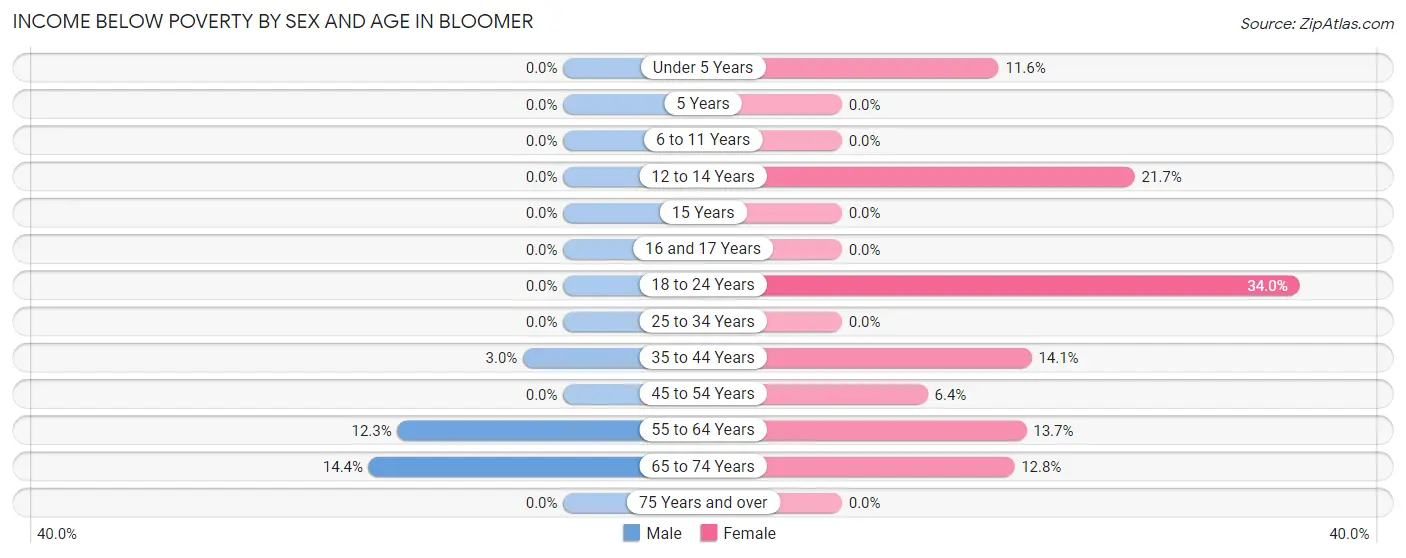
| Age Bracket | Male | Female |
| Under 5 Years | 0 (0.0%) | 17 (11.6%) |
| 5 Years | 0 (0.0%) | 0 (0.0%) |
| 6 to 11 Years | 0 (0.0%) | 0 (0.0%) |
| 12 to 14 Years | 0 (0.0%) | 20 (21.7%) |
| 15 Years | 0 (0.0%) | 0 (0.0%) |
| 16 and 17 Years | 0 (0.0%) | 0 (0.0%) |
| 18 to 24 Years | 0 (0.0%) | 35 (34.0%) |
| 25 to 34 Years | 0 (0.0%) | 0 (0.0%) |
| 35 to 44 Years | 5 (3.0%) | 30 (14.1%) |
| 45 to 54 Years | 0 (0.0%) | 10 (6.4%) |
| 55 to 64 Years | 40 (12.3%) | 30 (13.7%) |
| 65 to 74 Years | 13 (14.4%) | 16 (12.8%) |
| 75 Years and over | 0 (0.0%) | 0 (0.0%) |
| Total | 58 (3.7%) | 158 (7.7%) |
Income Above Poverty by Sex and Age in Bloomer
According to the poverty statistics in Bloomer, males aged under 5 years and females aged 6 to 11 years are the age groups that are most secure financially, with 100.0% of males and 100.0% of females in these age groups living above the poverty line.
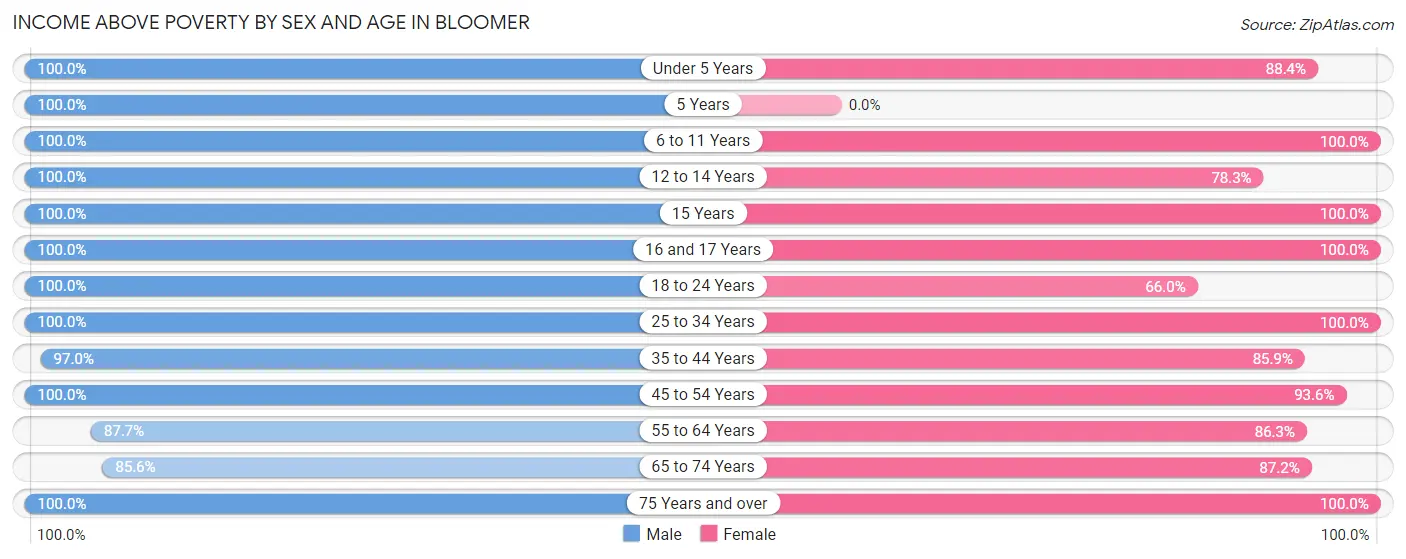
| Age Bracket | Male | Female |
| Under 5 Years | 111 (100.0%) | 129 (88.4%) |
| 5 Years | 26 (100.0%) | 0 (0.0%) |
| 6 to 11 Years | 178 (100.0%) | 183 (100.0%) |
| 12 to 14 Years | 52 (100.0%) | 72 (78.3%) |
| 15 Years | 72 (100.0%) | 131 (100.0%) |
| 16 and 17 Years | 6 (100.0%) | 48 (100.0%) |
| 18 to 24 Years | 83 (100.0%) | 68 (66.0%) |
| 25 to 34 Years | 234 (100.0%) | 397 (100.0%) |
| 35 to 44 Years | 163 (97.0%) | 183 (85.9%) |
| 45 to 54 Years | 110 (100.0%) | 147 (93.6%) |
| 55 to 64 Years | 285 (87.7%) | 189 (86.3%) |
| 65 to 74 Years | 77 (85.6%) | 109 (87.2%) |
| 75 Years and over | 107 (100.0%) | 231 (100.0%) |
| Total | 1,504 (96.3%) | 1,887 (92.3%) |
Income Below Poverty Among Married-Couple Families in Bloomer
The poverty statistics for married-couple families in Bloomer show that 3.5% or 23 of the total 650 families live below the poverty line. Families with no children have the highest poverty rate of 6.9%, comprising of 23 families. On the other hand, families with 1 or 2 children have the lowest poverty rate of 0.0%, which includes 0 families.
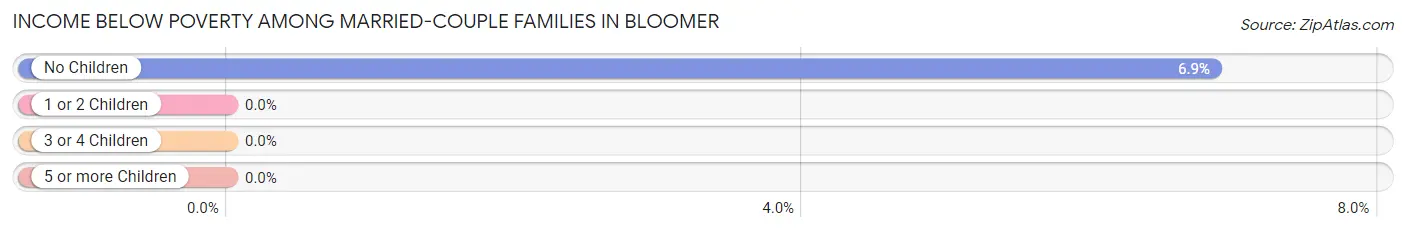
| Children | Above Poverty | Below Poverty |
| No Children | 313 (93.1%) | 23 (6.9%) |
| 1 or 2 Children | 226 (100.0%) | 0 (0.0%) |
| 3 or 4 Children | 35 (100.0%) | 0 (0.0%) |
| 5 or more Children | 53 (100.0%) | 0 (0.0%) |
| Total | 627 (96.5%) | 23 (3.5%) |
Income Below Poverty Among Single-Parent Households in Bloomer
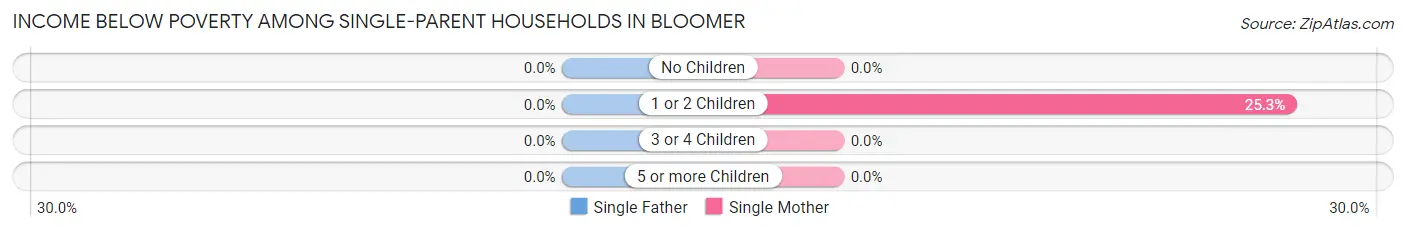
| Children | Single Father | Single Mother |
| No Children | 0 (0.0%) | 0 (0.0%) |
| 1 or 2 Children | 0 (0.0%) | 19 (25.3%) |
| 3 or 4 Children | 0 (0.0%) | 0 (0.0%) |
| 5 or more Children | 0 (0.0%) | 0 (0.0%) |
| Total | 0 (0.0%) | 19 (16.0%) |
Income Below Poverty Among Married-Couple vs Single-Parent Households in Bloomer
The poverty data for Bloomer shows that 23 of the married-couple family households (3.5%) and 19 of the single-parent households (10.3%) are living below the poverty level. Within the married-couple family households, those with no children have the highest poverty rate, with 23 households (6.9%) falling below the poverty line. Among the single-parent households, those with 1 or 2 children have the highest poverty rate, with 19 household (13.5%) living below poverty.
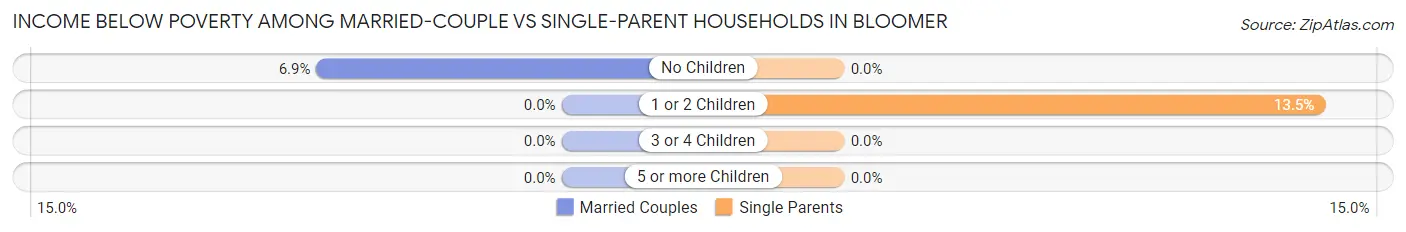
| Children | Married-Couple Families | Single-Parent Households |
| No Children | 23 (6.9%) | 0 (0.0%) |
| 1 or 2 Children | 0 (0.0%) | 19 (13.5%) |
| 3 or 4 Children | 0 (0.0%) | 0 (0.0%) |
| 5 or more Children | 0 (0.0%) | 0 (0.0%) |
| Total | 23 (3.5%) | 19 (10.3%) |
Race in Bloomer
The most populous races in Bloomer are White / Caucasian (3,596 | 97.7%), Two or more Races (70 | 1.9%), and Hispanic or Latino (55 | 1.5%).
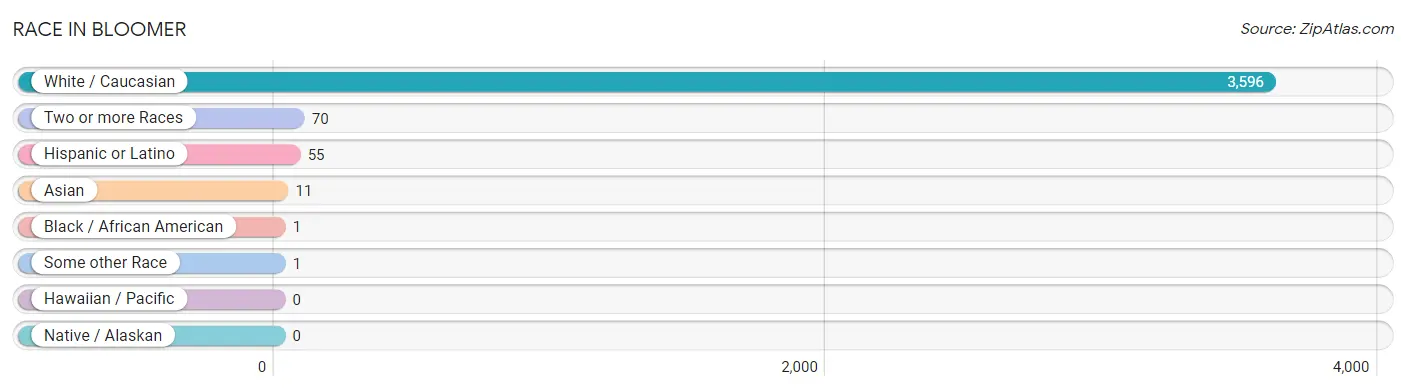
| Race | # Population | % Population |
| Asian | 11 | 0.3% |
| Black / African American | 1 | 0.0% |
| Hawaiian / Pacific | 0 | 0.0% |
| Hispanic or Latino | 55 | 1.5% |
| Native / Alaskan | 0 | 0.0% |
| White / Caucasian | 3,596 | 97.7% |
| Two or more Races | 70 | 1.9% |
| Some other Race | 1 | 0.0% |
| Total | 3,679 | 100.0% |
Ancestry in Bloomer
The most populous ancestries reported in Bloomer are German (1,137 | 30.9%), Irish (577 | 15.7%), English (430 | 11.7%), Norwegian (373 | 10.1%), and French (141 | 3.8%), together accounting for 72.3% of all Bloomer residents.
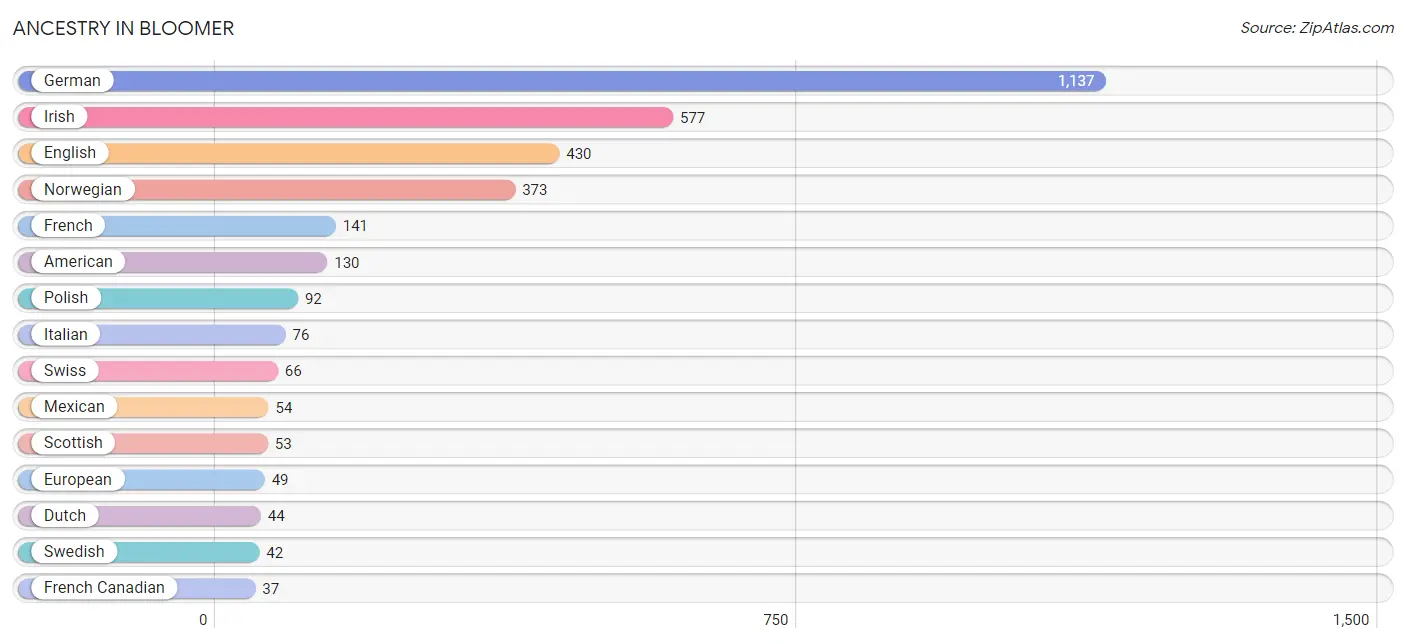
| Ancestry | # Population | % Population |
| American | 130 | 3.5% |
| Austrian | 17 | 0.5% |
| Bangladeshi | 11 | 0.3% |
| Czech | 14 | 0.4% |
| Czechoslovakian | 10 | 0.3% |
| Dutch | 44 | 1.2% |
| English | 430 | 11.7% |
| European | 49 | 1.3% |
| French | 141 | 3.8% |
| French Canadian | 37 | 1.0% |
| German | 1,137 | 30.9% |
| Greek | 13 | 0.4% |
| Hungarian | 32 | 0.9% |
| Indian (Asian) | 25 | 0.7% |
| Irish | 577 | 15.7% |
| Italian | 76 | 2.1% |
| Korean | 25 | 0.7% |
| Mexican | 54 | 1.5% |
| Norwegian | 373 | 10.1% |
| Polish | 92 | 2.5% |
| Puerto Rican | 1 | 0.0% |
| Russian | 15 | 0.4% |
| Scotch-Irish | 2 | 0.1% |
| Scottish | 53 | 1.4% |
| Slovak | 19 | 0.5% |
| Swedish | 42 | 1.1% |
| Swiss | 66 | 1.8% |
| Thai | 25 | 0.7% | View All 28 Rows |
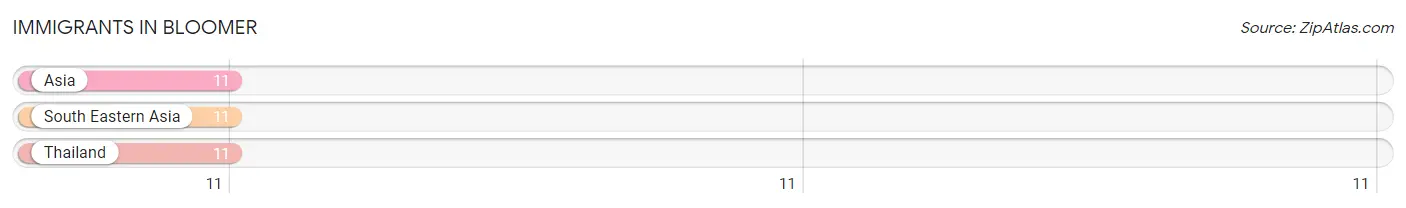
Immigrants in Bloomer
The most numerous immigrant groups reported in Bloomer came from Asia (11 | 0.3%), South Eastern Asia (11 | 0.3%), and Thailand (11 | 0.3%), together accounting for 0.9% of all Bloomer residents.
| Immigration Origin | # Population | % Population |
| Asia | 11 | 0.3% |
| South Eastern Asia | 11 | 0.3% |
| Thailand | 11 | 0.3% | View All 3 Rows |
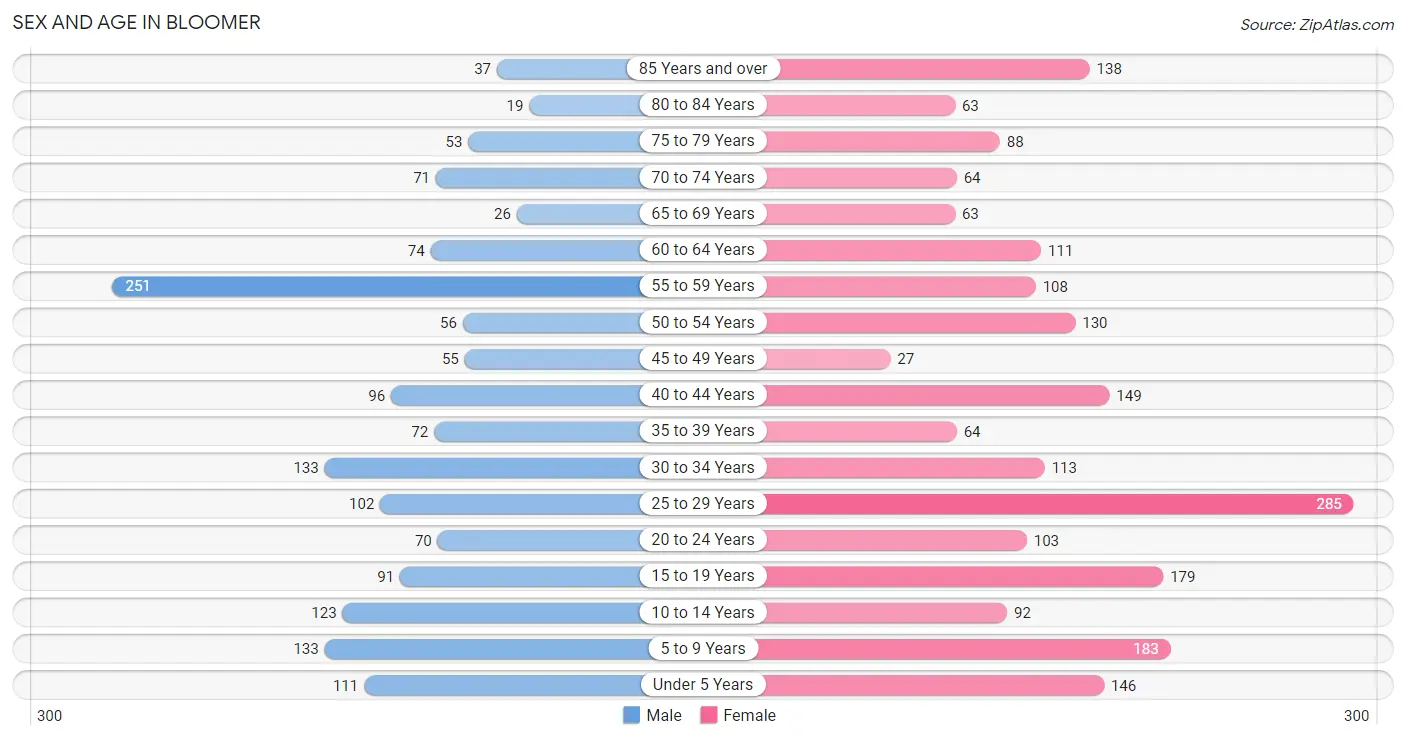
Sex and Age in Bloomer
Sex and Age in Bloomer
The most populous age groups in Bloomer are 55 to 59 Years (251 | 16.0%) for men and 25 to 29 Years (285 | 13.5%) for women.
| Age Bracket | Male | Female |
| Under 5 Years | 111 (7.1%) | 146 (6.9%) |
| 5 to 9 Years | 133 (8.5%) | 183 (8.7%) |
| 10 to 14 Years | 123 (7.8%) | 92 (4.4%) |
| 15 to 19 Years | 91 (5.8%) | 179 (8.5%) |
| 20 to 24 Years | 70 (4.4%) | 103 (4.9%) |
| 25 to 29 Years | 102 (6.5%) | 285 (13.5%) |
| 30 to 34 Years | 133 (8.5%) | 113 (5.4%) |
| 35 to 39 Years | 72 (4.6%) | 64 (3.0%) |
| 40 to 44 Years | 96 (6.1%) | 149 (7.1%) |
| 45 to 49 Years | 55 (3.5%) | 27 (1.3%) |
| 50 to 54 Years | 56 (3.6%) | 130 (6.2%) |
| 55 to 59 Years | 251 (16.0%) | 108 (5.1%) |
| 60 to 64 Years | 74 (4.7%) | 111 (5.3%) |
| 65 to 69 Years | 26 (1.7%) | 63 (3.0%) |
| 70 to 74 Years | 71 (4.5%) | 64 (3.0%) |
| 75 to 79 Years | 53 (3.4%) | 88 (4.2%) |
| 80 to 84 Years | 19 (1.2%) | 63 (3.0%) |
| 85 Years and over | 37 (2.4%) | 138 (6.6%) |
| Total | 1,573 (100.0%) | 2,106 (100.0%) |
Families and Households in Bloomer
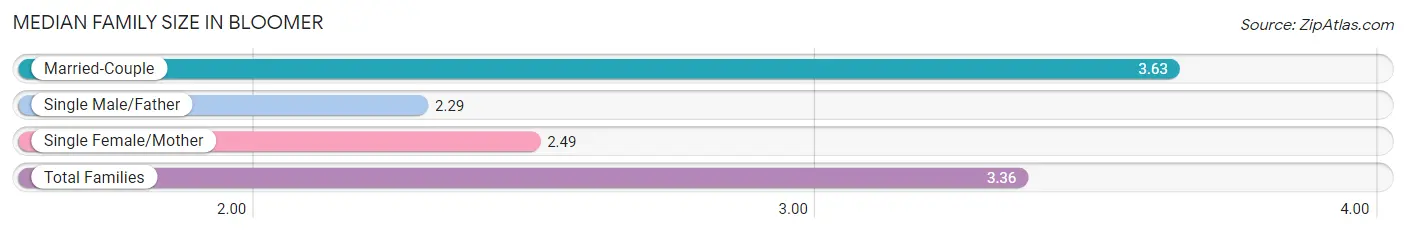
Median Family Size in Bloomer
The median family size in Bloomer is 3.36 persons per family, with married-couple families (650 | 77.8%) accounting for the largest median family size of 3.63 persons per family. On the other hand, single male/father families (66 | 7.9%) represent the smallest median family size with 2.29 persons per family.
| Family Type | # Families | Family Size |
| Married-Couple | 650 (77.8%) | 3.63 |
| Single Male/Father | 66 (7.9%) | 2.29 |
| Single Female/Mother | 119 (14.2%) | 2.49 |
| Total Families | 835 (100.0%) | 3.36 |
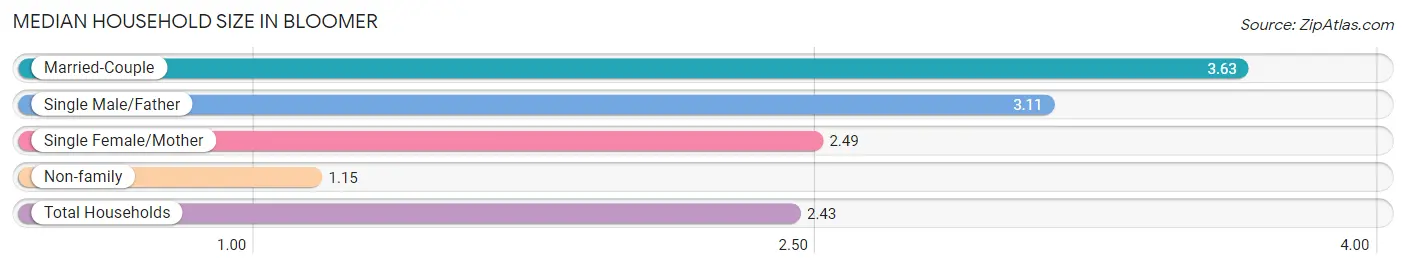
Median Household Size in Bloomer
The median household size in Bloomer is 2.43 persons per household, with married-couple households (650 | 43.7%) accounting for the largest median household size of 3.63 persons per household. non-family households (652 | 43.9%) represent the smallest median household size with 1.15 persons per household.
| Household Type | # Households | Household Size |
| Married-Couple | 650 (43.7%) | 3.63 |
| Single Male/Father | 66 (4.4%) | 3.11 |
| Single Female/Mother | 119 (8.0%) | 2.49 |
| Non-family | 652 (43.9%) | 1.15 |
| Total Households | 1,487 (100.0%) | 2.43 |
Household Size by Marriage Status in Bloomer
Out of a total of 1,487 households in Bloomer, 835 (56.1%) are family households, while 652 (43.9%) are nonfamily households. The most numerous type of family households are 2-person households, comprising 362, and the most common type of nonfamily households are 1-person households, comprising 580.
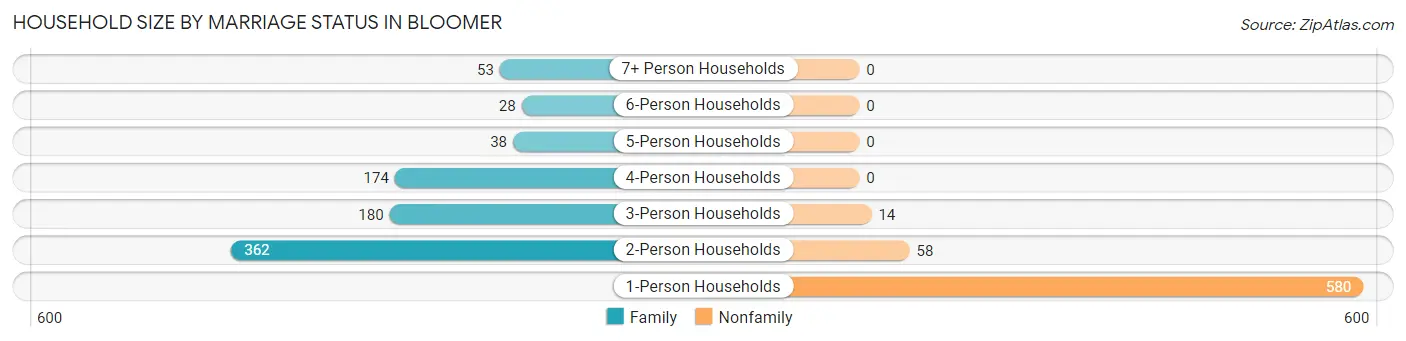
| Household Size | Family Households | Nonfamily Households |
| 1-Person Households | - | 580 (39.0%) |
| 2-Person Households | 362 (24.3%) | 58 (3.9%) |
| 3-Person Households | 180 (12.1%) | 14 (0.9%) |
| 4-Person Households | 174 (11.7%) | 0 (0.0%) |
| 5-Person Households | 38 (2.6%) | 0 (0.0%) |
| 6-Person Households | 28 (1.9%) | 0 (0.0%) |
| 7+ Person Households | 53 (3.6%) | 0 (0.0%) |
| Total | 835 (56.1%) | 652 (43.9%) |
Female Fertility in Bloomer
Fertility by Age in Bloomer
Average fertility rate in Bloomer is 44.0 births per 1,000 women. Women in the age bracket of 35 to 50 years have the highest fertility rate with 55.0 births per 1,000 women. Women in the age bracket of 20 to 34 years acount for 65.8% of all women with births.
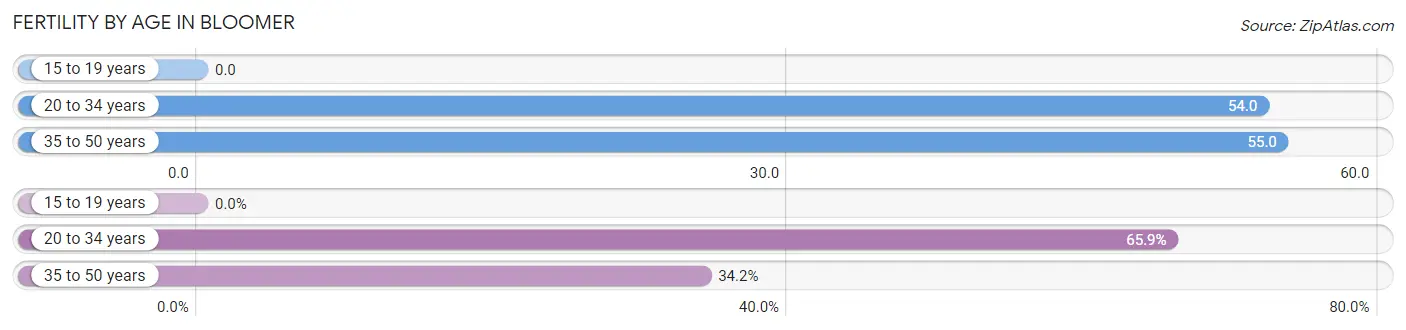
| Age Bracket | Women with Births | Births / 1,000 Women |
| 15 to 19 years | 0 (0.0%) | 0.0 |
| 20 to 34 years | 27 (65.8%) | 54.0 |
| 35 to 50 years | 14 (34.2%) | 55.0 |
| Total | 41 (100.0%) | 44.0 |
Fertility by Age by Marriage Status in Bloomer
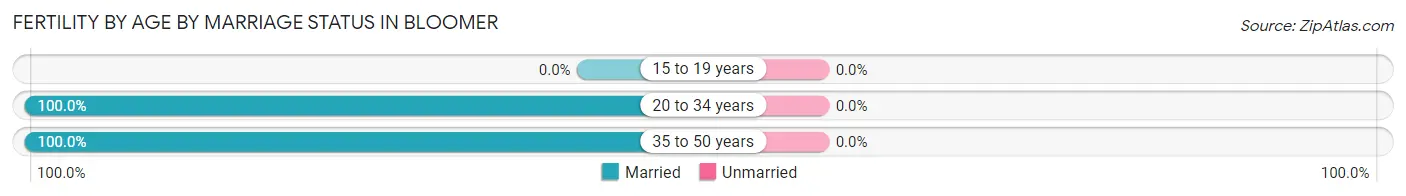
| Age Bracket | Married | Unmarried |
| 15 to 19 years | 0 (0.0%) | 0 (0.0%) |
| 20 to 34 years | 27 (100.0%) | 0 (0.0%) |
| 35 to 50 years | 14 (100.0%) | 0 (0.0%) |
| Total | 41 (100.0%) | 0 (0.0%) |
Fertility by Education in Bloomer
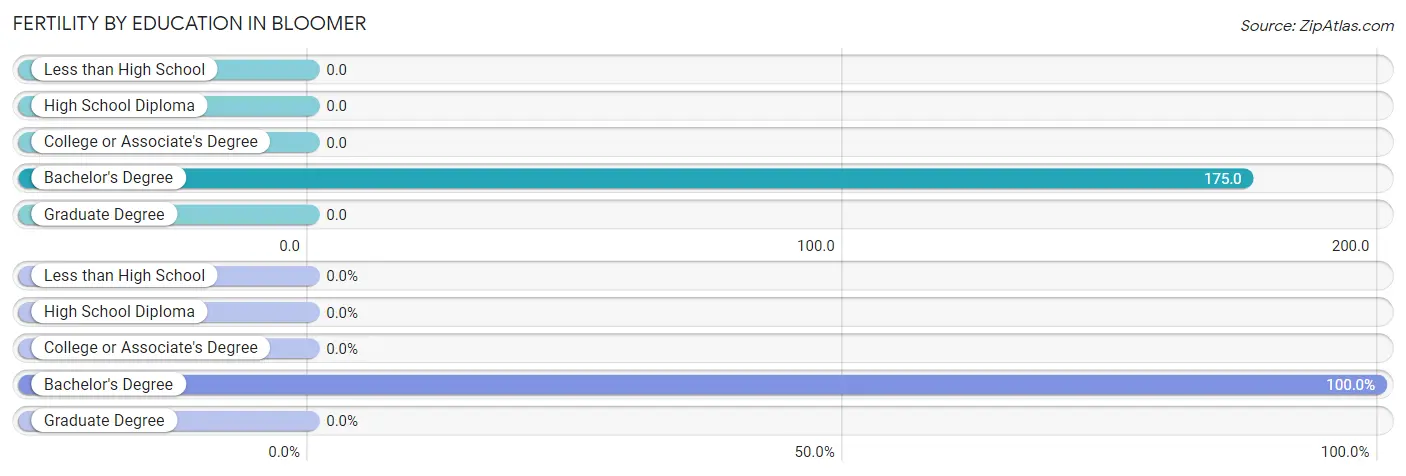
| Educational Attainment | Women with Births | Births / 1,000 Women |
| Less than High School | 0 (0.0%) | 0.0 |
| High School Diploma | 0 (0.0%) | 0.0 |
| College or Associate's Degree | 0 (0.0%) | 0.0 |
| Bachelor's Degree | 41 (100.0%) | 175.0 |
| Graduate Degree | 0 (0.0%) | 0.0 |
| Total | 41 (100.0%) | 44.0 |
Fertility by Education by Marriage Status in Bloomer
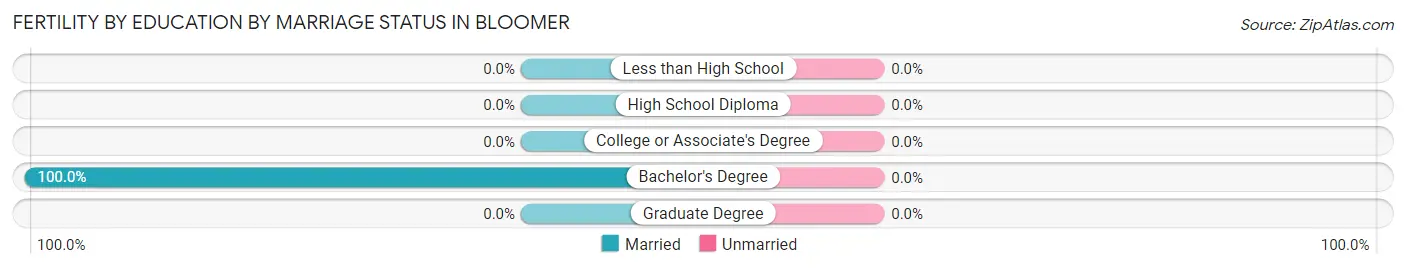
| Educational Attainment | Married | Unmarried |
| Less than High School | 0 (0.0%) | 0 (0.0%) |
| High School Diploma | 0 (0.0%) | 0 (0.0%) |
| College or Associate's Degree | 0 (0.0%) | 0 (0.0%) |
| Bachelor's Degree | 41 (100.0%) | 0 (0.0%) |
| Graduate Degree | 0 (0.0%) | 0 (0.0%) |
| Total | 41 (100.0%) | 0 (0.0%) |
Employment Characteristics in Bloomer
Employment by Class of Employer in Bloomer
Among the 1,833 employed individuals in Bloomer, private company employees (1,190 | 64.9%), not-for-profit organizations (296 | 16.2%), and local government employees (205 | 11.2%) make up the most common classes of employment.
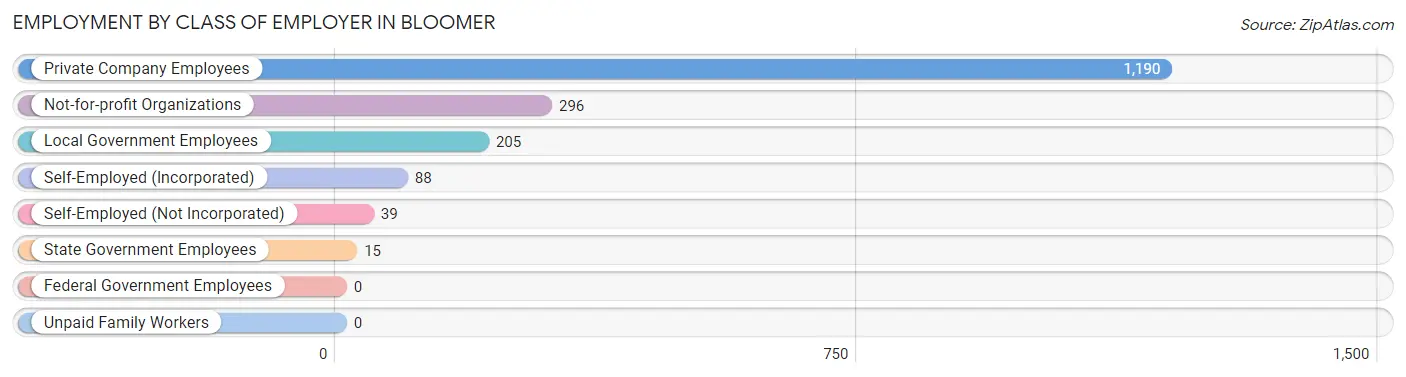
| Employer Class | # Employees | % Employees |
| Private Company Employees | 1,190 | 64.9% |
| Self-Employed (Incorporated) | 88 | 4.8% |
| Self-Employed (Not Incorporated) | 39 | 2.1% |
| Not-for-profit Organizations | 296 | 16.2% |
| Local Government Employees | 205 | 11.2% |
| State Government Employees | 15 | 0.8% |
| Federal Government Employees | 0 | 0.0% |
| Unpaid Family Workers | 0 | 0.0% |
| Total | 1,833 | 100.0% |
Employment Status by Age in Bloomer
According to the labor force statistics for Bloomer, out of the total population over 16 years of age (2,688), 70.3% or 1,890 individuals are in the labor force, with 2.3% or 43 of them unemployed. The age group with the highest labor force participation rate is 35 to 44 years, with 97.1% or 370 individuals in the labor force. Within the labor force, the 60 to 64 years age range has the highest percentage of unemployed individuals, with 19.4% or 12 of them being unemployed.
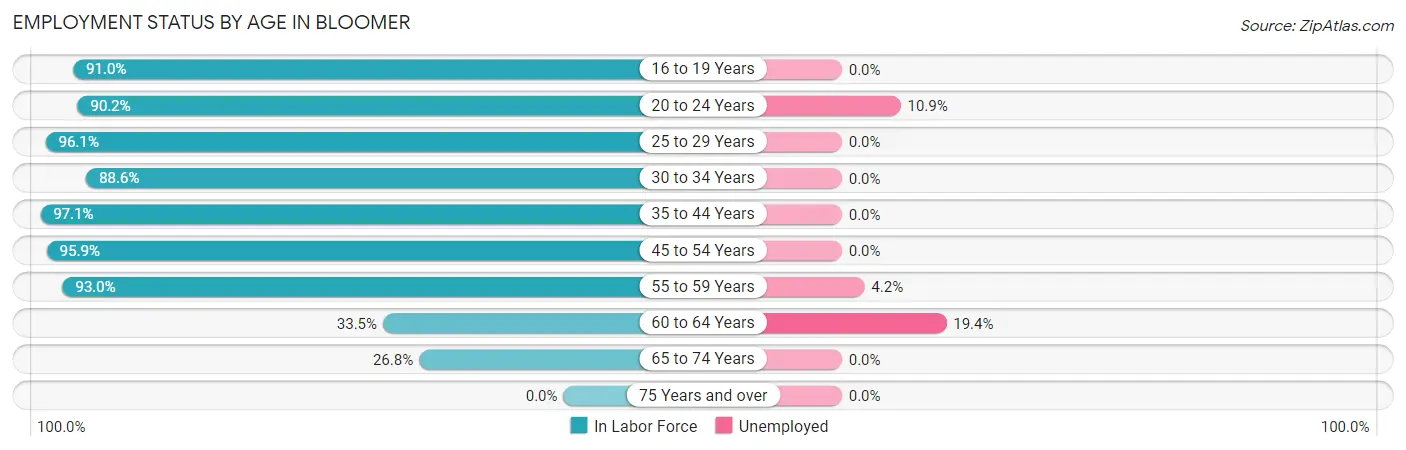
| Age Bracket | In Labor Force | Unemployed |
| 16 to 19 Years | 61 (91.0%) | 0 (0.0%) |
| 20 to 24 Years | 156 (90.2%) | 17 (10.9%) |
| 25 to 29 Years | 372 (96.1%) | 0 (0.0%) |
| 30 to 34 Years | 218 (88.6%) | 0 (0.0%) |
| 35 to 44 Years | 370 (97.1%) | 0 (0.0%) |
| 45 to 54 Years | 257 (95.9%) | 0 (0.0%) |
| 55 to 59 Years | 334 (93.0%) | 14 (4.2%) |
| 60 to 64 Years | 62 (33.5%) | 12 (19.4%) |
| 65 to 74 Years | 60 (26.8%) | 0 (0.0%) |
| 75 Years and over | 0 (0.0%) | 0 (0.0%) |
| Total | 1,890 (70.3%) | 43 (2.3%) |
Employment Status by Educational Attainment in Bloomer
According to labor force statistics for Bloomer, 88.3% of individuals (1,612) out of the total population between 25 and 64 years of age (1,826) are in the labor force, with 1.6% or 26 of them being unemployed. The group with the highest labor force participation rate are those with the educational attainment of less than high school, with 100.0% or 30 individuals in the labor force. Within the labor force, individuals with less than high school education have the highest percentage of unemployment, with 46.7% or 14 of them being unemployed.
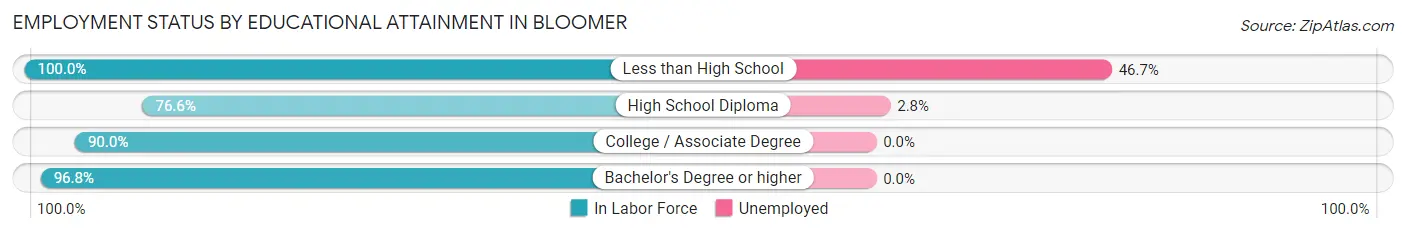
| Educational Attainment | In Labor Force | Unemployed |
| Less than High School | 30 (100.0%) | 14 (46.7%) |
| High School Diploma | 433 (76.6%) | 16 (2.8%) |
| College / Associate Degree | 547 (90.0%) | 0 (0.0%) |
| Bachelor's Degree or higher | 603 (96.8%) | 0 (0.0%) |
| Total | 1,612 (88.3%) | 29 (1.6%) |
Employment Occupations by Sex in Bloomer
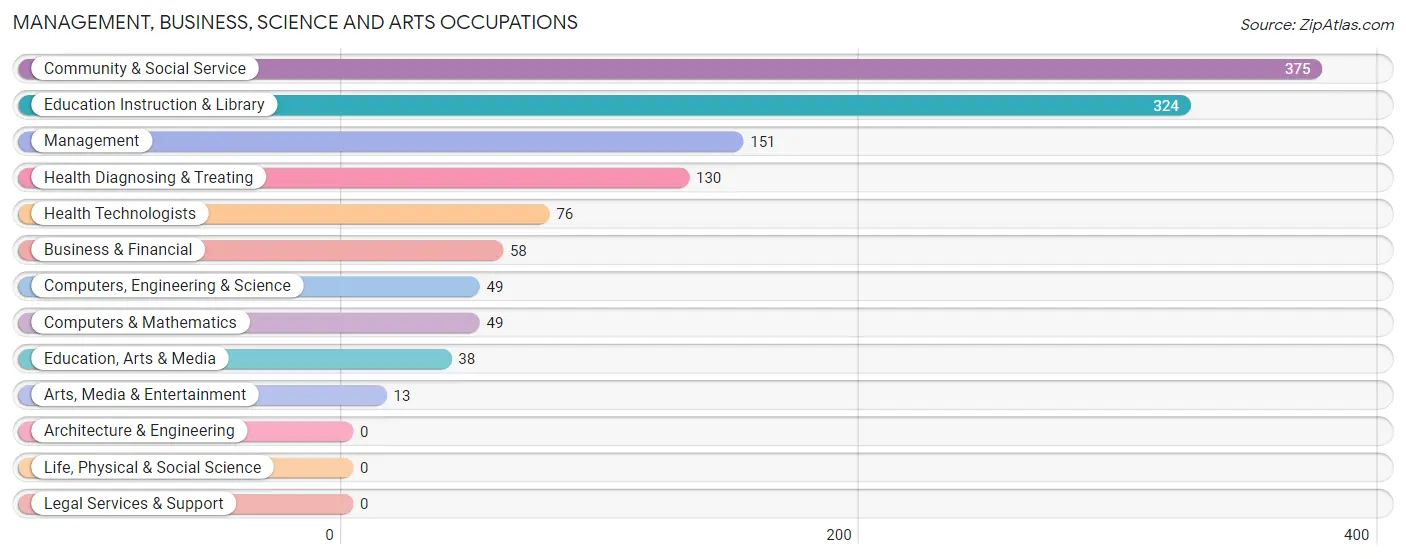
Management, Business, Science and Arts Occupations
The most common Management, Business, Science and Arts occupations in Bloomer are Community & Social Service (375 | 20.3%), Education Instruction & Library (324 | 17.5%), Management (151 | 8.2%), Health Diagnosing & Treating (130 | 7.0%), and Health Technologists (76 | 4.1%).
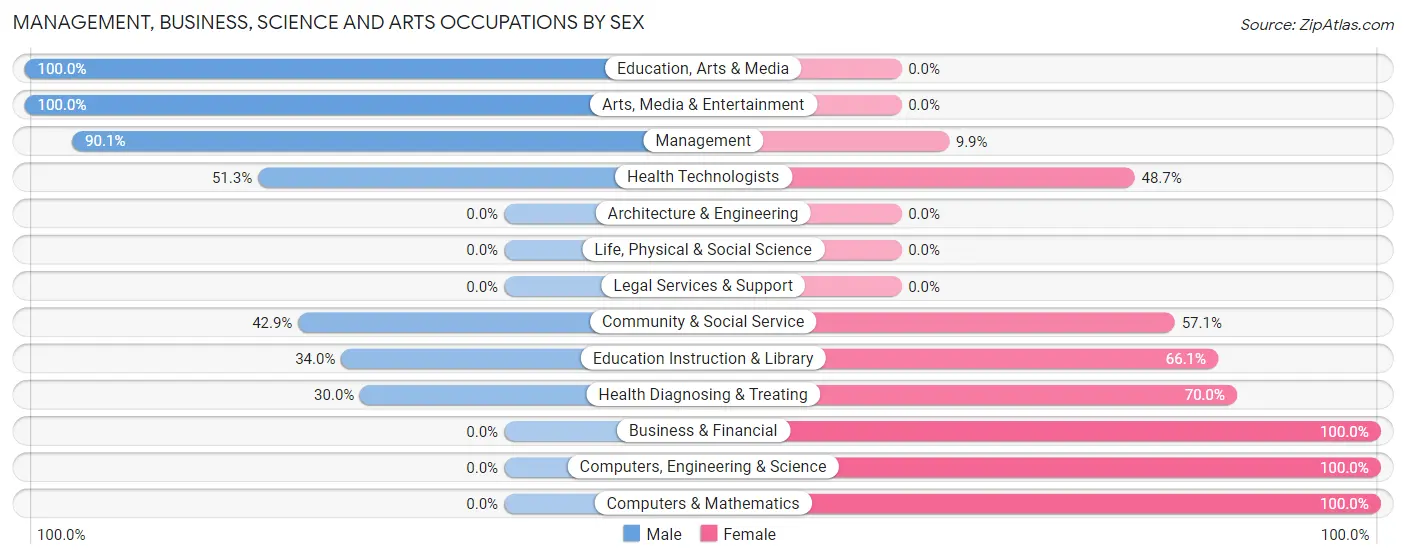
Management, Business, Science and Arts Occupations by Sex
Within the Management, Business, Science and Arts occupations in Bloomer, the most male-oriented occupations are Education, Arts & Media (100.0%), Arts, Media & Entertainment (100.0%), and Management (90.1%), while the most female-oriented occupations are Business & Financial (100.0%), Computers, Engineering & Science (100.0%), and Computers & Mathematics (100.0%).
| Occupation | Male | Female |
| Management | 136 (90.1%) | 15 (9.9%) |
| Business & Financial | 0 (0.0%) | 58 (100.0%) |
| Computers, Engineering & Science | 0 (0.0%) | 49 (100.0%) |
| Computers & Mathematics | 0 (0.0%) | 49 (100.0%) |
| Architecture & Engineering | 0 (0.0%) | 0 (0.0%) |
| Life, Physical & Social Science | 0 (0.0%) | 0 (0.0%) |
| Community & Social Service | 161 (42.9%) | 214 (57.1%) |
| Education, Arts & Media | 38 (100.0%) | 0 (0.0%) |
| Legal Services & Support | 0 (0.0%) | 0 (0.0%) |
| Education Instruction & Library | 110 (34.0%) | 214 (66.0%) |
| Arts, Media & Entertainment | 13 (100.0%) | 0 (0.0%) |
| Health Diagnosing & Treating | 39 (30.0%) | 91 (70.0%) |
| Health Technologists | 39 (51.3%) | 37 (48.7%) |
| Total (Category) | 336 (44.0%) | 427 (56.0%) |
| Total (Overall) | 797 (43.1%) | 1,050 (56.9%) |
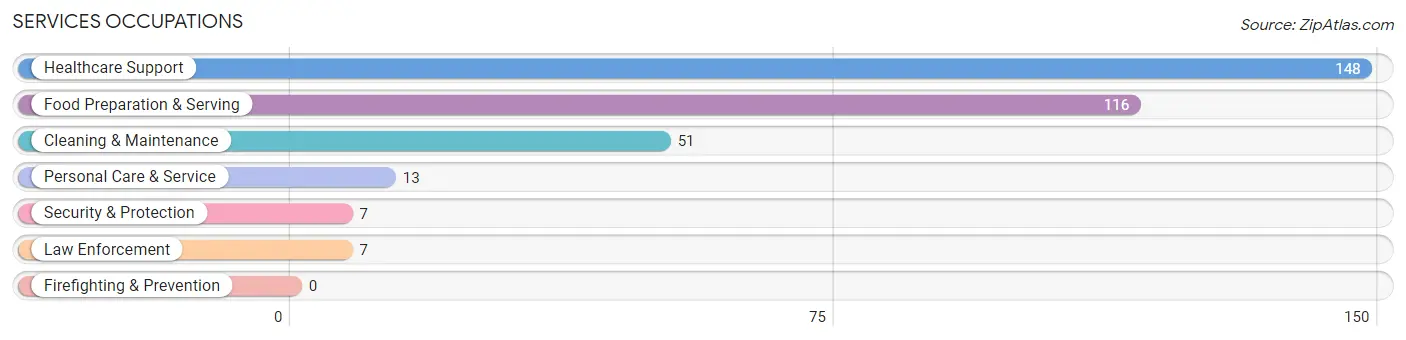
Services Occupations
The most common Services occupations in Bloomer are Healthcare Support (148 | 8.0%), Food Preparation & Serving (116 | 6.3%), Cleaning & Maintenance (51 | 2.8%), Personal Care & Service (13 | 0.7%), and Security & Protection (7 | 0.4%).
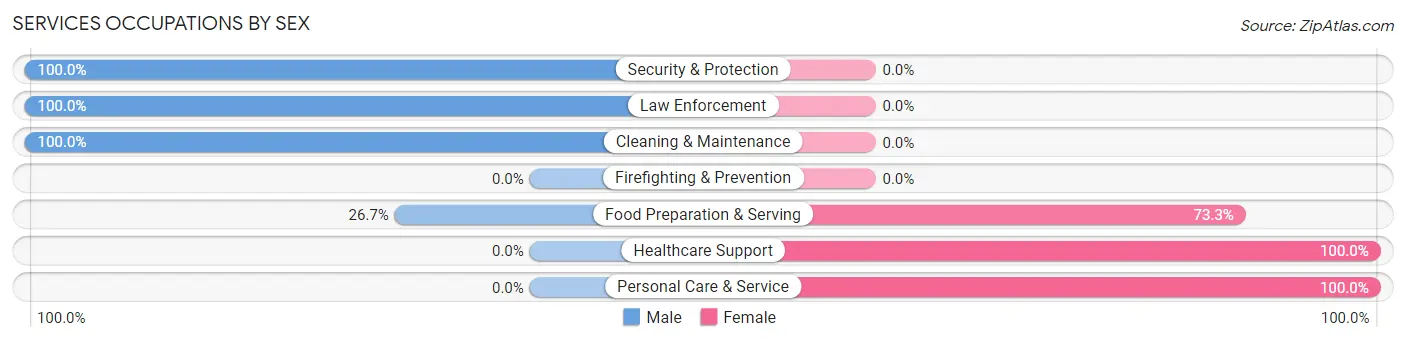
Services Occupations by Sex
Within the Services occupations in Bloomer, the most male-oriented occupations are Security & Protection (100.0%), Law Enforcement (100.0%), and Cleaning & Maintenance (100.0%), while the most female-oriented occupations are Healthcare Support (100.0%), Personal Care & Service (100.0%), and Food Preparation & Serving (73.3%).
| Occupation | Male | Female |
| Healthcare Support | 0 (0.0%) | 148 (100.0%) |
| Security & Protection | 7 (100.0%) | 0 (0.0%) |
| Firefighting & Prevention | 0 (0.0%) | 0 (0.0%) |
| Law Enforcement | 7 (100.0%) | 0 (0.0%) |
| Food Preparation & Serving | 31 (26.7%) | 85 (73.3%) |
| Cleaning & Maintenance | 51 (100.0%) | 0 (0.0%) |
| Personal Care & Service | 0 (0.0%) | 13 (100.0%) |
| Total (Category) | 89 (26.6%) | 246 (73.4%) |
| Total (Overall) | 797 (43.1%) | 1,050 (56.9%) |
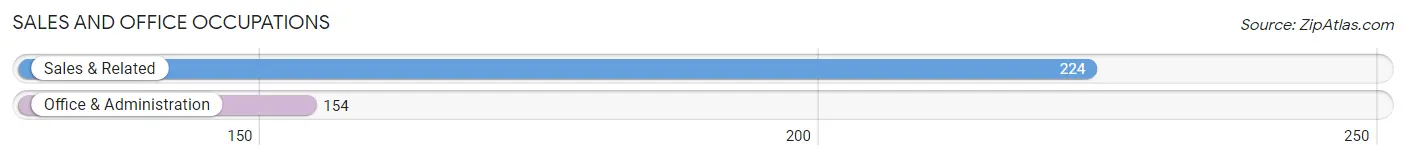
Sales and Office Occupations
The most common Sales and Office occupations in Bloomer are Sales & Related (224 | 12.1%), and Office & Administration (154 | 8.3%).
Sales and Office Occupations by Sex
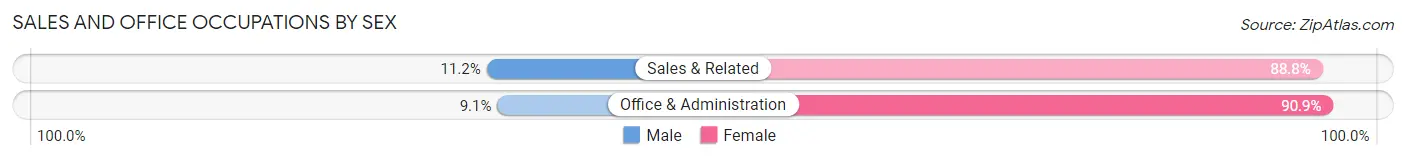
| Occupation | Male | Female |
| Sales & Related | 25 (11.2%) | 199 (88.8%) |
| Office & Administration | 14 (9.1%) | 140 (90.9%) |
| Total (Category) | 39 (10.3%) | 339 (89.7%) |
| Total (Overall) | 797 (43.1%) | 1,050 (56.9%) |
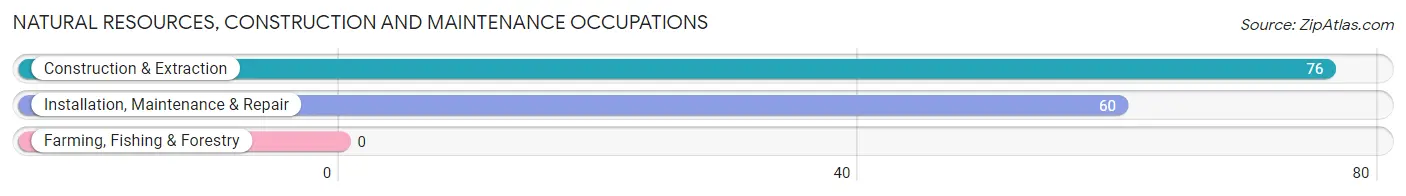
Natural Resources, Construction and Maintenance Occupations
The most common Natural Resources, Construction and Maintenance occupations in Bloomer are Construction & Extraction (76 | 4.1%), and Installation, Maintenance & Repair (60 | 3.3%).
Natural Resources, Construction and Maintenance Occupations by Sex
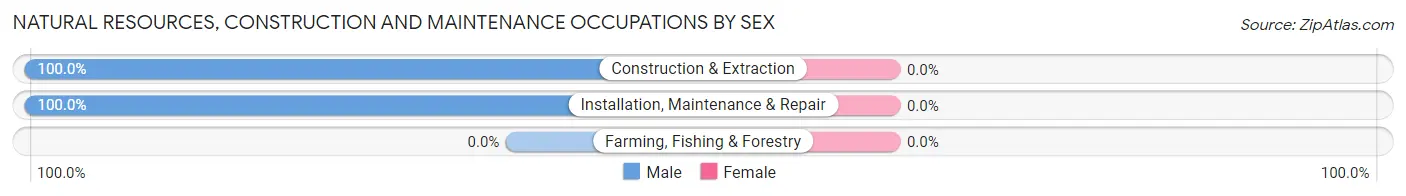
| Occupation | Male | Female |
| Farming, Fishing & Forestry | 0 (0.0%) | 0 (0.0%) |
| Construction & Extraction | 76 (100.0%) | 0 (0.0%) |
| Installation, Maintenance & Repair | 60 (100.0%) | 0 (0.0%) |
| Total (Category) | 136 (100.0%) | 0 (0.0%) |
| Total (Overall) | 797 (43.1%) | 1,050 (56.9%) |
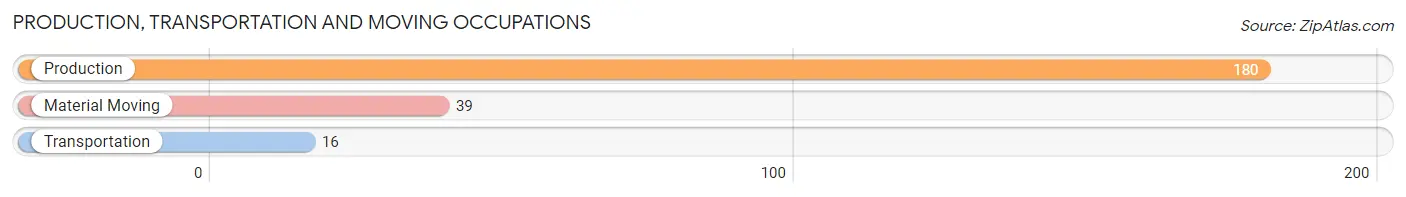
Production, Transportation and Moving Occupations
The most common Production, Transportation and Moving occupations in Bloomer are Production (180 | 9.8%), Material Moving (39 | 2.1%), and Transportation (16 | 0.9%).
Production, Transportation and Moving Occupations by Sex
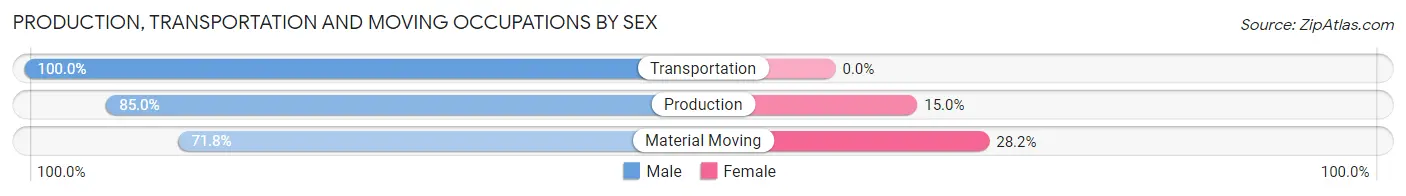
| Occupation | Male | Female |
| Production | 153 (85.0%) | 27 (15.0%) |
| Transportation | 16 (100.0%) | 0 (0.0%) |
| Material Moving | 28 (71.8%) | 11 (28.2%) |
| Total (Category) | 197 (83.8%) | 38 (16.2%) |
| Total (Overall) | 797 (43.1%) | 1,050 (56.9%) |
Employment Industries by Sex in Bloomer
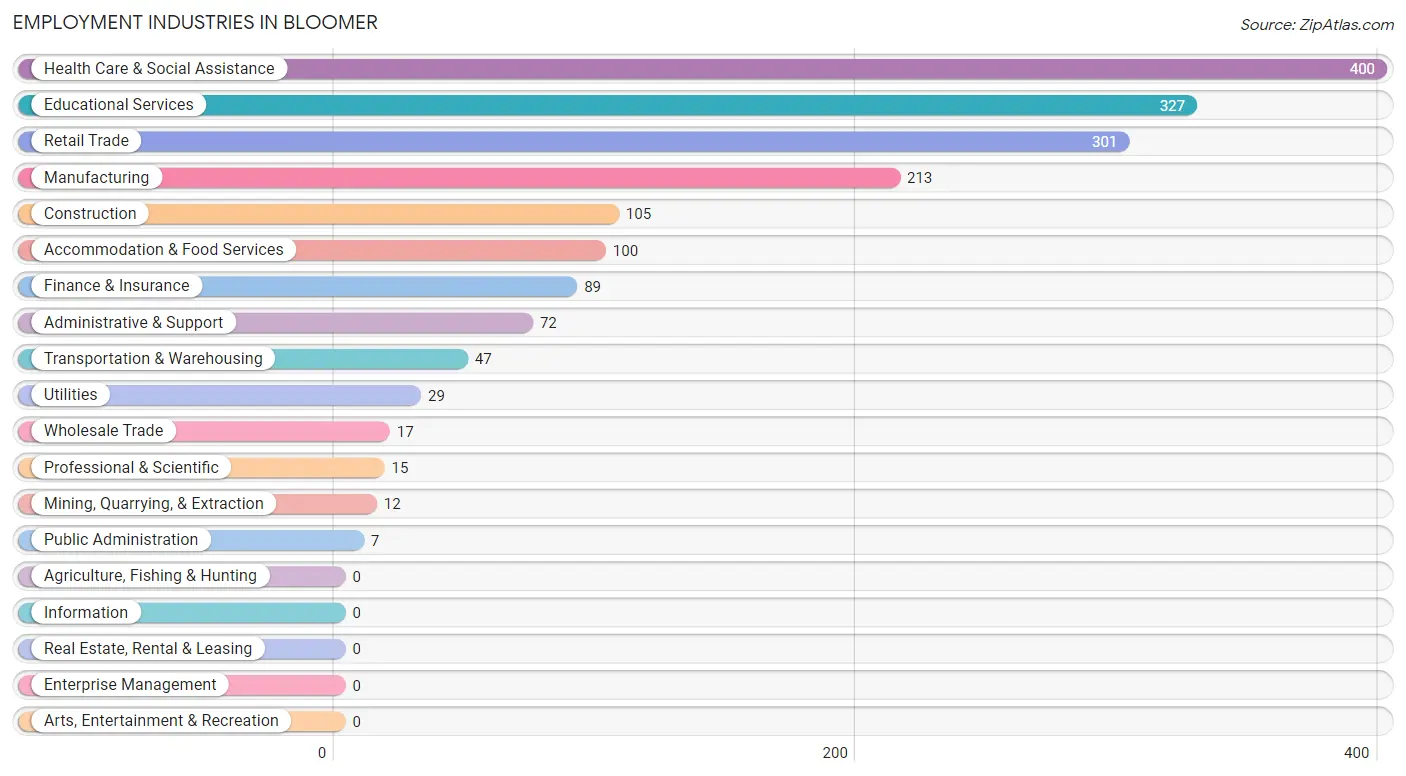
Employment Industries in Bloomer
The major employment industries in Bloomer include Health Care & Social Assistance (400 | 21.7%), Educational Services (327 | 17.7%), Retail Trade (301 | 16.3%), Manufacturing (213 | 11.5%), and Construction (105 | 5.7%).
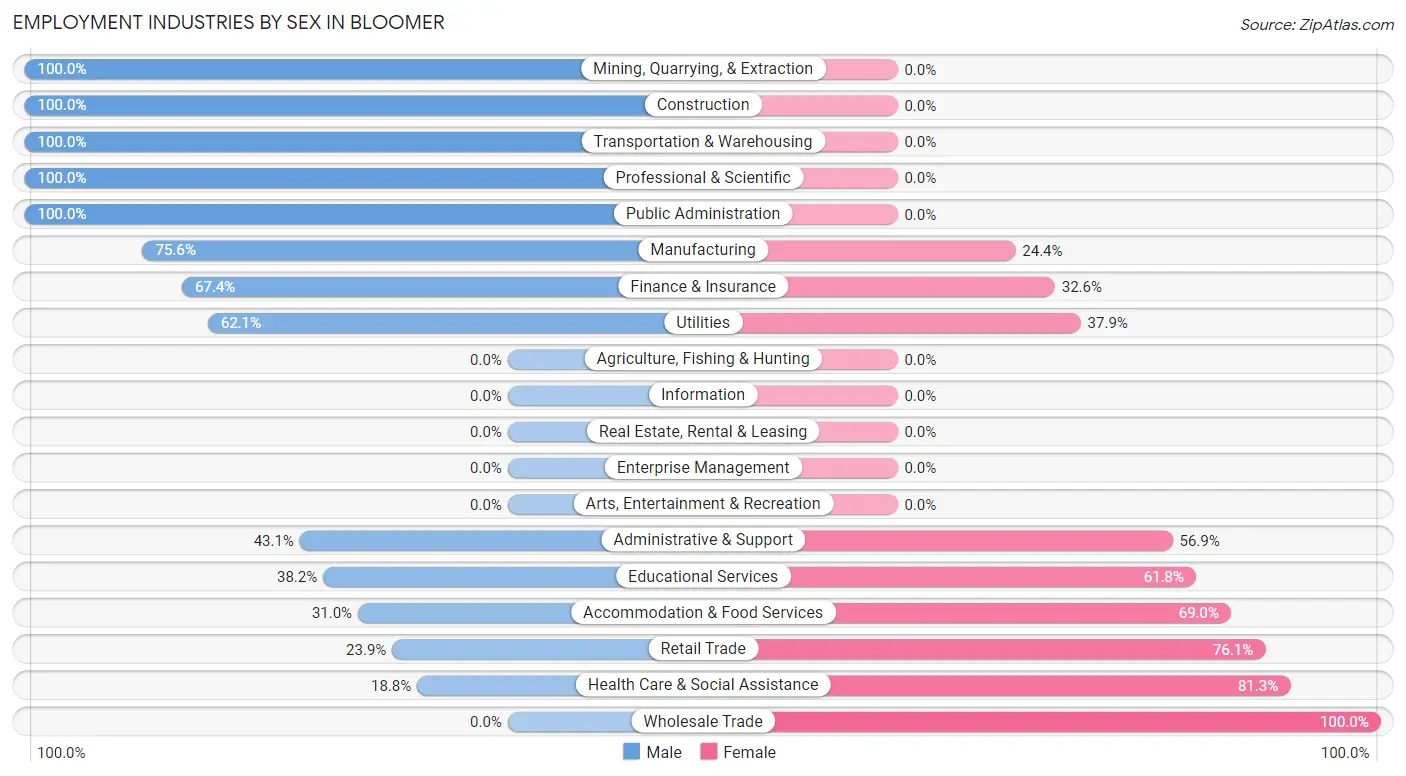
Employment Industries by Sex in Bloomer
The Bloomer industries that see more men than women are Mining, Quarrying, & Extraction (100.0%), Construction (100.0%), and Transportation & Warehousing (100.0%), whereas the industries that tend to have a higher number of women are Wholesale Trade (100.0%), Health Care & Social Assistance (81.2%), and Retail Trade (76.1%).
| Industry | Male | Female |
| Agriculture, Fishing & Hunting | 0 (0.0%) | 0 (0.0%) |
| Mining, Quarrying, & Extraction | 12 (100.0%) | 0 (0.0%) |
| Construction | 105 (100.0%) | 0 (0.0%) |
| Manufacturing | 161 (75.6%) | 52 (24.4%) |
| Wholesale Trade | 0 (0.0%) | 17 (100.0%) |
| Retail Trade | 72 (23.9%) | 229 (76.1%) |
| Transportation & Warehousing | 47 (100.0%) | 0 (0.0%) |
| Utilities | 18 (62.1%) | 11 (37.9%) |
| Information | 0 (0.0%) | 0 (0.0%) |
| Finance & Insurance | 60 (67.4%) | 29 (32.6%) |
| Real Estate, Rental & Leasing | 0 (0.0%) | 0 (0.0%) |
| Professional & Scientific | 15 (100.0%) | 0 (0.0%) |
| Enterprise Management | 0 (0.0%) | 0 (0.0%) |
| Administrative & Support | 31 (43.1%) | 41 (56.9%) |
| Educational Services | 125 (38.2%) | 202 (61.8%) |
| Health Care & Social Assistance | 75 (18.8%) | 325 (81.2%) |
| Arts, Entertainment & Recreation | 0 (0.0%) | 0 (0.0%) |
| Accommodation & Food Services | 31 (31.0%) | 69 (69.0%) |
| Public Administration | 7 (100.0%) | 0 (0.0%) |
| Total | 797 (43.1%) | 1,050 (56.9%) |
Education in Bloomer
School Enrollment in Bloomer
The most common levels of schooling among the 1,004 students in Bloomer are elementary school (257 | 25.6%), middle school (216 | 21.5%), and high school (212 | 21.1%).
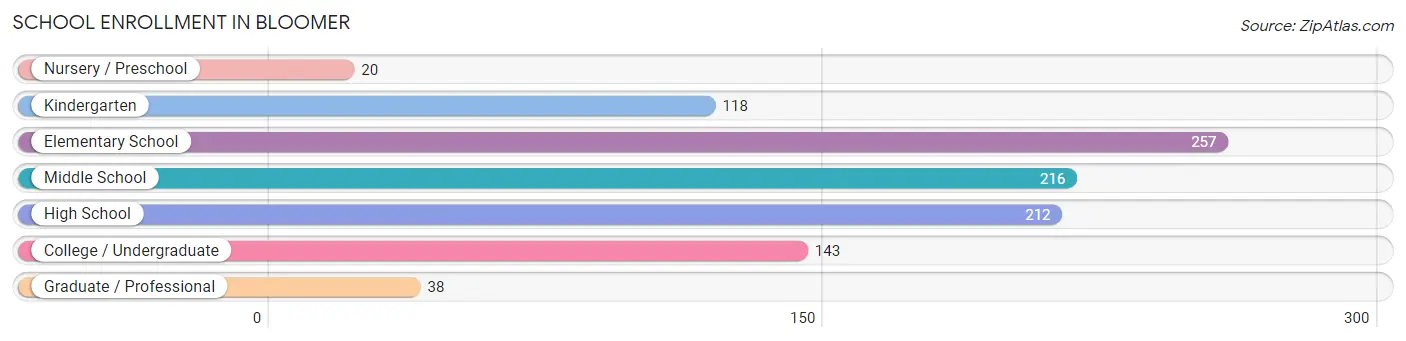
| School Level | # Students | % Students |
| Nursery / Preschool | 20 | 2.0% |
| Kindergarten | 118 | 11.7% |
| Elementary School | 257 | 25.6% |
| Middle School | 216 | 21.5% |
| High School | 212 | 21.1% |
| College / Undergraduate | 143 | 14.2% |
| Graduate / Professional | 38 | 3.8% |
| Total | 1,004 | 100.0% |
School Enrollment by Age by Funding Source in Bloomer
Out of a total of 1,004 students who are enrolled in schools in Bloomer, 70 (7.0%) attend a private institution, while the remaining 934 (93.0%) are enrolled in public schools. The age group of 5 to 9 year old has the highest likelihood of being enrolled in private schools, with 64 (20.3% in the age bracket) enrolled. Conversely, the age group of 3 to 4 year olds has the lowest likelihood of being enrolled in a private school, with 20 (100.0% in the age bracket) attending a public institution.
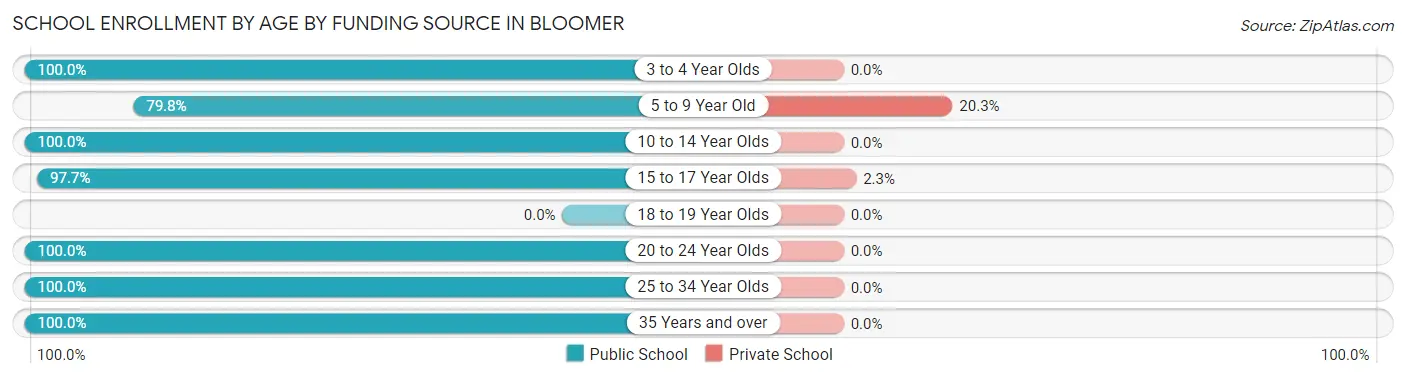
| Age Bracket | Public School | Private School |
| 3 to 4 Year Olds | 20 (100.0%) | 0 (0.0%) |
| 5 to 9 Year Old | 252 (79.7%) | 64 (20.3%) |
| 10 to 14 Year Olds | 215 (100.0%) | 0 (0.0%) |
| 15 to 17 Year Olds | 251 (97.7%) | 6 (2.3%) |
| 18 to 19 Year Olds | 0 (0.0%) | 0 (0.0%) |
| 20 to 24 Year Olds | 47 (100.0%) | 0 (0.0%) |
| 25 to 34 Year Olds | 61 (100.0%) | 0 (0.0%) |
| 35 Years and over | 88 (100.0%) | 0 (0.0%) |
| Total | 934 (93.0%) | 70 (7.0%) |
Educational Attainment by Field of Study in Bloomer
Education (201 | 27.1%), business (187 | 25.2%), science & technology (109 | 14.7%), physical & health sciences (92 | 12.4%), and bio, nature & agricultural (55 | 7.4%) are the most common fields of study among 743 individuals in Bloomer who have obtained a bachelor's degree or higher.
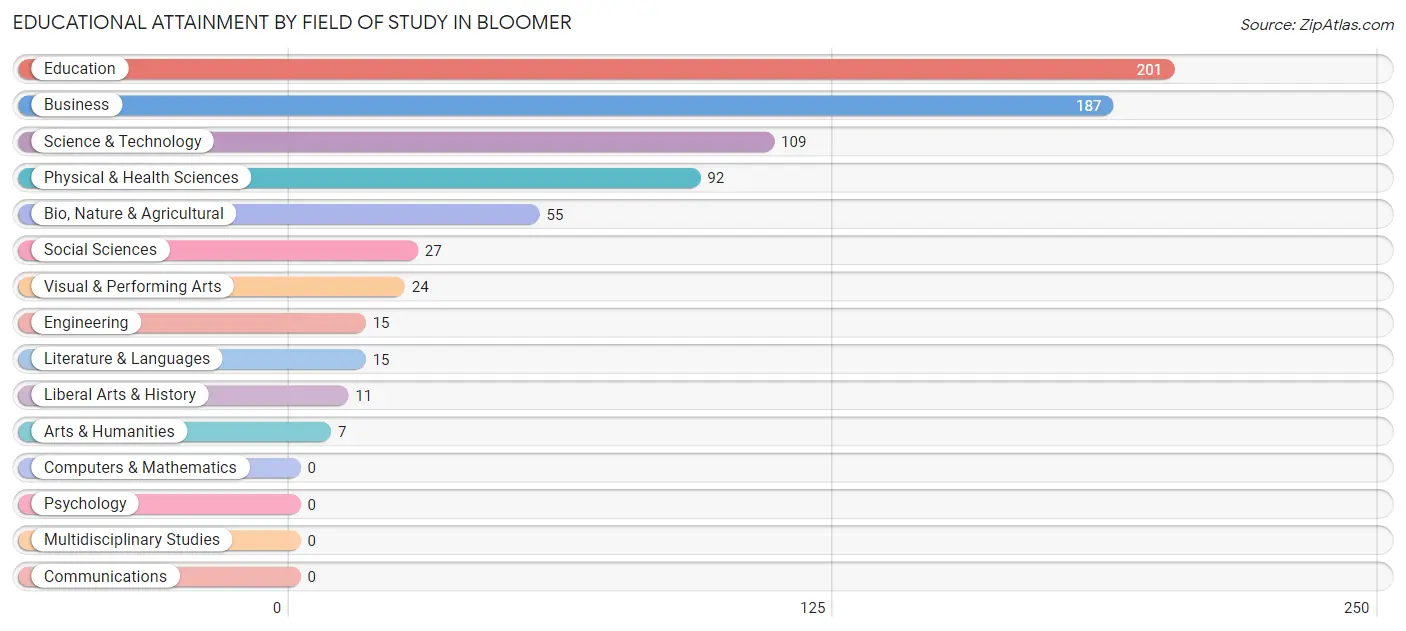
| Field of Study | # Graduates | % Graduates |
| Computers & Mathematics | 0 | 0.0% |
| Bio, Nature & Agricultural | 55 | 7.4% |
| Physical & Health Sciences | 92 | 12.4% |
| Psychology | 0 | 0.0% |
| Social Sciences | 27 | 3.6% |
| Engineering | 15 | 2.0% |
| Multidisciplinary Studies | 0 | 0.0% |
| Science & Technology | 109 | 14.7% |
| Business | 187 | 25.2% |
| Education | 201 | 27.1% |
| Literature & Languages | 15 | 2.0% |
| Liberal Arts & History | 11 | 1.5% |
| Visual & Performing Arts | 24 | 3.2% |
| Communications | 0 | 0.0% |
| Arts & Humanities | 7 | 0.9% |
| Total | 743 | 100.0% |
Transportation & Commute in Bloomer
Vehicle Availability by Sex in Bloomer
The most prevalent vehicle ownership categories in Bloomer are males with 2 vehicles (422, accounting for 52.9%) and females with 2 vehicles (560, making up 40.7%).
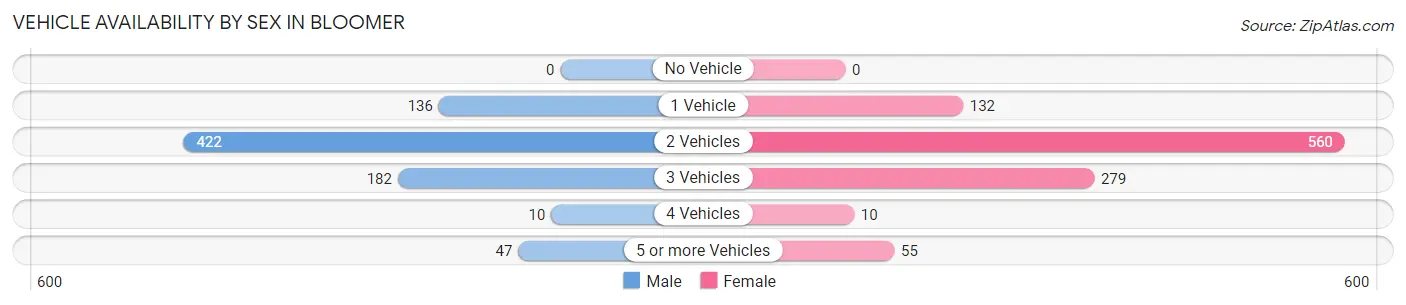
| Vehicles Available | Male | Female |
| No Vehicle | 0 (0.0%) | 0 (0.0%) |
| 1 Vehicle | 136 (17.1%) | 132 (12.7%) |
| 2 Vehicles | 422 (52.9%) | 560 (54.0%) |
| 3 Vehicles | 182 (22.8%) | 279 (26.9%) |
| 4 Vehicles | 10 (1.3%) | 10 (1.0%) |
| 5 or more Vehicles | 47 (5.9%) | 55 (5.3%) |
| Total | 797 (100.0%) | 1,036 (100.0%) |
Commute Time in Bloomer
The most frequently occuring commute durations in Bloomer are 5 to 9 minutes (473 commuters, 27.6%), 30 to 34 minutes (301 commuters, 17.5%), and 25 to 29 minutes (221 commuters, 12.9%).
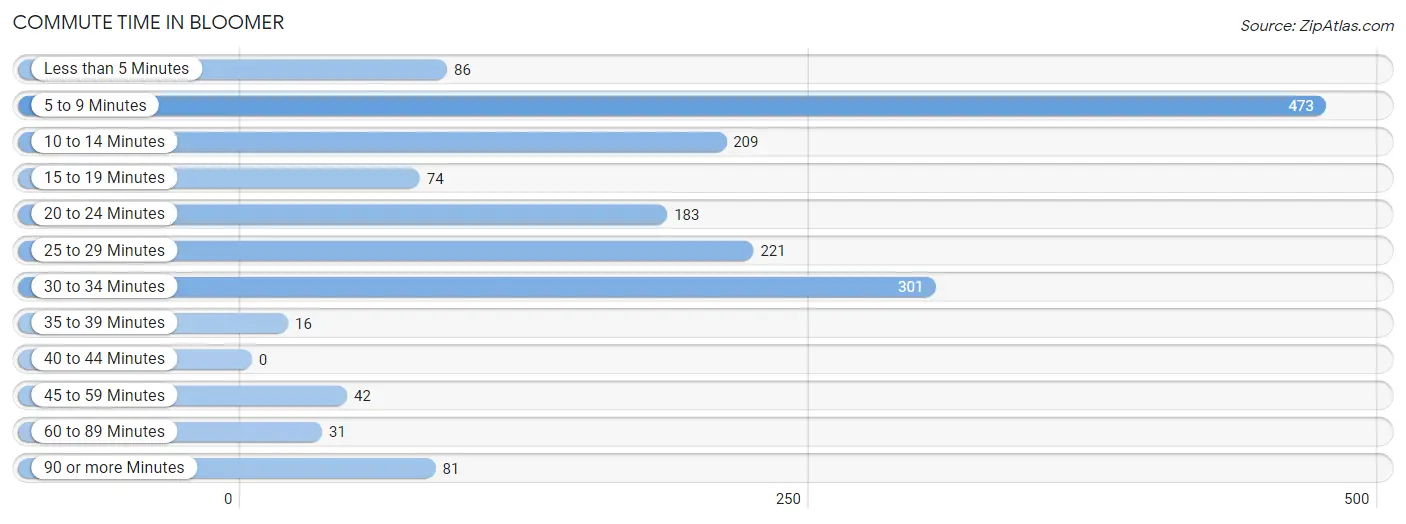
| Commute Time | # Commuters | % Commuters |
| Less than 5 Minutes | 86 | 5.0% |
| 5 to 9 Minutes | 473 | 27.6% |
| 10 to 14 Minutes | 209 | 12.2% |
| 15 to 19 Minutes | 74 | 4.3% |
| 20 to 24 Minutes | 183 | 10.7% |
| 25 to 29 Minutes | 221 | 12.9% |
| 30 to 34 Minutes | 301 | 17.5% |
| 35 to 39 Minutes | 16 | 0.9% |
| 40 to 44 Minutes | 0 | 0.0% |
| 45 to 59 Minutes | 42 | 2.5% |
| 60 to 89 Minutes | 31 | 1.8% |
| 90 or more Minutes | 81 | 4.7% |
Commute Time by Sex in Bloomer
The most common commute times in Bloomer are 5 to 9 minutes (164 commuters, 22.0%) for males and 5 to 9 minutes (309 commuters, 31.8%) for females.
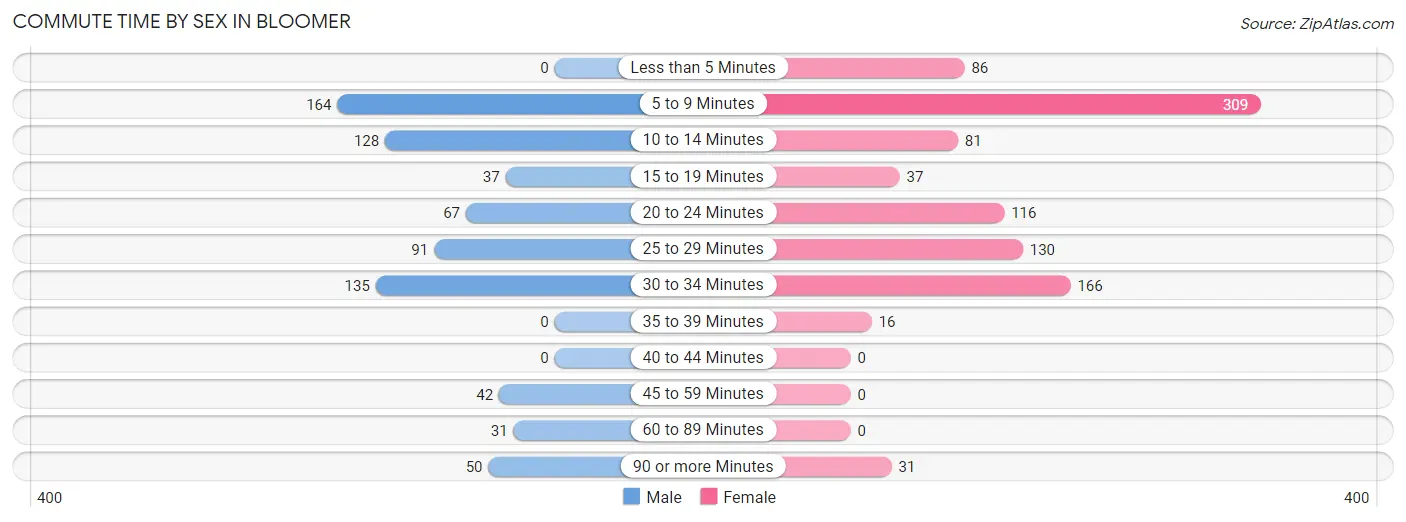
| Commute Time | Male | Female |
| Less than 5 Minutes | 0 (0.0%) | 86 (8.8%) |
| 5 to 9 Minutes | 164 (22.0%) | 309 (31.8%) |
| 10 to 14 Minutes | 128 (17.2%) | 81 (8.3%) |
| 15 to 19 Minutes | 37 (5.0%) | 37 (3.8%) |
| 20 to 24 Minutes | 67 (9.0%) | 116 (11.9%) |
| 25 to 29 Minutes | 91 (12.2%) | 130 (13.4%) |
| 30 to 34 Minutes | 135 (18.1%) | 166 (17.1%) |
| 35 to 39 Minutes | 0 (0.0%) | 16 (1.7%) |
| 40 to 44 Minutes | 0 (0.0%) | 0 (0.0%) |
| 45 to 59 Minutes | 42 (5.6%) | 0 (0.0%) |
| 60 to 89 Minutes | 31 (4.2%) | 0 (0.0%) |
| 90 or more Minutes | 50 (6.7%) | 31 (3.2%) |
Time of Departure to Work by Sex in Bloomer
The most frequent times of departure to work in Bloomer are 12:00 AM to 4:59 AM (188, 25.2%) for males and 4:00 PM to 11:59 PM (139, 14.3%) for females.
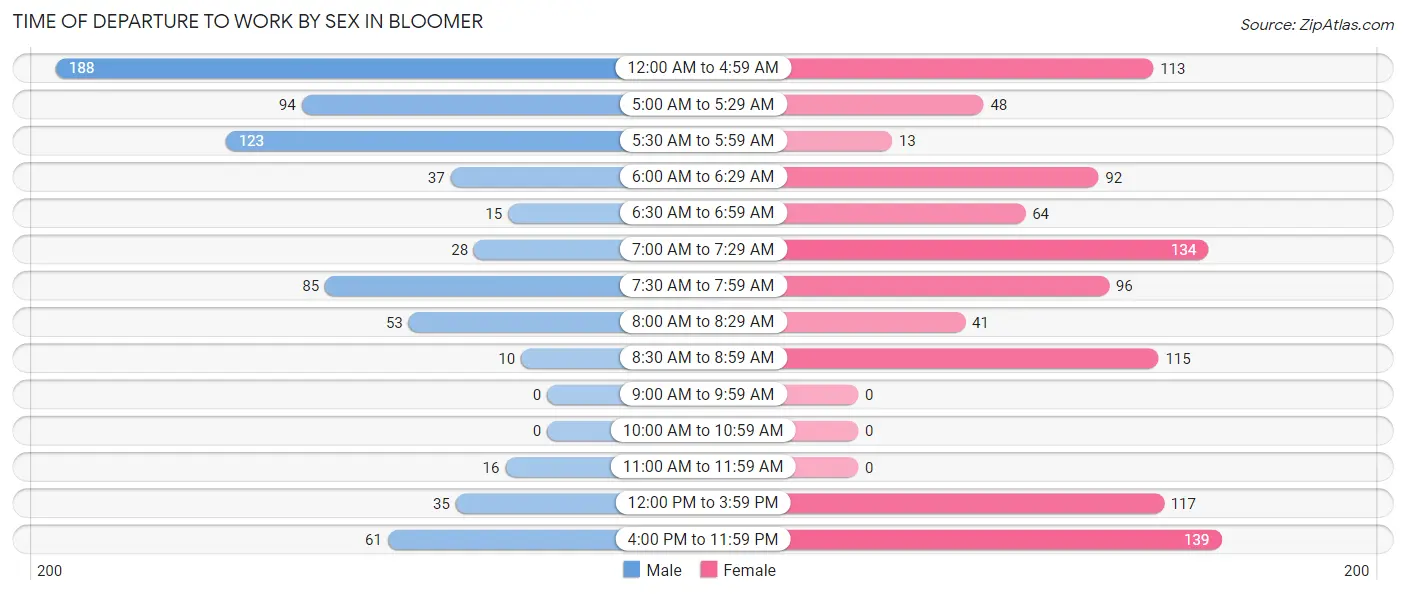
| Time of Departure | Male | Female |
| 12:00 AM to 4:59 AM | 188 (25.2%) | 113 (11.6%) |
| 5:00 AM to 5:29 AM | 94 (12.6%) | 48 (4.9%) |
| 5:30 AM to 5:59 AM | 123 (16.5%) | 13 (1.3%) |
| 6:00 AM to 6:29 AM | 37 (5.0%) | 92 (9.5%) |
| 6:30 AM to 6:59 AM | 15 (2.0%) | 64 (6.6%) |
| 7:00 AM to 7:29 AM | 28 (3.8%) | 134 (13.8%) |
| 7:30 AM to 7:59 AM | 85 (11.4%) | 96 (9.9%) |
| 8:00 AM to 8:29 AM | 53 (7.1%) | 41 (4.2%) |
| 8:30 AM to 8:59 AM | 10 (1.3%) | 115 (11.8%) |
| 9:00 AM to 9:59 AM | 0 (0.0%) | 0 (0.0%) |
| 10:00 AM to 10:59 AM | 0 (0.0%) | 0 (0.0%) |
| 11:00 AM to 11:59 AM | 16 (2.1%) | 0 (0.0%) |
| 12:00 PM to 3:59 PM | 35 (4.7%) | 117 (12.0%) |
| 4:00 PM to 11:59 PM | 61 (8.2%) | 139 (14.3%) |
| Total | 745 (100.0%) | 972 (100.0%) |
Housing Occupancy in Bloomer
Occupancy by Ownership in Bloomer
Of the total 1,487 dwellings in Bloomer, owner-occupied units account for 1,087 (73.1%), while renter-occupied units make up 400 (26.9%).
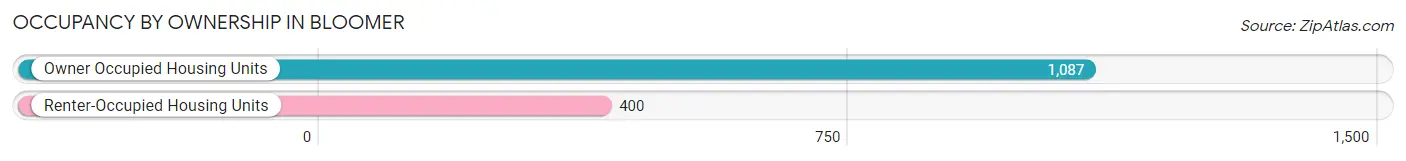
| Occupancy | # Housing Units | % Housing Units |
| Owner Occupied Housing Units | 1,087 | 73.1% |
| Renter-Occupied Housing Units | 400 | 26.9% |
| Total Occupied Housing Units | 1,487 | 100.0% |
Occupancy by Household Size in Bloomer
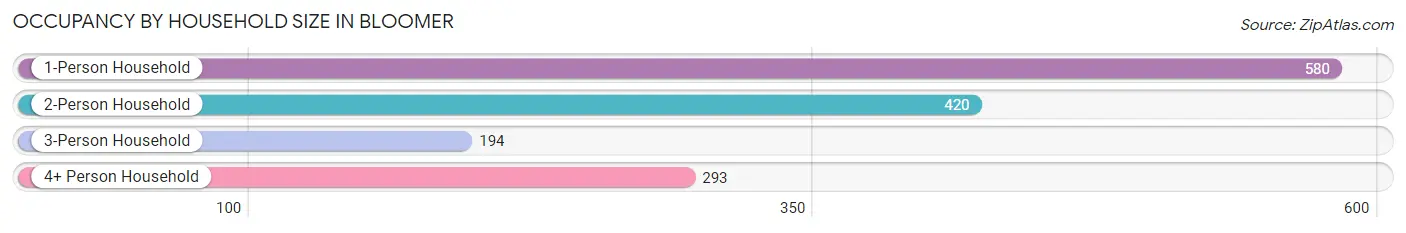
| Household Size | # Housing Units | % Housing Units |
| 1-Person Household | 580 | 39.0% |
| 2-Person Household | 420 | 28.2% |
| 3-Person Household | 194 | 13.1% |
| 4+ Person Household | 293 | 19.7% |
| Total Housing Units | 1,487 | 100.0% |
Occupancy by Ownership by Household Size in Bloomer
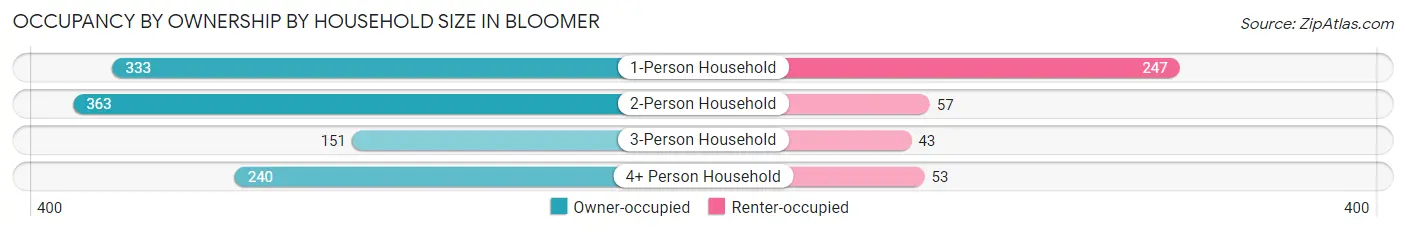
| Household Size | Owner-occupied | Renter-occupied |
| 1-Person Household | 333 (57.4%) | 247 (42.6%) |
| 2-Person Household | 363 (86.4%) | 57 (13.6%) |
| 3-Person Household | 151 (77.8%) | 43 (22.2%) |
| 4+ Person Household | 240 (81.9%) | 53 (18.1%) |
| Total Housing Units | 1,087 (73.1%) | 400 (26.9%) |
Occupancy by Educational Attainment in Bloomer
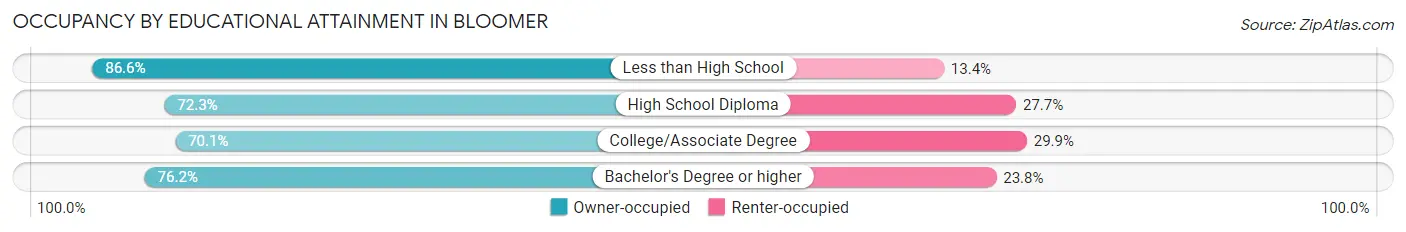
| Household Size | Owner-occupied | Renter-occupied |
| Less than High School | 58 (86.6%) | 9 (13.4%) |
| High School Diploma | 430 (72.3%) | 165 (27.7%) |
| College/Associate Degree | 343 (70.1%) | 146 (29.9%) |
| Bachelor's Degree or higher | 256 (76.2%) | 80 (23.8%) |
Occupancy by Age of Householder in Bloomer
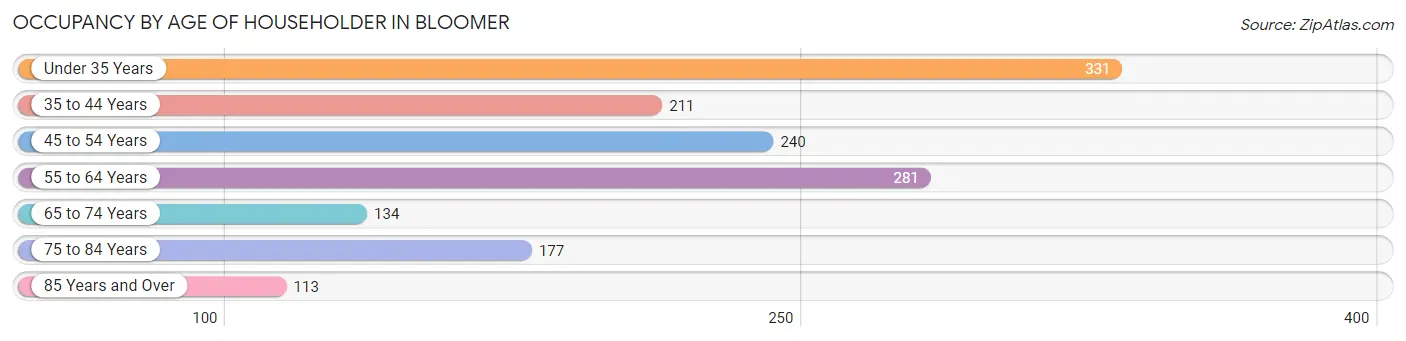
| Age Bracket | # Households | % Households |
| Under 35 Years | 331 | 22.3% |
| 35 to 44 Years | 211 | 14.2% |
| 45 to 54 Years | 240 | 16.1% |
| 55 to 64 Years | 281 | 18.9% |
| 65 to 74 Years | 134 | 9.0% |
| 75 to 84 Years | 177 | 11.9% |
| 85 Years and Over | 113 | 7.6% |
| Total | 1,487 | 100.0% |
Housing Finances in Bloomer
Median Income by Occupancy in Bloomer
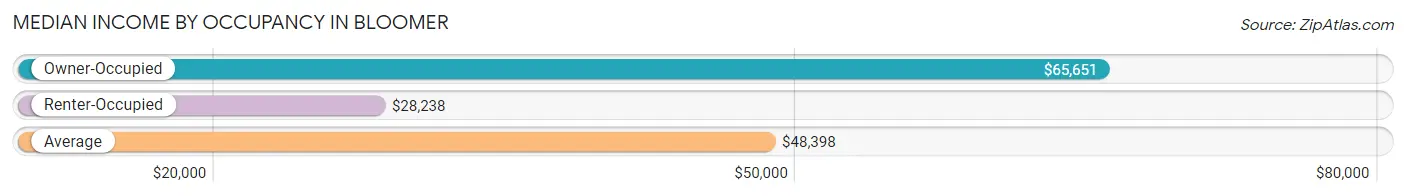
| Occupancy Type | # Households | Median Income |
| Owner-Occupied | 1,087 (73.1%) | $65,651 |
| Renter-Occupied | 400 (26.9%) | $28,238 |
| Average | 1,487 (100.0%) | $48,398 |
Occupancy by Householder Income Bracket in Bloomer
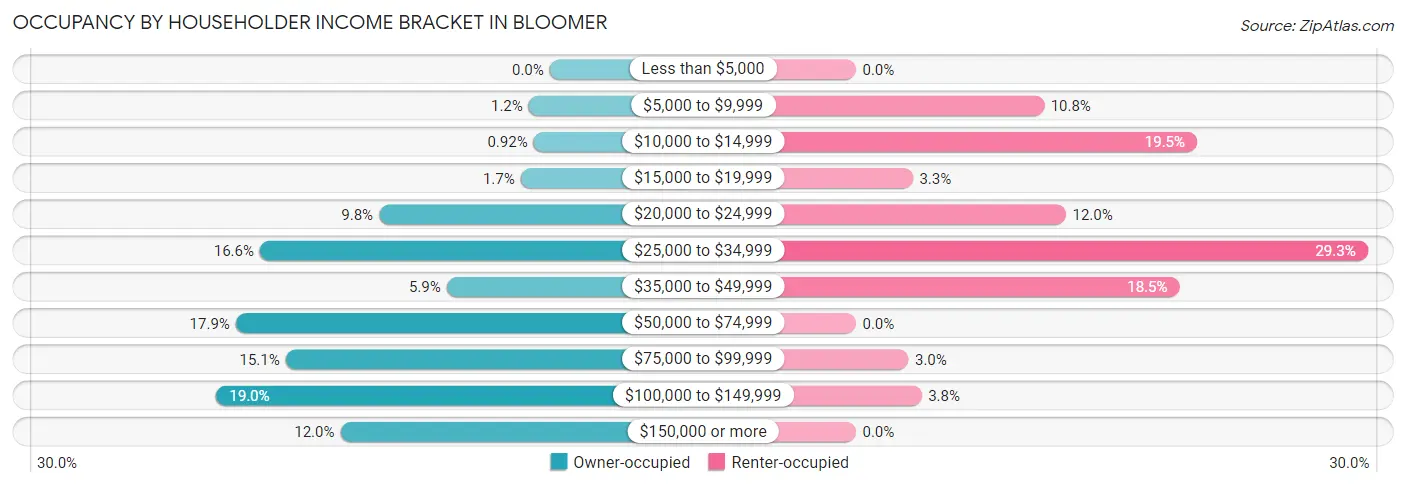
| Income Bracket | Owner-occupied | Renter-occupied |
| Less than $5,000 | 0 (0.0%) | 0 (0.0%) |
| $5,000 to $9,999 | 13 (1.2%) | 43 (10.7%) |
| $10,000 to $14,999 | 10 (0.9%) | 78 (19.5%) |
| $15,000 to $19,999 | 18 (1.7%) | 13 (3.3%) |
| $20,000 to $24,999 | 106 (9.8%) | 48 (12.0%) |
| $25,000 to $34,999 | 180 (16.6%) | 117 (29.2%) |
| $35,000 to $49,999 | 64 (5.9%) | 74 (18.5%) |
| $50,000 to $74,999 | 195 (17.9%) | 0 (0.0%) |
| $75,000 to $99,999 | 164 (15.1%) | 12 (3.0%) |
| $100,000 to $149,999 | 207 (19.0%) | 15 (3.7%) |
| $150,000 or more | 130 (12.0%) | 0 (0.0%) |
| Total | 1,087 (100.0%) | 400 (100.0%) |
Monthly Housing Cost Tiers in Bloomer
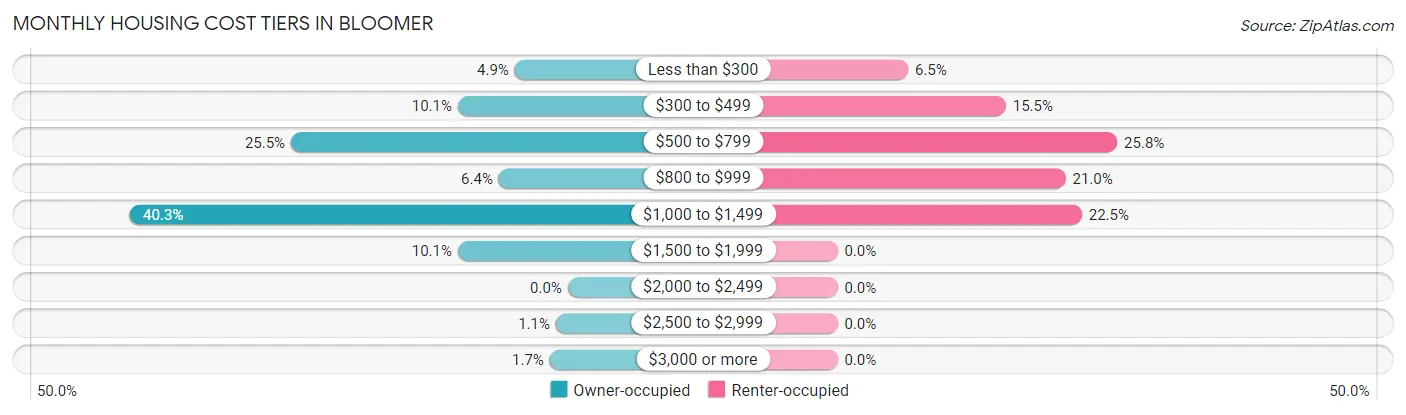
| Monthly Cost | Owner-occupied | Renter-occupied |
| Less than $300 | 53 (4.9%) | 26 (6.5%) |
| $300 to $499 | 110 (10.1%) | 62 (15.5%) |
| $500 to $799 | 277 (25.5%) | 103 (25.8%) |
| $800 to $999 | 69 (6.4%) | 84 (21.0%) |
| $1,000 to $1,499 | 438 (40.3%) | 90 (22.5%) |
| $1,500 to $1,999 | 110 (10.1%) | 0 (0.0%) |
| $2,000 to $2,499 | 0 (0.0%) | 0 (0.0%) |
| $2,500 to $2,999 | 12 (1.1%) | 0 (0.0%) |
| $3,000 or more | 18 (1.7%) | 0 (0.0%) |
| Total | 1,087 (100.0%) | 400 (100.0%) |
Physical Housing Characteristics in Bloomer
Housing Structures in Bloomer
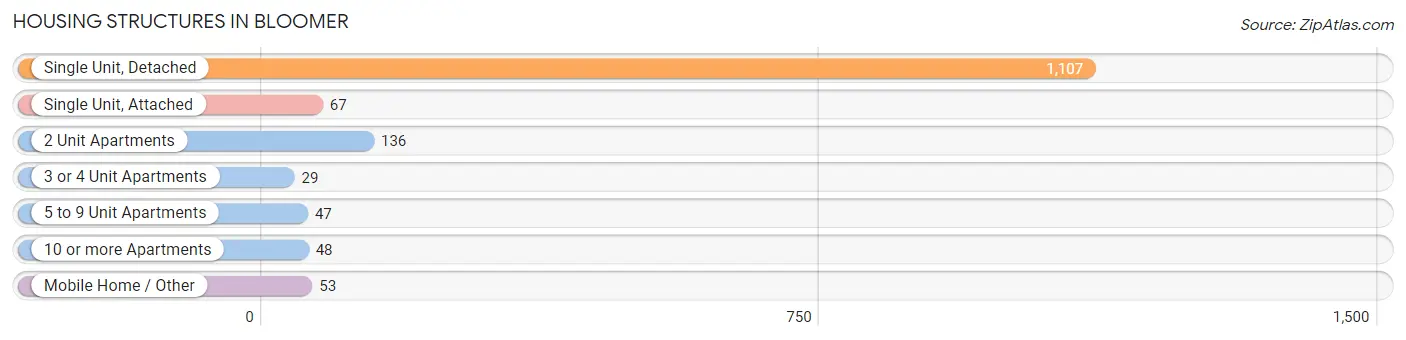
| Structure Type | # Housing Units | % Housing Units |
| Single Unit, Detached | 1,107 | 74.5% |
| Single Unit, Attached | 67 | 4.5% |
| 2 Unit Apartments | 136 | 9.1% |
| 3 or 4 Unit Apartments | 29 | 1.9% |
| 5 to 9 Unit Apartments | 47 | 3.2% |
| 10 or more Apartments | 48 | 3.2% |
| Mobile Home / Other | 53 | 3.6% |
| Total | 1,487 | 100.0% |
Housing Structures by Occupancy in Bloomer
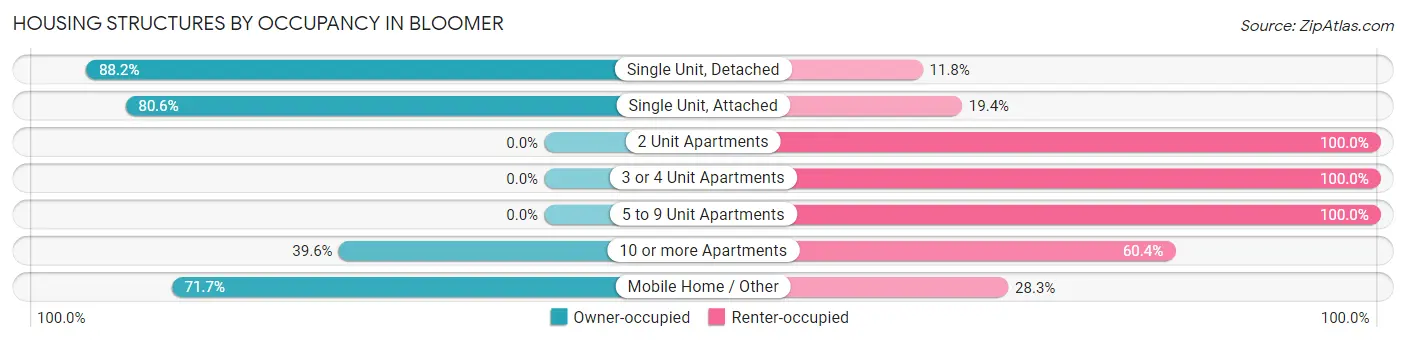
| Structure Type | Owner-occupied | Renter-occupied |
| Single Unit, Detached | 976 (88.2%) | 131 (11.8%) |
| Single Unit, Attached | 54 (80.6%) | 13 (19.4%) |
| 2 Unit Apartments | 0 (0.0%) | 136 (100.0%) |
| 3 or 4 Unit Apartments | 0 (0.0%) | 29 (100.0%) |
| 5 to 9 Unit Apartments | 0 (0.0%) | 47 (100.0%) |
| 10 or more Apartments | 19 (39.6%) | 29 (60.4%) |
| Mobile Home / Other | 38 (71.7%) | 15 (28.3%) |
| Total | 1,087 (73.1%) | 400 (26.9%) |
Housing Structures by Number of Rooms in Bloomer
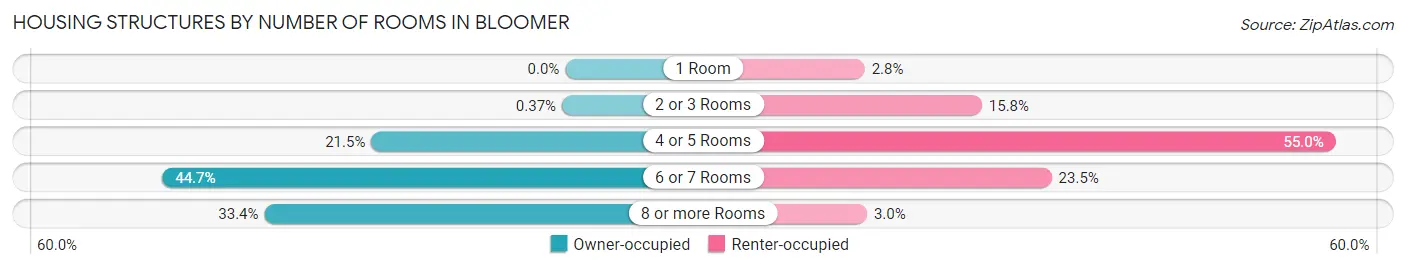
| Number of Rooms | Owner-occupied | Renter-occupied |
| 1 Room | 0 (0.0%) | 11 (2.8%) |
| 2 or 3 Rooms | 4 (0.4%) | 63 (15.8%) |
| 4 or 5 Rooms | 234 (21.5%) | 220 (55.0%) |
| 6 or 7 Rooms | 486 (44.7%) | 94 (23.5%) |
| 8 or more Rooms | 363 (33.4%) | 12 (3.0%) |
| Total | 1,087 (100.0%) | 400 (100.0%) |
Housing Structure by Heating Type in Bloomer
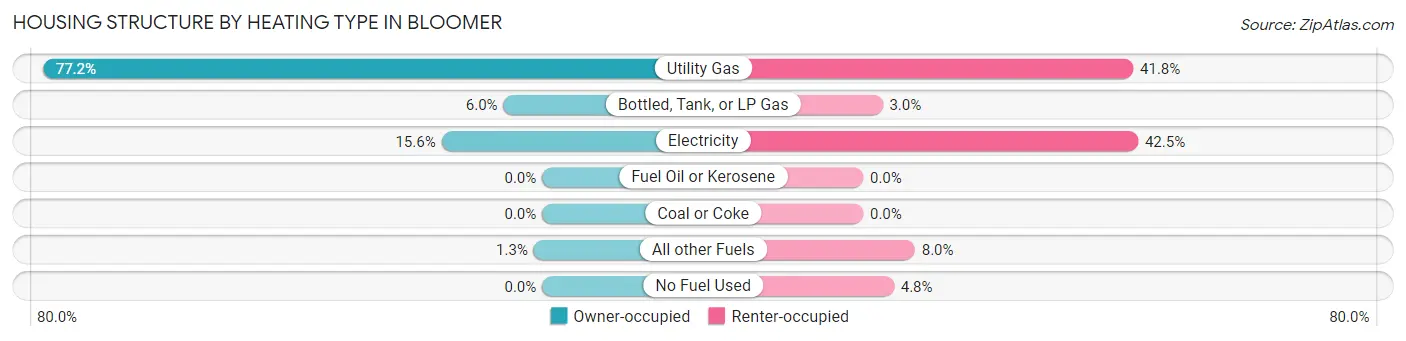
| Heating Type | Owner-occupied | Renter-occupied |
| Utility Gas | 839 (77.2%) | 167 (41.7%) |
| Bottled, Tank, or LP Gas | 65 (6.0%) | 12 (3.0%) |
| Electricity | 169 (15.5%) | 170 (42.5%) |
| Fuel Oil or Kerosene | 0 (0.0%) | 0 (0.0%) |
| Coal or Coke | 0 (0.0%) | 0 (0.0%) |
| All other Fuels | 14 (1.3%) | 32 (8.0%) |
| No Fuel Used | 0 (0.0%) | 19 (4.8%) |
| Total | 1,087 (100.0%) | 400 (100.0%) |
Household Vehicle Usage in Bloomer
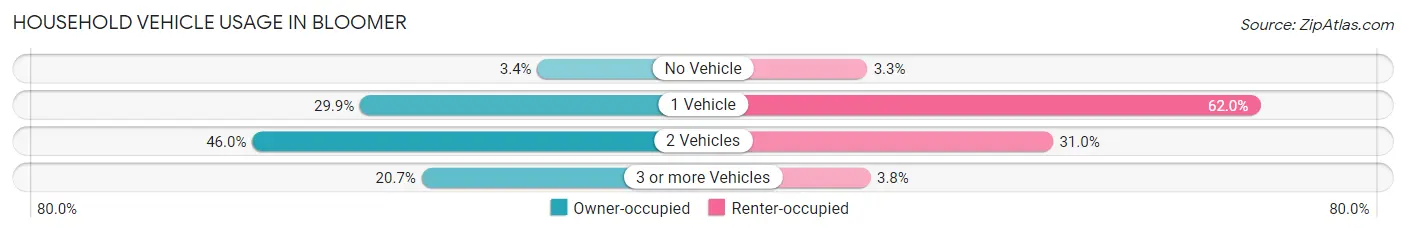
| Vehicles per Household | Owner-occupied | Renter-occupied |
| No Vehicle | 37 (3.4%) | 13 (3.3%) |
| 1 Vehicle | 325 (29.9%) | 248 (62.0%) |
| 2 Vehicles | 500 (46.0%) | 124 (31.0%) |
| 3 or more Vehicles | 225 (20.7%) | 15 (3.7%) |
| Total | 1,087 (100.0%) | 400 (100.0%) |
Real Estate & Mortgages in Bloomer
Real Estate and Mortgage Overview in Bloomer
| Characteristic | Without Mortgage | With Mortgage |
| Housing Units | 444 | 643 |
| Median Property Value | $178,000 | $166,100 |
| Median Household Income | $49,297 | $59 |
| Monthly Housing Costs | $595 | $0 |
| Real Estate Taxes | $2,606 | $5 |
Property Value by Mortgage Status in Bloomer
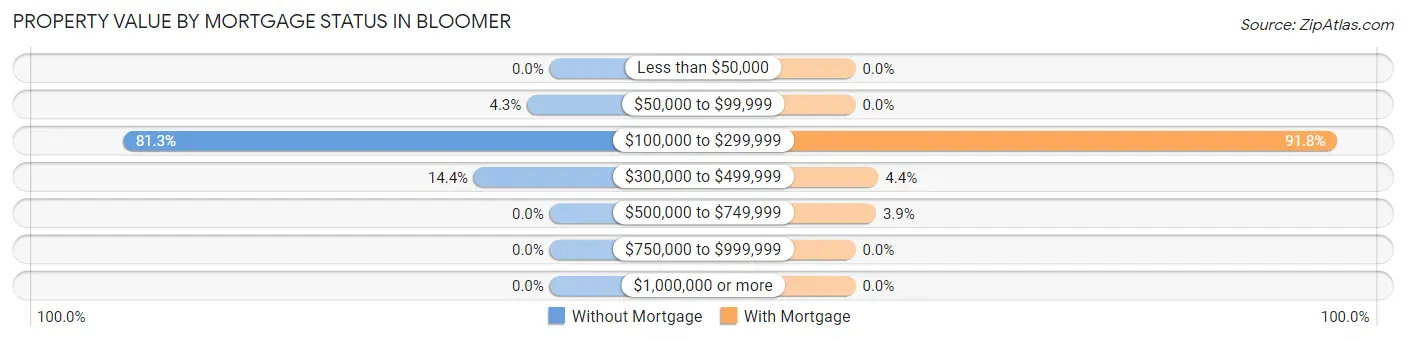
| Property Value | Without Mortgage | With Mortgage |
| Less than $50,000 | 0 (0.0%) | 0 (0.0%) |
| $50,000 to $99,999 | 19 (4.3%) | 0 (0.0%) |
| $100,000 to $299,999 | 361 (81.3%) | 590 (91.8%) |
| $300,000 to $499,999 | 64 (14.4%) | 28 (4.3%) |
| $500,000 to $749,999 | 0 (0.0%) | 25 (3.9%) |
| $750,000 to $999,999 | 0 (0.0%) | 0 (0.0%) |
| $1,000,000 or more | 0 (0.0%) | 0 (0.0%) |
| Total | 444 (100.0%) | 643 (100.0%) |
Household Income by Mortgage Status in Bloomer
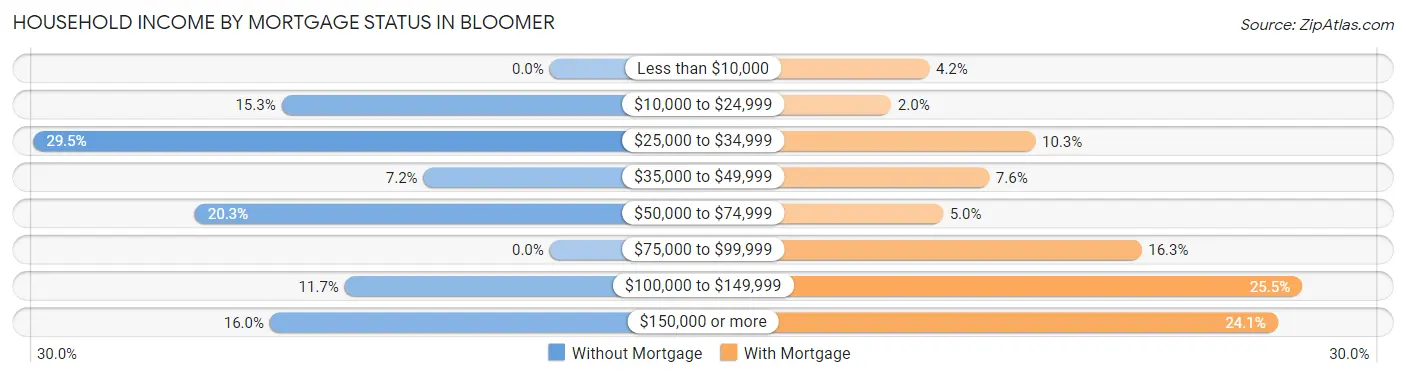
| Household Income | Without Mortgage | With Mortgage |
| Less than $10,000 | 0 (0.0%) | 27 (4.2%) |
| $10,000 to $24,999 | 68 (15.3%) | 13 (2.0%) |
| $25,000 to $34,999 | 131 (29.5%) | 66 (10.3%) |
| $35,000 to $49,999 | 32 (7.2%) | 49 (7.6%) |
| $50,000 to $74,999 | 90 (20.3%) | 32 (5.0%) |
| $75,000 to $99,999 | 0 (0.0%) | 105 (16.3%) |
| $100,000 to $149,999 | 52 (11.7%) | 164 (25.5%) |
| $150,000 or more | 71 (16.0%) | 155 (24.1%) |
| Total | 444 (100.0%) | 643 (100.0%) |
Property Value to Household Income Ratio in Bloomer
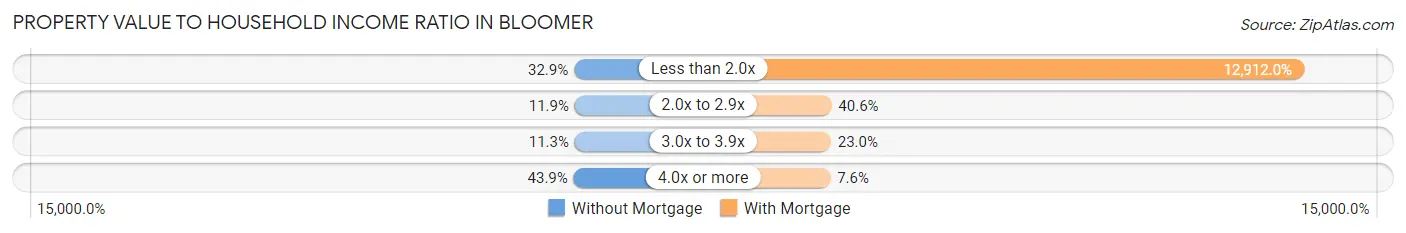
| Value-to-Income Ratio | Without Mortgage | With Mortgage |
| Less than 2.0x | 146 (32.9%) | 83,024 (12,912.0%) |
| 2.0x to 2.9x | 53 (11.9%) | 261 (40.6%) |
| 3.0x to 3.9x | 50 (11.3%) | 148 (23.0%) |
| 4.0x or more | 195 (43.9%) | 49 (7.6%) |
| Total | 444 (100.0%) | 643 (100.0%) |
Real Estate Taxes by Mortgage Status in Bloomer
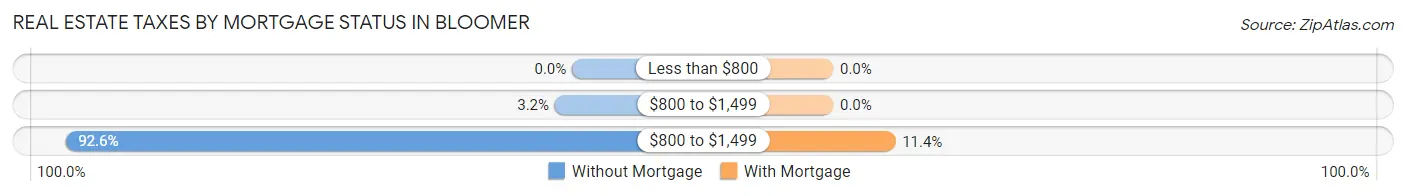
| Property Taxes | Without Mortgage | With Mortgage |
| Less than $800 | 0 (0.0%) | 0 (0.0%) |
| $800 to $1,499 | 14 (3.2%) | 0 (0.0%) |
| $800 to $1,499 | 411 (92.6%) | 73 (11.4%) |
| Total | 444 (100.0%) | 643 (100.0%) |
Health & Disability in Bloomer
Health Insurance Coverage by Age in Bloomer
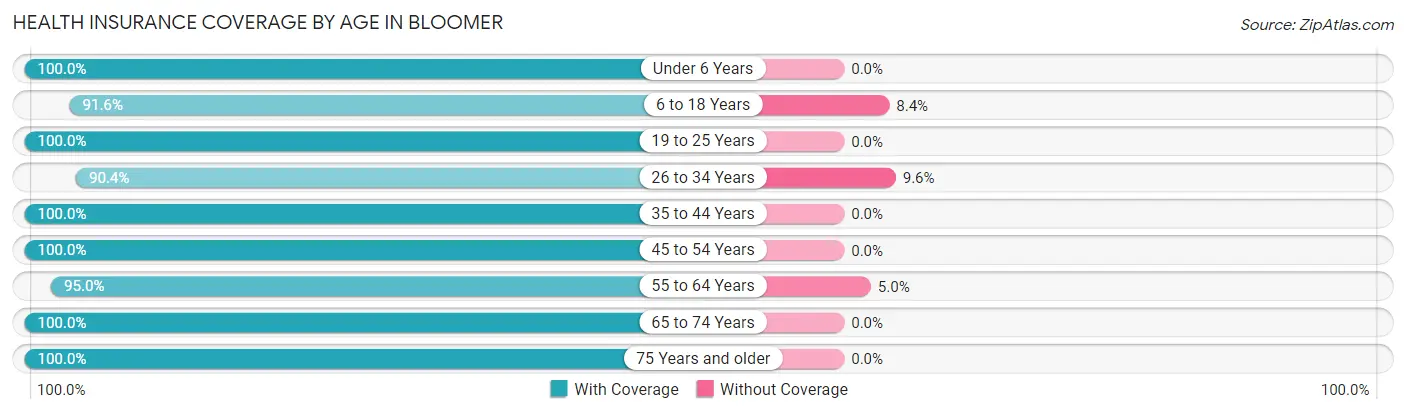
| Age Bracket | With Coverage | Without Coverage |
| Under 6 Years | 283 (100.0%) | 0 (0.0%) |
| 6 to 18 Years | 698 (91.6%) | 64 (8.4%) |
| 19 to 25 Years | 286 (100.0%) | 0 (0.0%) |
| 26 to 34 Years | 480 (90.4%) | 51 (9.6%) |
| 35 to 44 Years | 381 (100.0%) | 0 (0.0%) |
| 45 to 54 Years | 267 (100.0%) | 0 (0.0%) |
| 55 to 64 Years | 517 (95.0%) | 27 (5.0%) |
| 65 to 74 Years | 215 (100.0%) | 0 (0.0%) |
| 75 Years and older | 338 (100.0%) | 0 (0.0%) |
| Total | 3,465 (96.1%) | 142 (3.9%) |
Health Insurance Coverage by Citizenship Status in Bloomer
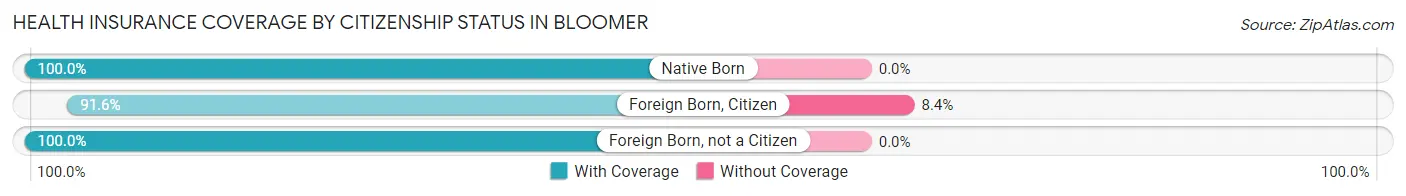
| Citizenship Status | With Coverage | Without Coverage |
| Native Born | 283 (100.0%) | 0 (0.0%) |
| Foreign Born, Citizen | 698 (91.6%) | 64 (8.4%) |
| Foreign Born, not a Citizen | 286 (100.0%) | 0 (0.0%) |
Health Insurance Coverage by Household Income in Bloomer
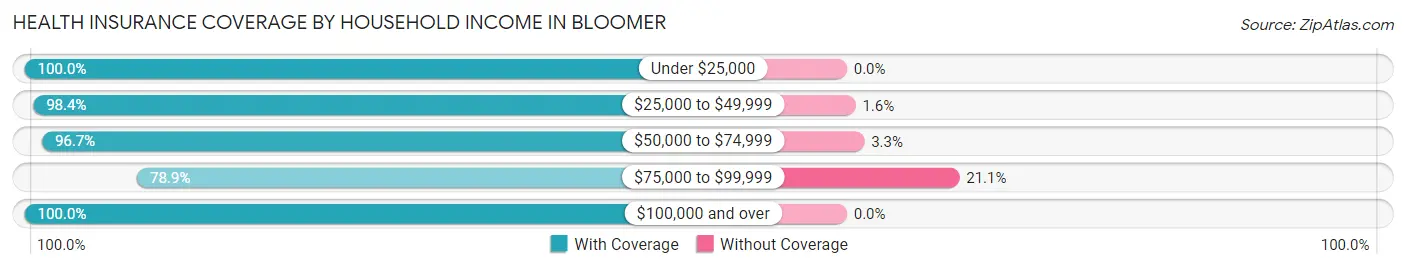
| Household Income | With Coverage | Without Coverage |
| Under $25,000 | 461 (100.0%) | 0 (0.0%) |
| $25,000 to $49,999 | 913 (98.4%) | 15 (1.6%) |
| $50,000 to $74,999 | 416 (96.7%) | 14 (3.3%) |
| $75,000 to $99,999 | 423 (78.9%) | 113 (21.1%) |
| $100,000 and over | 1,252 (100.0%) | 0 (0.0%) |
Public vs Private Health Insurance Coverage by Age in Bloomer
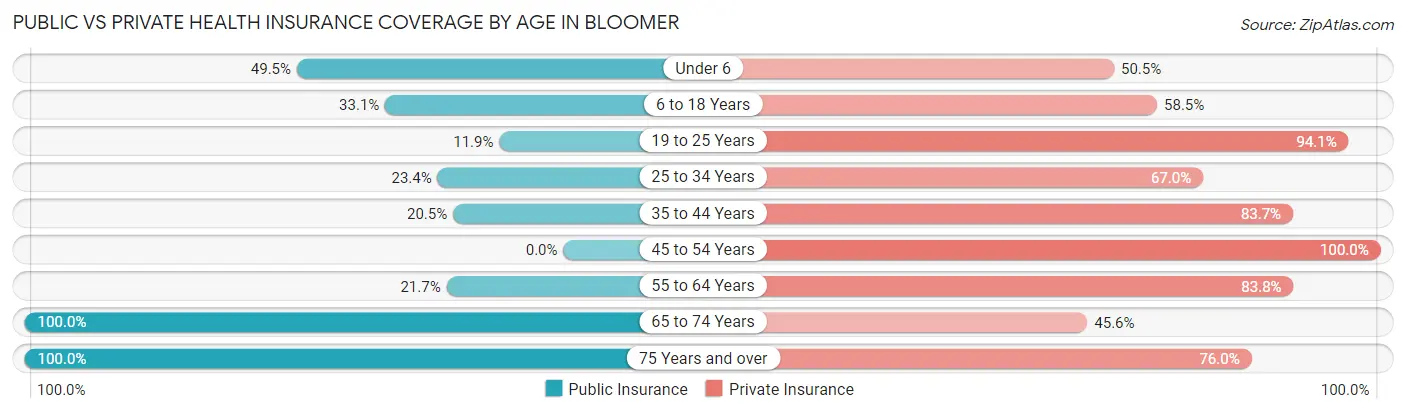
| Age Bracket | Public Insurance | Private Insurance |
| Under 6 | 140 (49.5%) | 143 (50.5%) |
| 6 to 18 Years | 252 (33.1%) | 446 (58.5%) |
| 19 to 25 Years | 34 (11.9%) | 269 (94.1%) |
| 25 to 34 Years | 124 (23.4%) | 356 (67.0%) |
| 35 to 44 Years | 78 (20.5%) | 319 (83.7%) |
| 45 to 54 Years | 0 (0.0%) | 267 (100.0%) |
| 55 to 64 Years | 118 (21.7%) | 456 (83.8%) |
| 65 to 74 Years | 215 (100.0%) | 98 (45.6%) |
| 75 Years and over | 338 (100.0%) | 257 (76.0%) |
| Total | 1,299 (36.0%) | 2,611 (72.4%) |
Disability Status by Sex by Age in Bloomer
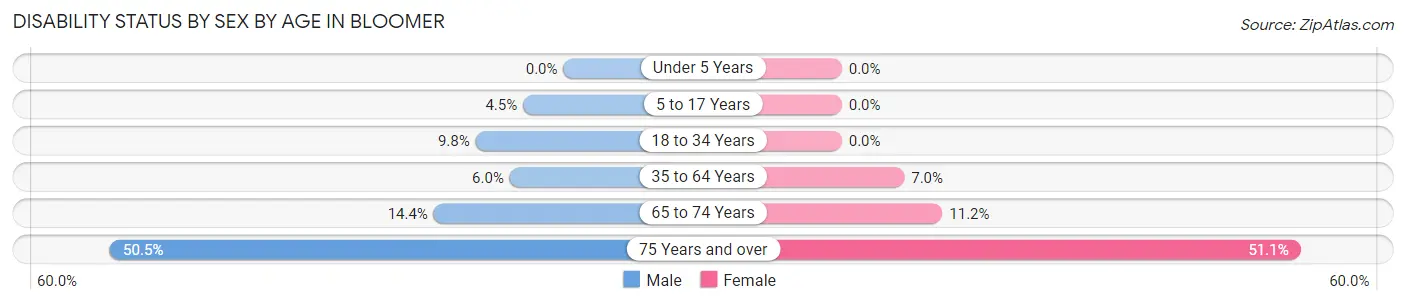
| Age Bracket | Male | Female |
| Under 5 Years | 0 (0.0%) | 0 (0.0%) |
| 5 to 17 Years | 15 (4.5%) | 0 (0.0%) |
| 18 to 34 Years | 31 (9.8%) | 0 (0.0%) |
| 35 to 64 Years | 36 (6.0%) | 41 (7.0%) |
| 65 to 74 Years | 13 (14.4%) | 14 (11.2%) |
| 75 Years and over | 54 (50.5%) | 118 (51.1%) |
Disability Class by Sex by Age in Bloomer
Disability Class: Hearing Difficulty
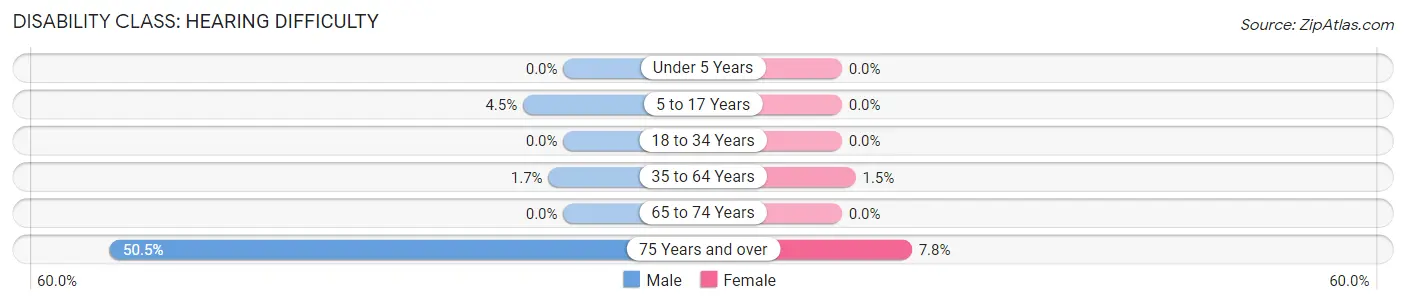
| Age Bracket | Male | Female |
| Under 5 Years | 0 (0.0%) | 0 (0.0%) |
| 5 to 17 Years | 15 (4.5%) | 0 (0.0%) |
| 18 to 34 Years | 0 (0.0%) | 0 (0.0%) |
| 35 to 64 Years | 10 (1.7%) | 9 (1.5%) |
| 65 to 74 Years | 0 (0.0%) | 0 (0.0%) |
| 75 Years and over | 54 (50.5%) | 18 (7.8%) |
Disability Class: Vision Difficulty
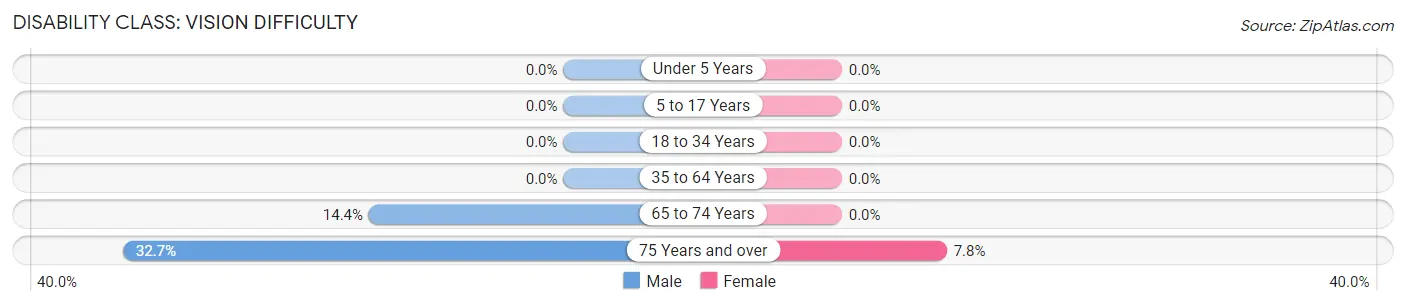
| Age Bracket | Male | Female |
| Under 5 Years | 0 (0.0%) | 0 (0.0%) |
| 5 to 17 Years | 0 (0.0%) | 0 (0.0%) |
| 18 to 34 Years | 0 (0.0%) | 0 (0.0%) |
| 35 to 64 Years | 0 (0.0%) | 0 (0.0%) |
| 65 to 74 Years | 13 (14.4%) | 0 (0.0%) |
| 75 Years and over | 35 (32.7%) | 18 (7.8%) |
Disability Class: Cognitive Difficulty
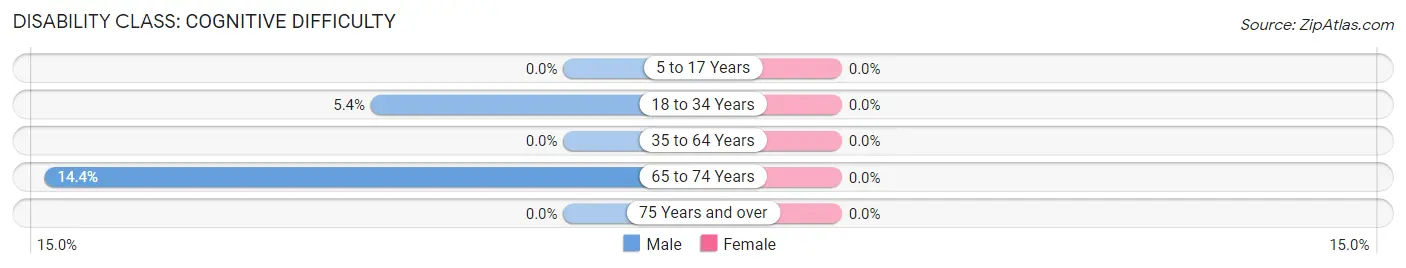
| Age Bracket | Male | Female |
| 5 to 17 Years | 0 (0.0%) | 0 (0.0%) |
| 18 to 34 Years | 17 (5.4%) | 0 (0.0%) |
| 35 to 64 Years | 0 (0.0%) | 0 (0.0%) |
| 65 to 74 Years | 13 (14.4%) | 0 (0.0%) |
| 75 Years and over | 0 (0.0%) | 0 (0.0%) |
Disability Class: Ambulatory Difficulty
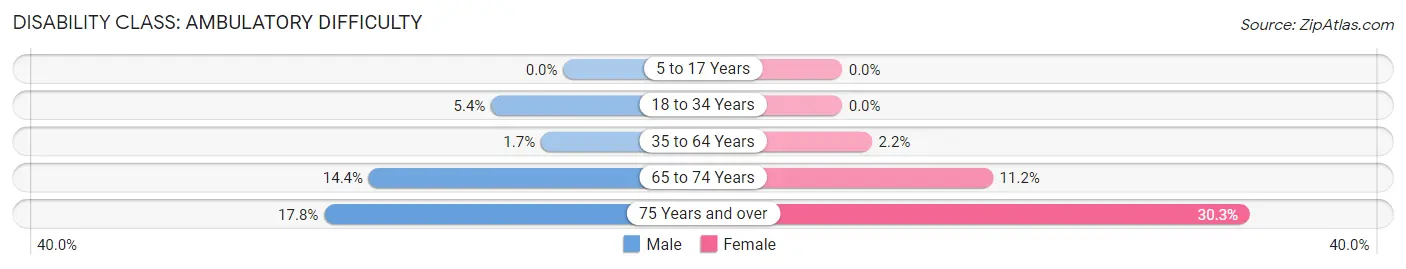
| Age Bracket | Male | Female |
| 5 to 17 Years | 0 (0.0%) | 0 (0.0%) |
| 18 to 34 Years | 17 (5.4%) | 0 (0.0%) |
| 35 to 64 Years | 10 (1.7%) | 13 (2.2%) |
| 65 to 74 Years | 13 (14.4%) | 14 (11.2%) |
| 75 Years and over | 19 (17.8%) | 70 (30.3%) |
Disability Class: Self-Care Difficulty
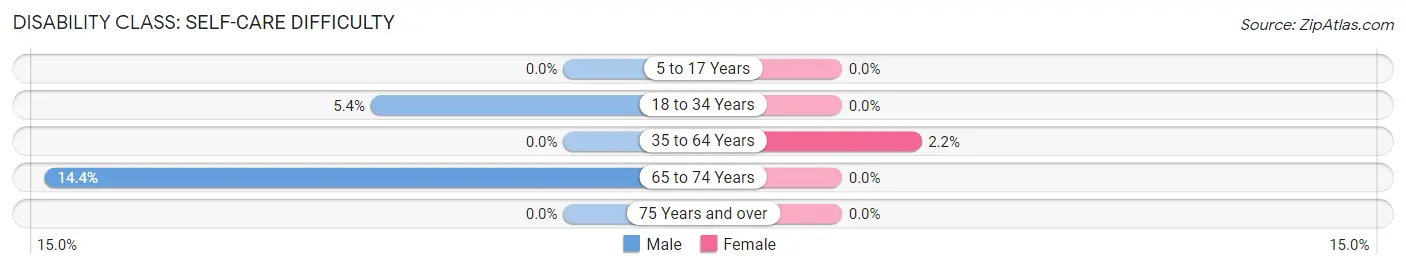
| Age Bracket | Male | Female |
| 5 to 17 Years | 0 (0.0%) | 0 (0.0%) |
| 18 to 34 Years | 17 (5.4%) | 0 (0.0%) |
| 35 to 64 Years | 0 (0.0%) | 13 (2.2%) |
| 65 to 74 Years | 13 (14.4%) | 0 (0.0%) |
| 75 Years and over | 0 (0.0%) | 0 (0.0%) |
Technology Access in Bloomer
Computing Device Access in Bloomer
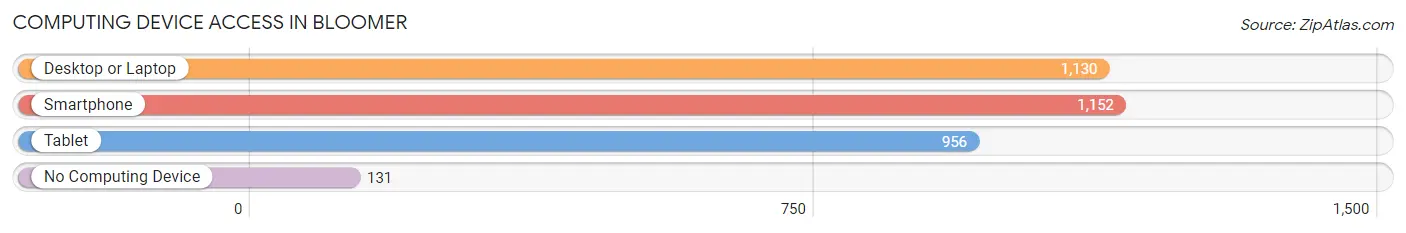
| Device Type | # Households | % Households |
| Desktop or Laptop | 1,130 | 76.0% |
| Smartphone | 1,152 | 77.5% |
| Tablet | 956 | 64.3% |
| No Computing Device | 131 | 8.8% |
| Total | 1,487 | 100.0% |
Internet Access in Bloomer
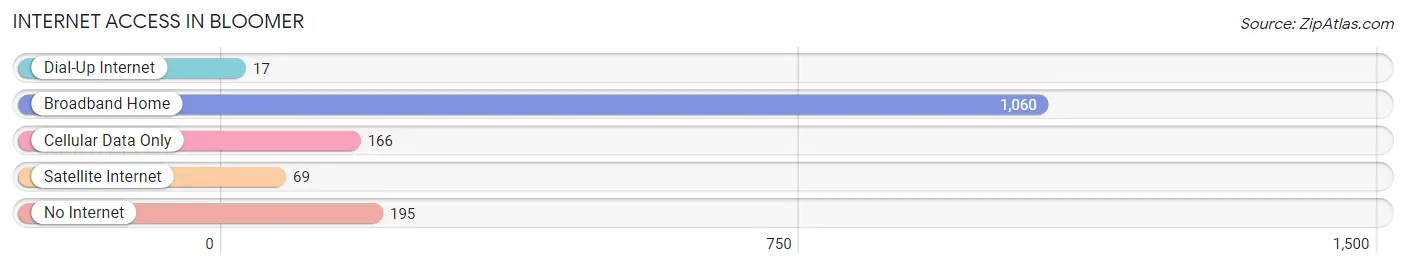
| Internet Type | # Households | % Households |
| Dial-Up Internet | 17 | 1.1% |
| Broadband Home | 1,060 | 71.3% |
| Cellular Data Only | 166 | 11.2% |
| Satellite Internet | 69 | 4.6% |
| No Internet | 195 | 13.1% |
| Total | 1,487 | 100.0% |
Bloomer Summary
Bloomer, Wisconsin is a small city located in the northwest corner of the state, in Chippewa County. It is situated on the Chippewa River, and is home to a population of approximately 3,500 people. The city was founded in 1856 by a group of settlers from New York, and was named after the nearby town of Bloomer, which was named after a prominent local politician.
History
The first settlers in the area were a group of New Yorkers who arrived in 1856. They named the town after the nearby town of Bloomer, which was named after a prominent local politician. The settlers quickly established a thriving community, and the town was incorporated in 1872.
In the late 19th century, Bloomer became a major center for the lumber industry. The city was home to several sawmills, and the lumber industry provided the majority of the city’s income. The city also became a major hub for the railroad industry, with several lines running through the city.
In the early 20th century, the lumber industry began to decline, and the city began to focus on other industries. The city became a major center for the dairy industry, and the city’s economy was further bolstered by the arrival of several manufacturing companies.
Geography
Bloomer is located in the northwest corner of Wisconsin, in Chippewa County. The city is situated on the Chippewa River, and is surrounded by rolling hills and forests. The city is located approximately 50 miles from the Minnesota border, and is approximately 100 miles from the state capital of Madison.
The city has a total area of 4.2 square miles, and has a population density of 830 people per square mile. The city is located in a humid continental climate zone, and experiences hot summers and cold winters.
Economy
The economy of Bloomer is largely based on agriculture and manufacturing. The city is home to several dairy farms, and the dairy industry is a major contributor to the city’s economy. The city is also home to several manufacturing companies, including a paper mill, a furniture factory, and a plastics factory.
The city is also home to several retail stores, restaurants, and other businesses. The city is home to a hospital, a library, and several schools.
Demographics
As of the 2010 census, the population of Bloomer was 3,521. The city has a population density of 830 people per square mile. The median age of the population is 43.7 years, and the median household income is $41,945.
The racial makeup of the city is 97.2% White, 0.7% African American, 0.3% Native American, 0.3% Asian, 0.1% Pacific Islander, 0.4% from other races, and 1.1% from two or more races. The city is home to a large number of immigrants, with approximately 10% of the population being foreign-born.
Conclusion
Bloomer, Wisconsin is a small city located in the northwest corner of the state, in Chippewa County. The city was founded in 1856 by a group of settlers from New York, and was named after the nearby town of Bloomer. The city has a population of approximately 3,500 people, and is home to several dairy farms, manufacturing companies, and other businesses. The city is also home to a large number of immigrants, with approximately 10% of the population being foreign-born. The city has a humid continental climate, and experiences hot summers and cold winters.
Common Questions
What is Per Capita Income in Bloomer?
Per Capita income in Bloomer is $28,918.
What is the Median Family Income in Bloomer?
Median Family Income in Bloomer is $78,320.
What is the Median Household income in Bloomer?
Median Household Income in Bloomer is $48,398.
What is Income or Wage Gap in Bloomer?
Income or Wage Gap in Bloomer is 37.6%.
Women in Bloomer earn 62.4 cents for every dollar earned by a man.
What is Inequality or Gini Index in Bloomer?
Inequality or Gini Index in Bloomer is 0.43.
What is the Total Population of Bloomer?
Total Population of Bloomer is 3,679.
What is the Total Male Population of Bloomer?
Total Male Population of Bloomer is 1,573.
What is the Total Female Population of Bloomer?
Total Female Population of Bloomer is 2,106.
What is the Ratio of Males per 100 Females in Bloomer?
There are 74.69 Males per 100 Females in Bloomer.
What is the Ratio of Females per 100 Males in Bloomer?
There are 133.88 Females per 100 Males in Bloomer.
What is the Median Population Age in Bloomer?
Median Population Age in Bloomer is 34.7 Years.
What is the Average Family Size in Bloomer
Average Family Size in Bloomer is 3.4 People.
What is the Average Household Size in Bloomer
Average Household Size in Bloomer is 2.4 People.
How Large is the Labor Force in Bloomer?
There are 1,890 People in the Labor Forcein in Bloomer.
What is the Percentage of People in the Labor Force in Bloomer?
70.3% of People are in the Labor Force in Bloomer.
What is the Unemployment Rate in Bloomer?
Unemployment Rate in Bloomer is 2.3%.