Birchwood, WI Map & Demographics
Birchwood Map
Birchwood Overview
$26,184
PER CAPITA INCOME
$85,000
AVG FAMILY INCOME
$65,469
AVG HOUSEHOLD INCOME
53.4%
WAGE / INCOME GAP [ % ]
46.6¢/ $1
WAGE / INCOME GAP [ $ ]
0.35
INEQUALITY / GINI INDEX
434
TOTAL POPULATION
234
MALE POPULATION
200
FEMALE POPULATION
117.00
MALES / 100 FEMALES
85.47
FEMALES / 100 MALES
38.5
MEDIAN AGE
3.6
AVG FAMILY SIZE
2.8
AVG HOUSEHOLD SIZE
248
LABOR FORCE [ PEOPLE ]
66.3%
PERCENT IN LABOR FORCE
2.0%
UNEMPLOYMENT RATE
Birchwood Zip Codes
Birchwood Area Codes
Income in Birchwood
Income Overview in Birchwood
Per Capita Income in Birchwood is $26,184, while median incomes of families and households are $85,000 and $65,469 respectively.
| Characteristic | Number | Measure |
| Per Capita Income | 434 | $26,184 |
| Median Family Income | 104 | $85,000 |
| Mean Family Income | 104 | $90,085 |
| Median Household Income | 157 | $65,469 |
| Mean Household Income | 157 | $70,603 |
| Income Deficit | 104 | $0 |
| Wage / Income Gap (%) | 434 | 53.38% |
| Wage / Income Gap ($) | 434 | 46.62¢ per $1 |
| Gini / Inequality Index | 434 | 0.35 |
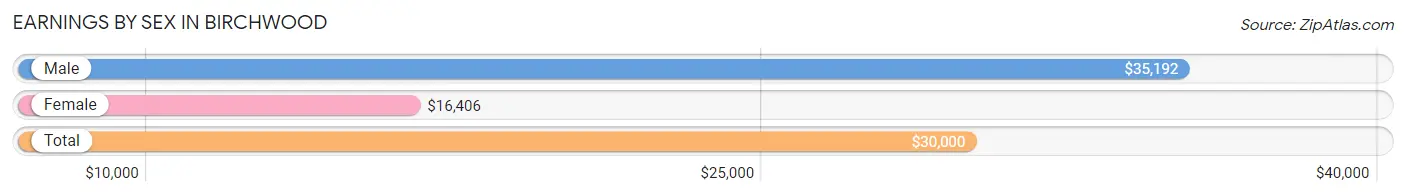
Earnings by Sex in Birchwood
Average Earnings in Birchwood are $30,000, $35,192 for men and $16,406 for women, a difference of 53.4%.
| Sex | Number | Average Earnings |
| Male | 140 (54.7%) | $35,192 |
| Female | 116 (45.3%) | $16,406 |
| Total | 256 (100.0%) | $30,000 |
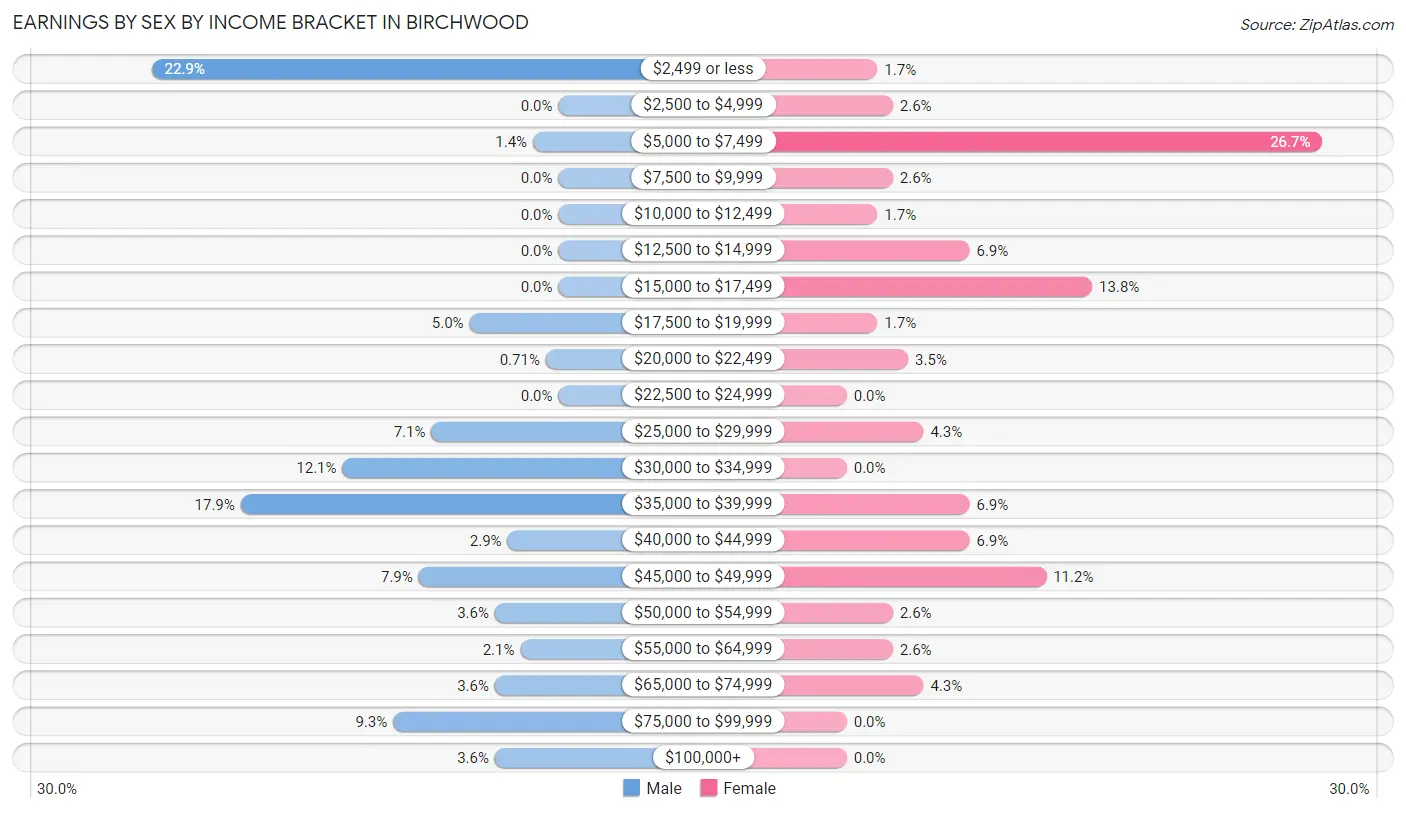
Earnings by Sex by Income Bracket in Birchwood
The most common earnings brackets in Birchwood are $2,499 or less for men (32 | 22.9%) and $5,000 to $7,499 for women (31 | 26.7%).
| Income | Male | Female |
| $2,499 or less | 32 (22.9%) | 2 (1.7%) |
| $2,500 to $4,999 | 0 (0.0%) | 3 (2.6%) |
| $5,000 to $7,499 | 2 (1.4%) | 31 (26.7%) |
| $7,500 to $9,999 | 0 (0.0%) | 3 (2.6%) |
| $10,000 to $12,499 | 0 (0.0%) | 2 (1.7%) |
| $12,500 to $14,999 | 0 (0.0%) | 8 (6.9%) |
| $15,000 to $17,499 | 0 (0.0%) | 16 (13.8%) |
| $17,500 to $19,999 | 7 (5.0%) | 2 (1.7%) |
| $20,000 to $22,499 | 1 (0.7%) | 4 (3.5%) |
| $22,500 to $24,999 | 0 (0.0%) | 0 (0.0%) |
| $25,000 to $29,999 | 10 (7.1%) | 5 (4.3%) |
| $30,000 to $34,999 | 17 (12.1%) | 0 (0.0%) |
| $35,000 to $39,999 | 25 (17.9%) | 8 (6.9%) |
| $40,000 to $44,999 | 4 (2.9%) | 8 (6.9%) |
| $45,000 to $49,999 | 11 (7.9%) | 13 (11.2%) |
| $50,000 to $54,999 | 5 (3.6%) | 3 (2.6%) |
| $55,000 to $64,999 | 3 (2.1%) | 3 (2.6%) |
| $65,000 to $74,999 | 5 (3.6%) | 5 (4.3%) |
| $75,000 to $99,999 | 13 (9.3%) | 0 (0.0%) |
| $100,000+ | 5 (3.6%) | 0 (0.0%) |
| Total | 140 (100.0%) | 116 (100.0%) |
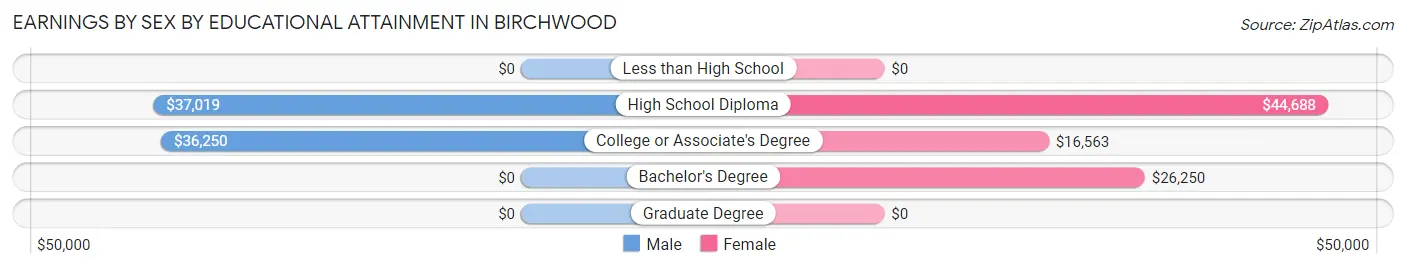
Earnings by Sex by Educational Attainment in Birchwood
| Educational Attainment | Male Income | Female Income |
| Less than High School | - | - |
| High School Diploma | $37,019 | $44,688 |
| College or Associate's Degree | $36,250 | $16,563 |
| Bachelor's Degree | - | - |
| Graduate Degree | - | - |
| Total | $37,308 | $0 |
Family Income in Birchwood
Family Income Brackets in Birchwood
According to the Birchwood family income data, there are 38 families falling into the $50,000 to $74,999 income range, which is the most common income bracket and makes up 36.5% of all families.
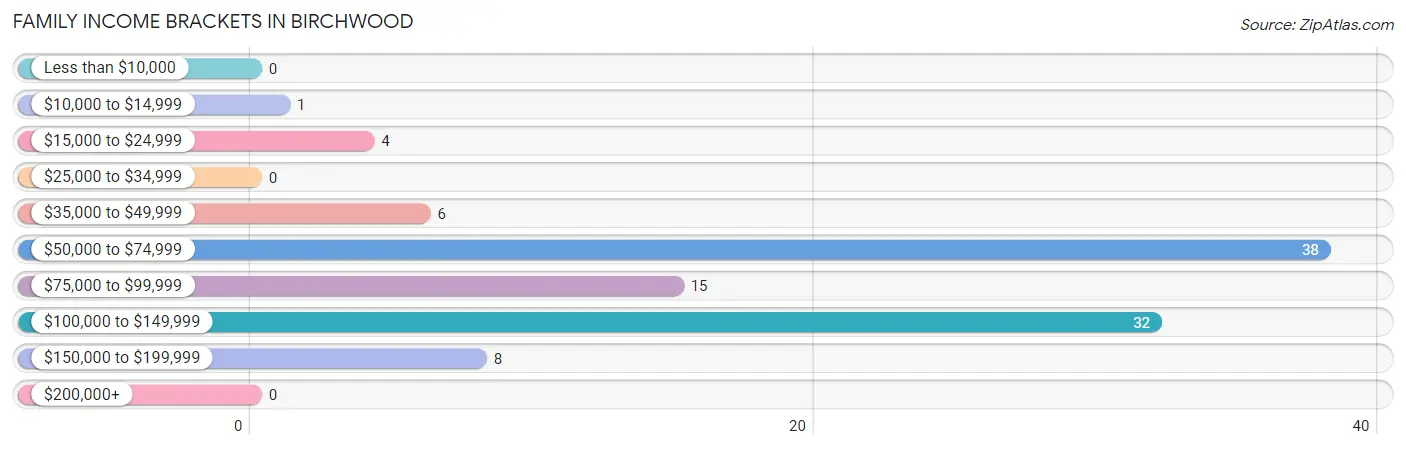
| Income Bracket | # Families | % Families |
| Less than $10,000 | 0 | 0.0% |
| $10,000 to $14,999 | 1 | 1.0% |
| $15,000 to $24,999 | 4 | 3.8% |
| $25,000 to $34,999 | 0 | 0.0% |
| $35,000 to $49,999 | 6 | 5.8% |
| $50,000 to $74,999 | 38 | 36.5% |
| $75,000 to $99,999 | 15 | 14.4% |
| $100,000 to $149,999 | 32 | 30.8% |
| $150,000 to $199,999 | 8 | 7.7% |
| $200,000+ | 0 | 0.0% |
Family Income by Famaliy Size in Birchwood
4-person families (38 | 36.5%) account for the highest median family income in Birchwood with $115,781 per family, while 3-person families (27 | 26.0%) have the highest median income of $33,125 per family member.
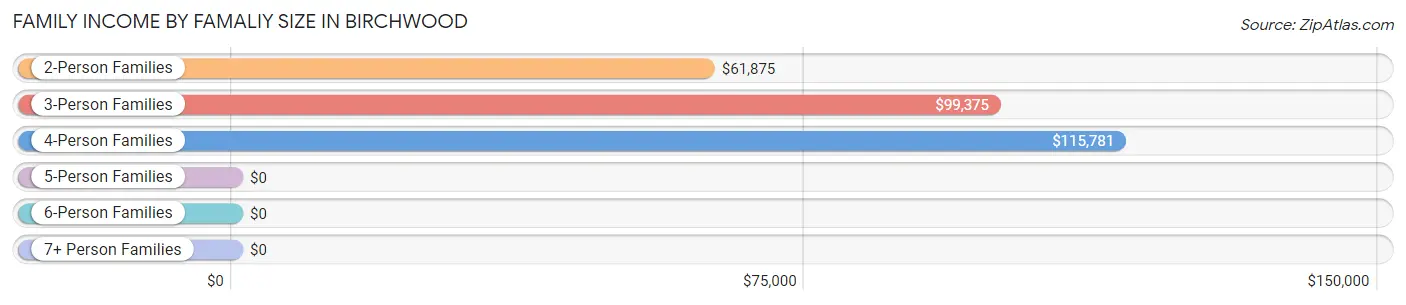
| Income Bracket | # Families | Median Income |
| 2-Person Families | 34 (32.7%) | $61,875 |
| 3-Person Families | 27 (26.0%) | $99,375 |
| 4-Person Families | 38 (36.5%) | $115,781 |
| 5-Person Families | 1 (1.0%) | $0 |
| 6-Person Families | 0 (0.0%) | $0 |
| 7+ Person Families | 4 (3.8%) | $0 |
| Total | 104 (100.0%) | $85,000 |
Family Income by Number of Earners in Birchwood
The median family income in Birchwood is $85,000, with families comprising 3+ earners (31) having the highest median family income of $115,703, while families with 1 earner (16) have the lowest median family income of $52,500, accounting for 29.8% and 15.4% of families, respectively.
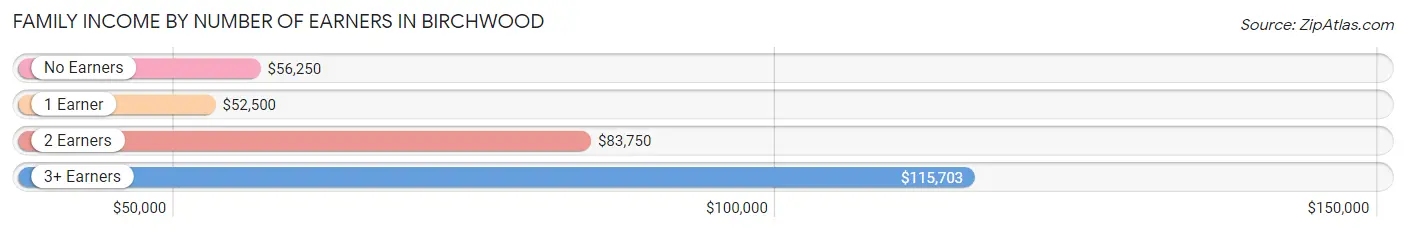
| Number of Earners | # Families | Median Income |
| No Earners | 20 (19.2%) | $56,250 |
| 1 Earner | 16 (15.4%) | $52,500 |
| 2 Earners | 37 (35.6%) | $83,750 |
| 3+ Earners | 31 (29.8%) | $115,703 |
| Total | 104 (100.0%) | $85,000 |
Household Income in Birchwood
Household Income Brackets in Birchwood
With 38 households falling in the category, the $50,000 to $74,999 income range is the most frequent in Birchwood, accounting for 24.2% of all households.
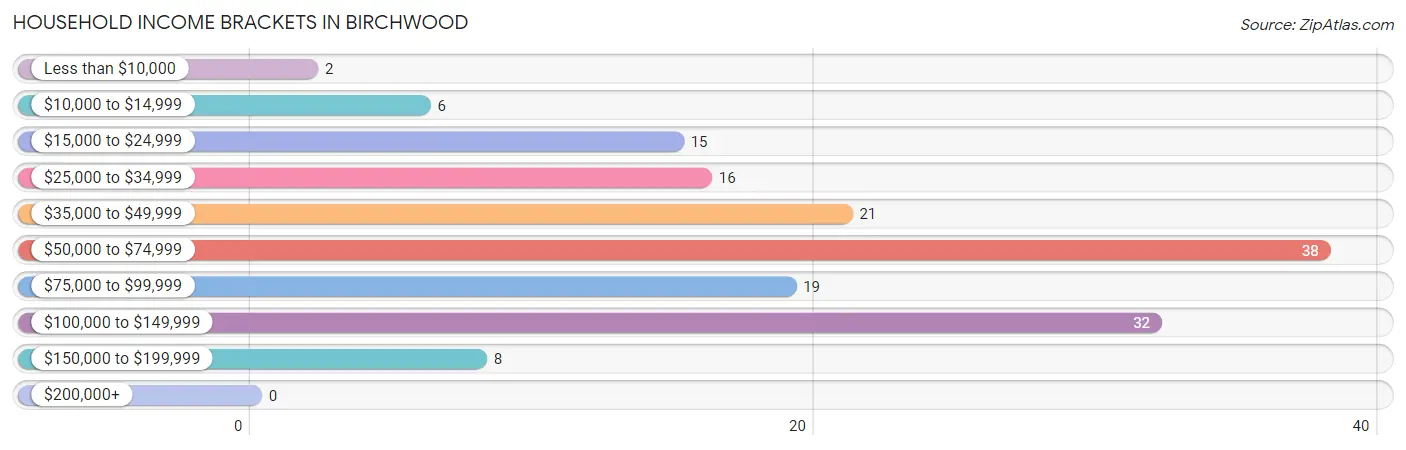
| Income Bracket | # Households | % Households |
| Less than $10,000 | 2 | 1.3% |
| $10,000 to $14,999 | 6 | 3.8% |
| $15,000 to $24,999 | 15 | 9.6% |
| $25,000 to $34,999 | 16 | 10.2% |
| $35,000 to $49,999 | 21 | 13.4% |
| $50,000 to $74,999 | 38 | 24.2% |
| $75,000 to $99,999 | 19 | 12.1% |
| $100,000 to $149,999 | 32 | 20.4% |
| $150,000 to $199,999 | 8 | 5.1% |
| $200,000+ | 0 | 0.0% |
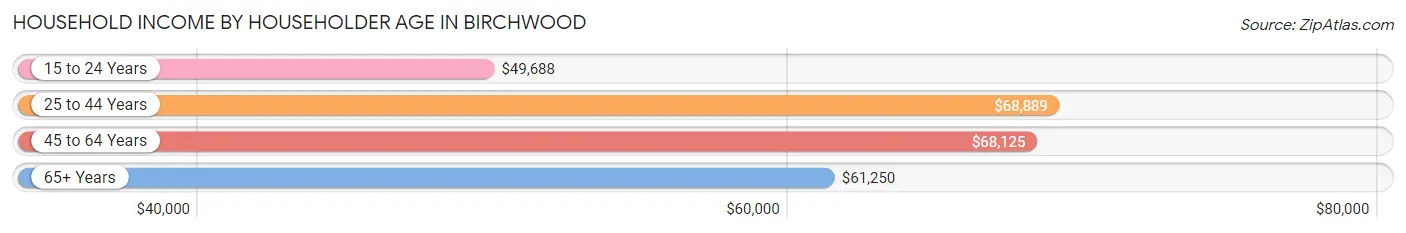
Household Income by Householder Age in Birchwood
The median household income in Birchwood is $65,469, with the highest median household income of $68,889 found in the 25 to 44 years age bracket for the primary householder. A total of 30 households (19.1%) fall into this category. Meanwhile, the 15 to 24 years age bracket for the primary householder has the lowest median household income of $49,688, with 11 households (7.0%) in this group.
| Income Bracket | # Households | Median Income |
| 15 to 24 Years | 11 (7.0%) | $49,688 |
| 25 to 44 Years | 30 (19.1%) | $68,889 |
| 45 to 64 Years | 70 (44.6%) | $68,125 |
| 65+ Years | 46 (29.3%) | $61,250 |
| Total | 157 (100.0%) | $65,469 |
Poverty in Birchwood
Income Below Poverty by Sex and Age in Birchwood
With 9.9% poverty level for males and 6.5% for females among the residents of Birchwood, 35 to 44 year old males and 12 to 14 year old females are the most vulnerable to poverty, with 4 males (28.6%) and 1 females (100.0%) in their respective age groups living below the poverty level.
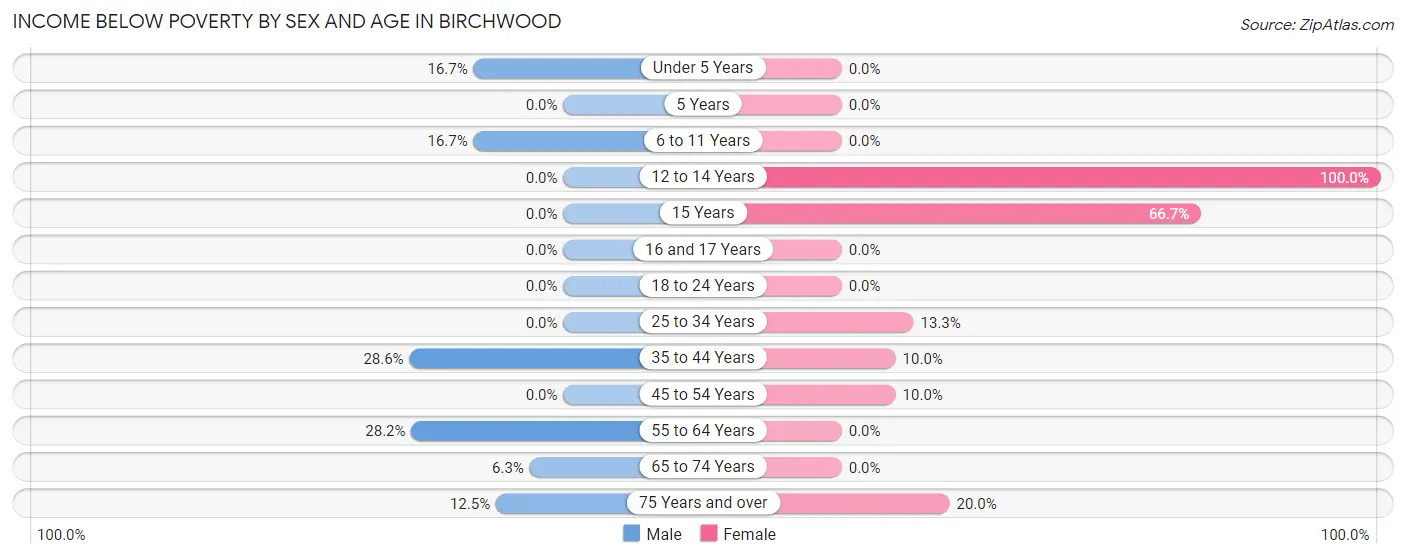
| Age Bracket | Male | Female |
| Under 5 Years | 3 (16.7%) | 0 (0.0%) |
| 5 Years | 0 (0.0%) | 0 (0.0%) |
| 6 to 11 Years | 2 (16.7%) | 0 (0.0%) |
| 12 to 14 Years | 0 (0.0%) | 1 (100.0%) |
| 15 Years | 0 (0.0%) | 2 (66.7%) |
| 16 and 17 Years | 0 (0.0%) | 0 (0.0%) |
| 18 to 24 Years | 0 (0.0%) | 0 (0.0%) |
| 25 to 34 Years | 0 (0.0%) | 2 (13.3%) |
| 35 to 44 Years | 4 (28.6%) | 2 (10.0%) |
| 45 to 54 Years | 0 (0.0%) | 3 (10.0%) |
| 55 to 64 Years | 11 (28.2%) | 0 (0.0%) |
| 65 to 74 Years | 2 (6.2%) | 0 (0.0%) |
| 75 Years and over | 1 (12.5%) | 3 (20.0%) |
| Total | 23 (9.9%) | 13 (6.5%) |
Income Above Poverty by Sex and Age in Birchwood
According to the poverty statistics in Birchwood, males aged 5 years and females aged under 5 years are the age groups that are most secure financially, with 100.0% of males and 100.0% of females in these age groups living above the poverty line.
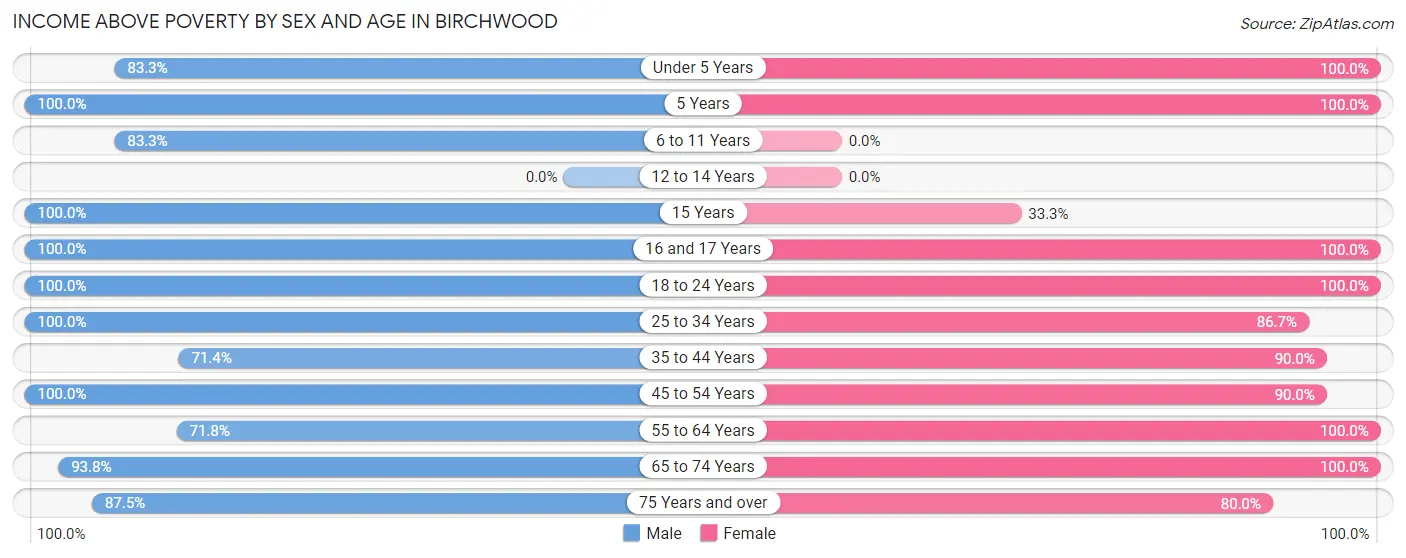
| Age Bracket | Male | Female |
| Under 5 Years | 15 (83.3%) | 12 (100.0%) |
| 5 Years | 3 (100.0%) | 7 (100.0%) |
| 6 to 11 Years | 10 (83.3%) | 0 (0.0%) |
| 12 to 14 Years | 0 (0.0%) | 0 (0.0%) |
| 15 Years | 2 (100.0%) | 1 (33.3%) |
| 16 and 17 Years | 30 (100.0%) | 9 (100.0%) |
| 18 to 24 Years | 9 (100.0%) | 35 (100.0%) |
| 25 to 34 Years | 35 (100.0%) | 13 (86.7%) |
| 35 to 44 Years | 10 (71.4%) | 18 (90.0%) |
| 45 to 54 Years | 30 (100.0%) | 27 (90.0%) |
| 55 to 64 Years | 28 (71.8%) | 16 (100.0%) |
| 65 to 74 Years | 30 (93.8%) | 37 (100.0%) |
| 75 Years and over | 7 (87.5%) | 12 (80.0%) |
| Total | 209 (90.1%) | 187 (93.5%) |
Income Below Poverty Among Married-Couple Families in Birchwood
The poverty statistics for married-couple families in Birchwood show that 1.3% or 1 of the total 76 families live below the poverty line. Families with no children have the highest poverty rate of 2.0%, comprising of 1 families. On the other hand, families with 1 or 2 children have the lowest poverty rate of 0.0%, which includes 0 families.
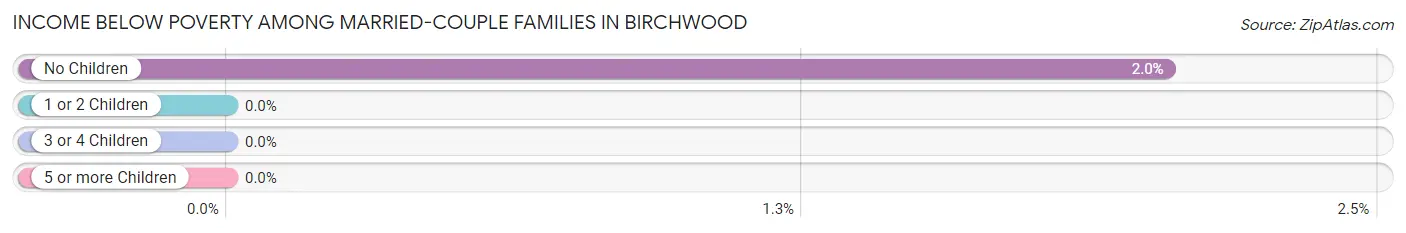
| Children | Above Poverty | Below Poverty |
| No Children | 48 (98.0%) | 1 (2.0%) |
| 1 or 2 Children | 26 (100.0%) | 0 (0.0%) |
| 3 or 4 Children | 1 (100.0%) | 0 (0.0%) |
| 5 or more Children | 0 (0.0%) | 0 (0.0%) |
| Total | 75 (98.7%) | 1 (1.3%) |
Income Below Poverty Among Single-Parent Households in Birchwood
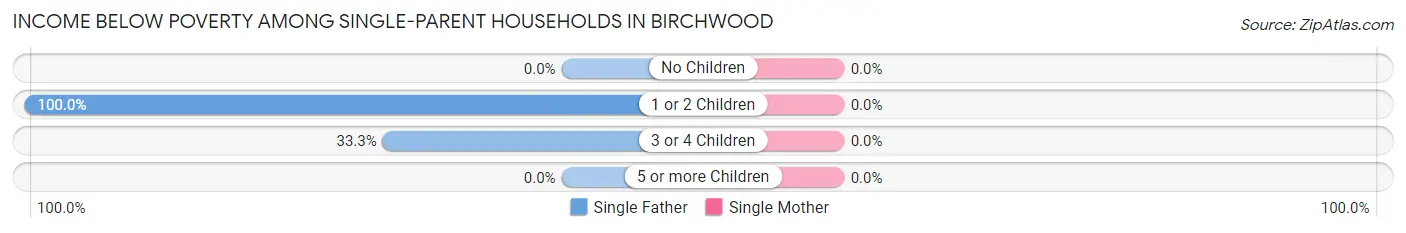
| Children | Single Father | Single Mother |
| No Children | 0 (0.0%) | 0 (0.0%) |
| 1 or 2 Children | 3 (100.0%) | 0 (0.0%) |
| 3 or 4 Children | 1 (33.3%) | 0 (0.0%) |
| 5 or more Children | 0 (0.0%) | 0 (0.0%) |
| Total | 4 (50.0%) | 0 (0.0%) |
Income Below Poverty Among Married-Couple vs Single-Parent Households in Birchwood
The poverty data for Birchwood shows that 1 of the married-couple family households (1.3%) and 4 of the single-parent households (14.3%) are living below the poverty level. Within the married-couple family households, those with no children have the highest poverty rate, with 1 households (2.0%) falling below the poverty line. Among the single-parent households, those with 1 or 2 children have the highest poverty rate, with 3 household (25.0%) living below poverty.
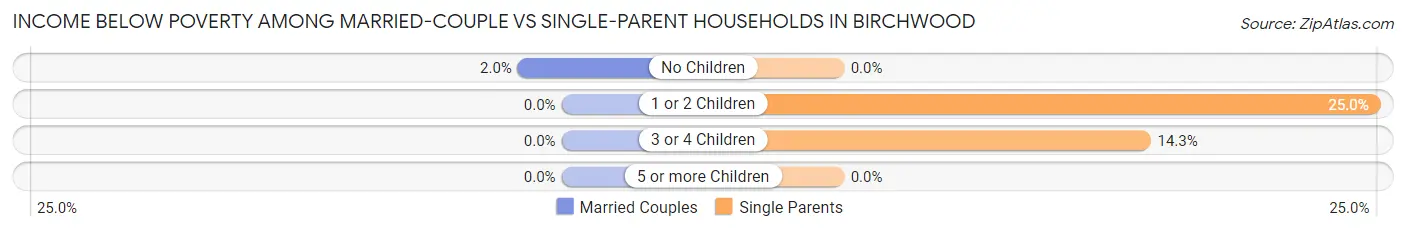
| Children | Married-Couple Families | Single-Parent Households |
| No Children | 1 (2.0%) | 0 (0.0%) |
| 1 or 2 Children | 0 (0.0%) | 3 (25.0%) |
| 3 or 4 Children | 0 (0.0%) | 1 (14.3%) |
| 5 or more Children | 0 (0.0%) | 0 (0.0%) |
| Total | 1 (1.3%) | 4 (14.3%) |
Race in Birchwood
The most populous races in Birchwood are White / Caucasian (416 | 95.9%), Two or more Races (16 | 3.7%), and Hispanic or Latino (4 | 0.9%).
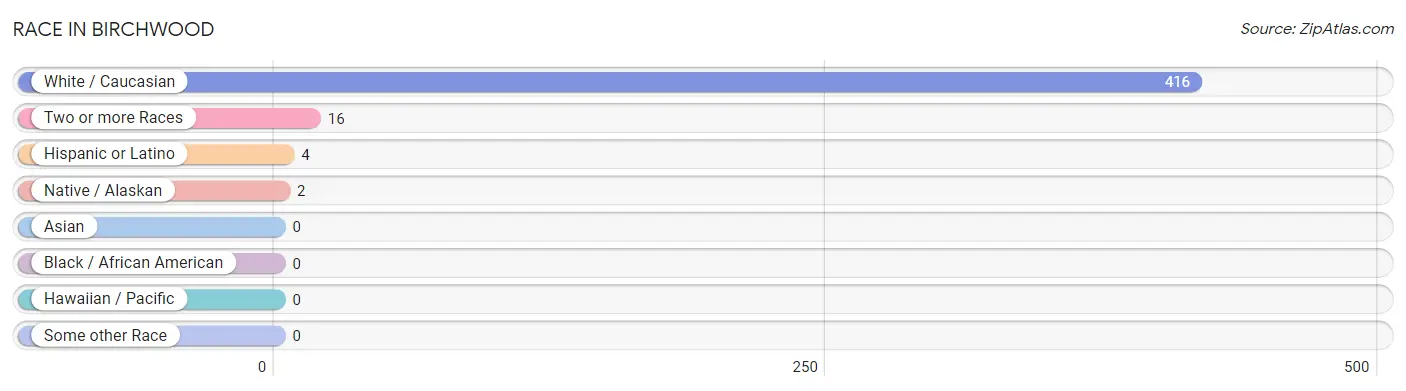
| Race | # Population | % Population |
| Asian | 0 | 0.0% |
| Black / African American | 0 | 0.0% |
| Hawaiian / Pacific | 0 | 0.0% |
| Hispanic or Latino | 4 | 0.9% |
| Native / Alaskan | 2 | 0.5% |
| White / Caucasian | 416 | 95.9% |
| Two or more Races | 16 | 3.7% |
| Some other Race | 0 | 0.0% |
| Total | 434 | 100.0% |
Ancestry in Birchwood
The most populous ancestries reported in Birchwood are German (220 | 50.7%), Irish (122 | 28.1%), French (69 | 15.9%), Norwegian (25 | 5.8%), and Scandinavian (22 | 5.1%), together accounting for 105.5% of all Birchwood residents.
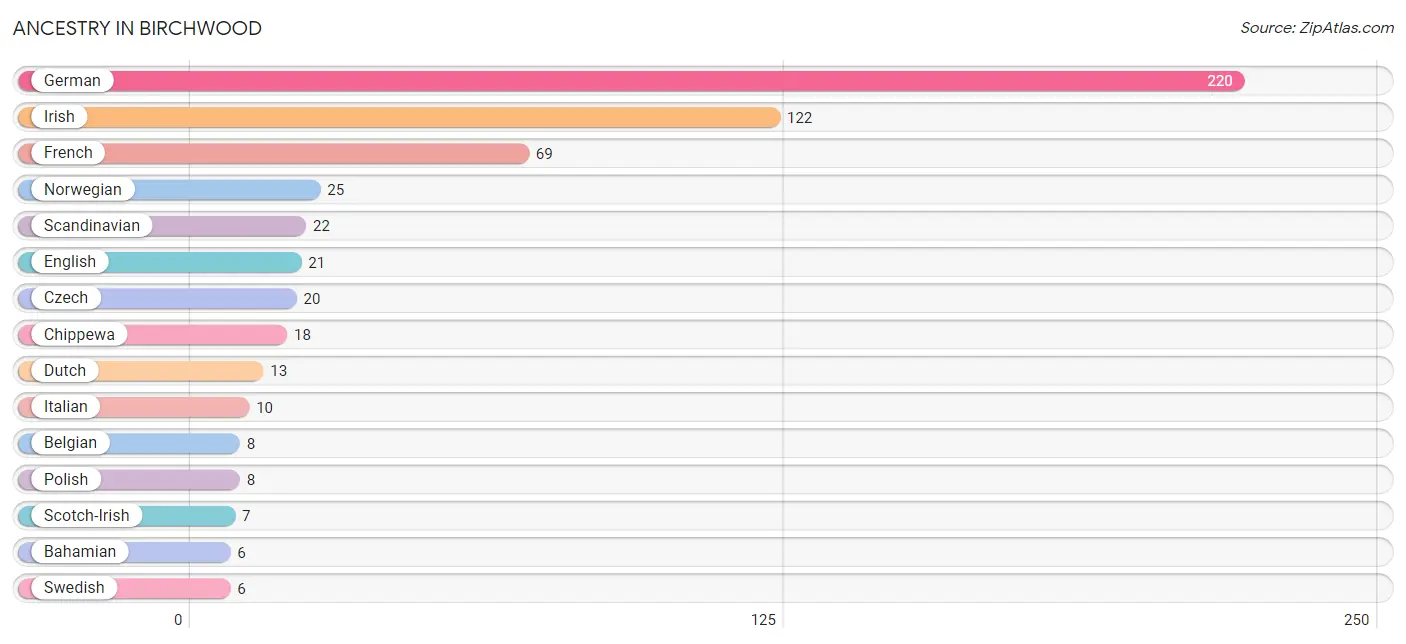
| Ancestry | # Population | % Population |
| American | 5 | 1.1% |
| Bahamian | 6 | 1.4% |
| Belgian | 8 | 1.8% |
| Canadian | 1 | 0.2% |
| Chippewa | 18 | 4.2% |
| Czech | 20 | 4.6% |
| Czechoslovakian | 1 | 0.2% |
| Dutch | 13 | 3.0% |
| English | 21 | 4.8% |
| Finnish | 2 | 0.5% |
| French | 69 | 15.9% |
| German | 220 | 50.7% |
| Irish | 122 | 28.1% |
| Italian | 10 | 2.3% |
| Mexican | 4 | 0.9% |
| Norwegian | 25 | 5.8% |
| Polish | 8 | 1.8% |
| Scandinavian | 22 | 5.1% |
| Scotch-Irish | 7 | 1.6% |
| Scottish | 3 | 0.7% |
| Slovak | 1 | 0.2% |
| Swedish | 6 | 1.4% |
| Welsh | 2 | 0.5% | View All 23 Rows |
Immigrants in Birchwood

| Immigration Origin | # Population | % Population | View All 0 Rows |
Sex and Age in Birchwood
Sex and Age in Birchwood
The most populous age groups in Birchwood are 15 to 19 Years (35 | 15.0%) for men and 15 to 19 Years (35 | 17.5%) for women.
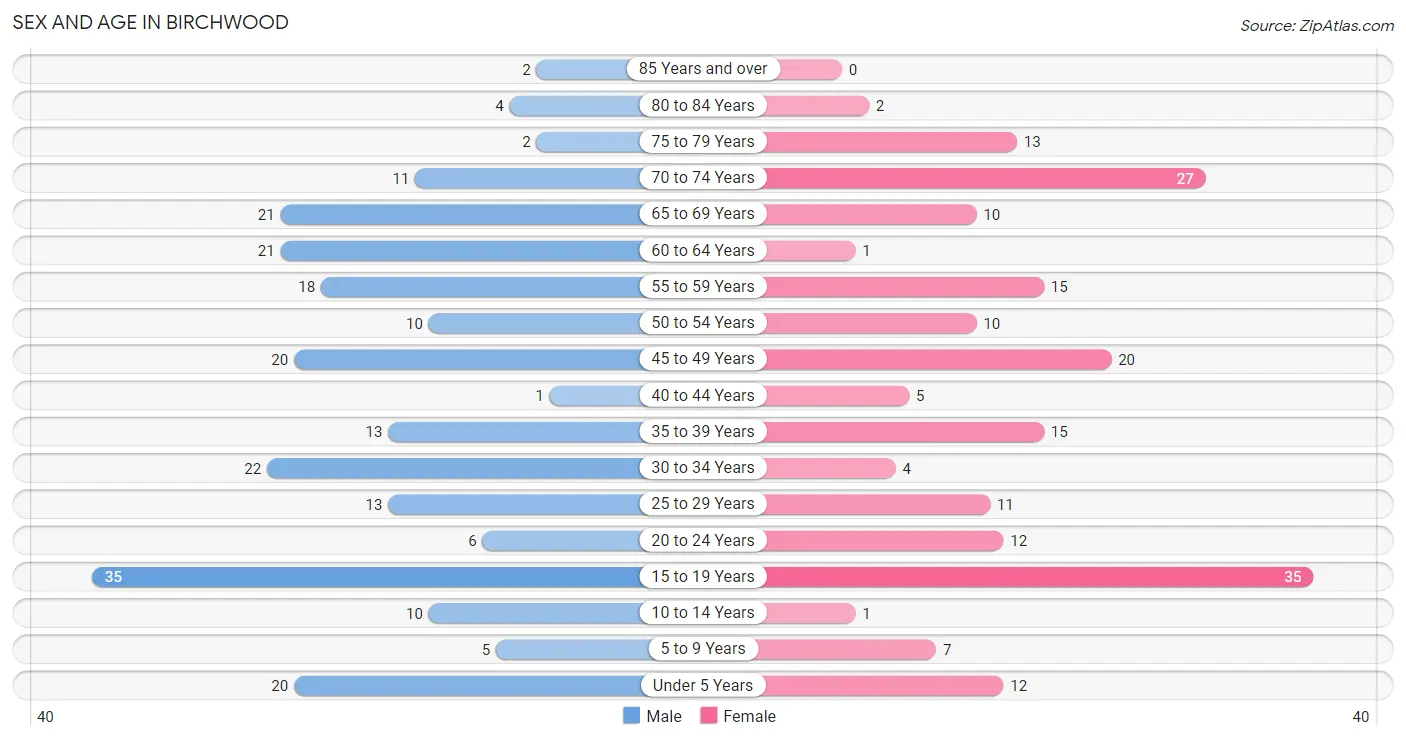
| Age Bracket | Male | Female |
| Under 5 Years | 20 (8.6%) | 12 (6.0%) |
| 5 to 9 Years | 5 (2.1%) | 7 (3.5%) |
| 10 to 14 Years | 10 (4.3%) | 1 (0.5%) |
| 15 to 19 Years | 35 (15.0%) | 35 (17.5%) |
| 20 to 24 Years | 6 (2.6%) | 12 (6.0%) |
| 25 to 29 Years | 13 (5.6%) | 11 (5.5%) |
| 30 to 34 Years | 22 (9.4%) | 4 (2.0%) |
| 35 to 39 Years | 13 (5.6%) | 15 (7.5%) |
| 40 to 44 Years | 1 (0.4%) | 5 (2.5%) |
| 45 to 49 Years | 20 (8.6%) | 20 (10.0%) |
| 50 to 54 Years | 10 (4.3%) | 10 (5.0%) |
| 55 to 59 Years | 18 (7.7%) | 15 (7.5%) |
| 60 to 64 Years | 21 (9.0%) | 1 (0.5%) |
| 65 to 69 Years | 21 (9.0%) | 10 (5.0%) |
| 70 to 74 Years | 11 (4.7%) | 27 (13.5%) |
| 75 to 79 Years | 2 (0.9%) | 13 (6.5%) |
| 80 to 84 Years | 4 (1.7%) | 2 (1.0%) |
| 85 Years and over | 2 (0.9%) | 0 (0.0%) |
| Total | 234 (100.0%) | 200 (100.0%) |
Families and Households in Birchwood
Median Family Size in Birchwood
The median family size in Birchwood is 3.58 persons per family, with single female/mother families (20 | 19.2%) accounting for the largest median family size of 4.8 persons per family. On the other hand, married-couple families (76 | 73.1%) represent the smallest median family size with 3.25 persons per family.
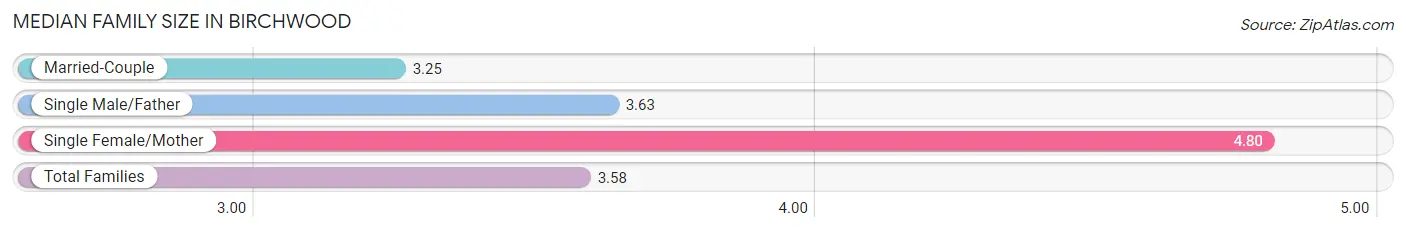
| Family Type | # Families | Family Size |
| Married-Couple | 76 (73.1%) | 3.25 |
| Single Male/Father | 8 (7.7%) | 3.63 |
| Single Female/Mother | 20 (19.2%) | 4.80 |
| Total Families | 104 (100.0%) | 3.58 |
Median Household Size in Birchwood
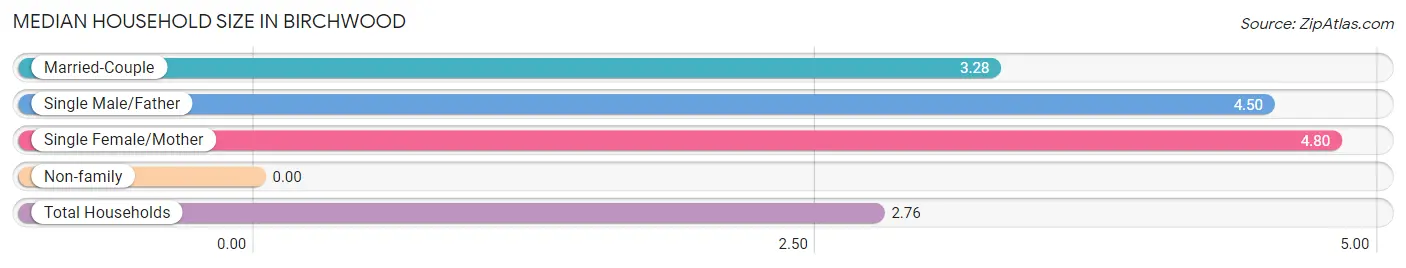
| Household Type | # Households | Household Size |
| Married-Couple | 76 (48.4%) | 3.28 |
| Single Male/Father | 8 (5.1%) | 4.50 |
| Single Female/Mother | 20 (12.7%) | 4.80 |
| Non-family | 53 (33.8%) | - |
| Total Households | 157 (100.0%) | 2.76 |
Household Size by Marriage Status in Birchwood
Out of a total of 157 households in Birchwood, 104 (66.2%) are family households, while 53 (33.8%) are nonfamily households. The most numerous type of family households are 4-person households, comprising 39, and the most common type of nonfamily households are 1-person households, comprising 53.
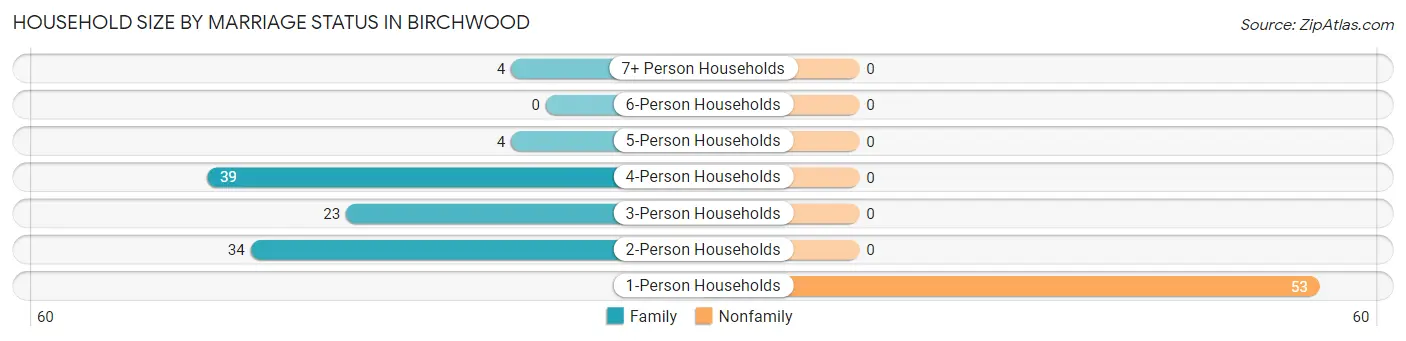
| Household Size | Family Households | Nonfamily Households |
| 1-Person Households | - | 53 (33.8%) |
| 2-Person Households | 34 (21.7%) | 0 (0.0%) |
| 3-Person Households | 23 (14.6%) | 0 (0.0%) |
| 4-Person Households | 39 (24.8%) | 0 (0.0%) |
| 5-Person Households | 4 (2.5%) | 0 (0.0%) |
| 6-Person Households | 0 (0.0%) | 0 (0.0%) |
| 7+ Person Households | 4 (2.5%) | 0 (0.0%) |
| Total | 104 (66.2%) | 53 (33.8%) |
Female Fertility in Birchwood
Fertility by Age in Birchwood
Average fertility rate in Birchwood is 101.0 births per 1,000 women. Women in the age bracket of 20 to 34 years have the highest fertility rate with 407.0 births per 1,000 women. Women in the age bracket of 20 to 34 years acount for 100.0% of all women with births.
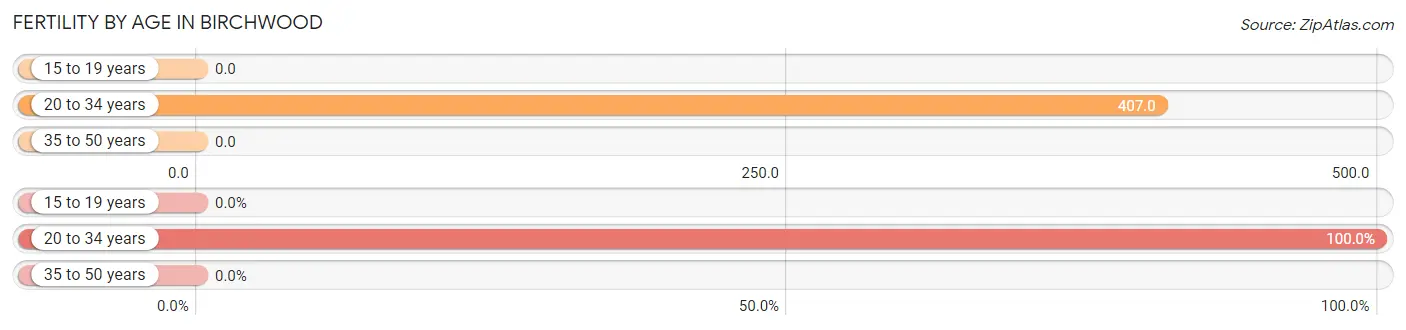
| Age Bracket | Women with Births | Births / 1,000 Women |
| 15 to 19 years | 0 (0.0%) | 0.0 |
| 20 to 34 years | 11 (100.0%) | 407.0 |
| 35 to 50 years | 0 (0.0%) | 0.0 |
| Total | 11 (100.0%) | 101.0 |
Fertility by Age by Marriage Status in Birchwood
81.8% of women with births (11) in Birchwood are married. The highest percentage of unmarried women with births falls into 20 to 34 years age bracket with 18.2% of them unmarried at the time of birth, while the lowest percentage of unmarried women with births belong to 20 to 34 years age bracket with 18.2% of them unmarried.
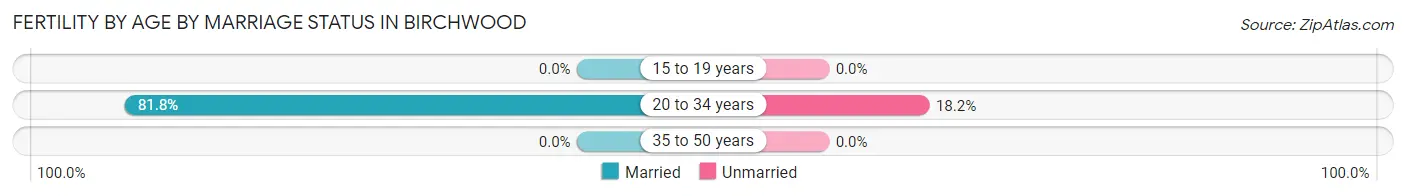
| Age Bracket | Married | Unmarried |
| 15 to 19 years | 0 (0.0%) | 0 (0.0%) |
| 20 to 34 years | 9 (81.8%) | 2 (18.2%) |
| 35 to 50 years | 0 (0.0%) | 0 (0.0%) |
| Total | 9 (81.8%) | 2 (18.2%) |
Fertility by Education in Birchwood
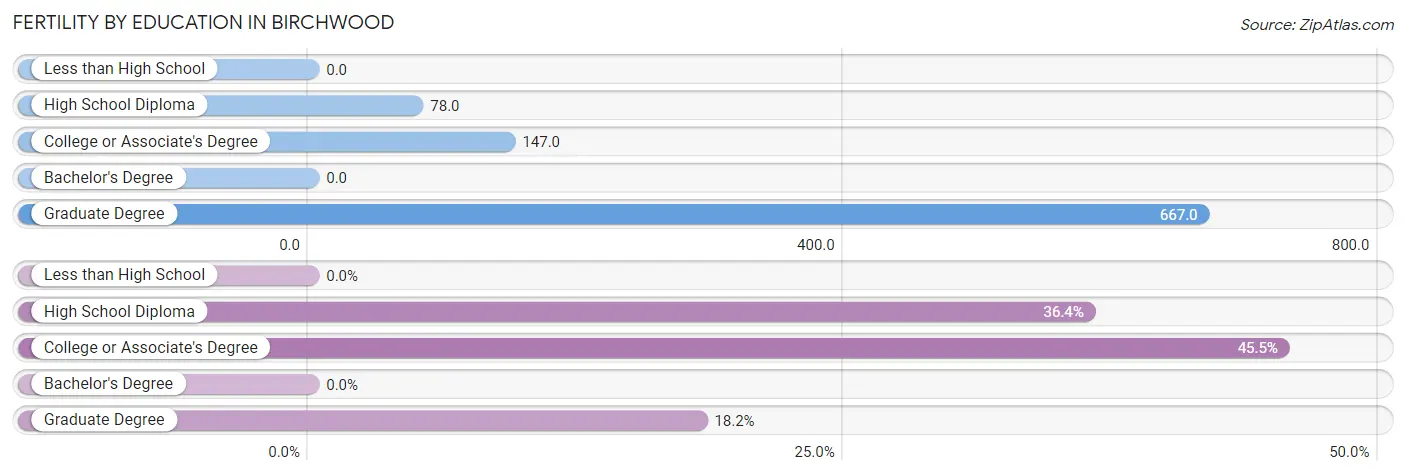
| Educational Attainment | Women with Births | Births / 1,000 Women |
| Less than High School | 0 (0.0%) | 0.0 |
| High School Diploma | 4 (36.4%) | 78.0 |
| College or Associate's Degree | 5 (45.5%) | 147.0 |
| Bachelor's Degree | 0 (0.0%) | 0.0 |
| Graduate Degree | 2 (18.2%) | 667.0 |
| Total | 11 (100.0%) | 101.0 |
Fertility by Education by Marriage Status in Birchwood
18.2% of women with births in Birchwood are unmarried. Women with the educational attainment of college or associate's degree are most likely to be married with 100.0% of them married at childbirth, while women with the educational attainment of high school diploma are least likely to be married with 50.0% of them unmarried at childbirth.
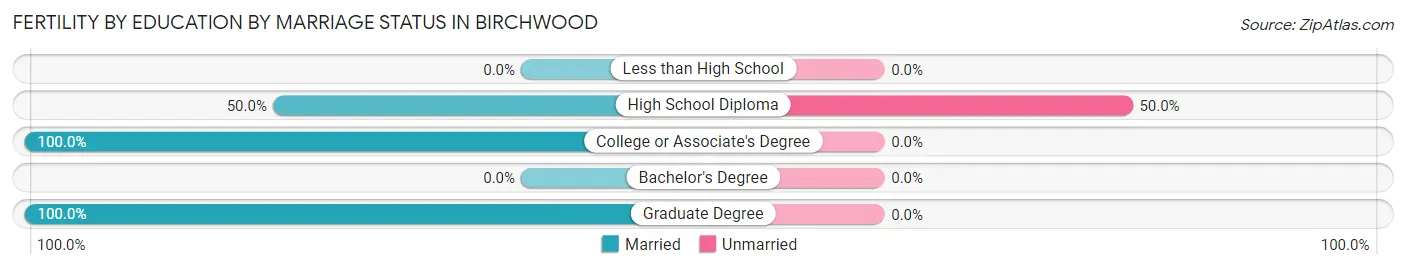
| Educational Attainment | Married | Unmarried |
| Less than High School | 0 (0.0%) | 0 (0.0%) |
| High School Diploma | 2 (50.0%) | 2 (50.0%) |
| College or Associate's Degree | 5 (100.0%) | 0 (0.0%) |
| Bachelor's Degree | 0 (0.0%) | 0 (0.0%) |
| Graduate Degree | 2 (100.0%) | 0 (0.0%) |
| Total | 9 (81.8%) | 2 (18.2%) |
Employment Characteristics in Birchwood
Employment by Class of Employer in Birchwood
Among the 241 employed individuals in Birchwood, private company employees (210 | 87.1%), self-employed (not incorporated) (12 | 5.0%), and not-for-profit organizations (9 | 3.7%) make up the most common classes of employment.
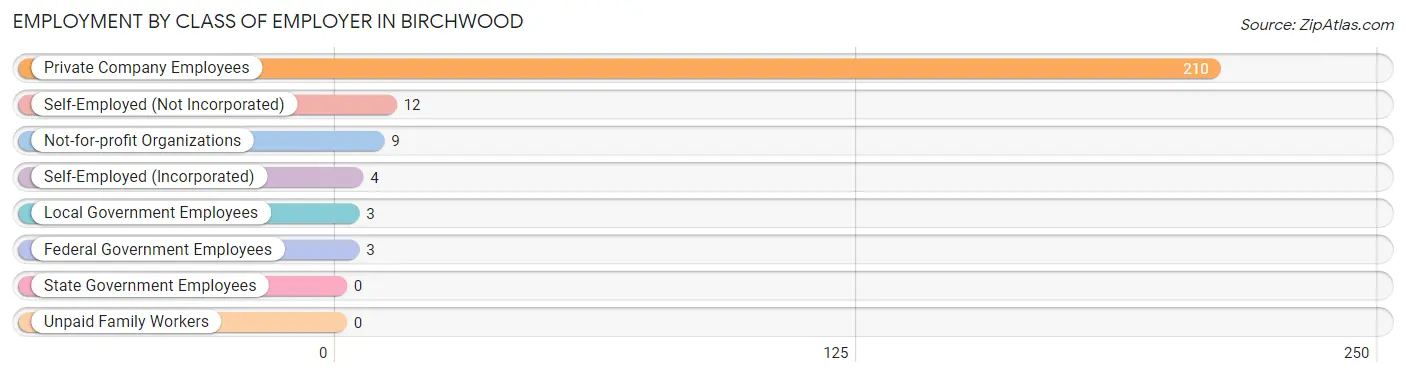
| Employer Class | # Employees | % Employees |
| Private Company Employees | 210 | 87.1% |
| Self-Employed (Incorporated) | 4 | 1.7% |
| Self-Employed (Not Incorporated) | 12 | 5.0% |
| Not-for-profit Organizations | 9 | 3.7% |
| Local Government Employees | 3 | 1.2% |
| State Government Employees | 0 | 0.0% |
| Federal Government Employees | 3 | 1.2% |
| Unpaid Family Workers | 0 | 0.0% |
| Total | 241 | 100.0% |
Employment Status by Age in Birchwood
According to the labor force statistics for Birchwood, out of the total population over 16 years of age (374), 66.3% or 248 individuals are in the labor force, with 2.0% or 5 of them unemployed. The age group with the highest labor force participation rate is 30 to 34 years, with 100.0% or 26 individuals in the labor force. Within the labor force, the 35 to 44 years age range has the highest percentage of unemployed individuals, with 16.1% or 5 of them being unemployed.
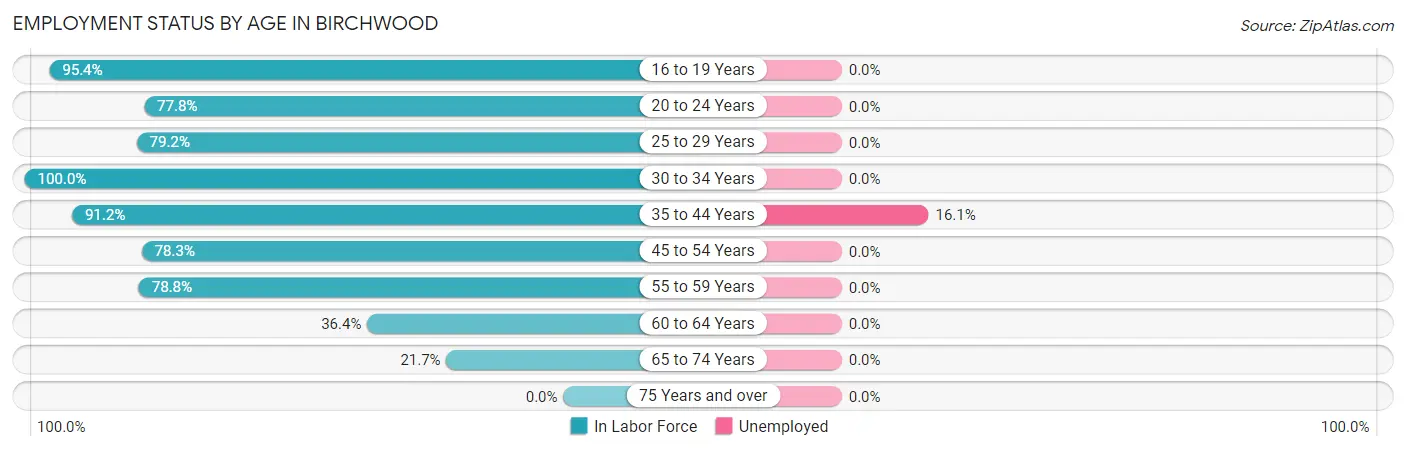
| Age Bracket | In Labor Force | Unemployed |
| 16 to 19 Years | 62 (95.4%) | 0 (0.0%) |
| 20 to 24 Years | 14 (77.8%) | 0 (0.0%) |
| 25 to 29 Years | 19 (79.2%) | 0 (0.0%) |
| 30 to 34 Years | 26 (100.0%) | 0 (0.0%) |
| 35 to 44 Years | 31 (91.2%) | 5 (16.1%) |
| 45 to 54 Years | 47 (78.3%) | 0 (0.0%) |
| 55 to 59 Years | 26 (78.8%) | 0 (0.0%) |
| 60 to 64 Years | 8 (36.4%) | 0 (0.0%) |
| 65 to 74 Years | 15 (21.7%) | 0 (0.0%) |
| 75 Years and over | 0 (0.0%) | 0 (0.0%) |
| Total | 248 (66.3%) | 5 (2.0%) |
Employment Status by Educational Attainment in Birchwood
According to labor force statistics for Birchwood, 78.9% of individuals (157) out of the total population between 25 and 64 years of age (199) are in the labor force, with 3.2% or 5 of them being unemployed. The group with the highest labor force participation rate are those with the educational attainment of bachelor's degree or higher, with 100.0% or 20 individuals in the labor force. Within the labor force, individuals with high school diploma education have the highest percentage of unemployment, with 7.0% or 5 of them being unemployed.
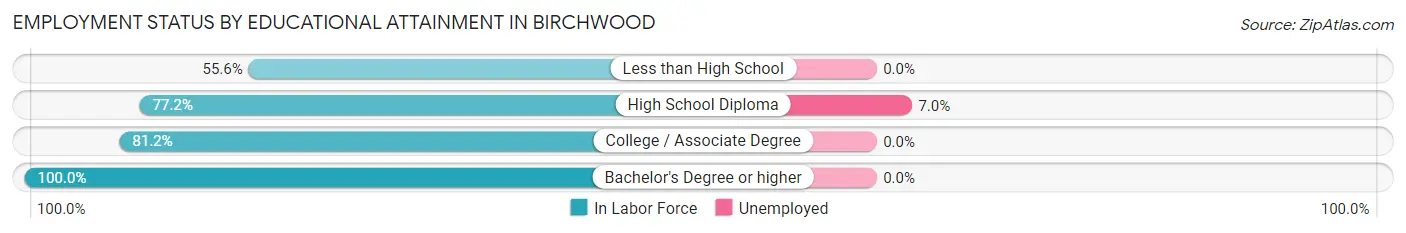
| Educational Attainment | In Labor Force | Unemployed |
| Less than High School | 10 (55.6%) | 0 (0.0%) |
| High School Diploma | 71 (77.2%) | 6 (7.0%) |
| College / Associate Degree | 56 (81.2%) | 0 (0.0%) |
| Bachelor's Degree or higher | 20 (100.0%) | 0 (0.0%) |
| Total | 157 (78.9%) | 6 (3.2%) |
Employment Occupations by Sex in Birchwood
Management, Business, Science and Arts Occupations
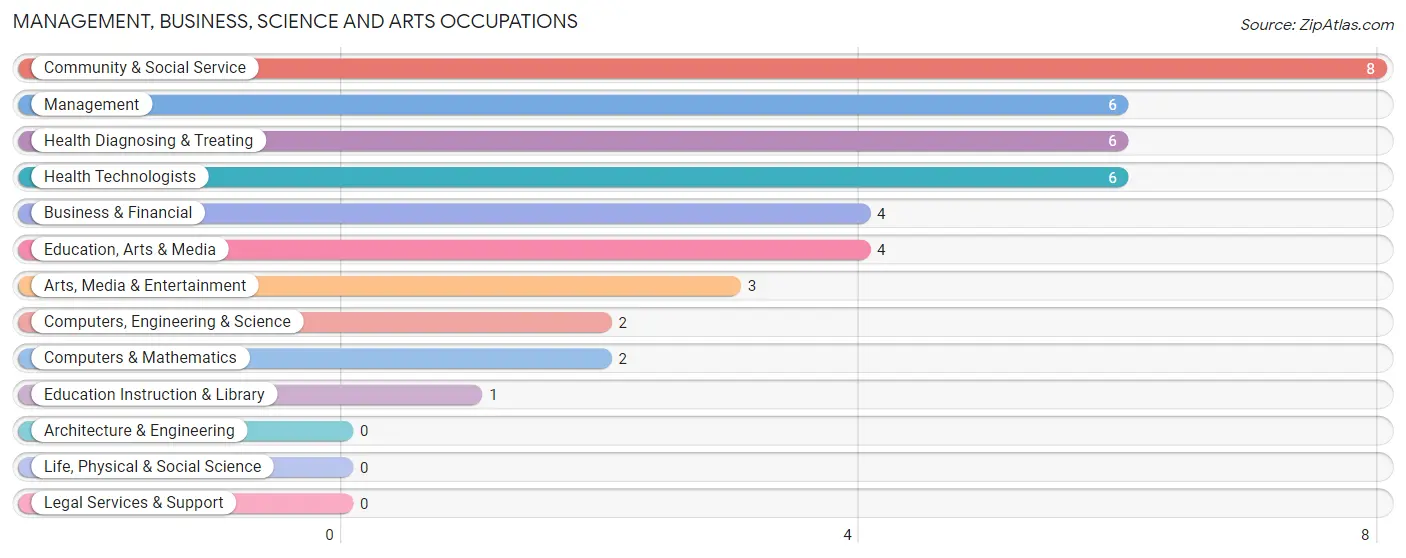
The most common Management, Business, Science and Arts occupations in Birchwood are Community & Social Service (8 | 3.3%), Management (6 | 2.5%), Health Diagnosing & Treating (6 | 2.5%), Health Technologists (6 | 2.5%), and Business & Financial (4 | 1.7%).
Management, Business, Science and Arts Occupations by Sex
Within the Management, Business, Science and Arts occupations in Birchwood, the most male-oriented occupations are Management (100.0%), Computers, Engineering & Science (100.0%), and Computers & Mathematics (100.0%), while the most female-oriented occupations are Business & Financial (100.0%), Community & Social Service (100.0%), and Education, Arts & Media (100.0%).
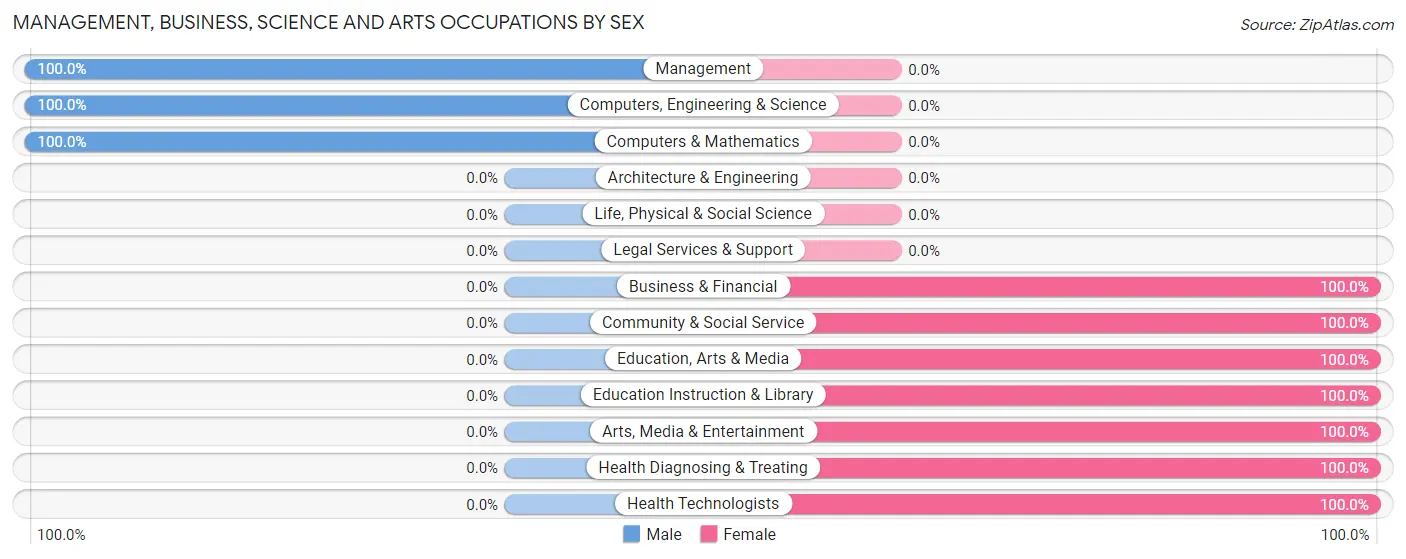
| Occupation | Male | Female |
| Management | 6 (100.0%) | 0 (0.0%) |
| Business & Financial | 0 (0.0%) | 4 (100.0%) |
| Computers, Engineering & Science | 2 (100.0%) | 0 (0.0%) |
| Computers & Mathematics | 2 (100.0%) | 0 (0.0%) |
| Architecture & Engineering | 0 (0.0%) | 0 (0.0%) |
| Life, Physical & Social Science | 0 (0.0%) | 0 (0.0%) |
| Community & Social Service | 0 (0.0%) | 8 (100.0%) |
| Education, Arts & Media | 0 (0.0%) | 4 (100.0%) |
| Legal Services & Support | 0 (0.0%) | 0 (0.0%) |
| Education Instruction & Library | 0 (0.0%) | 1 (100.0%) |
| Arts, Media & Entertainment | 0 (0.0%) | 3 (100.0%) |
| Health Diagnosing & Treating | 0 (0.0%) | 6 (100.0%) |
| Health Technologists | 0 (0.0%) | 6 (100.0%) |
| Total (Category) | 8 (30.8%) | 18 (69.2%) |
| Total (Overall) | 132 (54.3%) | 111 (45.7%) |
Services Occupations
The most common Services occupations in Birchwood are Healthcare Support (9 | 3.7%), Cleaning & Maintenance (8 | 3.3%), Food Preparation & Serving (5 | 2.1%), and Personal Care & Service (2 | 0.8%).

Services Occupations by Sex
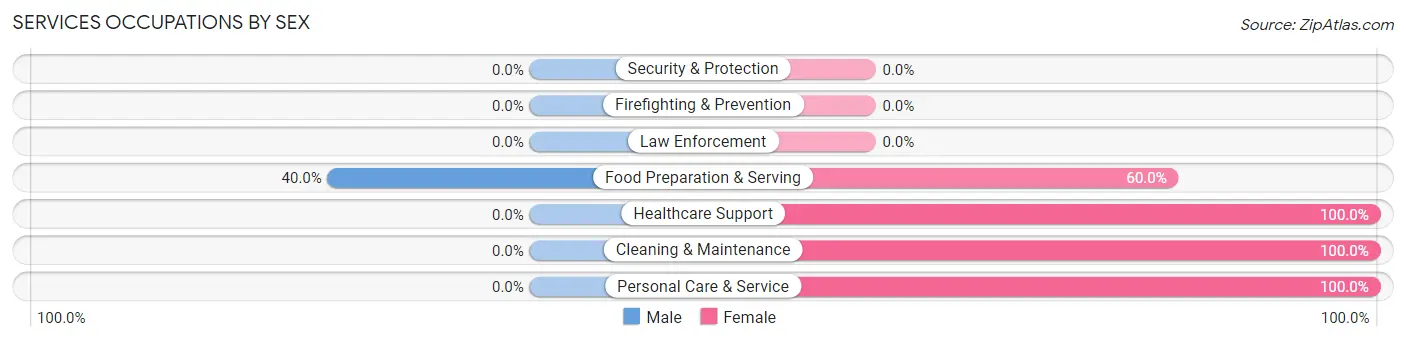
| Occupation | Male | Female |
| Healthcare Support | 0 (0.0%) | 9 (100.0%) |
| Security & Protection | 0 (0.0%) | 0 (0.0%) |
| Firefighting & Prevention | 0 (0.0%) | 0 (0.0%) |
| Law Enforcement | 0 (0.0%) | 0 (0.0%) |
| Food Preparation & Serving | 2 (40.0%) | 3 (60.0%) |
| Cleaning & Maintenance | 0 (0.0%) | 8 (100.0%) |
| Personal Care & Service | 0 (0.0%) | 2 (100.0%) |
| Total (Category) | 2 (8.3%) | 22 (91.7%) |
| Total (Overall) | 132 (54.3%) | 111 (45.7%) |
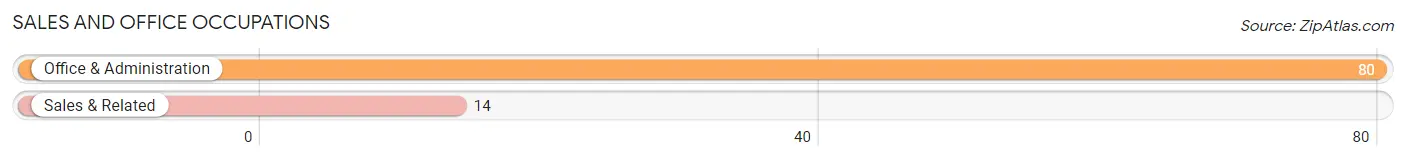
Sales and Office Occupations
The most common Sales and Office occupations in Birchwood are Office & Administration (80 | 32.9%), and Sales & Related (14 | 5.8%).
Sales and Office Occupations by Sex
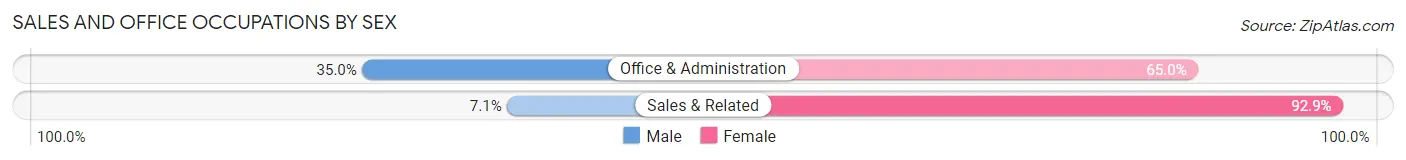
| Occupation | Male | Female |
| Sales & Related | 1 (7.1%) | 13 (92.9%) |
| Office & Administration | 28 (35.0%) | 52 (65.0%) |
| Total (Category) | 29 (30.8%) | 65 (69.2%) |
| Total (Overall) | 132 (54.3%) | 111 (45.7%) |
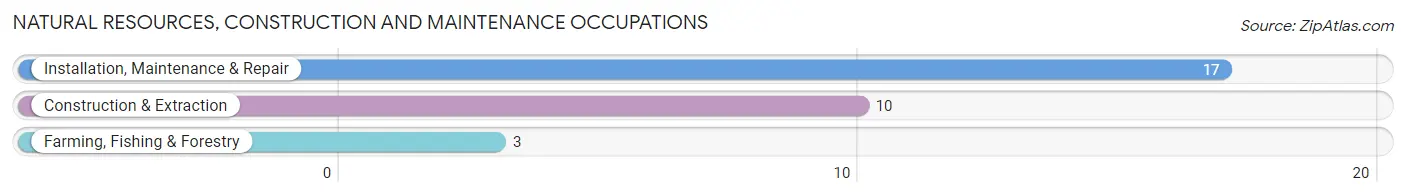
Natural Resources, Construction and Maintenance Occupations
The most common Natural Resources, Construction and Maintenance occupations in Birchwood are Installation, Maintenance & Repair (17 | 7.0%), Construction & Extraction (10 | 4.1%), and Farming, Fishing & Forestry (3 | 1.2%).
Natural Resources, Construction and Maintenance Occupations by Sex
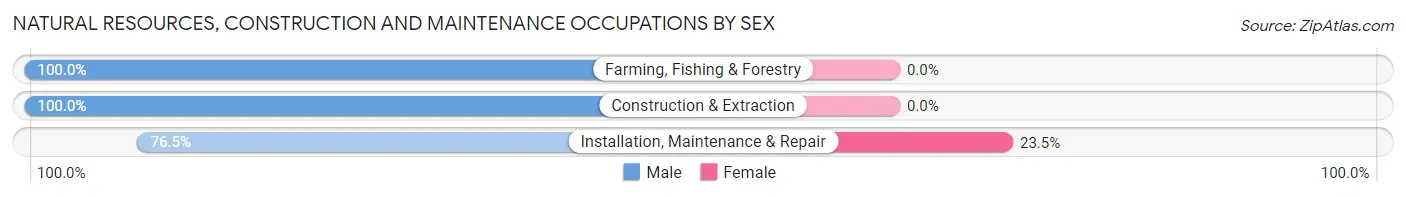
| Occupation | Male | Female |
| Farming, Fishing & Forestry | 3 (100.0%) | 0 (0.0%) |
| Construction & Extraction | 10 (100.0%) | 0 (0.0%) |
| Installation, Maintenance & Repair | 13 (76.5%) | 4 (23.5%) |
| Total (Category) | 26 (86.7%) | 4 (13.3%) |
| Total (Overall) | 132 (54.3%) | 111 (45.7%) |
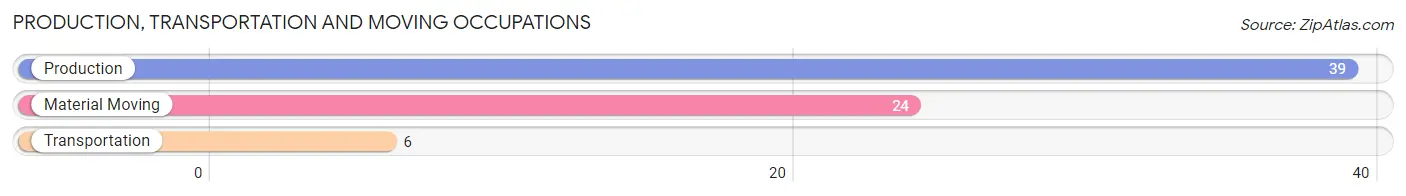
Production, Transportation and Moving Occupations
The most common Production, Transportation and Moving occupations in Birchwood are Production (39 | 16.1%), Material Moving (24 | 9.9%), and Transportation (6 | 2.5%).
Production, Transportation and Moving Occupations by Sex
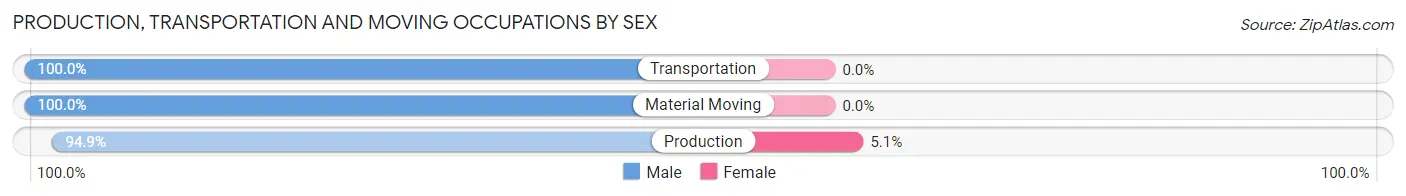
| Occupation | Male | Female |
| Production | 37 (94.9%) | 2 (5.1%) |
| Transportation | 6 (100.0%) | 0 (0.0%) |
| Material Moving | 24 (100.0%) | 0 (0.0%) |
| Total (Category) | 67 (97.1%) | 2 (2.9%) |
| Total (Overall) | 132 (54.3%) | 111 (45.7%) |
Employment Industries by Sex in Birchwood
Employment Industries in Birchwood
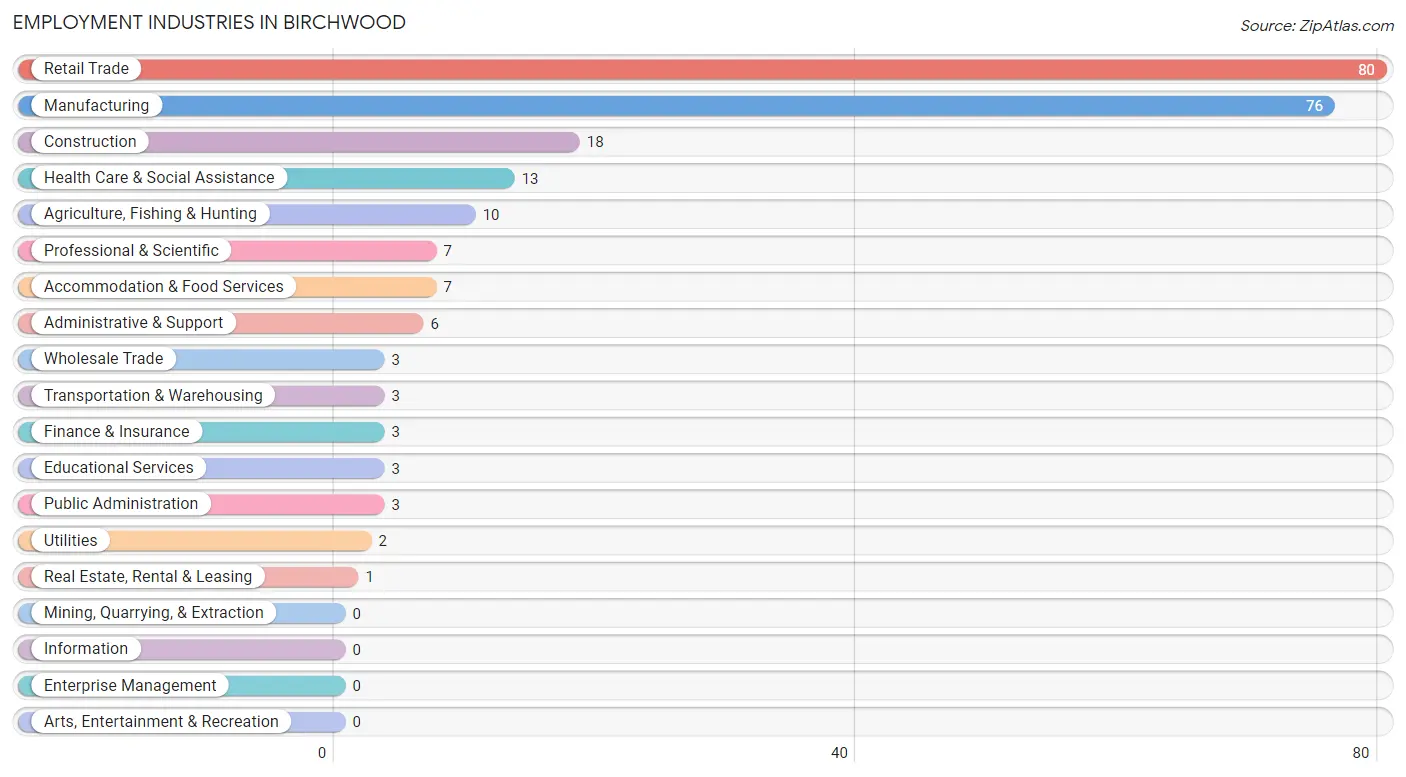
The major employment industries in Birchwood include Retail Trade (80 | 32.9%), Manufacturing (76 | 31.3%), Construction (18 | 7.4%), Health Care & Social Assistance (13 | 5.3%), and Agriculture, Fishing & Hunting (10 | 4.1%).
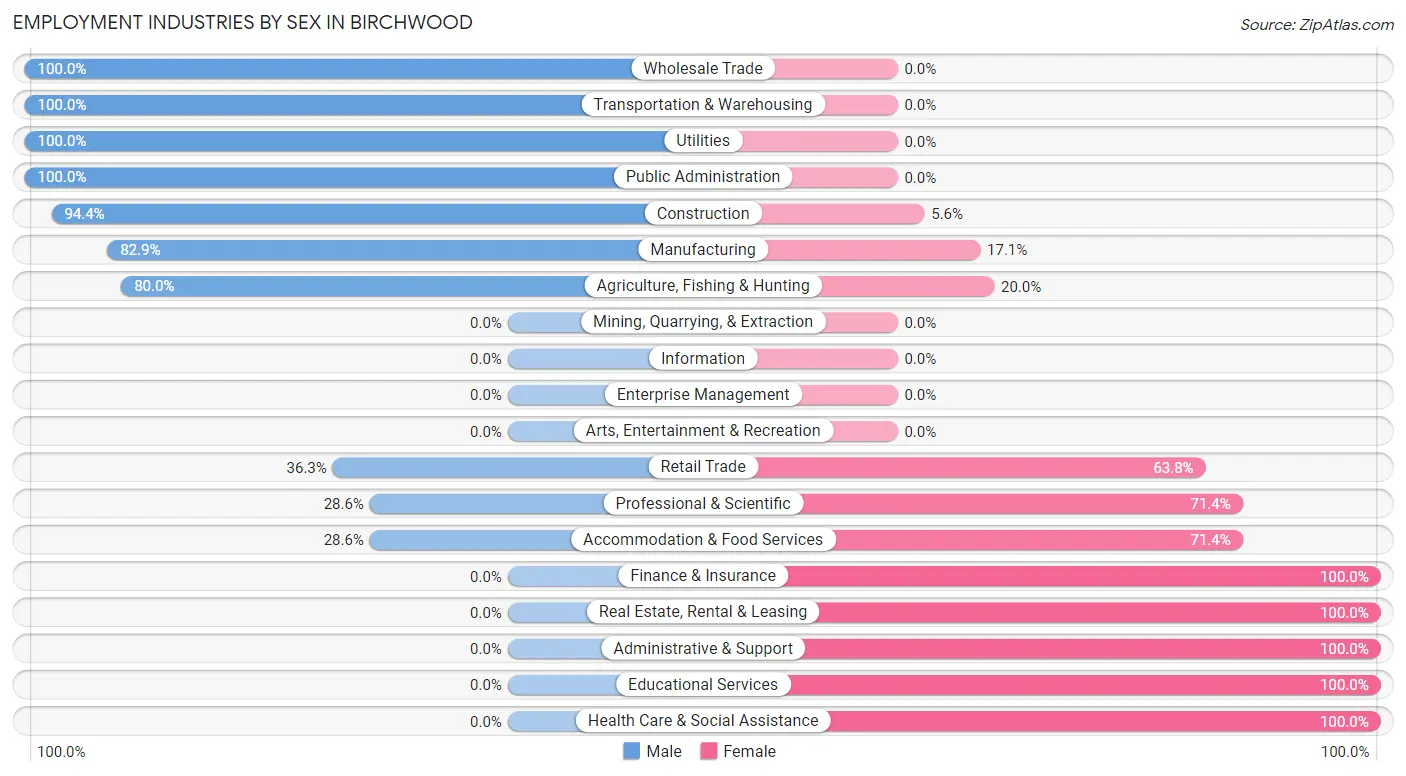
Employment Industries by Sex in Birchwood
The Birchwood industries that see more men than women are Wholesale Trade (100.0%), Transportation & Warehousing (100.0%), and Utilities (100.0%), whereas the industries that tend to have a higher number of women are Finance & Insurance (100.0%), Real Estate, Rental & Leasing (100.0%), and Administrative & Support (100.0%).
| Industry | Male | Female |
| Agriculture, Fishing & Hunting | 8 (80.0%) | 2 (20.0%) |
| Mining, Quarrying, & Extraction | 0 (0.0%) | 0 (0.0%) |
| Construction | 17 (94.4%) | 1 (5.6%) |
| Manufacturing | 63 (82.9%) | 13 (17.1%) |
| Wholesale Trade | 3 (100.0%) | 0 (0.0%) |
| Retail Trade | 29 (36.2%) | 51 (63.7%) |
| Transportation & Warehousing | 3 (100.0%) | 0 (0.0%) |
| Utilities | 2 (100.0%) | 0 (0.0%) |
| Information | 0 (0.0%) | 0 (0.0%) |
| Finance & Insurance | 0 (0.0%) | 3 (100.0%) |
| Real Estate, Rental & Leasing | 0 (0.0%) | 1 (100.0%) |
| Professional & Scientific | 2 (28.6%) | 5 (71.4%) |
| Enterprise Management | 0 (0.0%) | 0 (0.0%) |
| Administrative & Support | 0 (0.0%) | 6 (100.0%) |
| Educational Services | 0 (0.0%) | 3 (100.0%) |
| Health Care & Social Assistance | 0 (0.0%) | 13 (100.0%) |
| Arts, Entertainment & Recreation | 0 (0.0%) | 0 (0.0%) |
| Accommodation & Food Services | 2 (28.6%) | 5 (71.4%) |
| Public Administration | 3 (100.0%) | 0 (0.0%) |
| Total | 132 (54.3%) | 111 (45.7%) |
Education in Birchwood
School Enrollment in Birchwood
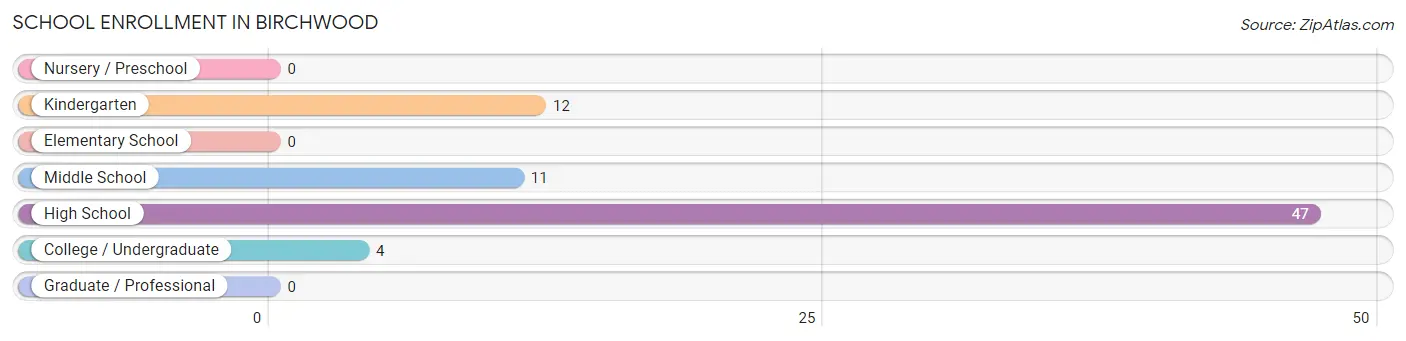
The most common levels of schooling among the 74 students in Birchwood are high school (47 | 63.5%), kindergarten (12 | 16.2%), and middle school (11 | 14.9%).
| School Level | # Students | % Students |
| Nursery / Preschool | 0 | 0.0% |
| Kindergarten | 12 | 16.2% |
| Elementary School | 0 | 0.0% |
| Middle School | 11 | 14.9% |
| High School | 47 | 63.5% |
| College / Undergraduate | 4 | 5.4% |
| Graduate / Professional | 0 | 0.0% |
| Total | 74 | 100.0% |
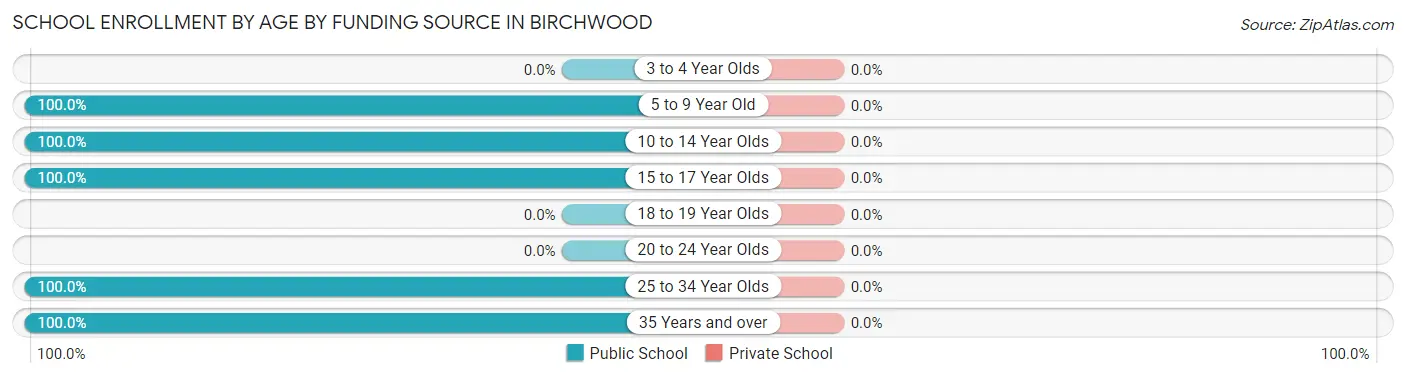
School Enrollment by Age by Funding Source in Birchwood
| Age Bracket | Public School | Private School |
| 3 to 4 Year Olds | 0 (0.0%) | 0 (0.0%) |
| 5 to 9 Year Old | 12 (100.0%) | 0 (0.0%) |
| 10 to 14 Year Olds | 11 (100.0%) | 0 (0.0%) |
| 15 to 17 Year Olds | 44 (100.0%) | 0 (0.0%) |
| 18 to 19 Year Olds | 0 (0.0%) | 0 (0.0%) |
| 20 to 24 Year Olds | 0 (0.0%) | 0 (0.0%) |
| 25 to 34 Year Olds | 3 (100.0%) | 0 (0.0%) |
| 35 Years and over | 4 (100.0%) | 0 (0.0%) |
| Total | 74 (100.0%) | 0 (0.0%) |
Educational Attainment by Field of Study in Birchwood
Psychology (6 | 19.4%), social sciences (5 | 16.1%), education (4 | 12.9%), bio, nature & agricultural (3 | 9.7%), and science & technology (3 | 9.7%) are the most common fields of study among 31 individuals in Birchwood who have obtained a bachelor's degree or higher.
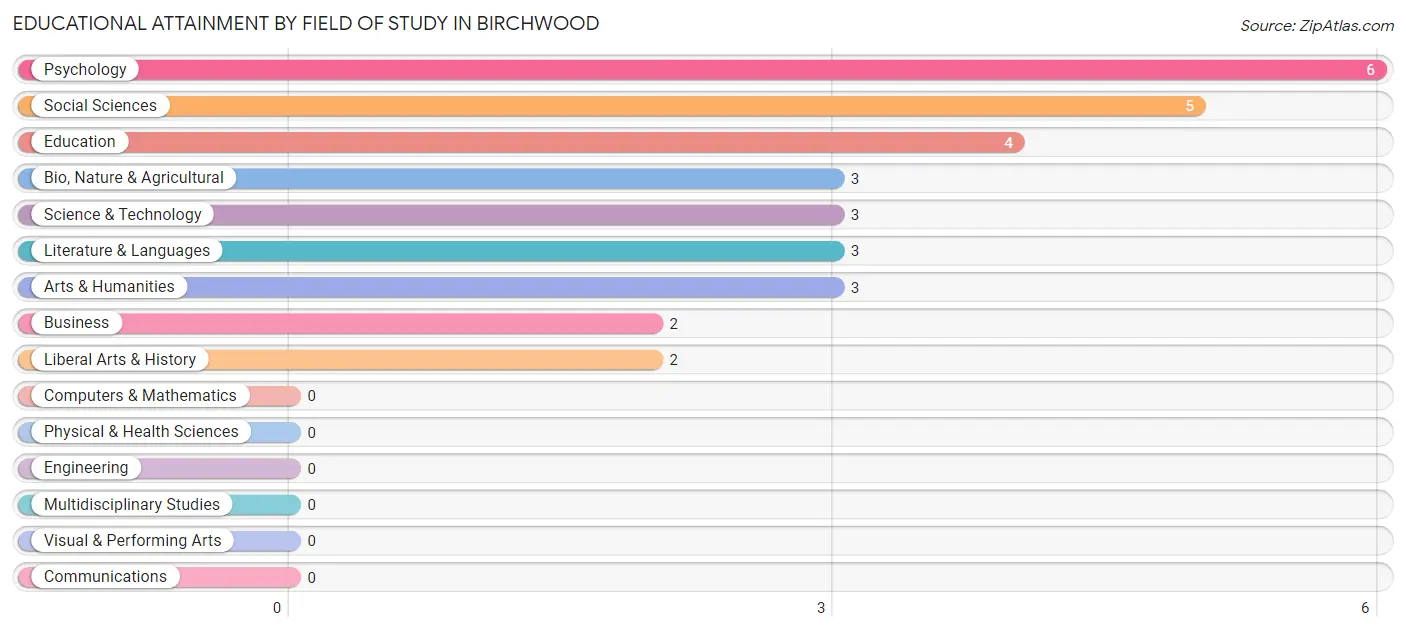
| Field of Study | # Graduates | % Graduates |
| Computers & Mathematics | 0 | 0.0% |
| Bio, Nature & Agricultural | 3 | 9.7% |
| Physical & Health Sciences | 0 | 0.0% |
| Psychology | 6 | 19.4% |
| Social Sciences | 5 | 16.1% |
| Engineering | 0 | 0.0% |
| Multidisciplinary Studies | 0 | 0.0% |
| Science & Technology | 3 | 9.7% |
| Business | 2 | 6.5% |
| Education | 4 | 12.9% |
| Literature & Languages | 3 | 9.7% |
| Liberal Arts & History | 2 | 6.5% |
| Visual & Performing Arts | 0 | 0.0% |
| Communications | 0 | 0.0% |
| Arts & Humanities | 3 | 9.7% |
| Total | 31 | 100.0% |
Transportation & Commute in Birchwood
Vehicle Availability by Sex in Birchwood
The most prevalent vehicle ownership categories in Birchwood are males with 4 vehicles (45, accounting for 34.6%) and females with 4 vehicles (41, making up 40.5%).
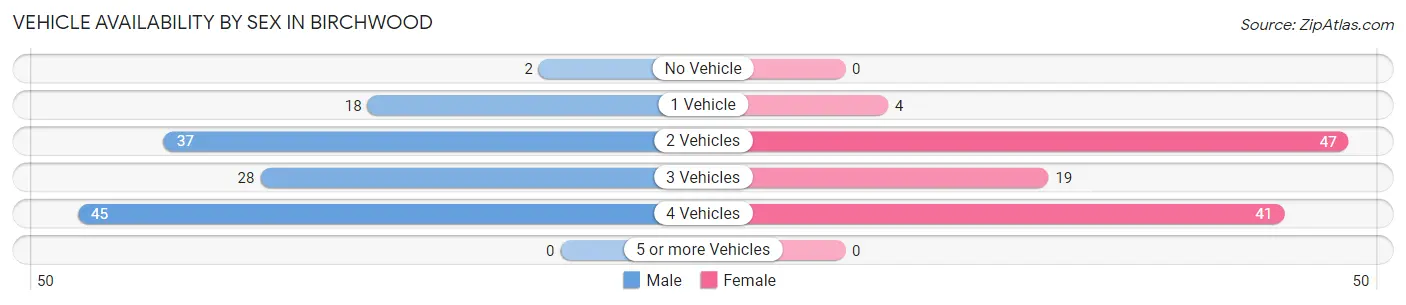
| Vehicles Available | Male | Female |
| No Vehicle | 2 (1.5%) | 0 (0.0%) |
| 1 Vehicle | 18 (13.9%) | 4 (3.6%) |
| 2 Vehicles | 37 (28.5%) | 47 (42.3%) |
| 3 Vehicles | 28 (21.5%) | 19 (17.1%) |
| 4 Vehicles | 45 (34.6%) | 41 (36.9%) |
| 5 or more Vehicles | 0 (0.0%) | 0 (0.0%) |
| Total | 130 (100.0%) | 111 (100.0%) |
Commute Time in Birchwood
The most frequently occuring commute durations in Birchwood are 5 to 9 minutes (61 commuters, 26.4%), less than 5 minutes (38 commuters, 16.5%), and 25 to 29 minutes (37 commuters, 16.0%).
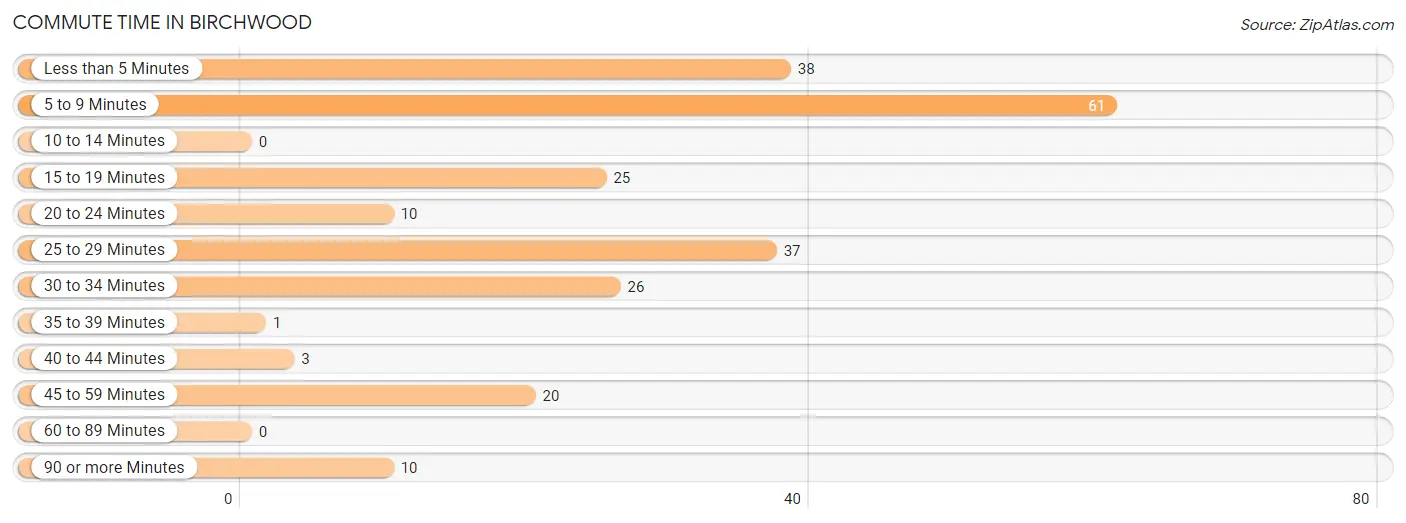
| Commute Time | # Commuters | % Commuters |
| Less than 5 Minutes | 38 | 16.5% |
| 5 to 9 Minutes | 61 | 26.4% |
| 10 to 14 Minutes | 0 | 0.0% |
| 15 to 19 Minutes | 25 | 10.8% |
| 20 to 24 Minutes | 10 | 4.3% |
| 25 to 29 Minutes | 37 | 16.0% |
| 30 to 34 Minutes | 26 | 11.3% |
| 35 to 39 Minutes | 1 | 0.4% |
| 40 to 44 Minutes | 3 | 1.3% |
| 45 to 59 Minutes | 20 | 8.7% |
| 60 to 89 Minutes | 0 | 0.0% |
| 90 or more Minutes | 10 | 4.3% |
Commute Time by Sex in Birchwood
The most common commute times in Birchwood are 5 to 9 minutes (36 commuters, 28.1%) for males and less than 5 minutes (36 commuters, 34.9%) for females.
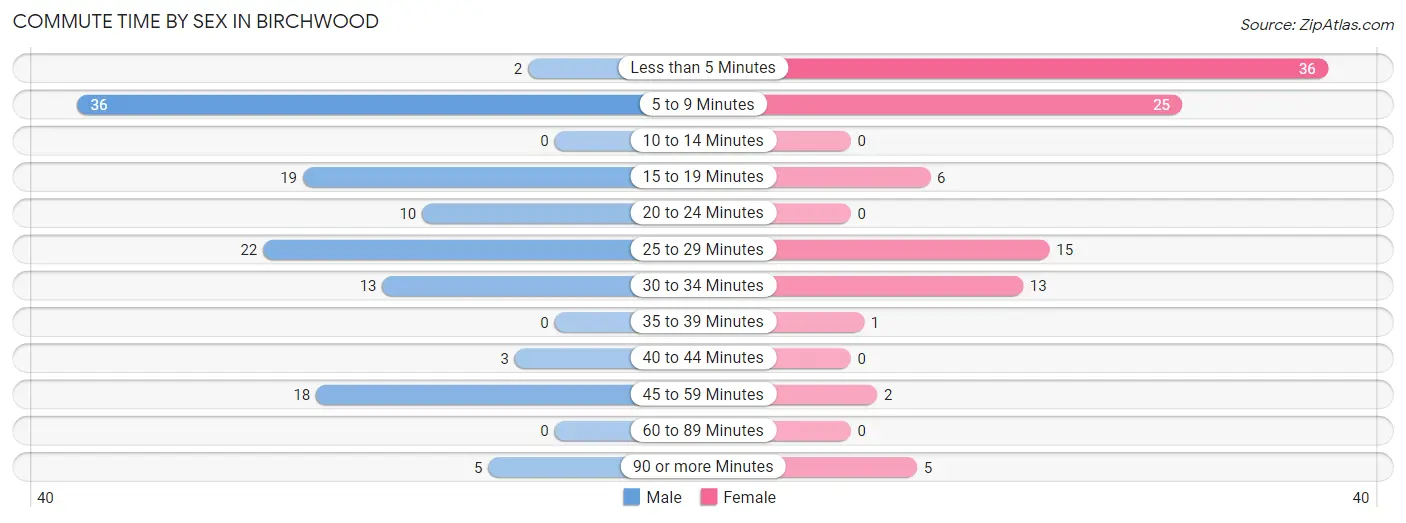
| Commute Time | Male | Female |
| Less than 5 Minutes | 2 (1.6%) | 36 (34.9%) |
| 5 to 9 Minutes | 36 (28.1%) | 25 (24.3%) |
| 10 to 14 Minutes | 0 (0.0%) | 0 (0.0%) |
| 15 to 19 Minutes | 19 (14.8%) | 6 (5.8%) |
| 20 to 24 Minutes | 10 (7.8%) | 0 (0.0%) |
| 25 to 29 Minutes | 22 (17.2%) | 15 (14.6%) |
| 30 to 34 Minutes | 13 (10.2%) | 13 (12.6%) |
| 35 to 39 Minutes | 0 (0.0%) | 1 (1.0%) |
| 40 to 44 Minutes | 3 (2.3%) | 0 (0.0%) |
| 45 to 59 Minutes | 18 (14.1%) | 2 (1.9%) |
| 60 to 89 Minutes | 0 (0.0%) | 0 (0.0%) |
| 90 or more Minutes | 5 (3.9%) | 5 (4.9%) |
Time of Departure to Work by Sex in Birchwood
The most frequent times of departure to work in Birchwood are 10:00 AM to 10:59 AM (27, 21.1%) for males and 5:30 AM to 5:59 AM (39, 37.9%) for females.
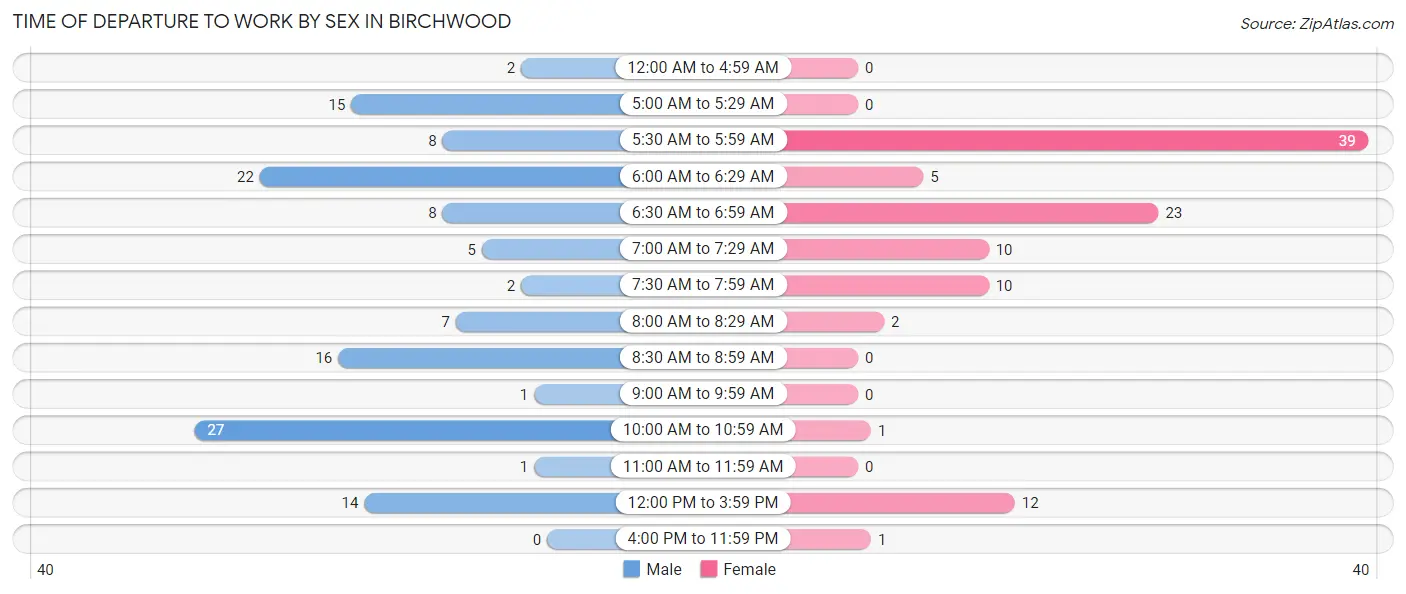
| Time of Departure | Male | Female |
| 12:00 AM to 4:59 AM | 2 (1.6%) | 0 (0.0%) |
| 5:00 AM to 5:29 AM | 15 (11.7%) | 0 (0.0%) |
| 5:30 AM to 5:59 AM | 8 (6.2%) | 39 (37.9%) |
| 6:00 AM to 6:29 AM | 22 (17.2%) | 5 (4.9%) |
| 6:30 AM to 6:59 AM | 8 (6.2%) | 23 (22.3%) |
| 7:00 AM to 7:29 AM | 5 (3.9%) | 10 (9.7%) |
| 7:30 AM to 7:59 AM | 2 (1.6%) | 10 (9.7%) |
| 8:00 AM to 8:29 AM | 7 (5.5%) | 2 (1.9%) |
| 8:30 AM to 8:59 AM | 16 (12.5%) | 0 (0.0%) |
| 9:00 AM to 9:59 AM | 1 (0.8%) | 0 (0.0%) |
| 10:00 AM to 10:59 AM | 27 (21.1%) | 1 (1.0%) |
| 11:00 AM to 11:59 AM | 1 (0.8%) | 0 (0.0%) |
| 12:00 PM to 3:59 PM | 14 (10.9%) | 12 (11.7%) |
| 4:00 PM to 11:59 PM | 0 (0.0%) | 1 (1.0%) |
| Total | 128 (100.0%) | 103 (100.0%) |
Housing Occupancy in Birchwood
Occupancy by Ownership in Birchwood
Of the total 157 dwellings in Birchwood, owner-occupied units account for 104 (66.2%), while renter-occupied units make up 53 (33.8%).
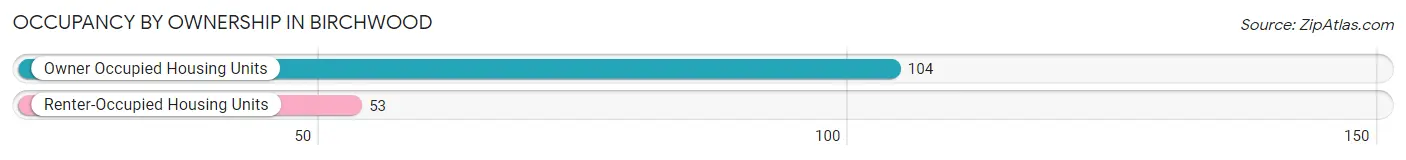
| Occupancy | # Housing Units | % Housing Units |
| Owner Occupied Housing Units | 104 | 66.2% |
| Renter-Occupied Housing Units | 53 | 33.8% |
| Total Occupied Housing Units | 157 | 100.0% |
Occupancy by Household Size in Birchwood
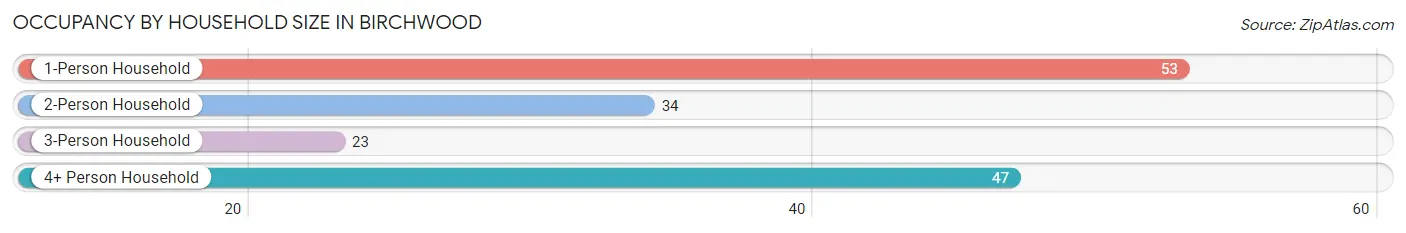
| Household Size | # Housing Units | % Housing Units |
| 1-Person Household | 53 | 33.8% |
| 2-Person Household | 34 | 21.7% |
| 3-Person Household | 23 | 14.6% |
| 4+ Person Household | 47 | 29.9% |
| Total Housing Units | 157 | 100.0% |
Occupancy by Ownership by Household Size in Birchwood
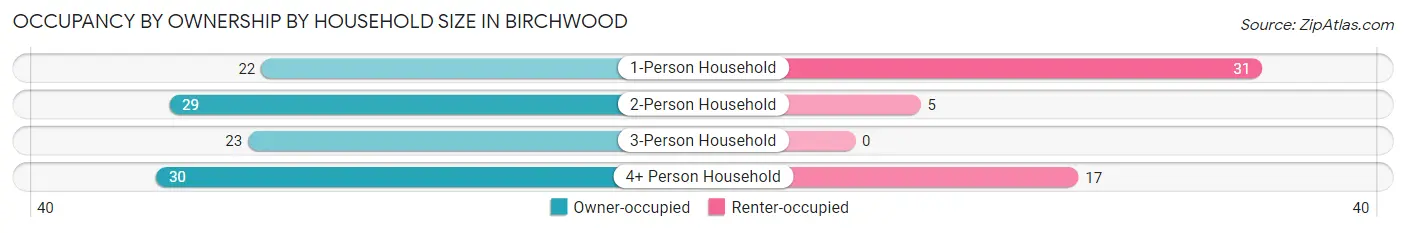
| Household Size | Owner-occupied | Renter-occupied |
| 1-Person Household | 22 (41.5%) | 31 (58.5%) |
| 2-Person Household | 29 (85.3%) | 5 (14.7%) |
| 3-Person Household | 23 (100.0%) | 0 (0.0%) |
| 4+ Person Household | 30 (63.8%) | 17 (36.2%) |
| Total Housing Units | 104 (66.2%) | 53 (33.8%) |
Occupancy by Educational Attainment in Birchwood
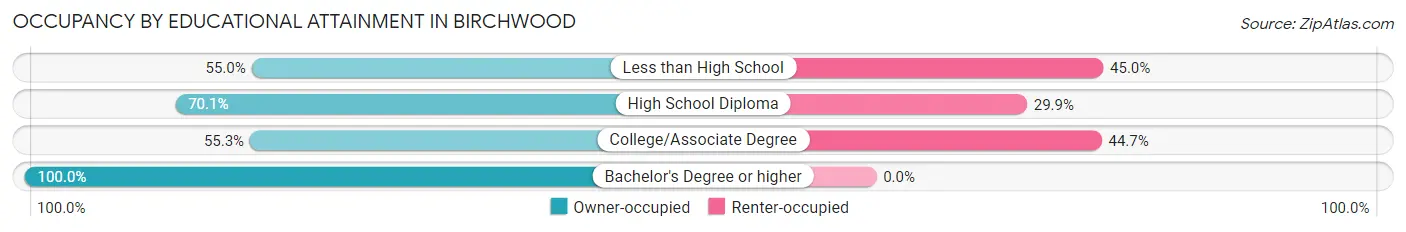
| Household Size | Owner-occupied | Renter-occupied |
| Less than High School | 11 (55.0%) | 9 (45.0%) |
| High School Diploma | 54 (70.1%) | 23 (29.9%) |
| College/Associate Degree | 26 (55.3%) | 21 (44.7%) |
| Bachelor's Degree or higher | 13 (100.0%) | 0 (0.0%) |
Occupancy by Age of Householder in Birchwood
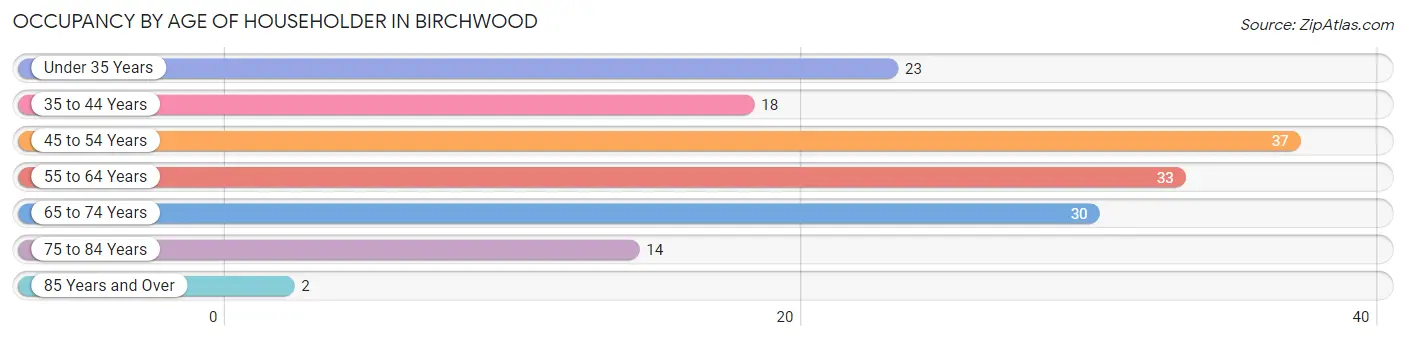
| Age Bracket | # Households | % Households |
| Under 35 Years | 23 | 14.6% |
| 35 to 44 Years | 18 | 11.5% |
| 45 to 54 Years | 37 | 23.6% |
| 55 to 64 Years | 33 | 21.0% |
| 65 to 74 Years | 30 | 19.1% |
| 75 to 84 Years | 14 | 8.9% |
| 85 Years and Over | 2 | 1.3% |
| Total | 157 | 100.0% |
Housing Finances in Birchwood
Median Income by Occupancy in Birchwood
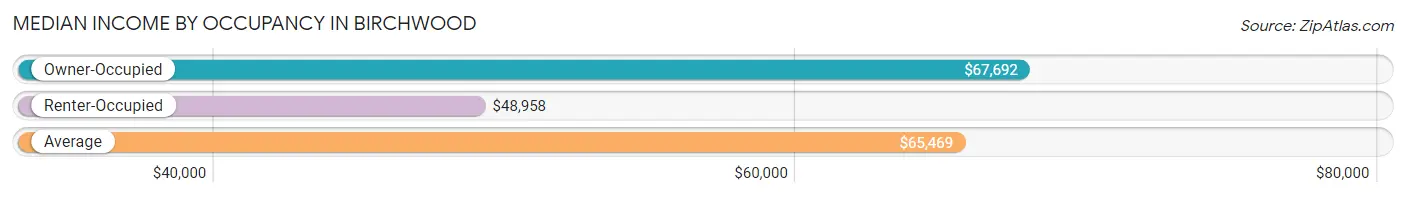
| Occupancy Type | # Households | Median Income |
| Owner-Occupied | 104 (66.2%) | $67,692 |
| Renter-Occupied | 53 (33.8%) | $48,958 |
| Average | 157 (100.0%) | $65,469 |
Occupancy by Householder Income Bracket in Birchwood
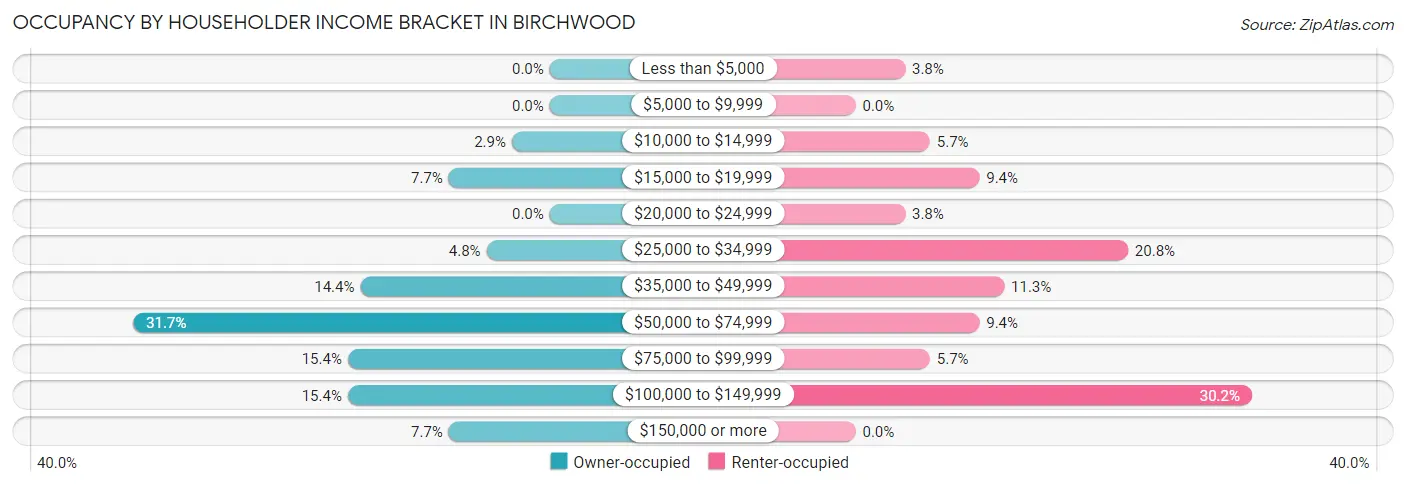
| Income Bracket | Owner-occupied | Renter-occupied |
| Less than $5,000 | 0 (0.0%) | 2 (3.8%) |
| $5,000 to $9,999 | 0 (0.0%) | 0 (0.0%) |
| $10,000 to $14,999 | 3 (2.9%) | 3 (5.7%) |
| $15,000 to $19,999 | 8 (7.7%) | 5 (9.4%) |
| $20,000 to $24,999 | 0 (0.0%) | 2 (3.8%) |
| $25,000 to $34,999 | 5 (4.8%) | 11 (20.7%) |
| $35,000 to $49,999 | 15 (14.4%) | 6 (11.3%) |
| $50,000 to $74,999 | 33 (31.7%) | 5 (9.4%) |
| $75,000 to $99,999 | 16 (15.4%) | 3 (5.7%) |
| $100,000 to $149,999 | 16 (15.4%) | 16 (30.2%) |
| $150,000 or more | 8 (7.7%) | 0 (0.0%) |
| Total | 104 (100.0%) | 53 (100.0%) |
Monthly Housing Cost Tiers in Birchwood
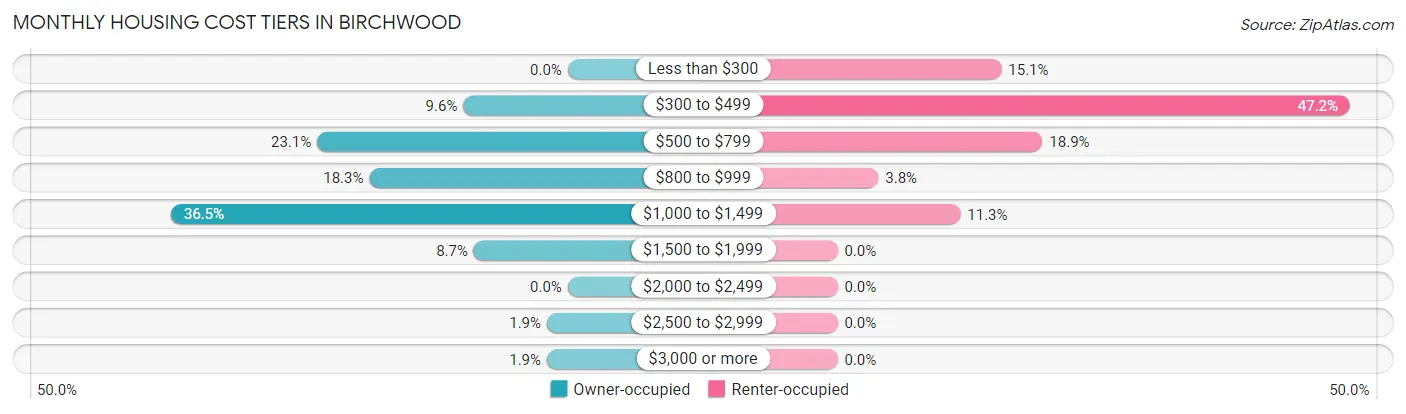
| Monthly Cost | Owner-occupied | Renter-occupied |
| Less than $300 | 0 (0.0%) | 8 (15.1%) |
| $300 to $499 | 10 (9.6%) | 25 (47.2%) |
| $500 to $799 | 24 (23.1%) | 10 (18.9%) |
| $800 to $999 | 19 (18.3%) | 2 (3.8%) |
| $1,000 to $1,499 | 38 (36.5%) | 6 (11.3%) |
| $1,500 to $1,999 | 9 (8.6%) | 0 (0.0%) |
| $2,000 to $2,499 | 0 (0.0%) | 0 (0.0%) |
| $2,500 to $2,999 | 2 (1.9%) | 0 (0.0%) |
| $3,000 or more | 2 (1.9%) | 0 (0.0%) |
| Total | 104 (100.0%) | 53 (100.0%) |
Physical Housing Characteristics in Birchwood
Housing Structures in Birchwood
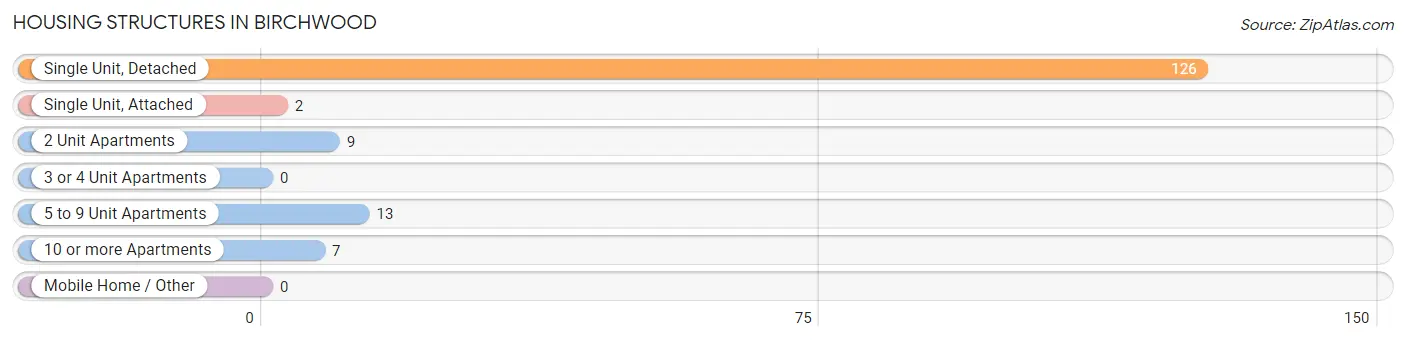
| Structure Type | # Housing Units | % Housing Units |
| Single Unit, Detached | 126 | 80.2% |
| Single Unit, Attached | 2 | 1.3% |
| 2 Unit Apartments | 9 | 5.7% |
| 3 or 4 Unit Apartments | 0 | 0.0% |
| 5 to 9 Unit Apartments | 13 | 8.3% |
| 10 or more Apartments | 7 | 4.5% |
| Mobile Home / Other | 0 | 0.0% |
| Total | 157 | 100.0% |
Housing Structures by Occupancy in Birchwood
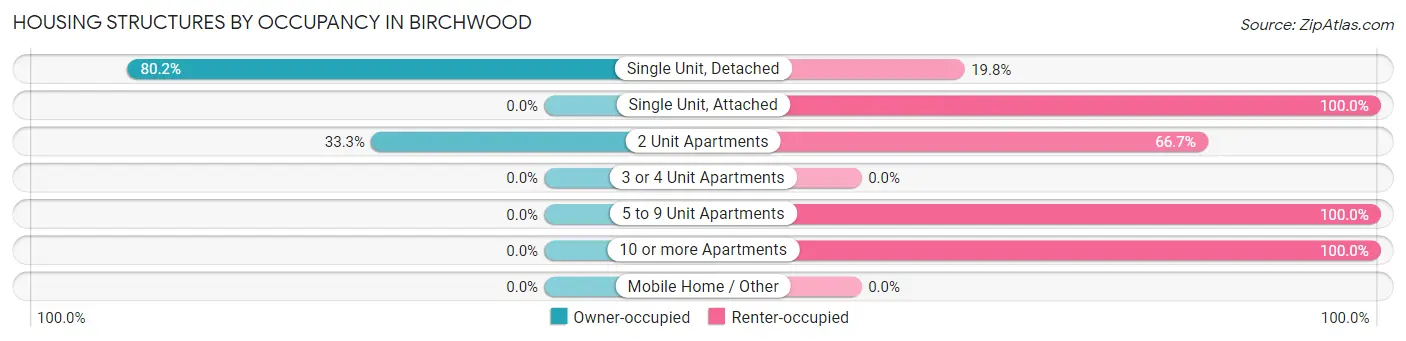
| Structure Type | Owner-occupied | Renter-occupied |
| Single Unit, Detached | 101 (80.2%) | 25 (19.8%) |
| Single Unit, Attached | 0 (0.0%) | 2 (100.0%) |
| 2 Unit Apartments | 3 (33.3%) | 6 (66.7%) |
| 3 or 4 Unit Apartments | 0 (0.0%) | 0 (0.0%) |
| 5 to 9 Unit Apartments | 0 (0.0%) | 13 (100.0%) |
| 10 or more Apartments | 0 (0.0%) | 7 (100.0%) |
| Mobile Home / Other | 0 (0.0%) | 0 (0.0%) |
| Total | 104 (66.2%) | 53 (33.8%) |
Housing Structures by Number of Rooms in Birchwood
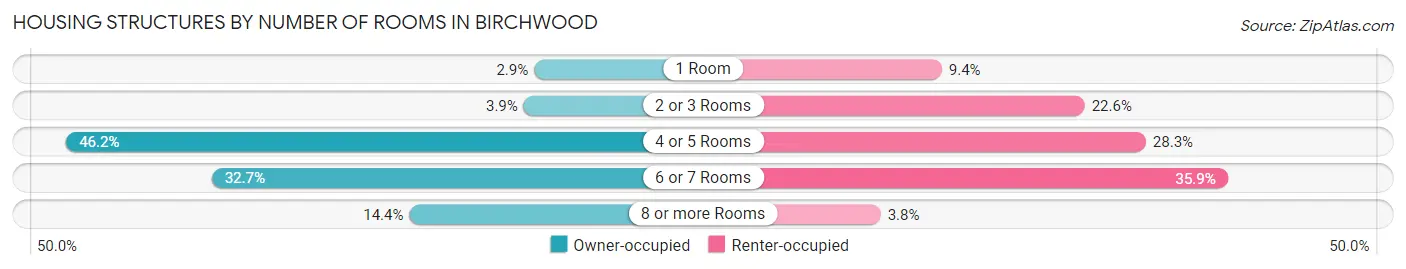
| Number of Rooms | Owner-occupied | Renter-occupied |
| 1 Room | 3 (2.9%) | 5 (9.4%) |
| 2 or 3 Rooms | 4 (3.8%) | 12 (22.6%) |
| 4 or 5 Rooms | 48 (46.2%) | 15 (28.3%) |
| 6 or 7 Rooms | 34 (32.7%) | 19 (35.8%) |
| 8 or more Rooms | 15 (14.4%) | 2 (3.8%) |
| Total | 104 (100.0%) | 53 (100.0%) |
Housing Structure by Heating Type in Birchwood
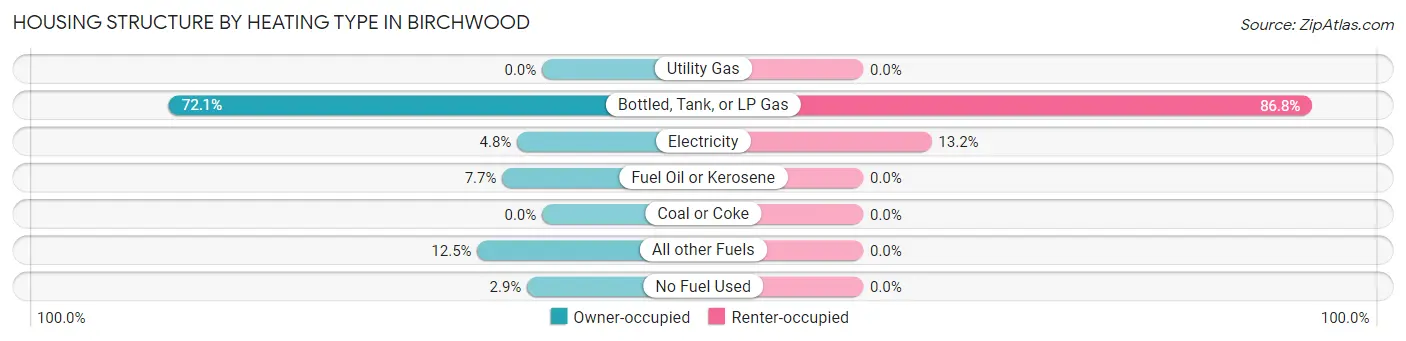
| Heating Type | Owner-occupied | Renter-occupied |
| Utility Gas | 0 (0.0%) | 0 (0.0%) |
| Bottled, Tank, or LP Gas | 75 (72.1%) | 46 (86.8%) |
| Electricity | 5 (4.8%) | 7 (13.2%) |
| Fuel Oil or Kerosene | 8 (7.7%) | 0 (0.0%) |
| Coal or Coke | 0 (0.0%) | 0 (0.0%) |
| All other Fuels | 13 (12.5%) | 0 (0.0%) |
| No Fuel Used | 3 (2.9%) | 0 (0.0%) |
| Total | 104 (100.0%) | 53 (100.0%) |
Household Vehicle Usage in Birchwood
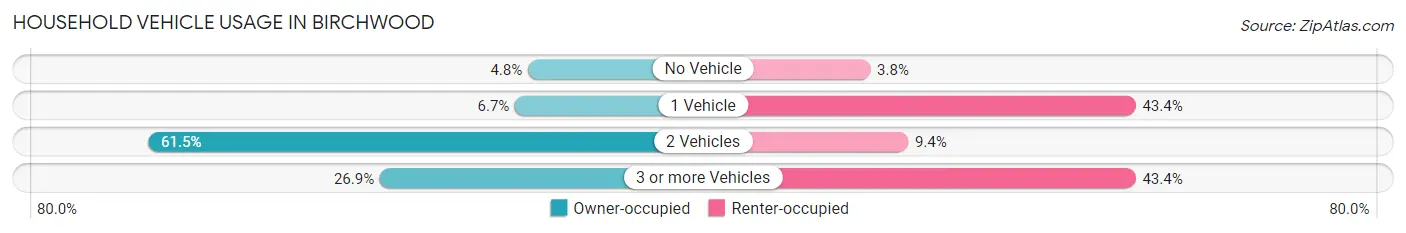
| Vehicles per Household | Owner-occupied | Renter-occupied |
| No Vehicle | 5 (4.8%) | 2 (3.8%) |
| 1 Vehicle | 7 (6.7%) | 23 (43.4%) |
| 2 Vehicles | 64 (61.5%) | 5 (9.4%) |
| 3 or more Vehicles | 28 (26.9%) | 23 (43.4%) |
| Total | 104 (100.0%) | 53 (100.0%) |
Real Estate & Mortgages in Birchwood
Real Estate and Mortgage Overview in Birchwood
| Characteristic | Without Mortgage | With Mortgage |
| Housing Units | 42 | 62 |
| Median Property Value | $158,300 | $134,400 |
| Median Household Income | $68,611 | $8 |
| Monthly Housing Costs | $585 | $2 |
| Real Estate Taxes | $1,708 | $0 |
Property Value by Mortgage Status in Birchwood
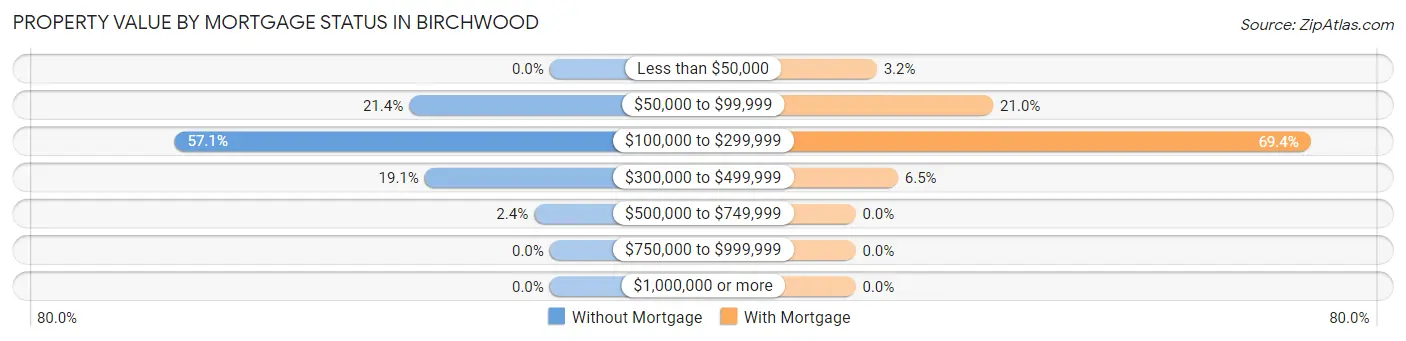
| Property Value | Without Mortgage | With Mortgage |
| Less than $50,000 | 0 (0.0%) | 2 (3.2%) |
| $50,000 to $99,999 | 9 (21.4%) | 13 (21.0%) |
| $100,000 to $299,999 | 24 (57.1%) | 43 (69.4%) |
| $300,000 to $499,999 | 8 (19.1%) | 4 (6.5%) |
| $500,000 to $749,999 | 1 (2.4%) | 0 (0.0%) |
| $750,000 to $999,999 | 0 (0.0%) | 0 (0.0%) |
| $1,000,000 or more | 0 (0.0%) | 0 (0.0%) |
| Total | 42 (100.0%) | 62 (100.0%) |
Household Income by Mortgage Status in Birchwood
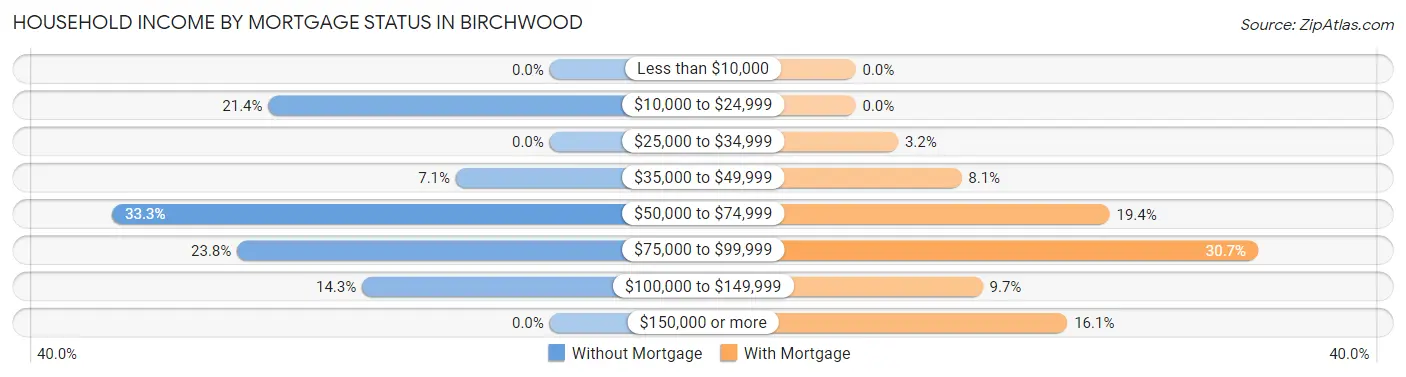
| Household Income | Without Mortgage | With Mortgage |
| Less than $10,000 | 0 (0.0%) | 0 (0.0%) |
| $10,000 to $24,999 | 9 (21.4%) | 0 (0.0%) |
| $25,000 to $34,999 | 0 (0.0%) | 2 (3.2%) |
| $35,000 to $49,999 | 3 (7.1%) | 5 (8.1%) |
| $50,000 to $74,999 | 14 (33.3%) | 12 (19.4%) |
| $75,000 to $99,999 | 10 (23.8%) | 19 (30.6%) |
| $100,000 to $149,999 | 6 (14.3%) | 6 (9.7%) |
| $150,000 or more | 0 (0.0%) | 10 (16.1%) |
| Total | 42 (100.0%) | 62 (100.0%) |
Property Value to Household Income Ratio in Birchwood
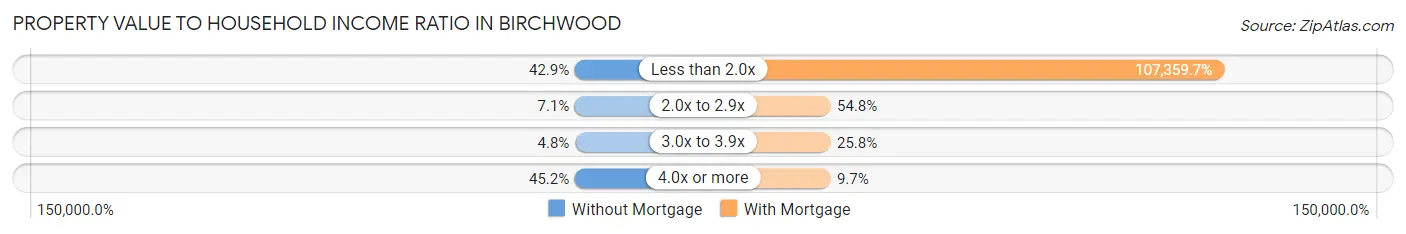
| Value-to-Income Ratio | Without Mortgage | With Mortgage |
| Less than 2.0x | 18 (42.9%) | 66,563 (107,359.7%) |
| 2.0x to 2.9x | 3 (7.1%) | 34 (54.8%) |
| 3.0x to 3.9x | 2 (4.8%) | 16 (25.8%) |
| 4.0x or more | 19 (45.2%) | 6 (9.7%) |
| Total | 42 (100.0%) | 62 (100.0%) |
Real Estate Taxes by Mortgage Status in Birchwood
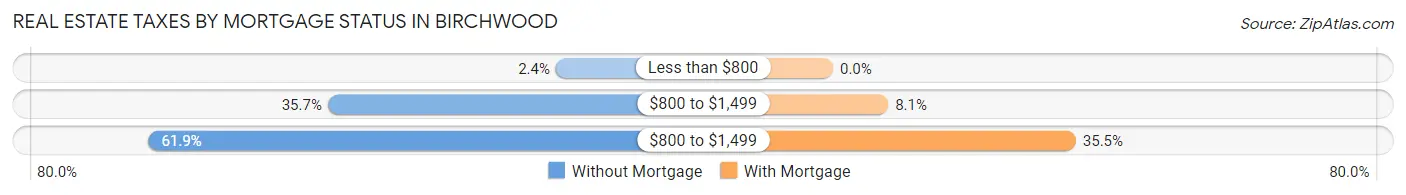
| Property Taxes | Without Mortgage | With Mortgage |
| Less than $800 | 1 (2.4%) | 0 (0.0%) |
| $800 to $1,499 | 15 (35.7%) | 5 (8.1%) |
| $800 to $1,499 | 26 (61.9%) | 22 (35.5%) |
| Total | 42 (100.0%) | 62 (100.0%) |
Health & Disability in Birchwood
Health Insurance Coverage by Age in Birchwood
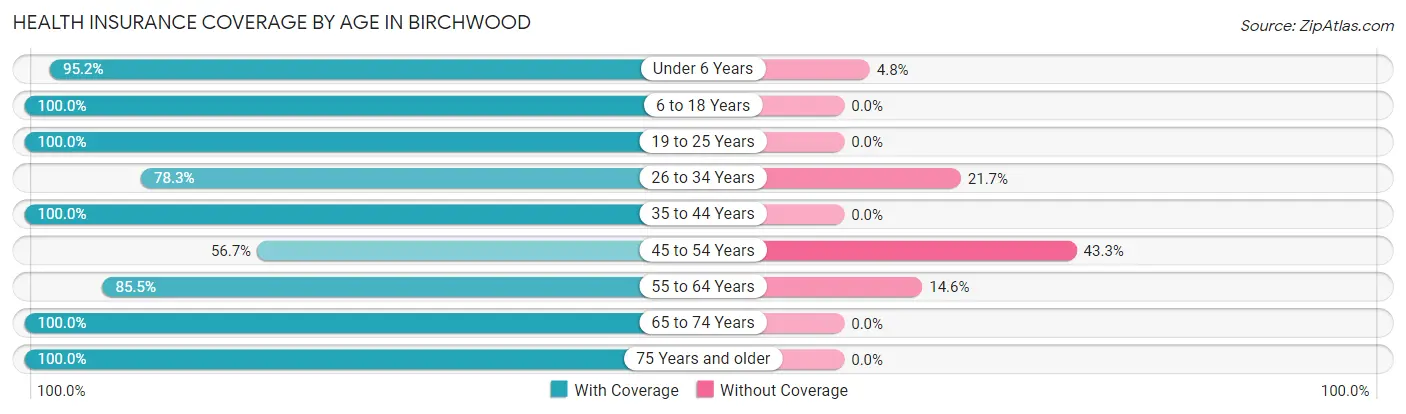
| Age Bracket | With Coverage | Without Coverage |
| Under 6 Years | 40 (95.2%) | 2 (4.8%) |
| 6 to 18 Years | 59 (100.0%) | 0 (0.0%) |
| 19 to 25 Years | 46 (100.0%) | 0 (0.0%) |
| 26 to 34 Years | 36 (78.3%) | 10 (21.7%) |
| 35 to 44 Years | 34 (100.0%) | 0 (0.0%) |
| 45 to 54 Years | 34 (56.7%) | 26 (43.3%) |
| 55 to 64 Years | 47 (85.5%) | 8 (14.5%) |
| 65 to 74 Years | 69 (100.0%) | 0 (0.0%) |
| 75 Years and older | 23 (100.0%) | 0 (0.0%) |
| Total | 388 (89.4%) | 46 (10.6%) |
Health Insurance Coverage by Citizenship Status in Birchwood
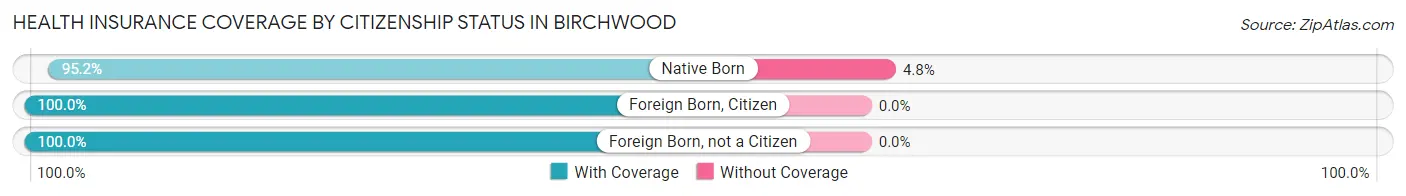
| Citizenship Status | With Coverage | Without Coverage |
| Native Born | 40 (95.2%) | 2 (4.8%) |
| Foreign Born, Citizen | 59 (100.0%) | 0 (0.0%) |
| Foreign Born, not a Citizen | 46 (100.0%) | 0 (0.0%) |
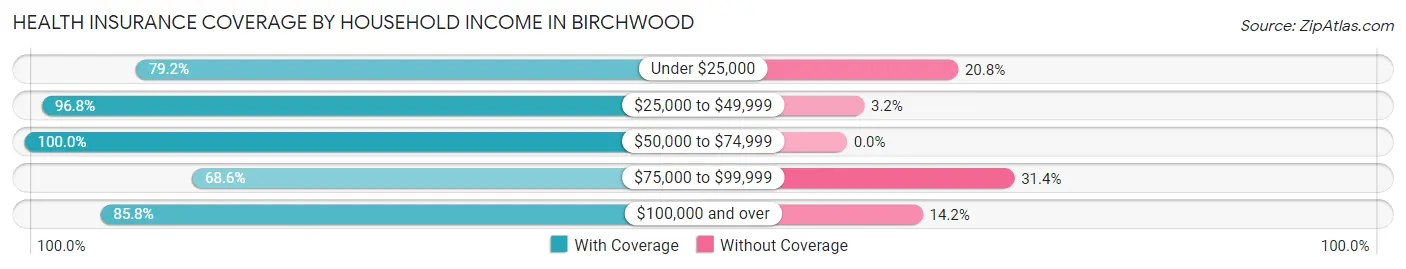
Health Insurance Coverage by Household Income in Birchwood
| Household Income | With Coverage | Without Coverage |
| Under $25,000 | 19 (79.2%) | 5 (20.8%) |
| $25,000 to $49,999 | 60 (96.8%) | 2 (3.2%) |
| $50,000 to $74,999 | 135 (100.0%) | 0 (0.0%) |
| $75,000 to $99,999 | 35 (68.6%) | 16 (31.4%) |
| $100,000 and over | 139 (85.8%) | 23 (14.2%) |
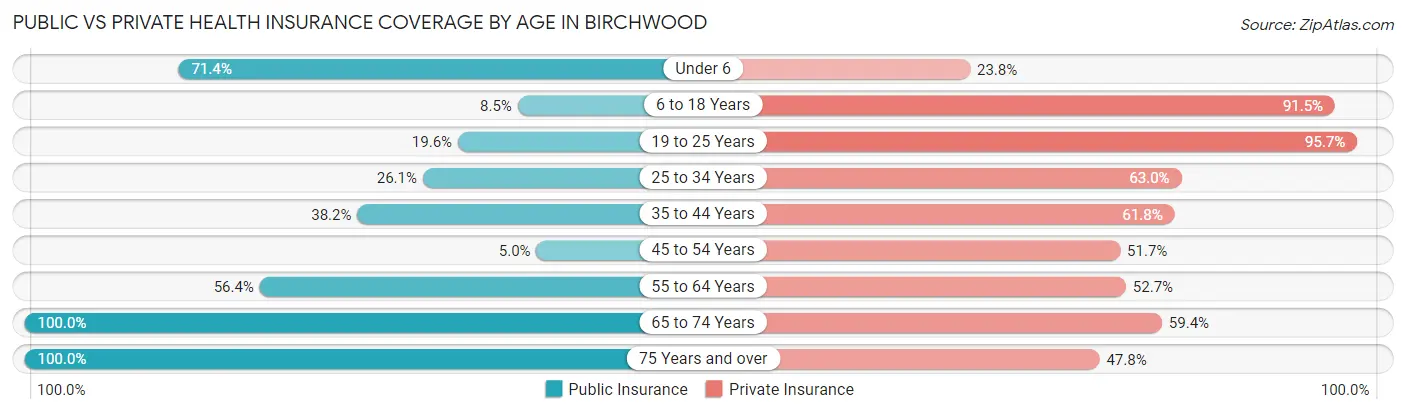
Public vs Private Health Insurance Coverage by Age in Birchwood
| Age Bracket | Public Insurance | Private Insurance |
| Under 6 | 30 (71.4%) | 10 (23.8%) |
| 6 to 18 Years | 5 (8.5%) | 54 (91.5%) |
| 19 to 25 Years | 9 (19.6%) | 44 (95.7%) |
| 25 to 34 Years | 12 (26.1%) | 29 (63.0%) |
| 35 to 44 Years | 13 (38.2%) | 21 (61.8%) |
| 45 to 54 Years | 3 (5.0%) | 31 (51.7%) |
| 55 to 64 Years | 31 (56.4%) | 29 (52.7%) |
| 65 to 74 Years | 69 (100.0%) | 41 (59.4%) |
| 75 Years and over | 23 (100.0%) | 11 (47.8%) |
| Total | 195 (44.9%) | 270 (62.2%) |
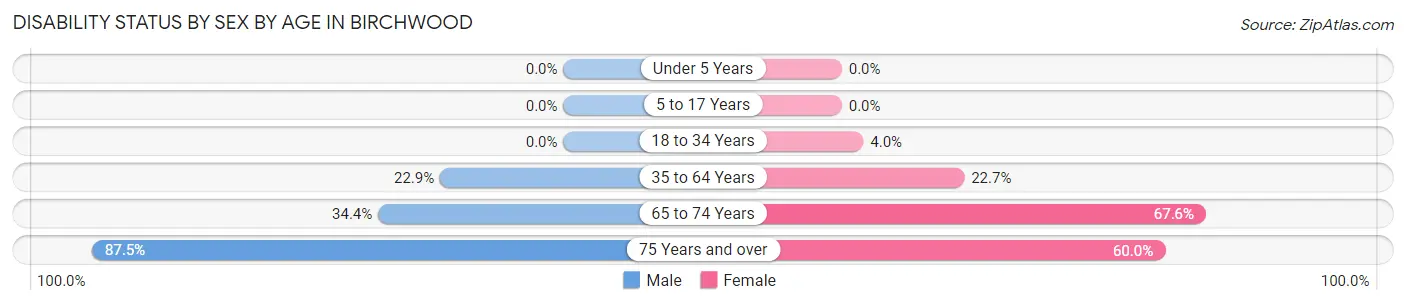
Disability Status by Sex by Age in Birchwood
| Age Bracket | Male | Female |
| Under 5 Years | 0 (0.0%) | 0 (0.0%) |
| 5 to 17 Years | 0 (0.0%) | 0 (0.0%) |
| 18 to 34 Years | 0 (0.0%) | 2 (4.0%) |
| 35 to 64 Years | 19 (22.9%) | 15 (22.7%) |
| 65 to 74 Years | 11 (34.4%) | 25 (67.6%) |
| 75 Years and over | 7 (87.5%) | 9 (60.0%) |
Disability Class by Sex by Age in Birchwood
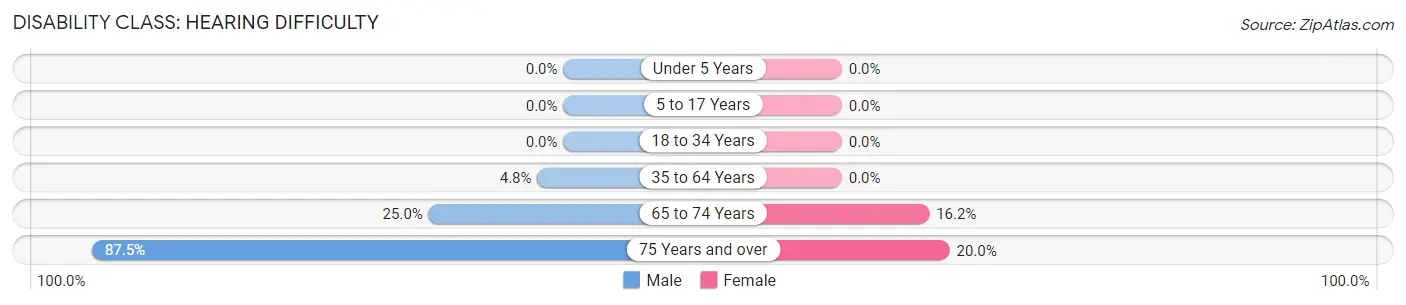
Disability Class: Hearing Difficulty
| Age Bracket | Male | Female |
| Under 5 Years | 0 (0.0%) | 0 (0.0%) |
| 5 to 17 Years | 0 (0.0%) | 0 (0.0%) |
| 18 to 34 Years | 0 (0.0%) | 0 (0.0%) |
| 35 to 64 Years | 4 (4.8%) | 0 (0.0%) |
| 65 to 74 Years | 8 (25.0%) | 6 (16.2%) |
| 75 Years and over | 7 (87.5%) | 3 (20.0%) |
Disability Class: Vision Difficulty
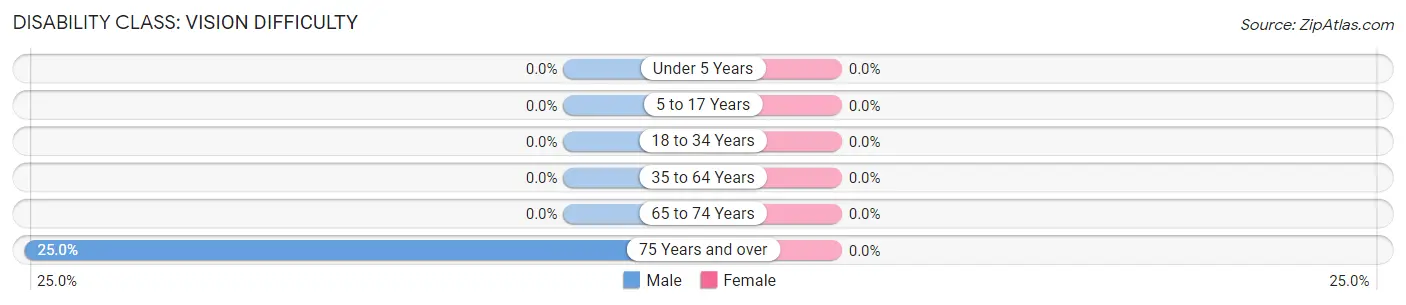
| Age Bracket | Male | Female |
| Under 5 Years | 0 (0.0%) | 0 (0.0%) |
| 5 to 17 Years | 0 (0.0%) | 0 (0.0%) |
| 18 to 34 Years | 0 (0.0%) | 0 (0.0%) |
| 35 to 64 Years | 0 (0.0%) | 0 (0.0%) |
| 65 to 74 Years | 0 (0.0%) | 0 (0.0%) |
| 75 Years and over | 2 (25.0%) | 0 (0.0%) |
Disability Class: Cognitive Difficulty
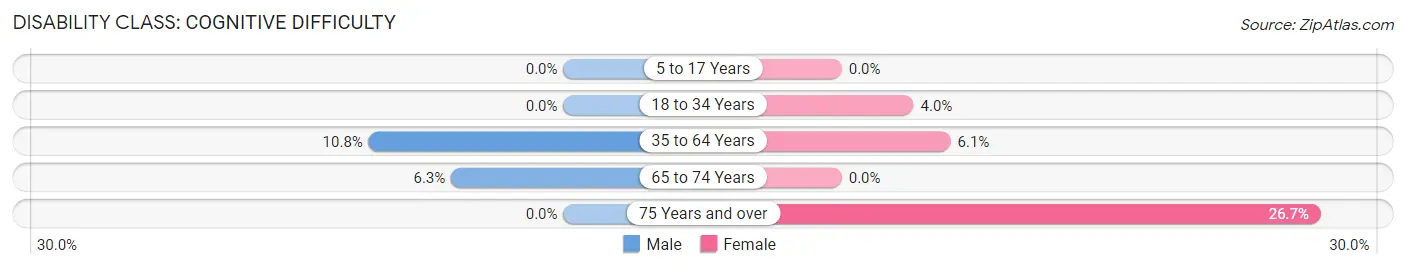
| Age Bracket | Male | Female |
| 5 to 17 Years | 0 (0.0%) | 0 (0.0%) |
| 18 to 34 Years | 0 (0.0%) | 2 (4.0%) |
| 35 to 64 Years | 9 (10.8%) | 4 (6.1%) |
| 65 to 74 Years | 2 (6.2%) | 0 (0.0%) |
| 75 Years and over | 0 (0.0%) | 4 (26.7%) |
Disability Class: Ambulatory Difficulty
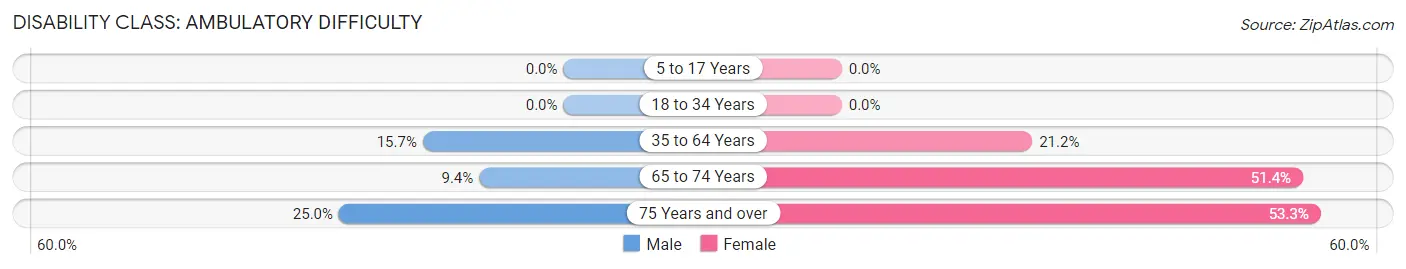
| Age Bracket | Male | Female |
| 5 to 17 Years | 0 (0.0%) | 0 (0.0%) |
| 18 to 34 Years | 0 (0.0%) | 0 (0.0%) |
| 35 to 64 Years | 13 (15.7%) | 14 (21.2%) |
| 65 to 74 Years | 3 (9.4%) | 19 (51.3%) |
| 75 Years and over | 2 (25.0%) | 8 (53.3%) |
Disability Class: Self-Care Difficulty
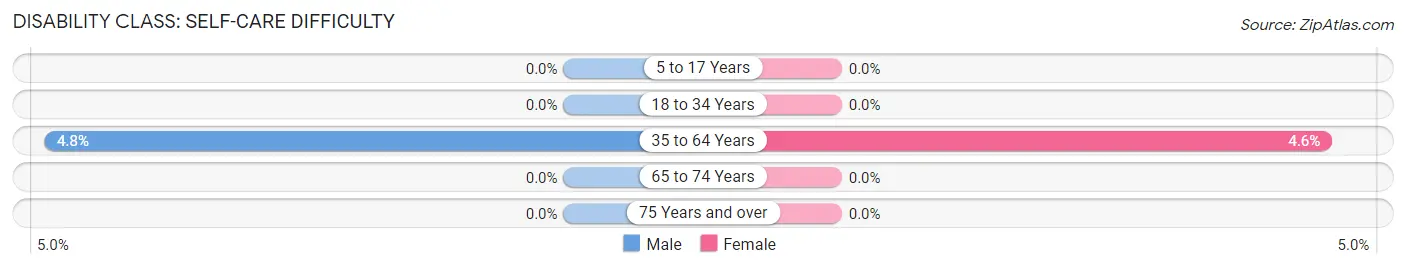
| Age Bracket | Male | Female |
| 5 to 17 Years | 0 (0.0%) | 0 (0.0%) |
| 18 to 34 Years | 0 (0.0%) | 0 (0.0%) |
| 35 to 64 Years | 4 (4.8%) | 3 (4.5%) |
| 65 to 74 Years | 0 (0.0%) | 0 (0.0%) |
| 75 Years and over | 0 (0.0%) | 0 (0.0%) |
Technology Access in Birchwood
Computing Device Access in Birchwood
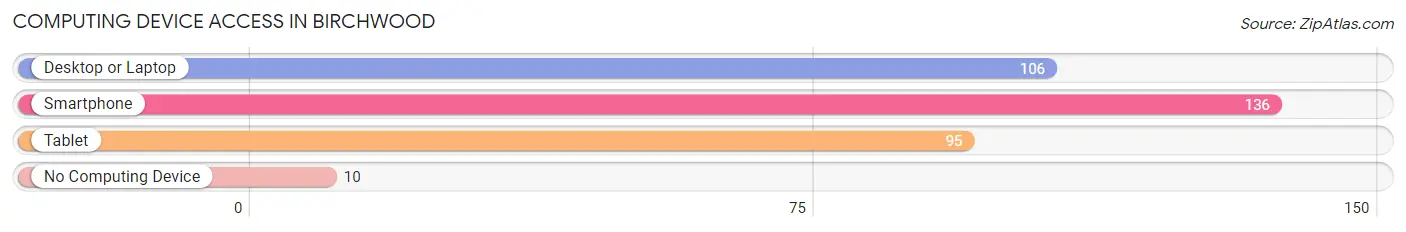
| Device Type | # Households | % Households |
| Desktop or Laptop | 106 | 67.5% |
| Smartphone | 136 | 86.6% |
| Tablet | 95 | 60.5% |
| No Computing Device | 10 | 6.4% |
| Total | 157 | 100.0% |
Internet Access in Birchwood
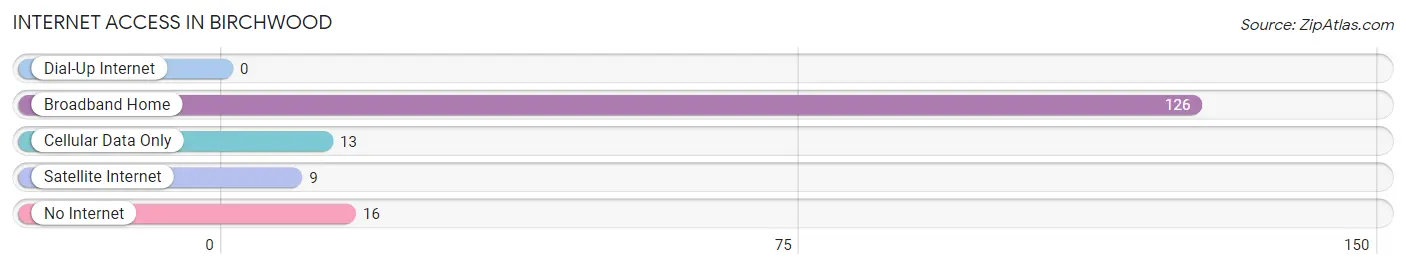
| Internet Type | # Households | % Households |
| Dial-Up Internet | 0 | 0.0% |
| Broadband Home | 126 | 80.2% |
| Cellular Data Only | 13 | 8.3% |
| Satellite Internet | 9 | 5.7% |
| No Internet | 16 | 10.2% |
| Total | 157 | 100.0% |
Birchwood Summary
Birchwood, Wisconsin is a small village located in Washburn County, Wisconsin. It is situated on the eastern shore of Lake Chetac, a large lake in the northwest corner of the state. The village has a population of approximately 500 people and is part of the Chetek-Weyerhaeuser Area School District.
History
Birchwood was first settled in the late 1800s by a group of Norwegian immigrants. The village was originally known as “Birchwood Station” and was a stop on the Chicago, St. Paul, Minneapolis and Omaha Railroad. The village was officially incorporated in 1906 and the name was changed to Birchwood.
Geography
Birchwood is located in the northwest corner of Wisconsin, on the eastern shore of Lake Chetac. The village is situated in a rural area, surrounded by forests and lakes. The terrain is mostly flat, with some rolling hills. The climate is humid continental, with cold winters and warm summers.
Economy
The economy of Birchwood is largely based on tourism and agriculture. The village is home to several small businesses, including a grocery store, a hardware store, and a few restaurants. The village also has a small marina, which provides access to Lake Chetac.
Agriculture is also an important part of the local economy. The area is home to several dairy farms, as well as some vegetable farms. The village also has a small sawmill, which produces lumber for local use.
Demographics
As of the 2010 census, the population of Birchwood was 498. The racial makeup of the village was 97.2% White, 0.2% African American, 0.4% Native American, 0.4% Asian, 0.2% from other races, and 1.6% from two or more races. Hispanic or Latino of any race were 0.8% of the population.
The median household income in Birchwood was $41,250, and the median family income was $48,750. The per capita income for the village was $20,945. About 8.2% of families and 10.2% of the population were below the poverty line, including 14.3% of those under age 18 and 4.2% of those age 65 or over.
Overall, Birchwood is a small, rural village with a strong sense of community. The village is home to a variety of businesses and industries, and the local economy is largely based on tourism and agriculture. The population is mostly white, with a small minority population. The median household income is slightly below the state average, but the per capita income is slightly above the state average.
Common Questions
What is Per Capita Income in Birchwood?
Per Capita income in Birchwood is $26,184.
What is the Median Family Income in Birchwood?
Median Family Income in Birchwood is $85,000.
What is the Median Household income in Birchwood?
Median Household Income in Birchwood is $65,469.
What is Income or Wage Gap in Birchwood?
Income or Wage Gap in Birchwood is 53.4%.
Women in Birchwood earn 46.6 cents for every dollar earned by a man.
What is Inequality or Gini Index in Birchwood?
Inequality or Gini Index in Birchwood is 0.35.
What is the Total Population of Birchwood?
Total Population of Birchwood is 434.
What is the Total Male Population of Birchwood?
Total Male Population of Birchwood is 234.
What is the Total Female Population of Birchwood?
Total Female Population of Birchwood is 200.
What is the Ratio of Males per 100 Females in Birchwood?
There are 117.00 Males per 100 Females in Birchwood.
What is the Ratio of Females per 100 Males in Birchwood?
There are 85.47 Females per 100 Males in Birchwood.
What is the Median Population Age in Birchwood?
Median Population Age in Birchwood is 38.5 Years.
What is the Average Family Size in Birchwood
Average Family Size in Birchwood is 3.6 People.
What is the Average Household Size in Birchwood
Average Household Size in Birchwood is 2.8 People.
How Large is the Labor Force in Birchwood?
There are 248 People in the Labor Forcein in Birchwood.
What is the Percentage of People in the Labor Force in Birchwood?
66.3% of People are in the Labor Force in Birchwood.
What is the Unemployment Rate in Birchwood?
Unemployment Rate in Birchwood is 2.0%.