Benton, WI Map & Demographics
Benton Map
Benton Overview
$30,055
PER CAPITA INCOME
$71,250
AVG FAMILY INCOME
$59,231
AVG HOUSEHOLD INCOME
17.9%
WAGE / INCOME GAP [ % ]
82.1¢/ $1
WAGE / INCOME GAP [ $ ]
0.35
INEQUALITY / GINI INDEX
901
TOTAL POPULATION
437
MALE POPULATION
464
FEMALE POPULATION
94.18
MALES / 100 FEMALES
106.18
FEMALES / 100 MALES
38.5
MEDIAN AGE
2.8
AVG FAMILY SIZE
2.4
AVG HOUSEHOLD SIZE
458
LABOR FORCE [ PEOPLE ]
64.1%
PERCENT IN LABOR FORCE
3.9%
UNEMPLOYMENT RATE
Benton Zip Codes
Benton Area Codes
Income in Benton
Income Overview in Benton
Per Capita Income in Benton is $30,055, while median incomes of families and households are $71,250 and $59,231 respectively.
| Characteristic | Number | Measure |
| Per Capita Income | 901 | $30,055 |
| Median Family Income | 249 | $71,250 |
| Mean Family Income | 249 | $82,435 |
| Median Household Income | 378 | $59,231 |
| Mean Household Income | 378 | $72,801 |
| Income Deficit | 249 | $0 |
| Wage / Income Gap (%) | 901 | 17.89% |
| Wage / Income Gap ($) | 901 | 82.11¢ per $1 |
| Gini / Inequality Index | 901 | 0.35 |
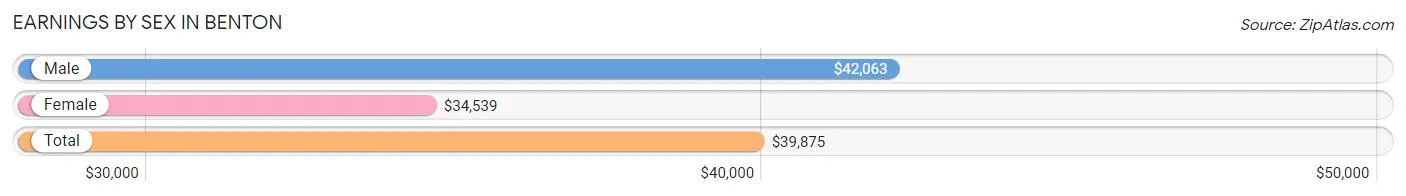
Earnings by Sex in Benton
Average Earnings in Benton are $39,875, $42,063 for men and $34,539 for women, a difference of 17.9%.
| Sex | Number | Average Earnings |
| Male | 265 (53.9%) | $42,063 |
| Female | 227 (46.1%) | $34,539 |
| Total | 492 (100.0%) | $39,875 |
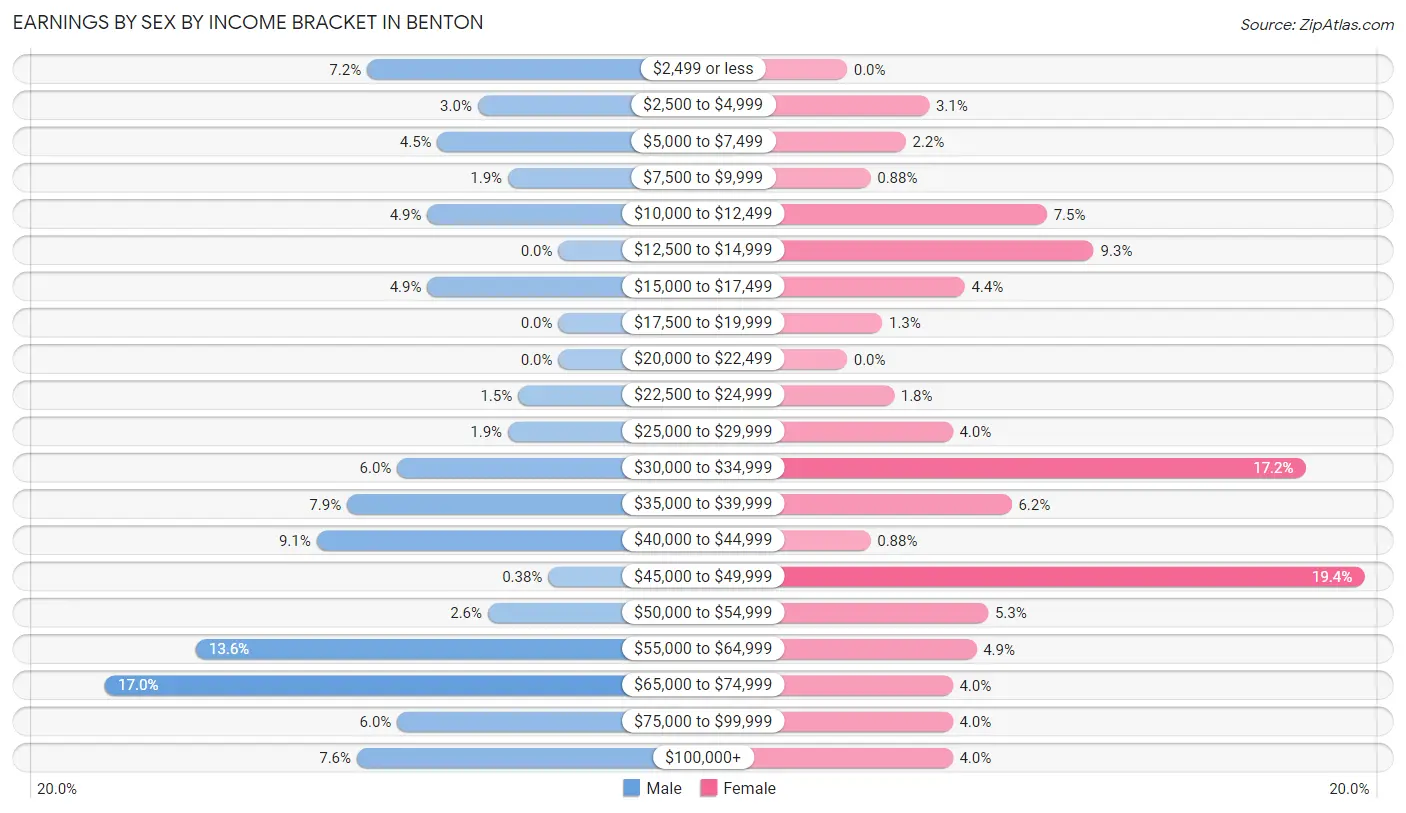
Earnings by Sex by Income Bracket in Benton
The most common earnings brackets in Benton are $65,000 to $74,999 for men (45 | 17.0%) and $45,000 to $49,999 for women (44 | 19.4%).
| Income | Male | Female |
| $2,499 or less | 19 (7.2%) | 0 (0.0%) |
| $2,500 to $4,999 | 8 (3.0%) | 7 (3.1%) |
| $5,000 to $7,499 | 12 (4.5%) | 5 (2.2%) |
| $7,500 to $9,999 | 5 (1.9%) | 2 (0.9%) |
| $10,000 to $12,499 | 13 (4.9%) | 17 (7.5%) |
| $12,500 to $14,999 | 0 (0.0%) | 21 (9.2%) |
| $15,000 to $17,499 | 13 (4.9%) | 10 (4.4%) |
| $17,500 to $19,999 | 0 (0.0%) | 3 (1.3%) |
| $20,000 to $22,499 | 0 (0.0%) | 0 (0.0%) |
| $22,500 to $24,999 | 4 (1.5%) | 4 (1.8%) |
| $25,000 to $29,999 | 5 (1.9%) | 9 (4.0%) |
| $30,000 to $34,999 | 16 (6.0%) | 39 (17.2%) |
| $35,000 to $39,999 | 21 (7.9%) | 14 (6.2%) |
| $40,000 to $44,999 | 24 (9.1%) | 2 (0.9%) |
| $45,000 to $49,999 | 1 (0.4%) | 44 (19.4%) |
| $50,000 to $54,999 | 7 (2.6%) | 12 (5.3%) |
| $55,000 to $64,999 | 36 (13.6%) | 11 (4.9%) |
| $65,000 to $74,999 | 45 (17.0%) | 9 (4.0%) |
| $75,000 to $99,999 | 16 (6.0%) | 9 (4.0%) |
| $100,000+ | 20 (7.5%) | 9 (4.0%) |
| Total | 265 (100.0%) | 227 (100.0%) |
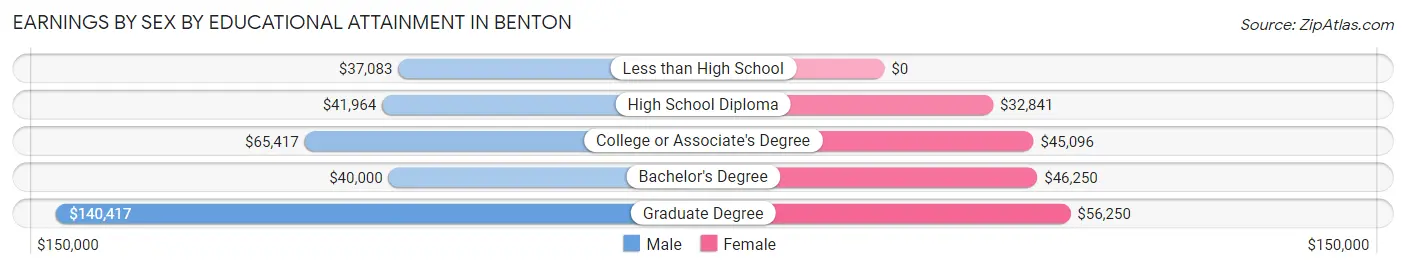
Earnings by Sex by Educational Attainment in Benton
Average earnings in Benton are $57,875 for men and $37,000 for women, a difference of 36.1%. Men with an educational attainment of graduate degree enjoy the highest average annual earnings of $140,417, while those with less than high school education earn the least with $37,083. Women with an educational attainment of graduate degree earn the most with the average annual earnings of $56,250, while those with high school diploma education have the smallest earnings of $32,841.
| Educational Attainment | Male Income | Female Income |
| Less than High School | $37,083 | $0 |
| High School Diploma | $41,964 | $32,841 |
| College or Associate's Degree | $65,417 | $45,096 |
| Bachelor's Degree | $40,000 | $46,250 |
| Graduate Degree | $140,417 | $56,250 |
| Total | $57,875 | $37,000 |
Family Income in Benton
Family Income Brackets in Benton
According to the Benton family income data, there are 57 families falling into the $100,000 to $149,999 income range, which is the most common income bracket and makes up 22.9% of all families.
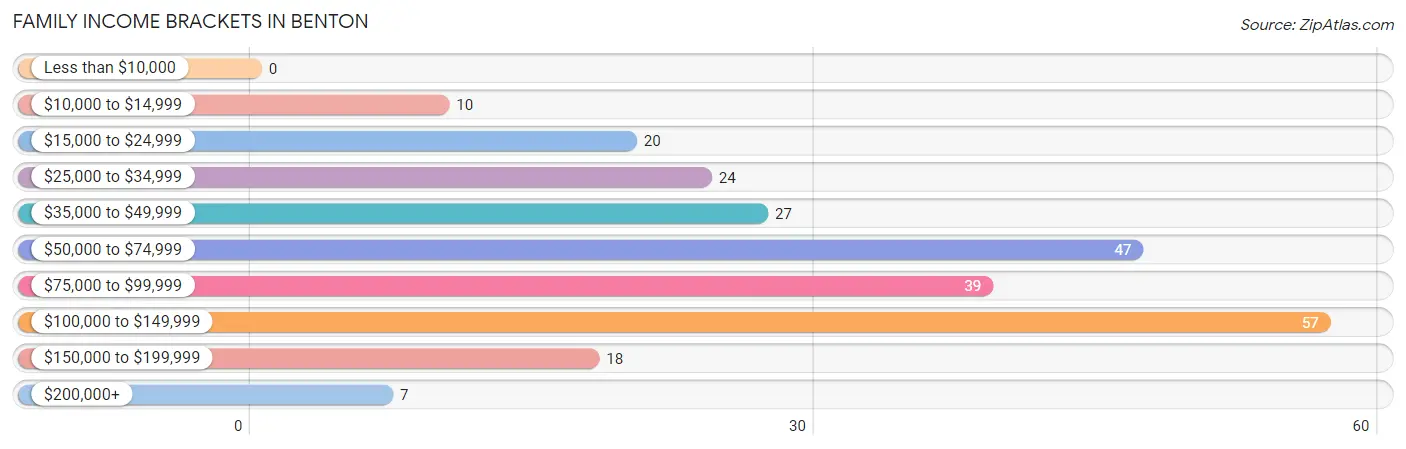
| Income Bracket | # Families | % Families |
| Less than $10,000 | 0 | 0.0% |
| $10,000 to $14,999 | 10 | 4.0% |
| $15,000 to $24,999 | 20 | 8.0% |
| $25,000 to $34,999 | 24 | 9.6% |
| $35,000 to $49,999 | 27 | 10.8% |
| $50,000 to $74,999 | 47 | 18.9% |
| $75,000 to $99,999 | 39 | 15.7% |
| $100,000 to $149,999 | 57 | 22.9% |
| $150,000 to $199,999 | 18 | 7.2% |
| $200,000+ | 7 | 2.8% |
Family Income by Famaliy Size in Benton
2-person families (132 | 53.0%) account for the highest median family income in Benton with $77,500 per family, while 2-person families (132 | 53.0%) have the highest median income of $38,750 per family member.
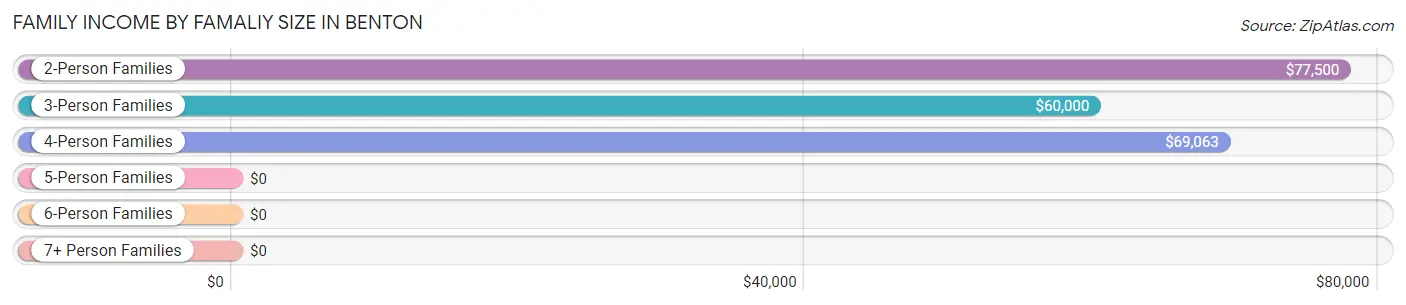
| Income Bracket | # Families | Median Income |
| 2-Person Families | 132 (53.0%) | $77,500 |
| 3-Person Families | 56 (22.5%) | $60,000 |
| 4-Person Families | 44 (17.7%) | $69,063 |
| 5-Person Families | 8 (3.2%) | $0 |
| 6-Person Families | 5 (2.0%) | $0 |
| 7+ Person Families | 4 (1.6%) | $0 |
| Total | 249 (100.0%) | $71,250 |
Family Income by Number of Earners in Benton
The median family income in Benton is $71,250, with families comprising 3+ earners (23) having the highest median family income of $142,750, while families with no earners (28) have the lowest median family income of $45,833, accounting for 9.2% and 11.2% of families, respectively.
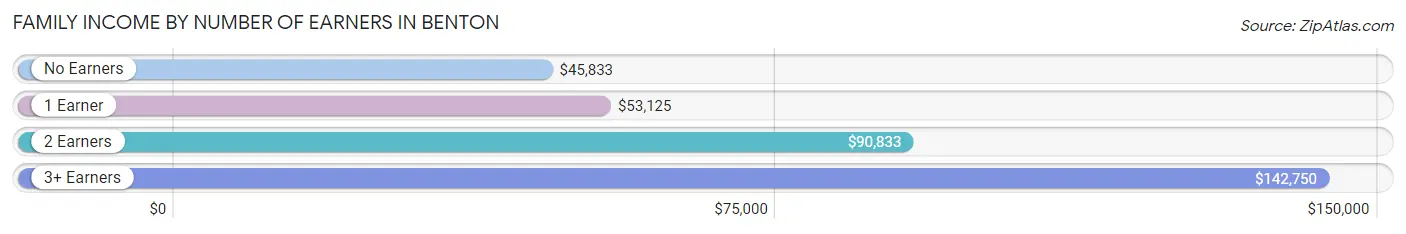
| Number of Earners | # Families | Median Income |
| No Earners | 28 (11.2%) | $45,833 |
| 1 Earner | 96 (38.6%) | $53,125 |
| 2 Earners | 102 (41.0%) | $90,833 |
| 3+ Earners | 23 (9.2%) | $142,750 |
| Total | 249 (100.0%) | $71,250 |
Household Income in Benton
Household Income Brackets in Benton
With 82 households falling in the category, the $50,000 to $74,999 income range is the most frequent in Benton, accounting for 21.7% of all households. In contrast, only 5 households (1.3%) fall into the less than $10,000 income bracket, making it the least populous group.
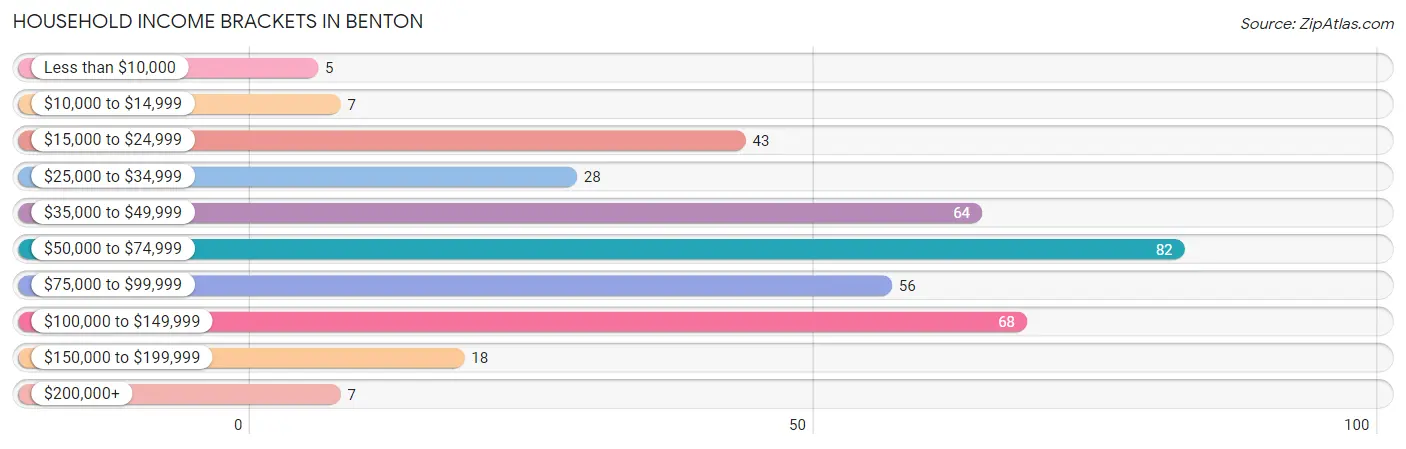
| Income Bracket | # Households | % Households |
| Less than $10,000 | 5 | 1.3% |
| $10,000 to $14,999 | 7 | 1.9% |
| $15,000 to $24,999 | 43 | 11.4% |
| $25,000 to $34,999 | 28 | 7.4% |
| $35,000 to $49,999 | 64 | 16.9% |
| $50,000 to $74,999 | 82 | 21.7% |
| $75,000 to $99,999 | 56 | 14.8% |
| $100,000 to $149,999 | 68 | 18.0% |
| $150,000 to $199,999 | 18 | 4.8% |
| $200,000+ | 7 | 1.9% |
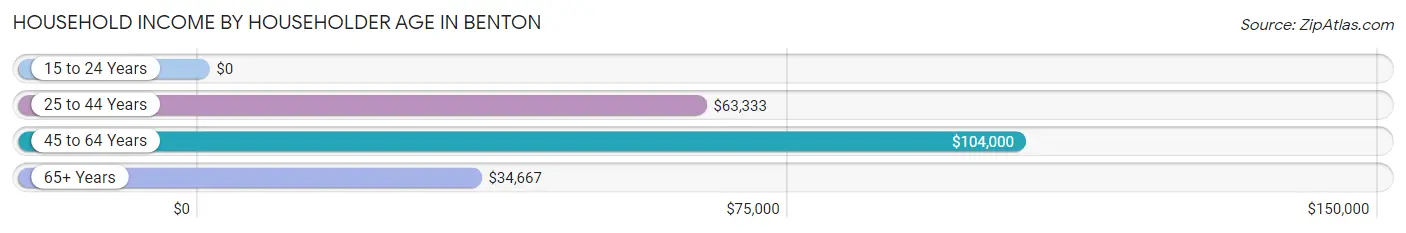
Household Income by Householder Age in Benton
The median household income in Benton is $59,231, with the highest median household income of $104,000 found in the 45 to 64 years age bracket for the primary householder. A total of 100 households (26.5%) fall into this category.
| Income Bracket | # Households | Median Income |
| 15 to 24 Years | 0 (0.0%) | $0 |
| 25 to 44 Years | 140 (37.0%) | $63,333 |
| 45 to 64 Years | 100 (26.5%) | $104,000 |
| 65+ Years | 138 (36.5%) | $34,667 |
| Total | 378 (100.0%) | $59,231 |
Poverty in Benton
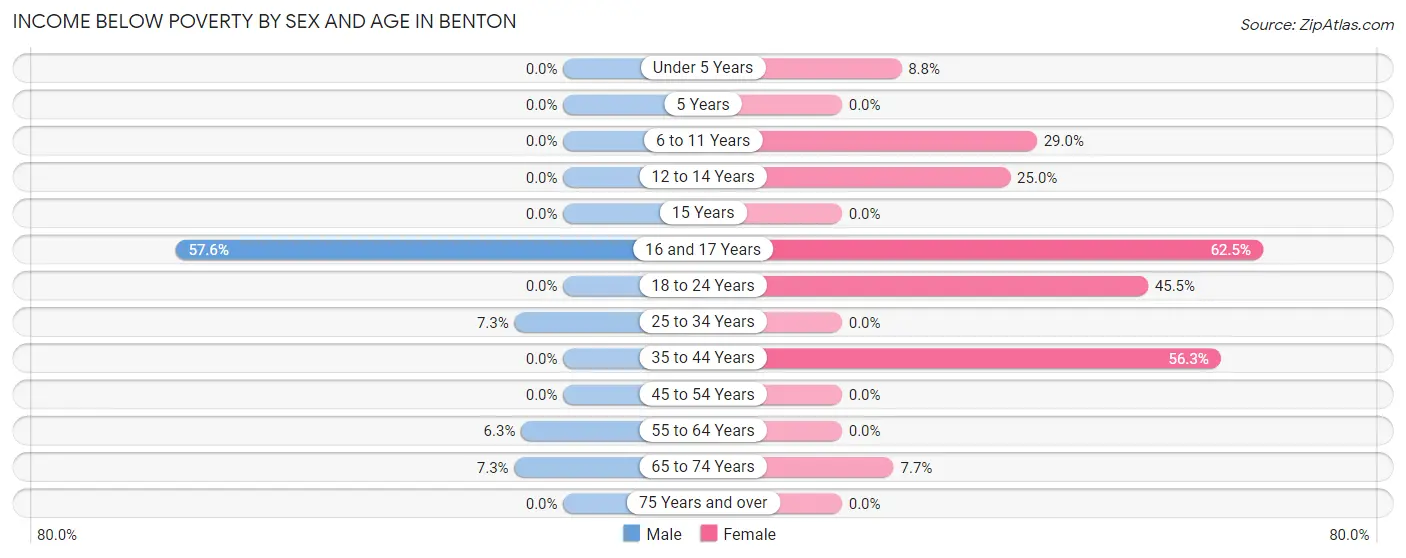
Income Below Poverty by Sex and Age in Benton
With 7.1% poverty level for males and 18.3% for females among the residents of Benton, 16 and 17 year old males and 16 and 17 year old females are the most vulnerable to poverty, with 19 males (57.6%) and 5 females (62.5%) in their respective age groups living below the poverty level.
| Age Bracket | Male | Female |
| Under 5 Years | 0 (0.0%) | 3 (8.8%) |
| 5 Years | 0 (0.0%) | 0 (0.0%) |
| 6 to 11 Years | 0 (0.0%) | 11 (28.9%) |
| 12 to 14 Years | 0 (0.0%) | 4 (25.0%) |
| 15 Years | 0 (0.0%) | 0 (0.0%) |
| 16 and 17 Years | 19 (57.6%) | 5 (62.5%) |
| 18 to 24 Years | 0 (0.0%) | 10 (45.5%) |
| 25 to 34 Years | 5 (7.2%) | 0 (0.0%) |
| 35 to 44 Years | 0 (0.0%) | 45 (56.2%) |
| 45 to 54 Years | 0 (0.0%) | 0 (0.0%) |
| 55 to 64 Years | 3 (6.2%) | 0 (0.0%) |
| 65 to 74 Years | 4 (7.3%) | 7 (7.7%) |
| 75 Years and over | 0 (0.0%) | 0 (0.0%) |
| Total | 31 (7.1%) | 85 (18.3%) |
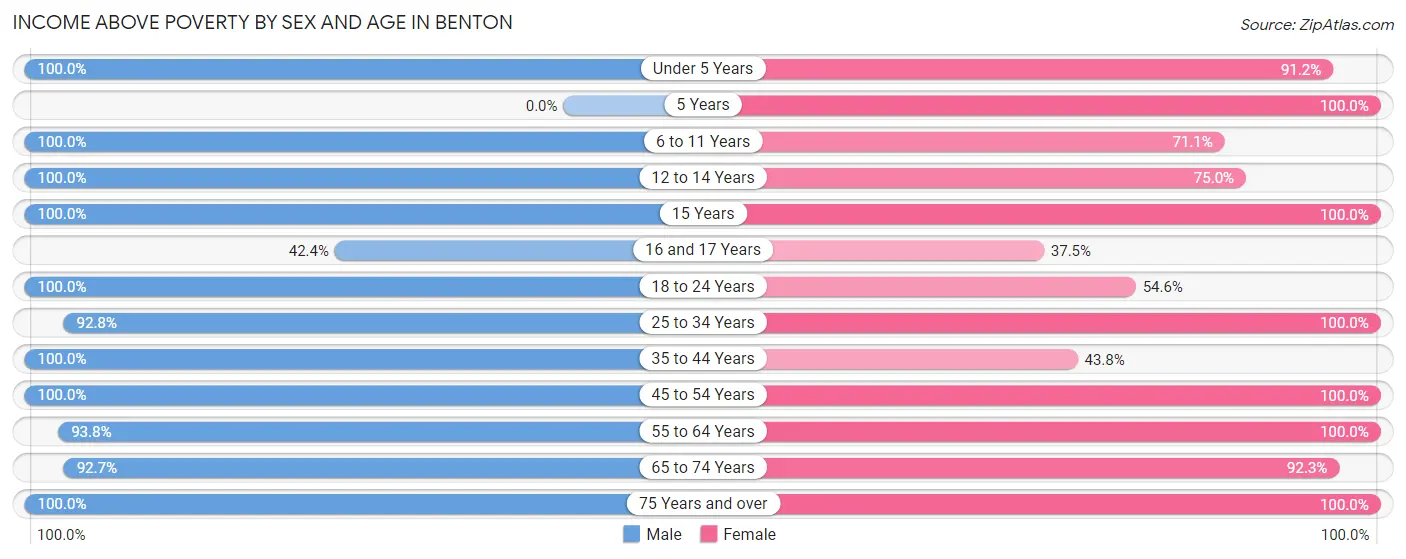
Income Above Poverty by Sex and Age in Benton
According to the poverty statistics in Benton, males aged under 5 years and females aged 5 years are the age groups that are most secure financially, with 100.0% of males and 100.0% of females in these age groups living above the poverty line.
| Age Bracket | Male | Female |
| Under 5 Years | 23 (100.0%) | 31 (91.2%) |
| 5 Years | 0 (0.0%) | 6 (100.0%) |
| 6 to 11 Years | 36 (100.0%) | 27 (71.1%) |
| 12 to 14 Years | 8 (100.0%) | 12 (75.0%) |
| 15 Years | 10 (100.0%) | 16 (100.0%) |
| 16 and 17 Years | 14 (42.4%) | 3 (37.5%) |
| 18 to 24 Years | 31 (100.0%) | 12 (54.5%) |
| 25 to 34 Years | 64 (92.7%) | 39 (100.0%) |
| 35 to 44 Years | 39 (100.0%) | 35 (43.8%) |
| 45 to 54 Years | 56 (100.0%) | 49 (100.0%) |
| 55 to 64 Years | 45 (93.8%) | 39 (100.0%) |
| 65 to 74 Years | 51 (92.7%) | 84 (92.3%) |
| 75 Years and over | 29 (100.0%) | 26 (100.0%) |
| Total | 406 (92.9%) | 379 (81.7%) |
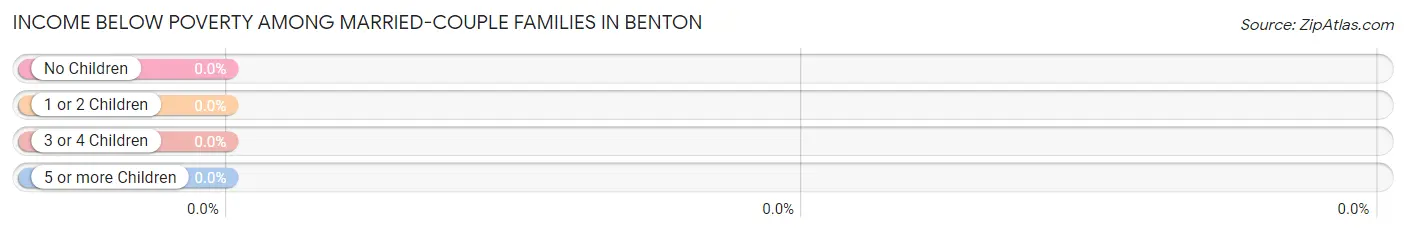
Income Below Poverty Among Married-Couple Families in Benton
| Children | Above Poverty | Below Poverty |
| No Children | 127 (100.0%) | 0 (0.0%) |
| 1 or 2 Children | 37 (100.0%) | 0 (0.0%) |
| 3 or 4 Children | 17 (100.0%) | 0 (0.0%) |
| 5 or more Children | 0 (0.0%) | 0 (0.0%) |
| Total | 181 (100.0%) | 0 (0.0%) |
Income Below Poverty Among Single-Parent Households in Benton
According to the poverty data in Benton, 20.0% or 5 single-father households and 41.9% or 18 single-mother households are living below the poverty line. Among single-father households, those with 1 or 2 children have the highest poverty rate, with 5 households (29.4%) experiencing poverty. Likewise, among single-mother households, those with 3 or 4 children have the highest poverty rate, with 5 households (55.6%) falling below the poverty line.
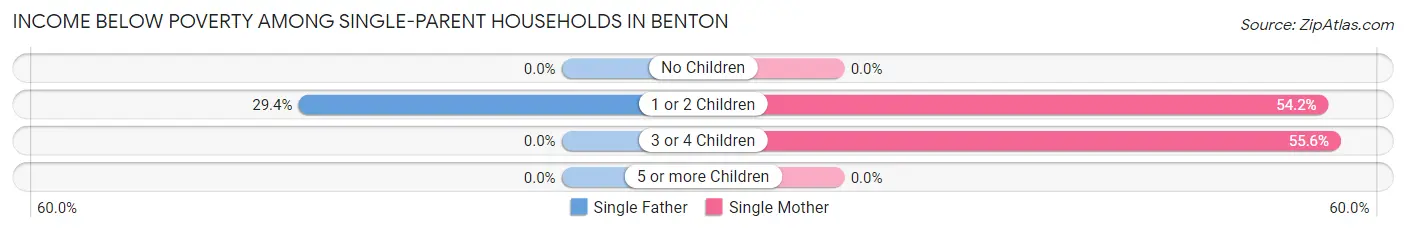
| Children | Single Father | Single Mother |
| No Children | 0 (0.0%) | 0 (0.0%) |
| 1 or 2 Children | 5 (29.4%) | 13 (54.2%) |
| 3 or 4 Children | 0 (0.0%) | 5 (55.6%) |
| 5 or more Children | 0 (0.0%) | 0 (0.0%) |
| Total | 5 (20.0%) | 18 (41.9%) |
Income Below Poverty Among Married-Couple vs Single-Parent Households in Benton
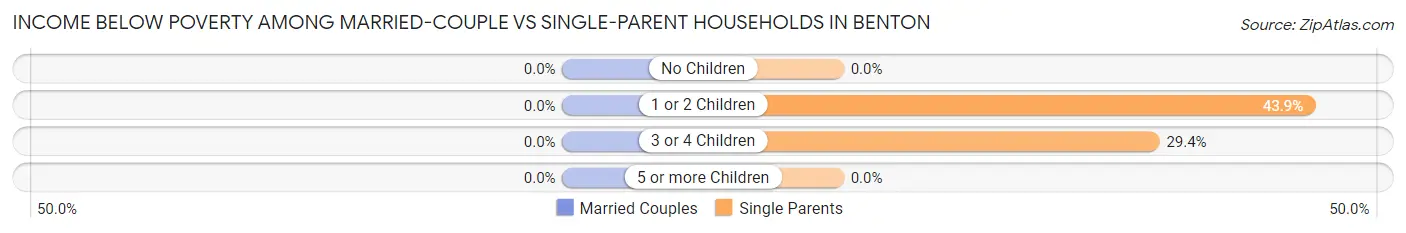
| Children | Married-Couple Families | Single-Parent Households |
| No Children | 0 (0.0%) | 0 (0.0%) |
| 1 or 2 Children | 0 (0.0%) | 18 (43.9%) |
| 3 or 4 Children | 0 (0.0%) | 5 (29.4%) |
| 5 or more Children | 0 (0.0%) | 0 (0.0%) |
| Total | 0 (0.0%) | 23 (33.8%) |
Race in Benton
The most populous races in Benton are White / Caucasian (848 | 94.1%), Hispanic or Latino (50 | 5.6%), and Some other Race (29 | 3.2%).
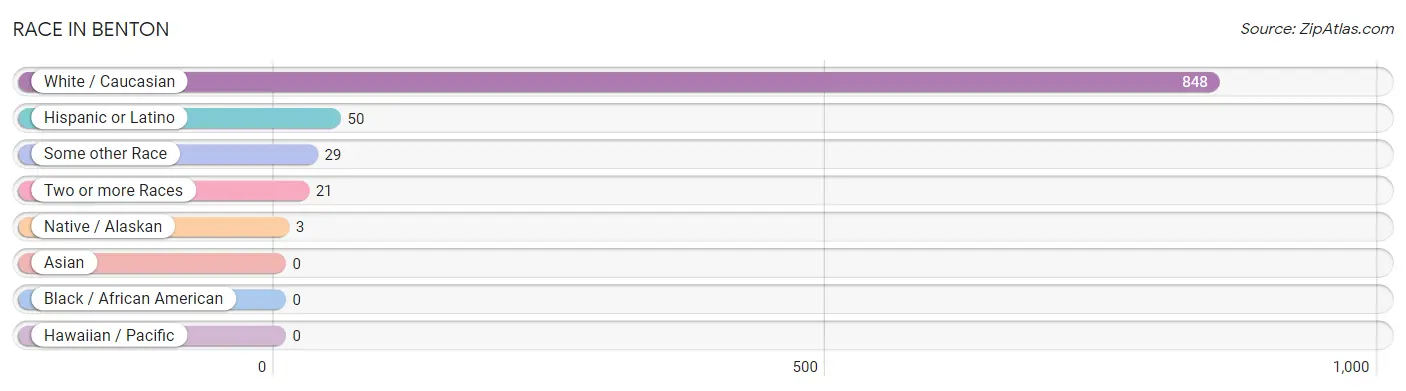
| Race | # Population | % Population |
| Asian | 0 | 0.0% |
| Black / African American | 0 | 0.0% |
| Hawaiian / Pacific | 0 | 0.0% |
| Hispanic or Latino | 50 | 5.6% |
| Native / Alaskan | 3 | 0.3% |
| White / Caucasian | 848 | 94.1% |
| Two or more Races | 21 | 2.3% |
| Some other Race | 29 | 3.2% |
| Total | 901 | 100.0% |
Ancestry in Benton
The most populous ancestries reported in Benton are German (298 | 33.1%), Irish (150 | 16.7%), English (142 | 15.8%), American (49 | 5.4%), and Mexican (41 | 4.5%), together accounting for 75.5% of all Benton residents.
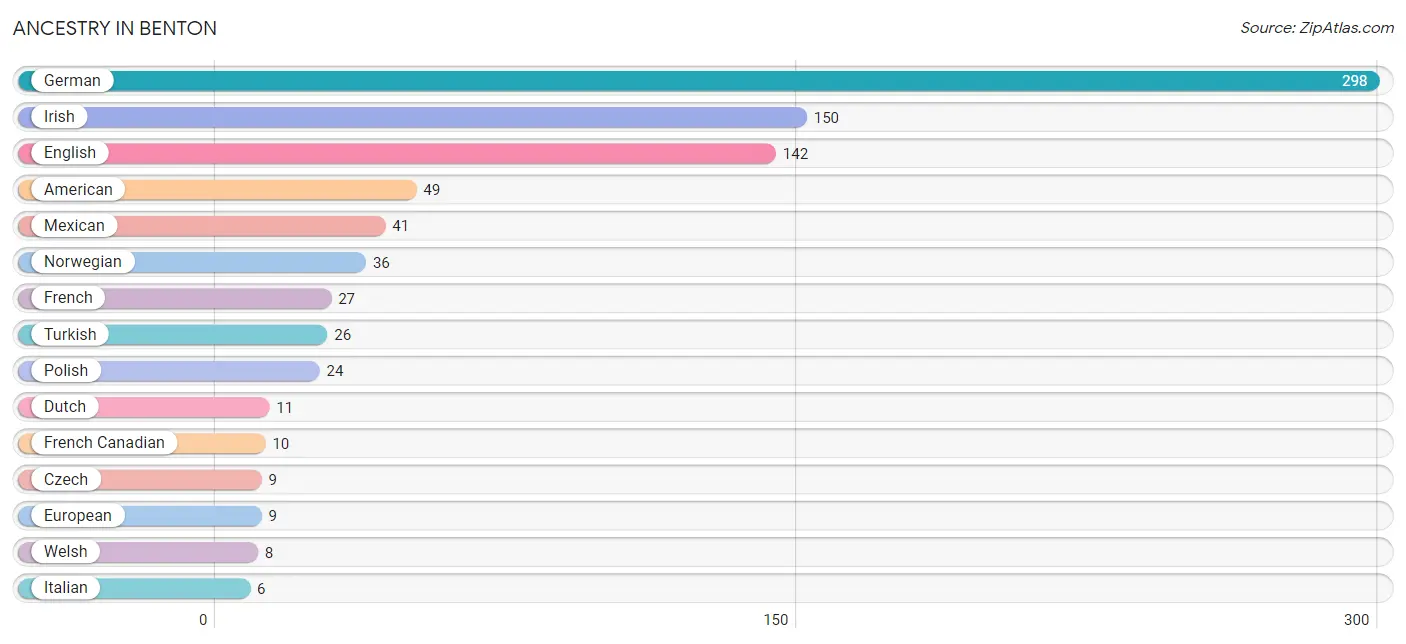
| Ancestry | # Population | % Population |
| American | 49 | 5.4% |
| Chippewa | 3 | 0.3% |
| Czech | 9 | 1.0% |
| Dutch | 11 | 1.2% |
| English | 142 | 15.8% |
| European | 9 | 1.0% |
| French | 27 | 3.0% |
| French Canadian | 10 | 1.1% |
| German | 298 | 33.1% |
| Irish | 150 | 16.7% |
| Italian | 6 | 0.7% |
| Korean | 1 | 0.1% |
| Mexican | 41 | 4.5% |
| Norwegian | 36 | 4.0% |
| Polish | 24 | 2.7% |
| Scandinavian | 2 | 0.2% |
| Scottish | 4 | 0.4% |
| Swedish | 1 | 0.1% |
| Swiss | 3 | 0.3% |
| Turkish | 26 | 2.9% |
| Welsh | 8 | 0.9% | View All 21 Rows |
Immigrants in Benton
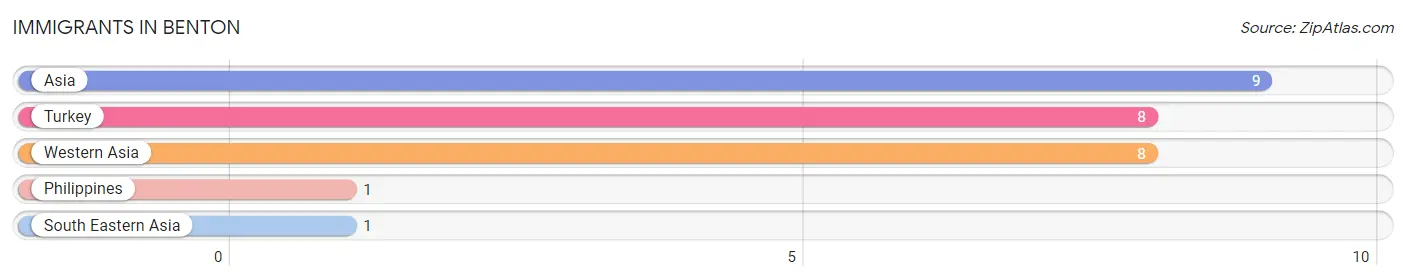
The most numerous immigrant groups reported in Benton came from Asia (9 | 1.0%), Turkey (8 | 0.9%), Western Asia (8 | 0.9%), Philippines (1 | 0.1%), and South Eastern Asia (1 | 0.1%), together accounting for 3.0% of all Benton residents.
| Immigration Origin | # Population | % Population |
| Asia | 9 | 1.0% |
| Philippines | 1 | 0.1% |
| South Eastern Asia | 1 | 0.1% |
| Turkey | 8 | 0.9% |
| Western Asia | 8 | 0.9% | View All 5 Rows |
Sex and Age in Benton
Sex and Age in Benton
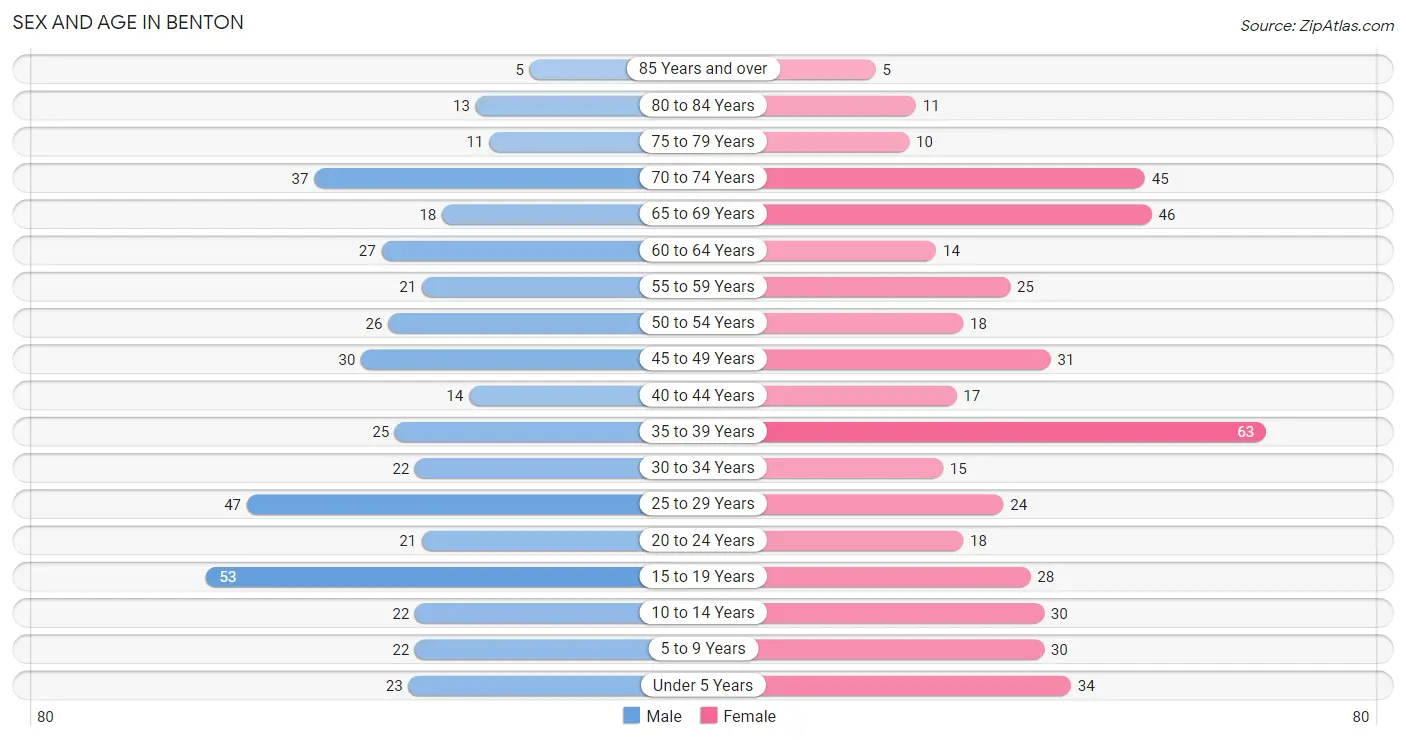
The most populous age groups in Benton are 15 to 19 Years (53 | 12.1%) for men and 35 to 39 Years (63 | 13.6%) for women.
| Age Bracket | Male | Female |
| Under 5 Years | 23 (5.3%) | 34 (7.3%) |
| 5 to 9 Years | 22 (5.0%) | 30 (6.5%) |
| 10 to 14 Years | 22 (5.0%) | 30 (6.5%) |
| 15 to 19 Years | 53 (12.1%) | 28 (6.0%) |
| 20 to 24 Years | 21 (4.8%) | 18 (3.9%) |
| 25 to 29 Years | 47 (10.8%) | 24 (5.2%) |
| 30 to 34 Years | 22 (5.0%) | 15 (3.2%) |
| 35 to 39 Years | 25 (5.7%) | 63 (13.6%) |
| 40 to 44 Years | 14 (3.2%) | 17 (3.7%) |
| 45 to 49 Years | 30 (6.9%) | 31 (6.7%) |
| 50 to 54 Years | 26 (5.9%) | 18 (3.9%) |
| 55 to 59 Years | 21 (4.8%) | 25 (5.4%) |
| 60 to 64 Years | 27 (6.2%) | 14 (3.0%) |
| 65 to 69 Years | 18 (4.1%) | 46 (9.9%) |
| 70 to 74 Years | 37 (8.5%) | 45 (9.7%) |
| 75 to 79 Years | 11 (2.5%) | 10 (2.2%) |
| 80 to 84 Years | 13 (3.0%) | 11 (2.4%) |
| 85 Years and over | 5 (1.1%) | 5 (1.1%) |
| Total | 437 (100.0%) | 464 (100.0%) |
Families and Households in Benton
Median Family Size in Benton
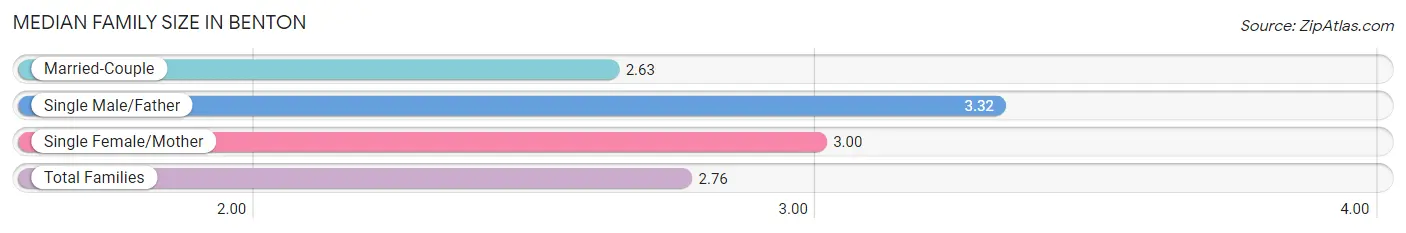
The median family size in Benton is 2.76 persons per family, with single male/father families (25 | 10.0%) accounting for the largest median family size of 3.32 persons per family. On the other hand, married-couple families (181 | 72.7%) represent the smallest median family size with 2.63 persons per family.
| Family Type | # Families | Family Size |
| Married-Couple | 181 (72.7%) | 2.63 |
| Single Male/Father | 25 (10.0%) | 3.32 |
| Single Female/Mother | 43 (17.3%) | 3.00 |
| Total Families | 249 (100.0%) | 2.76 |
Median Household Size in Benton
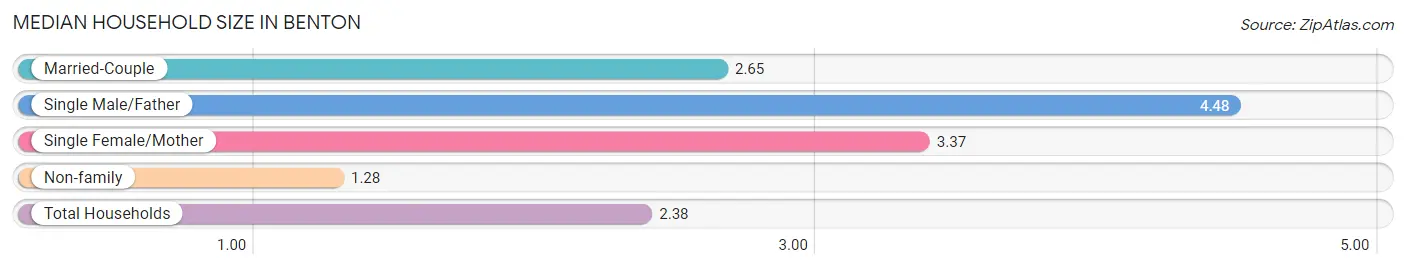
The median household size in Benton is 2.38 persons per household, with single male/father households (25 | 6.6%) accounting for the largest median household size of 4.48 persons per household. non-family households (129 | 34.1%) represent the smallest median household size with 1.28 persons per household.
| Household Type | # Households | Household Size |
| Married-Couple | 181 (47.9%) | 2.65 |
| Single Male/Father | 25 (6.6%) | 4.48 |
| Single Female/Mother | 43 (11.4%) | 3.37 |
| Non-family | 129 (34.1%) | 1.28 |
| Total Households | 378 (100.0%) | 2.38 |
Household Size by Marriage Status in Benton
Out of a total of 378 households in Benton, 249 (65.9%) are family households, while 129 (34.1%) are nonfamily households. The most numerous type of family households are 2-person households, comprising 125, and the most common type of nonfamily households are 1-person households, comprising 99.
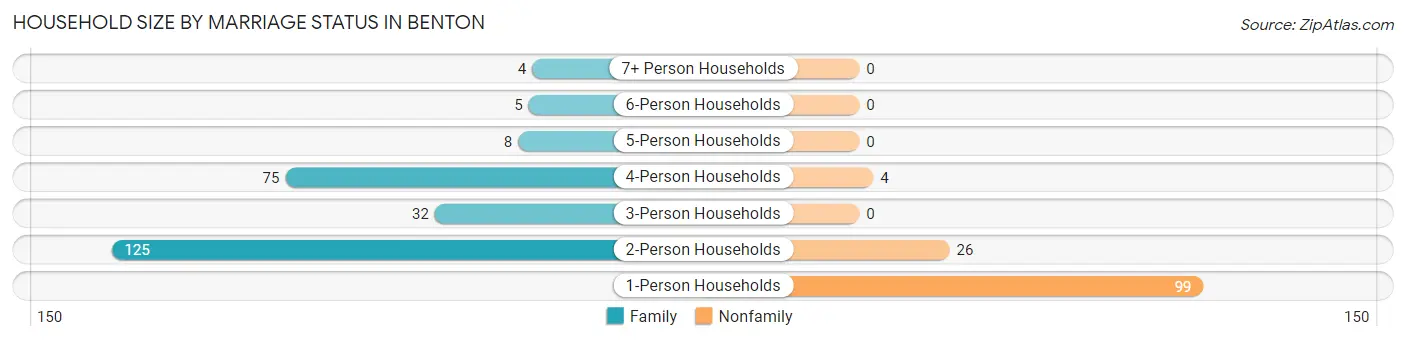
| Household Size | Family Households | Nonfamily Households |
| 1-Person Households | - | 99 (26.2%) |
| 2-Person Households | 125 (33.1%) | 26 (6.9%) |
| 3-Person Households | 32 (8.5%) | 0 (0.0%) |
| 4-Person Households | 75 (19.8%) | 4 (1.1%) |
| 5-Person Households | 8 (2.1%) | 0 (0.0%) |
| 6-Person Households | 5 (1.3%) | 0 (0.0%) |
| 7+ Person Households | 4 (1.1%) | 0 (0.0%) |
| Total | 249 (65.9%) | 129 (34.1%) |
Female Fertility in Benton
Fertility by Age in Benton
Average fertility rate in Benton is 40.0 births per 1,000 women. Women in the age bracket of 20 to 34 years have the highest fertility rate with 140.0 births per 1,000 women. Women in the age bracket of 20 to 34 years acount for 100.0% of all women with births.
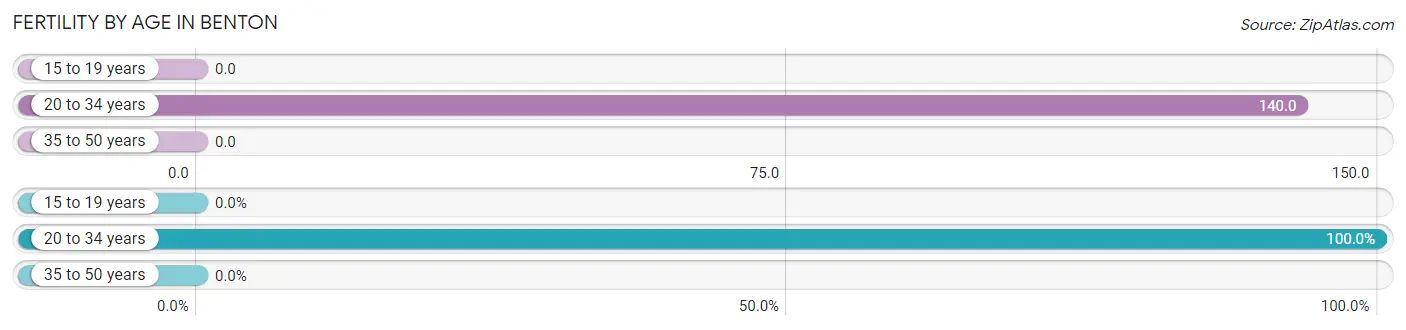
| Age Bracket | Women with Births | Births / 1,000 Women |
| 15 to 19 years | 0 (0.0%) | 0.0 |
| 20 to 34 years | 8 (100.0%) | 140.0 |
| 35 to 50 years | 0 (0.0%) | 0.0 |
| Total | 8 (100.0%) | 40.0 |
Fertility by Age by Marriage Status in Benton
50.0% of women with births (8) in Benton are married. The highest percentage of unmarried women with births falls into 20 to 34 years age bracket with 50.0% of them unmarried at the time of birth, while the lowest percentage of unmarried women with births belong to 20 to 34 years age bracket with 50.0% of them unmarried.
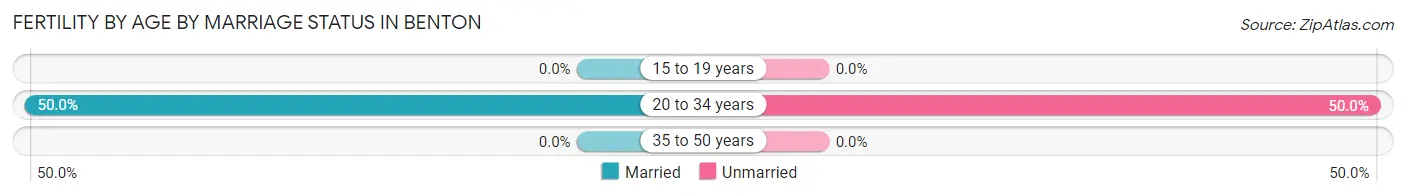
| Age Bracket | Married | Unmarried |
| 15 to 19 years | 0 (0.0%) | 0 (0.0%) |
| 20 to 34 years | 4 (50.0%) | 4 (50.0%) |
| 35 to 50 years | 0 (0.0%) | 0 (0.0%) |
| Total | 4 (50.0%) | 4 (50.0%) |
Fertility by Education in Benton
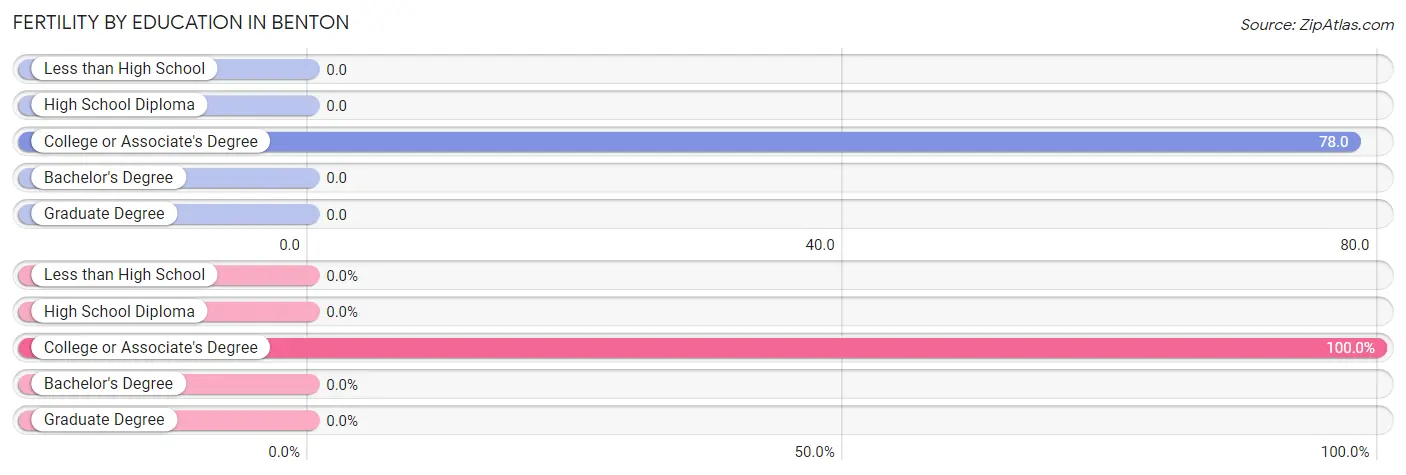
| Educational Attainment | Women with Births | Births / 1,000 Women |
| Less than High School | 0 (0.0%) | 0.0 |
| High School Diploma | 0 (0.0%) | 0.0 |
| College or Associate's Degree | 8 (100.0%) | 78.0 |
| Bachelor's Degree | 0 (0.0%) | 0.0 |
| Graduate Degree | 0 (0.0%) | 0.0 |
| Total | 8 (100.0%) | 40.0 |
Fertility by Education by Marriage Status in Benton
50.0% of women with births in Benton are unmarried. Women with the educational attainment of college or associate's degree are most likely to be married with 50.0% of them married at childbirth, while women with the educational attainment of college or associate's degree are least likely to be married with 50.0% of them unmarried at childbirth.
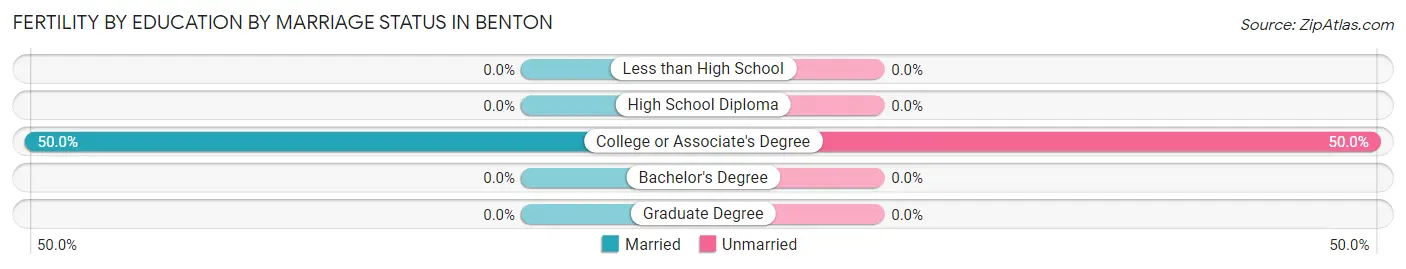
| Educational Attainment | Married | Unmarried |
| Less than High School | 0 (0.0%) | 0 (0.0%) |
| High School Diploma | 0 (0.0%) | 0 (0.0%) |
| College or Associate's Degree | 4 (50.0%) | 4 (50.0%) |
| Bachelor's Degree | 0 (0.0%) | 0 (0.0%) |
| Graduate Degree | 0 (0.0%) | 0 (0.0%) |
| Total | 4 (50.0%) | 4 (50.0%) |
Employment Characteristics in Benton
Employment by Class of Employer in Benton
Among the 434 employed individuals in Benton, private company employees (343 | 79.0%), not-for-profit organizations (36 | 8.3%), and self-employed (incorporated) (18 | 4.2%) make up the most common classes of employment.
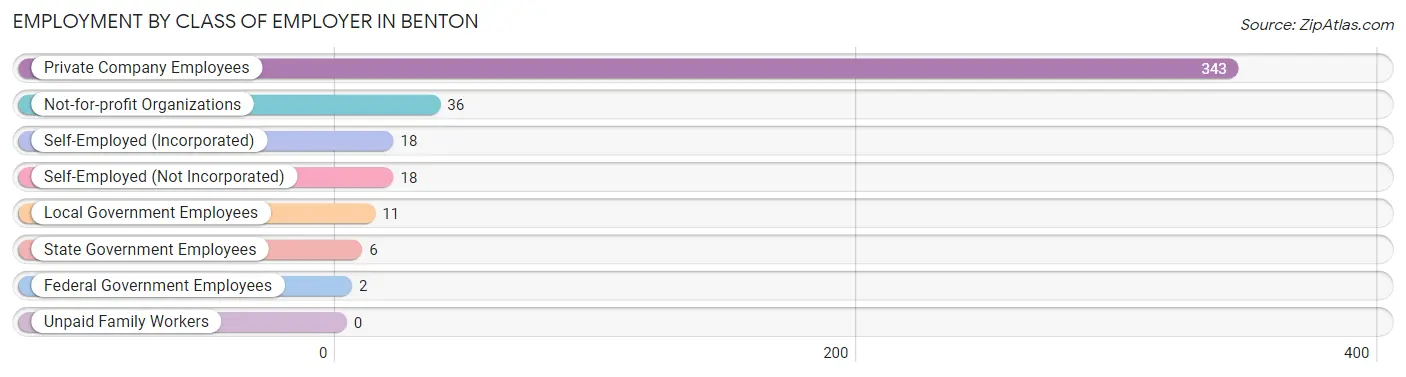
| Employer Class | # Employees | % Employees |
| Private Company Employees | 343 | 79.0% |
| Self-Employed (Incorporated) | 18 | 4.2% |
| Self-Employed (Not Incorporated) | 18 | 4.2% |
| Not-for-profit Organizations | 36 | 8.3% |
| Local Government Employees | 11 | 2.5% |
| State Government Employees | 6 | 1.4% |
| Federal Government Employees | 2 | 0.5% |
| Unpaid Family Workers | 0 | 0.0% |
| Total | 434 | 100.0% |
Employment Status by Age in Benton
According to the labor force statistics for Benton, out of the total population over 16 years of age (714), 64.1% or 458 individuals are in the labor force, with 3.9% or 18 of them unemployed. The age group with the highest labor force participation rate is 45 to 54 years, with 98.1% or 103 individuals in the labor force. Within the labor force, the 65 to 74 years age range has the highest percentage of unemployed individuals, with 23.2% or 13 of them being unemployed.
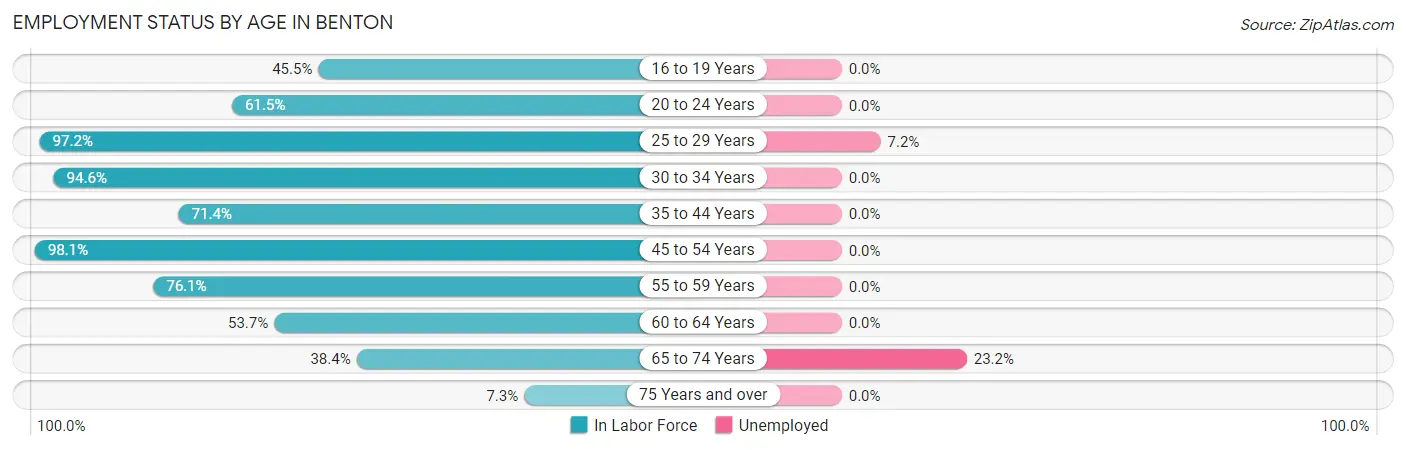
| Age Bracket | In Labor Force | Unemployed |
| 16 to 19 Years | 25 (45.5%) | 0 (0.0%) |
| 20 to 24 Years | 24 (61.5%) | 0 (0.0%) |
| 25 to 29 Years | 69 (97.2%) | 5 (7.2%) |
| 30 to 34 Years | 35 (94.6%) | 0 (0.0%) |
| 35 to 44 Years | 85 (71.4%) | 0 (0.0%) |
| 45 to 54 Years | 103 (98.1%) | 0 (0.0%) |
| 55 to 59 Years | 35 (76.1%) | 0 (0.0%) |
| 60 to 64 Years | 22 (53.7%) | 0 (0.0%) |
| 65 to 74 Years | 56 (38.4%) | 13 (23.2%) |
| 75 Years and over | 4 (7.3%) | 0 (0.0%) |
| Total | 458 (64.1%) | 18 (3.9%) |
Employment Status by Educational Attainment in Benton
According to labor force statistics for Benton, 83.3% of individuals (349) out of the total population between 25 and 64 years of age (419) are in the labor force, with 1.4% or 5 of them being unemployed. The group with the highest labor force participation rate are those with the educational attainment of less than high school, with 100.0% or 19 individuals in the labor force. Within the labor force, individuals with high school diploma education have the highest percentage of unemployment, with 5.3% or 5 of them being unemployed.
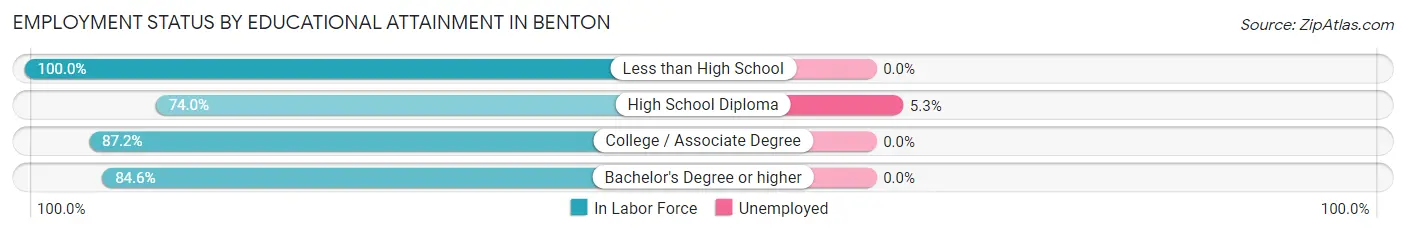
| Educational Attainment | In Labor Force | Unemployed |
| Less than High School | 19 (100.0%) | 0 (0.0%) |
| High School Diploma | 94 (74.0%) | 7 (5.3%) |
| College / Associate Degree | 170 (87.2%) | 0 (0.0%) |
| Bachelor's Degree or higher | 66 (84.6%) | 0 (0.0%) |
| Total | 349 (83.3%) | 6 (1.4%) |
Employment Occupations by Sex in Benton
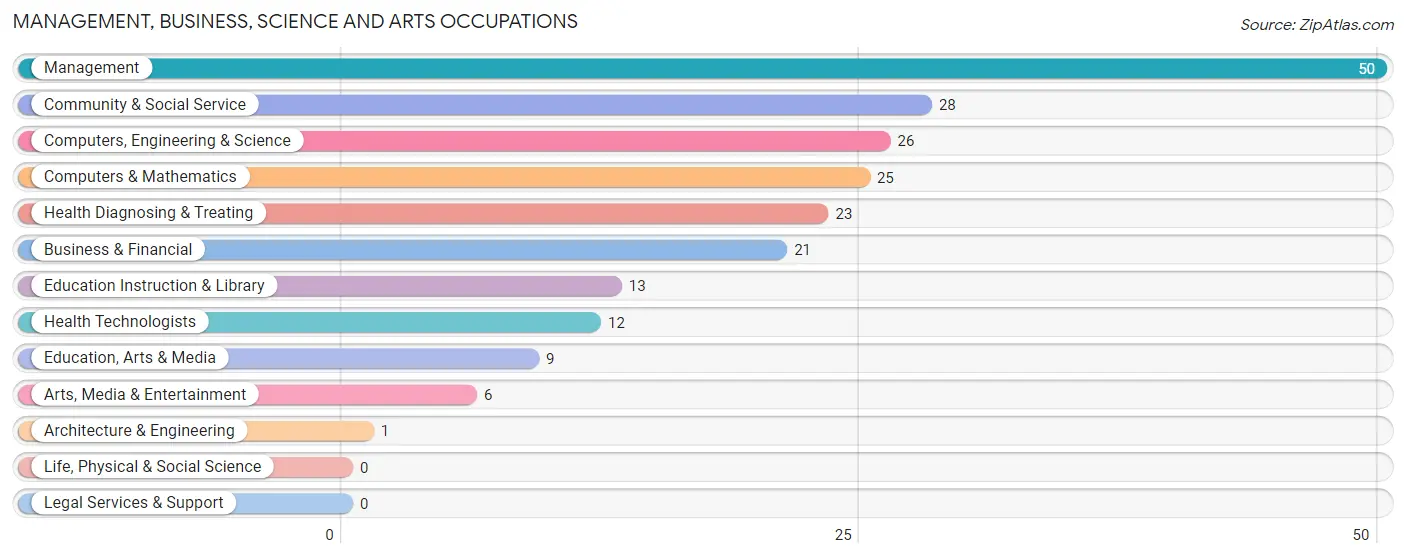
Management, Business, Science and Arts Occupations
The most common Management, Business, Science and Arts occupations in Benton are Management (50 | 11.4%), Community & Social Service (28 | 6.4%), Computers, Engineering & Science (26 | 5.9%), Computers & Mathematics (25 | 5.7%), and Health Diagnosing & Treating (23 | 5.2%).
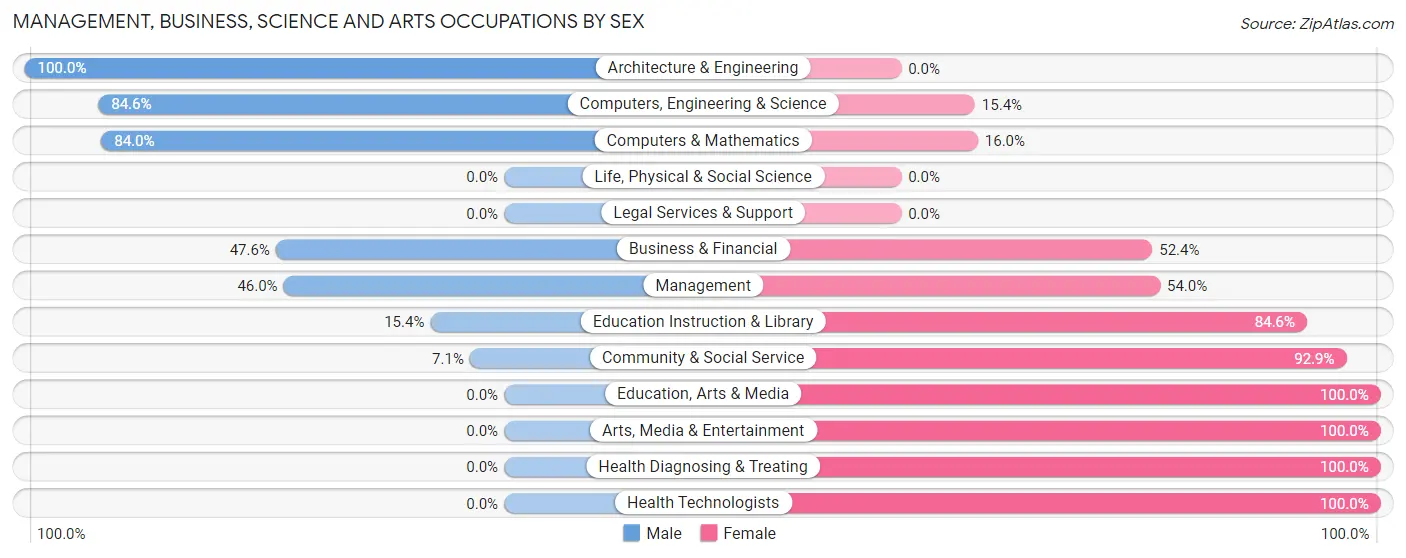
Management, Business, Science and Arts Occupations by Sex
Within the Management, Business, Science and Arts occupations in Benton, the most male-oriented occupations are Architecture & Engineering (100.0%), Computers, Engineering & Science (84.6%), and Computers & Mathematics (84.0%), while the most female-oriented occupations are Education, Arts & Media (100.0%), Arts, Media & Entertainment (100.0%), and Health Diagnosing & Treating (100.0%).
| Occupation | Male | Female |
| Management | 23 (46.0%) | 27 (54.0%) |
| Business & Financial | 10 (47.6%) | 11 (52.4%) |
| Computers, Engineering & Science | 22 (84.6%) | 4 (15.4%) |
| Computers & Mathematics | 21 (84.0%) | 4 (16.0%) |
| Architecture & Engineering | 1 (100.0%) | 0 (0.0%) |
| Life, Physical & Social Science | 0 (0.0%) | 0 (0.0%) |
| Community & Social Service | 2 (7.1%) | 26 (92.9%) |
| Education, Arts & Media | 0 (0.0%) | 9 (100.0%) |
| Legal Services & Support | 0 (0.0%) | 0 (0.0%) |
| Education Instruction & Library | 2 (15.4%) | 11 (84.6%) |
| Arts, Media & Entertainment | 0 (0.0%) | 6 (100.0%) |
| Health Diagnosing & Treating | 0 (0.0%) | 23 (100.0%) |
| Health Technologists | 0 (0.0%) | 12 (100.0%) |
| Total (Category) | 57 (38.5%) | 91 (61.5%) |
| Total (Overall) | 244 (55.4%) | 196 (44.6%) |
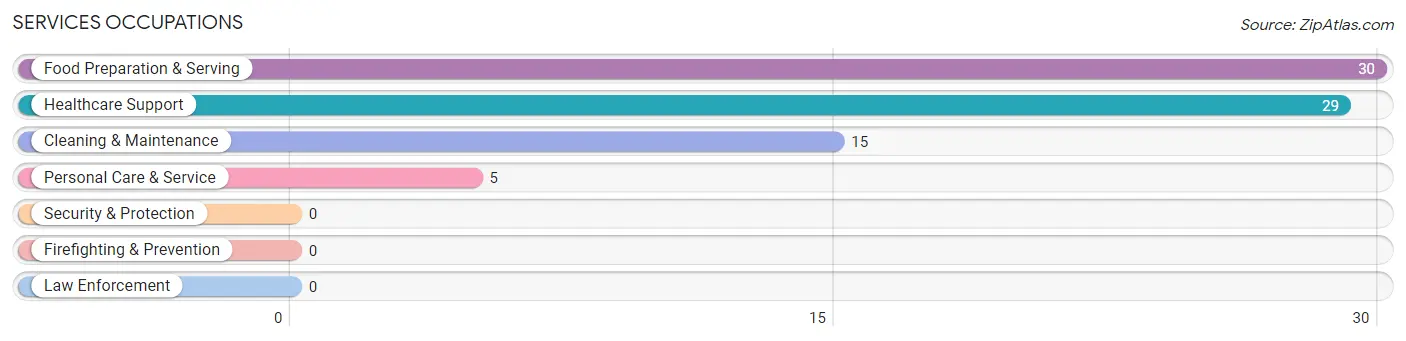
Services Occupations
The most common Services occupations in Benton are Food Preparation & Serving (30 | 6.8%), Healthcare Support (29 | 6.6%), Cleaning & Maintenance (15 | 3.4%), and Personal Care & Service (5 | 1.1%).
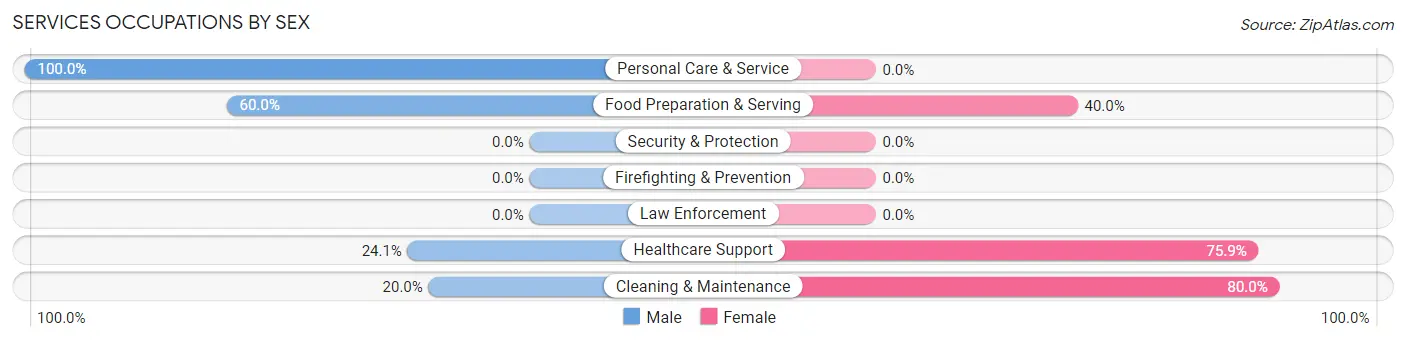
Services Occupations by Sex
Within the Services occupations in Benton, the most male-oriented occupations are Personal Care & Service (100.0%), Food Preparation & Serving (60.0%), and Healthcare Support (24.1%), while the most female-oriented occupations are Cleaning & Maintenance (80.0%), Healthcare Support (75.9%), and Food Preparation & Serving (40.0%).
| Occupation | Male | Female |
| Healthcare Support | 7 (24.1%) | 22 (75.9%) |
| Security & Protection | 0 (0.0%) | 0 (0.0%) |
| Firefighting & Prevention | 0 (0.0%) | 0 (0.0%) |
| Law Enforcement | 0 (0.0%) | 0 (0.0%) |
| Food Preparation & Serving | 18 (60.0%) | 12 (40.0%) |
| Cleaning & Maintenance | 3 (20.0%) | 12 (80.0%) |
| Personal Care & Service | 5 (100.0%) | 0 (0.0%) |
| Total (Category) | 33 (41.8%) | 46 (58.2%) |
| Total (Overall) | 244 (55.4%) | 196 (44.6%) |
Sales and Office Occupations
The most common Sales and Office occupations in Benton are Sales & Related (36 | 8.2%), and Office & Administration (23 | 5.2%).
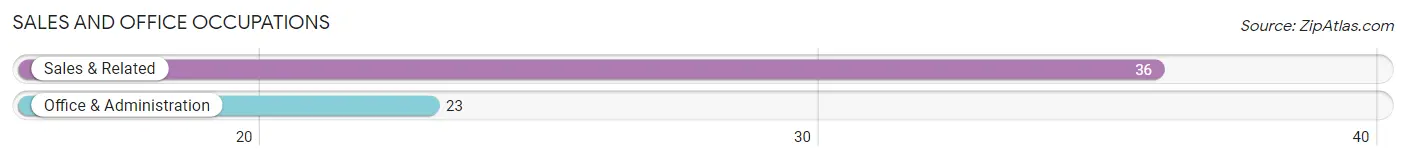
Sales and Office Occupations by Sex
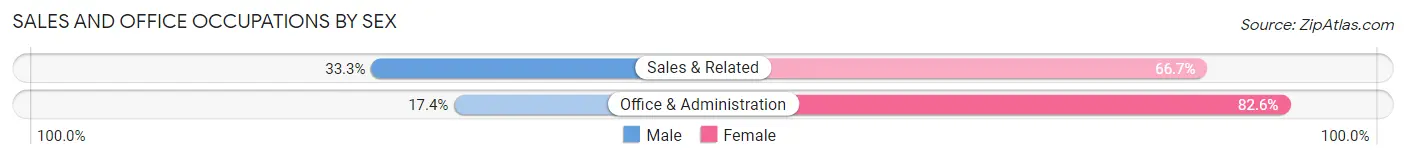
| Occupation | Male | Female |
| Sales & Related | 12 (33.3%) | 24 (66.7%) |
| Office & Administration | 4 (17.4%) | 19 (82.6%) |
| Total (Category) | 16 (27.1%) | 43 (72.9%) |
| Total (Overall) | 244 (55.4%) | 196 (44.6%) |
Natural Resources, Construction and Maintenance Occupations
The most common Natural Resources, Construction and Maintenance occupations in Benton are Installation, Maintenance & Repair (35 | 8.0%), Construction & Extraction (11 | 2.5%), and Farming, Fishing & Forestry (5 | 1.1%).
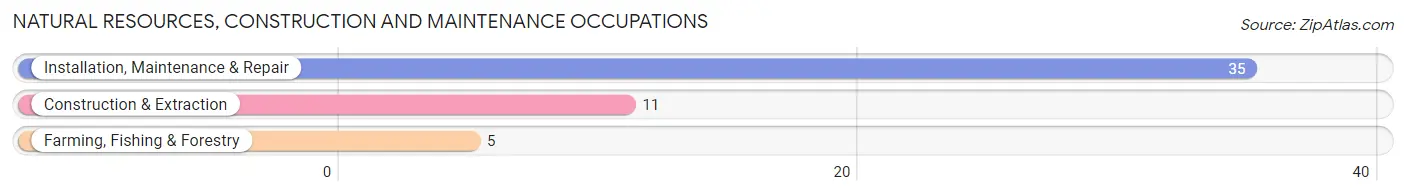
Natural Resources, Construction and Maintenance Occupations by Sex
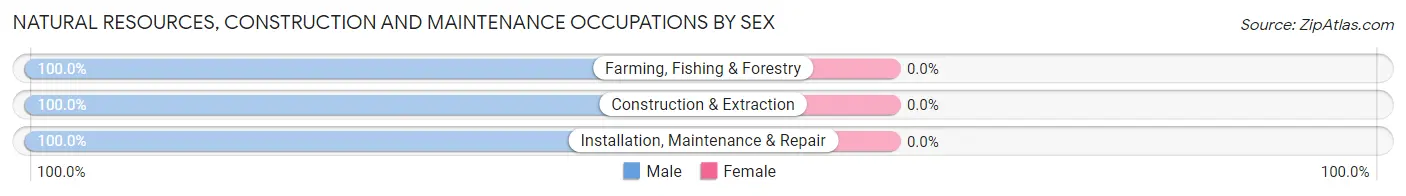
| Occupation | Male | Female |
| Farming, Fishing & Forestry | 5 (100.0%) | 0 (0.0%) |
| Construction & Extraction | 11 (100.0%) | 0 (0.0%) |
| Installation, Maintenance & Repair | 35 (100.0%) | 0 (0.0%) |
| Total (Category) | 51 (100.0%) | 0 (0.0%) |
| Total (Overall) | 244 (55.4%) | 196 (44.6%) |
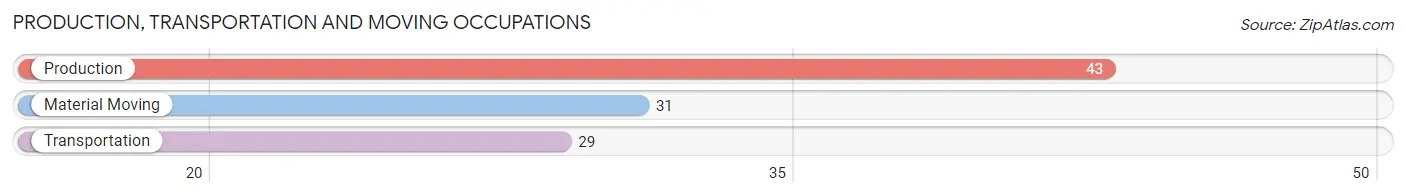
Production, Transportation and Moving Occupations
The most common Production, Transportation and Moving occupations in Benton are Production (43 | 9.8%), Material Moving (31 | 7.0%), and Transportation (29 | 6.6%).
Production, Transportation and Moving Occupations by Sex
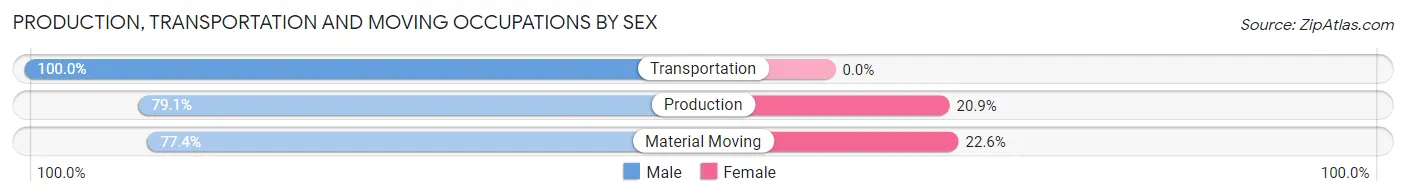
| Occupation | Male | Female |
| Production | 34 (79.1%) | 9 (20.9%) |
| Transportation | 29 (100.0%) | 0 (0.0%) |
| Material Moving | 24 (77.4%) | 7 (22.6%) |
| Total (Category) | 87 (84.5%) | 16 (15.5%) |
| Total (Overall) | 244 (55.4%) | 196 (44.6%) |
Employment Industries by Sex in Benton
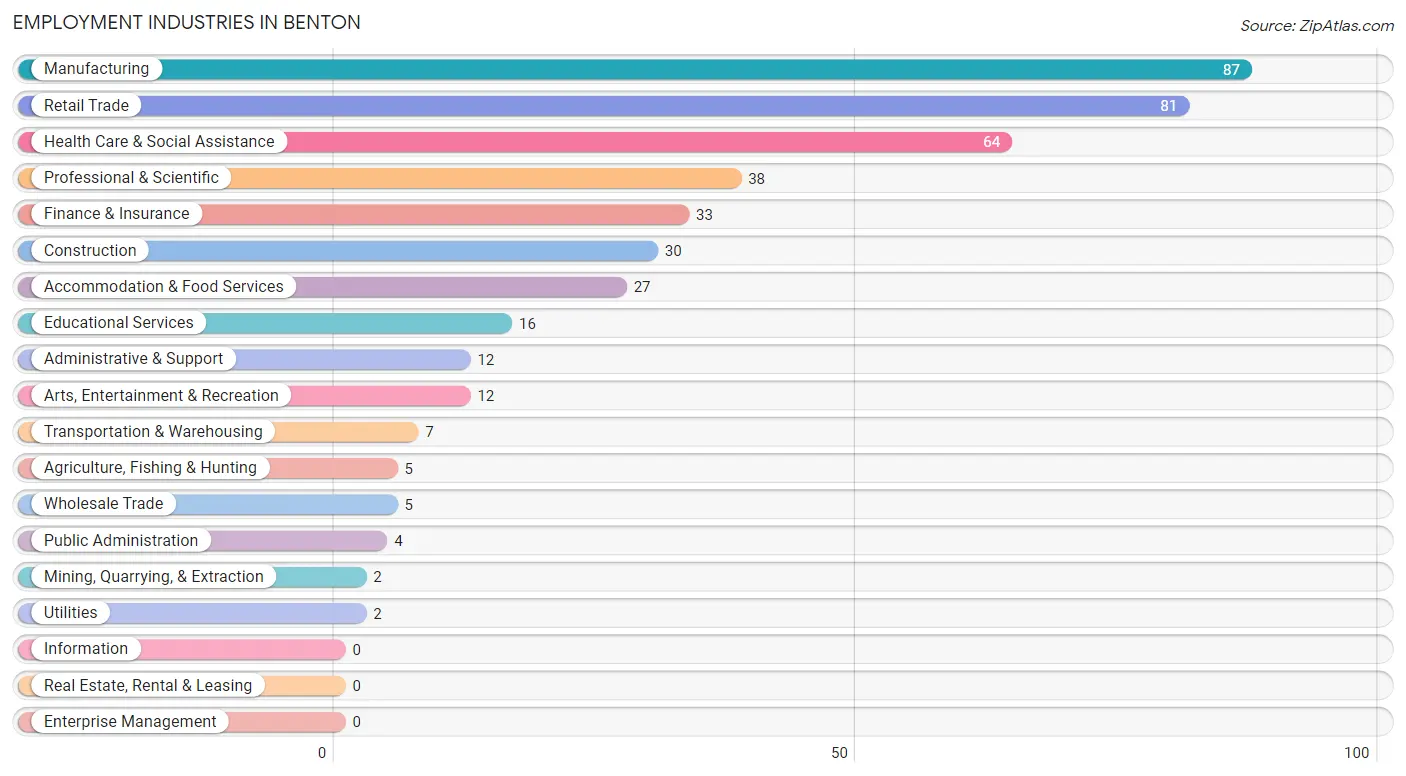
Employment Industries in Benton
The major employment industries in Benton include Manufacturing (87 | 19.8%), Retail Trade (81 | 18.4%), Health Care & Social Assistance (64 | 14.5%), Professional & Scientific (38 | 8.6%), and Finance & Insurance (33 | 7.5%).
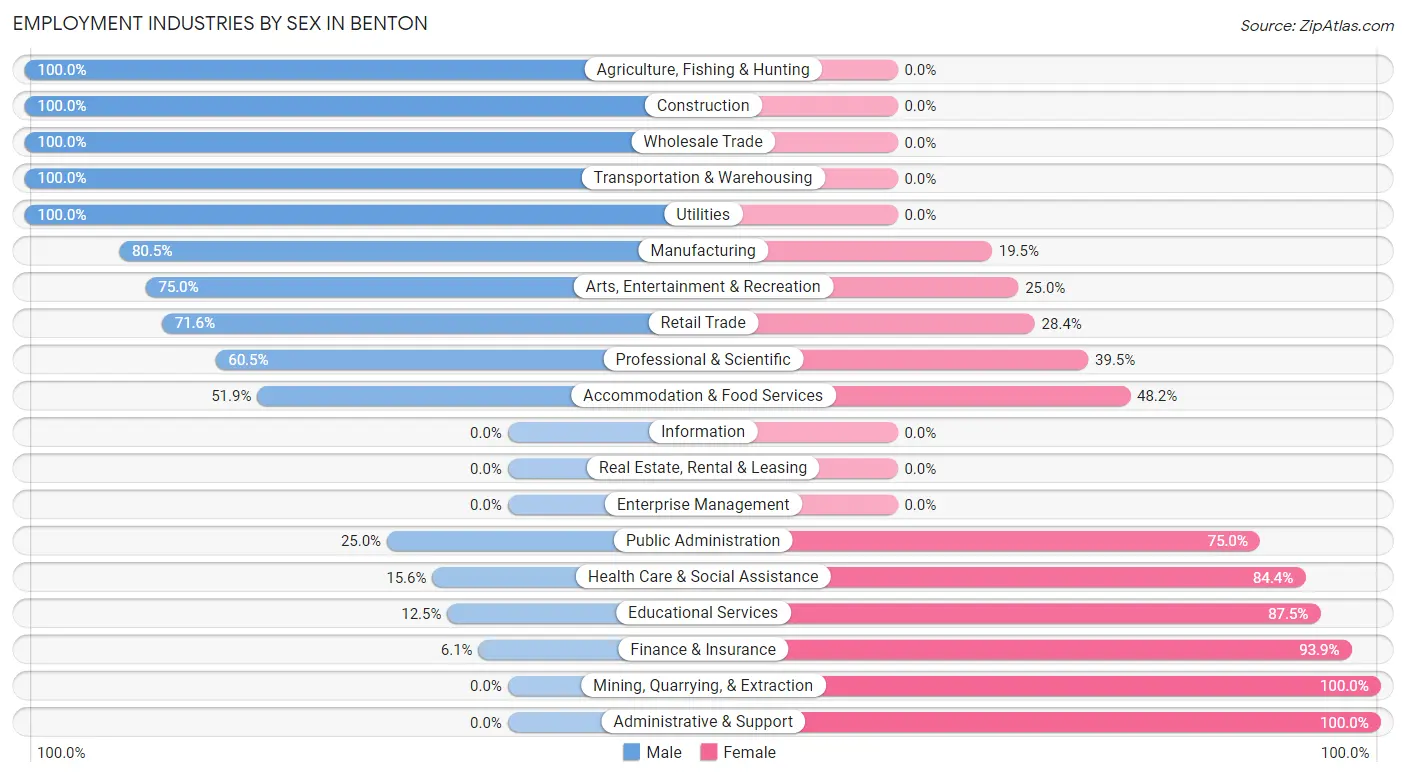
Employment Industries by Sex in Benton
The Benton industries that see more men than women are Agriculture, Fishing & Hunting (100.0%), Construction (100.0%), and Wholesale Trade (100.0%), whereas the industries that tend to have a higher number of women are Mining, Quarrying, & Extraction (100.0%), Administrative & Support (100.0%), and Finance & Insurance (93.9%).
| Industry | Male | Female |
| Agriculture, Fishing & Hunting | 5 (100.0%) | 0 (0.0%) |
| Mining, Quarrying, & Extraction | 0 (0.0%) | 2 (100.0%) |
| Construction | 30 (100.0%) | 0 (0.0%) |
| Manufacturing | 70 (80.5%) | 17 (19.5%) |
| Wholesale Trade | 5 (100.0%) | 0 (0.0%) |
| Retail Trade | 58 (71.6%) | 23 (28.4%) |
| Transportation & Warehousing | 7 (100.0%) | 0 (0.0%) |
| Utilities | 2 (100.0%) | 0 (0.0%) |
| Information | 0 (0.0%) | 0 (0.0%) |
| Finance & Insurance | 2 (6.1%) | 31 (93.9%) |
| Real Estate, Rental & Leasing | 0 (0.0%) | 0 (0.0%) |
| Professional & Scientific | 23 (60.5%) | 15 (39.5%) |
| Enterprise Management | 0 (0.0%) | 0 (0.0%) |
| Administrative & Support | 0 (0.0%) | 12 (100.0%) |
| Educational Services | 2 (12.5%) | 14 (87.5%) |
| Health Care & Social Assistance | 10 (15.6%) | 54 (84.4%) |
| Arts, Entertainment & Recreation | 9 (75.0%) | 3 (25.0%) |
| Accommodation & Food Services | 14 (51.8%) | 13 (48.1%) |
| Public Administration | 1 (25.0%) | 3 (75.0%) |
| Total | 244 (55.4%) | 196 (44.6%) |
Education in Benton
School Enrollment in Benton
The most common levels of schooling among the 223 students in Benton are high school (67 | 30.0%), elementary school (53 | 23.8%), and middle school (39 | 17.5%).
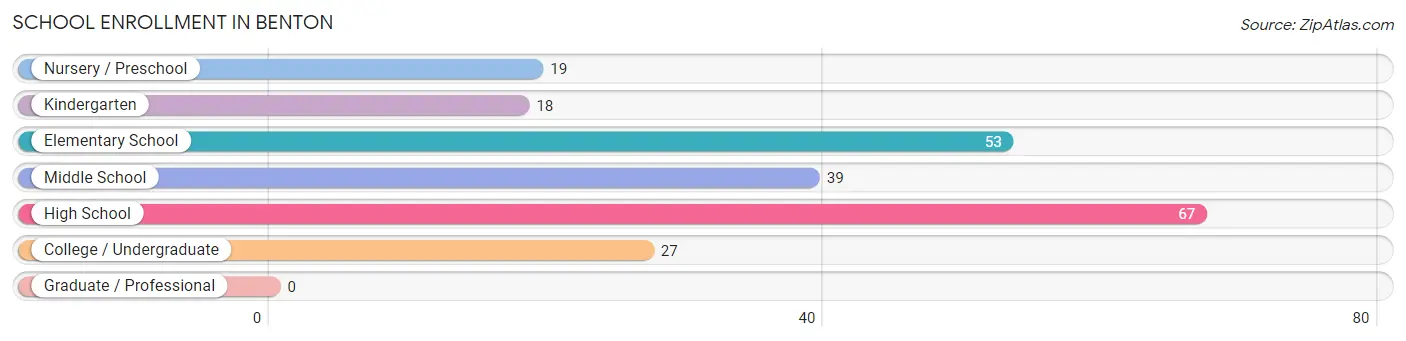
| School Level | # Students | % Students |
| Nursery / Preschool | 19 | 8.5% |
| Kindergarten | 18 | 8.1% |
| Elementary School | 53 | 23.8% |
| Middle School | 39 | 17.5% |
| High School | 67 | 30.0% |
| College / Undergraduate | 27 | 12.1% |
| Graduate / Professional | 0 | 0.0% |
| Total | 223 | 100.0% |
School Enrollment by Age by Funding Source in Benton
Out of a total of 223 students who are enrolled in schools in Benton, 60 (26.9%) attend a private institution, while the remaining 163 (73.1%) are enrolled in public schools. The age group of 3 to 4 year olds has the highest likelihood of being enrolled in private schools, with 14 (73.7% in the age bracket) enrolled. Conversely, the age group of 15 to 17 year olds has the lowest likelihood of being enrolled in a private school, with 67 (100.0% in the age bracket) attending a public institution.
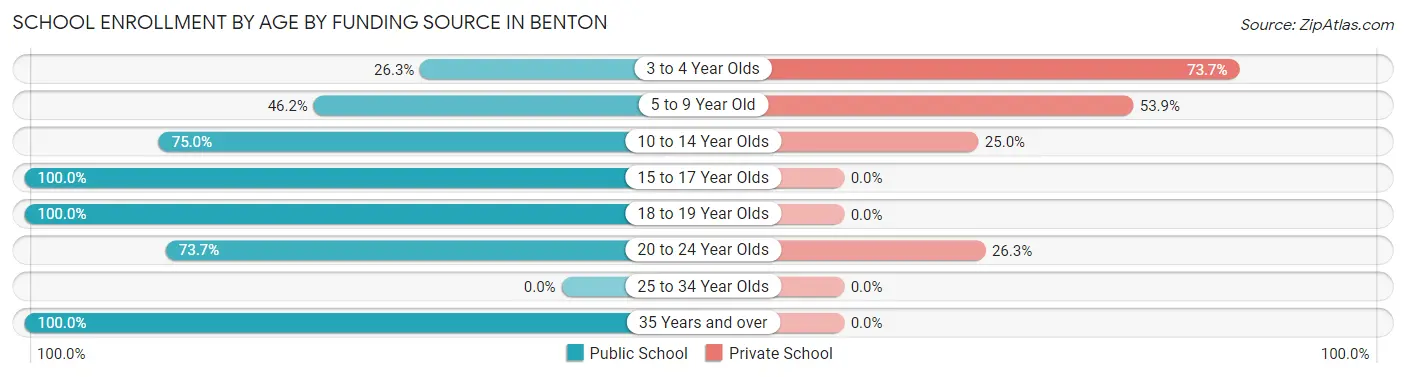
| Age Bracket | Public School | Private School |
| 3 to 4 Year Olds | 5 (26.3%) | 14 (73.7%) |
| 5 to 9 Year Old | 24 (46.2%) | 28 (53.8%) |
| 10 to 14 Year Olds | 39 (75.0%) | 13 (25.0%) |
| 15 to 17 Year Olds | 67 (100.0%) | 0 (0.0%) |
| 18 to 19 Year Olds | 9 (100.0%) | 0 (0.0%) |
| 20 to 24 Year Olds | 14 (73.7%) | 5 (26.3%) |
| 25 to 34 Year Olds | 0 (0.0%) | 0 (0.0%) |
| 35 Years and over | 5 (100.0%) | 0 (0.0%) |
| Total | 163 (73.1%) | 60 (26.9%) |
Educational Attainment by Field of Study in Benton
Business (29 | 26.1%), education (26 | 23.4%), science & technology (18 | 16.2%), arts & humanities (8 | 7.2%), and engineering (7 | 6.3%) are the most common fields of study among 111 individuals in Benton who have obtained a bachelor's degree or higher.
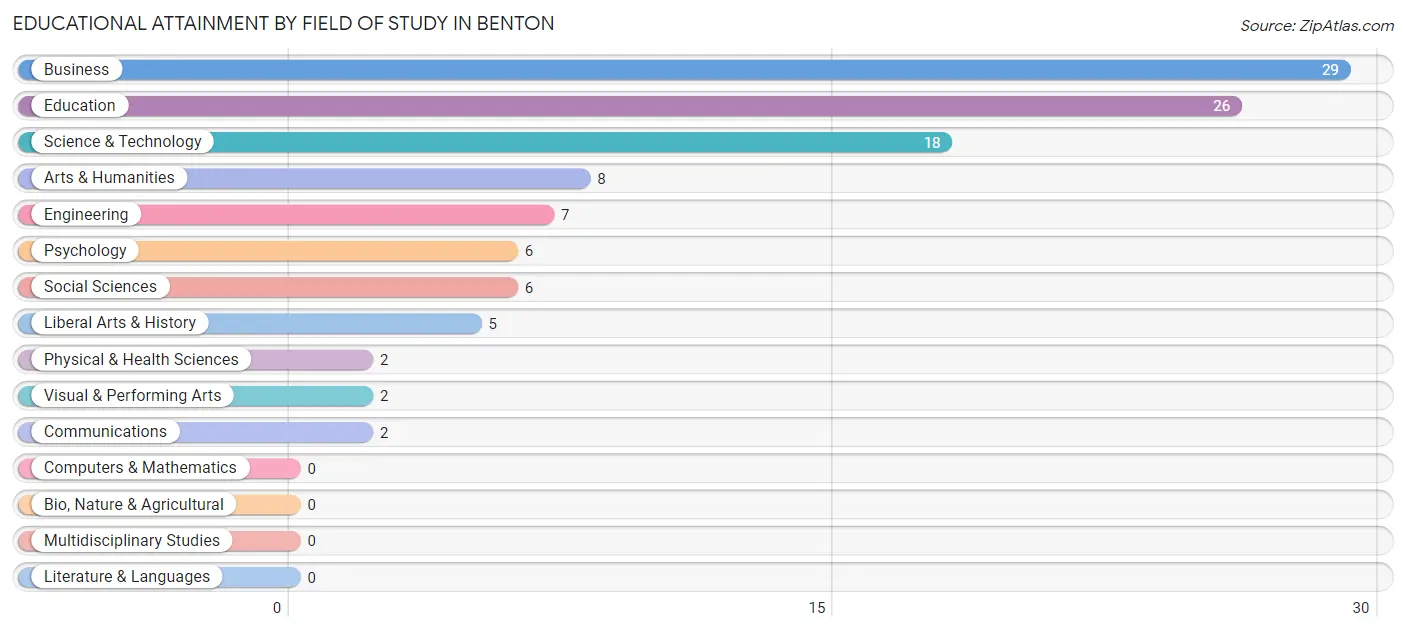
| Field of Study | # Graduates | % Graduates |
| Computers & Mathematics | 0 | 0.0% |
| Bio, Nature & Agricultural | 0 | 0.0% |
| Physical & Health Sciences | 2 | 1.8% |
| Psychology | 6 | 5.4% |
| Social Sciences | 6 | 5.4% |
| Engineering | 7 | 6.3% |
| Multidisciplinary Studies | 0 | 0.0% |
| Science & Technology | 18 | 16.2% |
| Business | 29 | 26.1% |
| Education | 26 | 23.4% |
| Literature & Languages | 0 | 0.0% |
| Liberal Arts & History | 5 | 4.5% |
| Visual & Performing Arts | 2 | 1.8% |
| Communications | 2 | 1.8% |
| Arts & Humanities | 8 | 7.2% |
| Total | 111 | 100.0% |
Transportation & Commute in Benton
Vehicle Availability by Sex in Benton
The most prevalent vehicle ownership categories in Benton are males with 2 vehicles (104, accounting for 43.7%) and females with 2 vehicles (79, making up 53.1%).
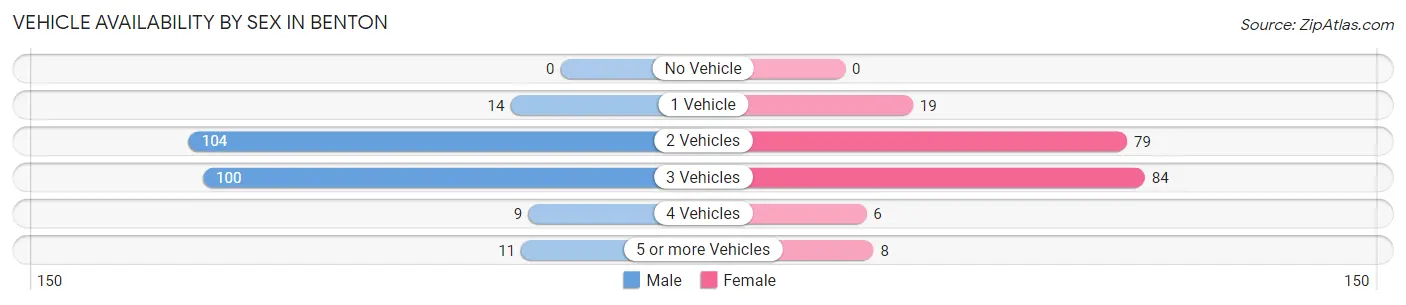
| Vehicles Available | Male | Female |
| No Vehicle | 0 (0.0%) | 0 (0.0%) |
| 1 Vehicle | 14 (5.9%) | 19 (9.7%) |
| 2 Vehicles | 104 (43.7%) | 79 (40.3%) |
| 3 Vehicles | 100 (42.0%) | 84 (42.9%) |
| 4 Vehicles | 9 (3.8%) | 6 (3.1%) |
| 5 or more Vehicles | 11 (4.6%) | 8 (4.1%) |
| Total | 238 (100.0%) | 196 (100.0%) |
Commute Time in Benton
The most frequently occuring commute durations in Benton are 20 to 24 minutes (102 commuters, 24.3%), 30 to 34 minutes (75 commuters, 17.9%), and 5 to 9 minutes (67 commuters, 16.0%).
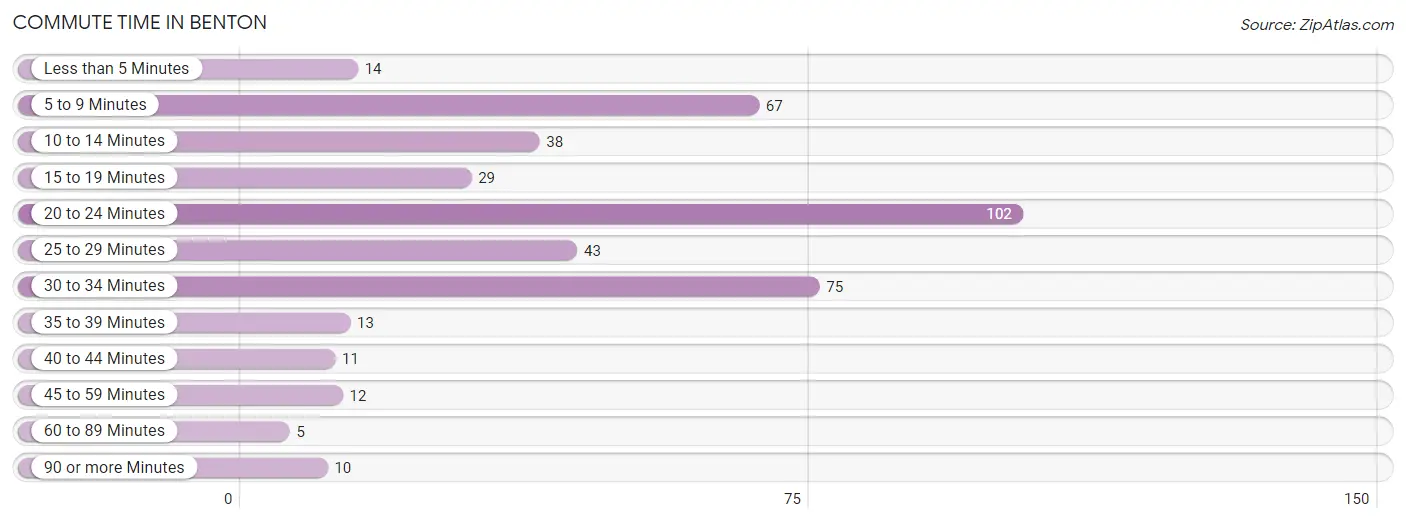
| Commute Time | # Commuters | % Commuters |
| Less than 5 Minutes | 14 | 3.3% |
| 5 to 9 Minutes | 67 | 16.0% |
| 10 to 14 Minutes | 38 | 9.1% |
| 15 to 19 Minutes | 29 | 6.9% |
| 20 to 24 Minutes | 102 | 24.3% |
| 25 to 29 Minutes | 43 | 10.3% |
| 30 to 34 Minutes | 75 | 17.9% |
| 35 to 39 Minutes | 13 | 3.1% |
| 40 to 44 Minutes | 11 | 2.6% |
| 45 to 59 Minutes | 12 | 2.9% |
| 60 to 89 Minutes | 5 | 1.2% |
| 90 or more Minutes | 10 | 2.4% |
Commute Time by Sex in Benton
The most common commute times in Benton are 20 to 24 minutes (69 commuters, 30.4%) for males and 20 to 24 minutes (33 commuters, 17.2%) for females.
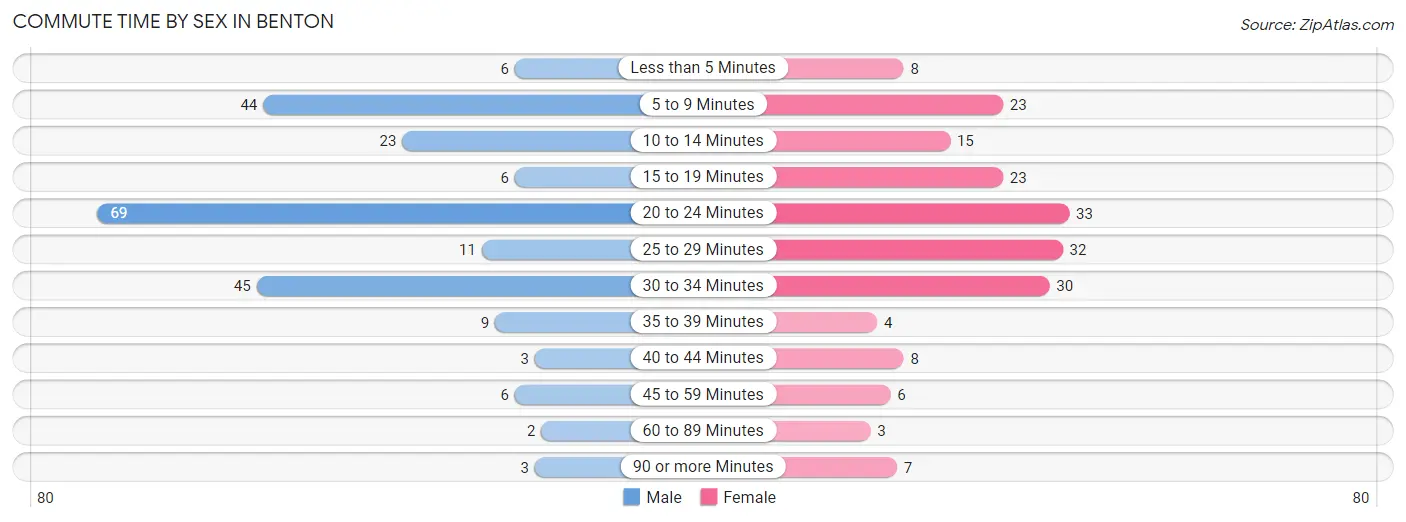
| Commute Time | Male | Female |
| Less than 5 Minutes | 6 (2.6%) | 8 (4.2%) |
| 5 to 9 Minutes | 44 (19.4%) | 23 (12.0%) |
| 10 to 14 Minutes | 23 (10.1%) | 15 (7.8%) |
| 15 to 19 Minutes | 6 (2.6%) | 23 (12.0%) |
| 20 to 24 Minutes | 69 (30.4%) | 33 (17.2%) |
| 25 to 29 Minutes | 11 (4.9%) | 32 (16.7%) |
| 30 to 34 Minutes | 45 (19.8%) | 30 (15.6%) |
| 35 to 39 Minutes | 9 (4.0%) | 4 (2.1%) |
| 40 to 44 Minutes | 3 (1.3%) | 8 (4.2%) |
| 45 to 59 Minutes | 6 (2.6%) | 6 (3.1%) |
| 60 to 89 Minutes | 2 (0.9%) | 3 (1.6%) |
| 90 or more Minutes | 3 (1.3%) | 7 (3.6%) |
Time of Departure to Work by Sex in Benton
The most frequent times of departure to work in Benton are 7:00 AM to 7:29 AM (55, 24.2%) for males and 7:00 AM to 7:29 AM (30, 15.6%) for females.
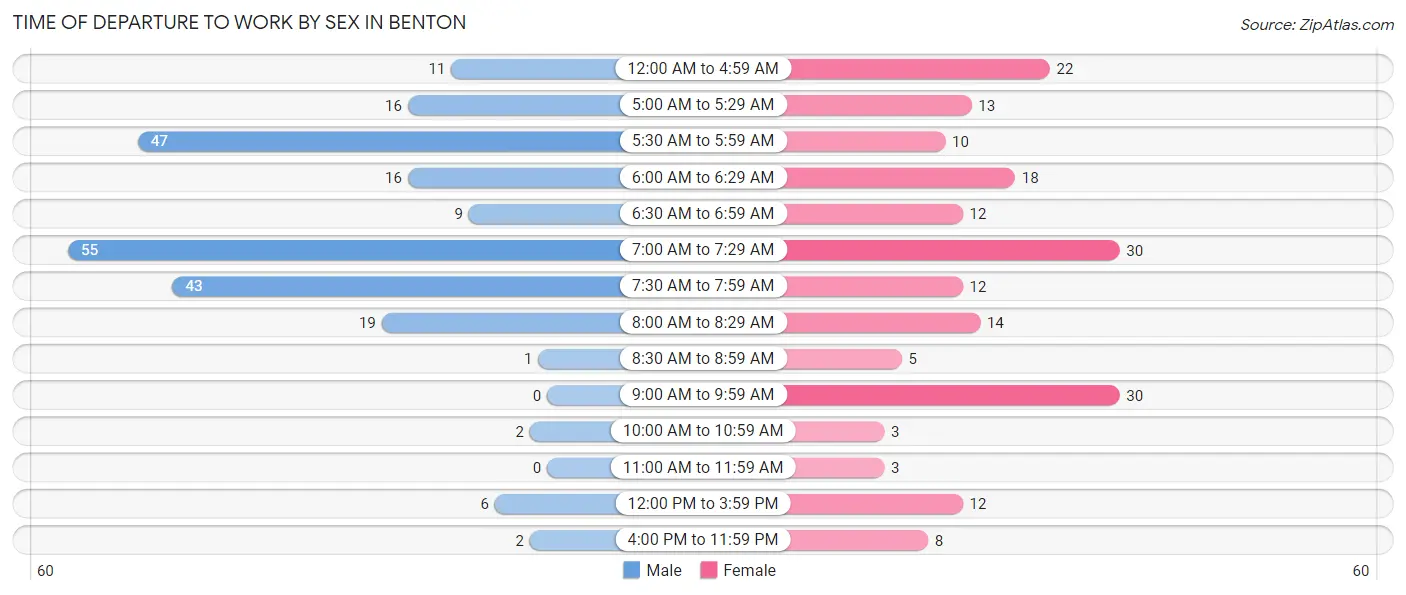
| Time of Departure | Male | Female |
| 12:00 AM to 4:59 AM | 11 (4.9%) | 22 (11.5%) |
| 5:00 AM to 5:29 AM | 16 (7.0%) | 13 (6.8%) |
| 5:30 AM to 5:59 AM | 47 (20.7%) | 10 (5.2%) |
| 6:00 AM to 6:29 AM | 16 (7.0%) | 18 (9.4%) |
| 6:30 AM to 6:59 AM | 9 (4.0%) | 12 (6.2%) |
| 7:00 AM to 7:29 AM | 55 (24.2%) | 30 (15.6%) |
| 7:30 AM to 7:59 AM | 43 (18.9%) | 12 (6.2%) |
| 8:00 AM to 8:29 AM | 19 (8.4%) | 14 (7.3%) |
| 8:30 AM to 8:59 AM | 1 (0.4%) | 5 (2.6%) |
| 9:00 AM to 9:59 AM | 0 (0.0%) | 30 (15.6%) |
| 10:00 AM to 10:59 AM | 2 (0.9%) | 3 (1.6%) |
| 11:00 AM to 11:59 AM | 0 (0.0%) | 3 (1.6%) |
| 12:00 PM to 3:59 PM | 6 (2.6%) | 12 (6.2%) |
| 4:00 PM to 11:59 PM | 2 (0.9%) | 8 (4.2%) |
| Total | 227 (100.0%) | 192 (100.0%) |
Housing Occupancy in Benton
Occupancy by Ownership in Benton
Of the total 378 dwellings in Benton, owner-occupied units account for 273 (72.2%), while renter-occupied units make up 105 (27.8%).
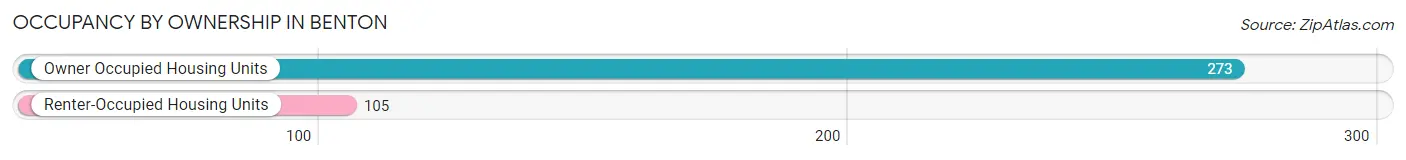
| Occupancy | # Housing Units | % Housing Units |
| Owner Occupied Housing Units | 273 | 72.2% |
| Renter-Occupied Housing Units | 105 | 27.8% |
| Total Occupied Housing Units | 378 | 100.0% |
Occupancy by Household Size in Benton
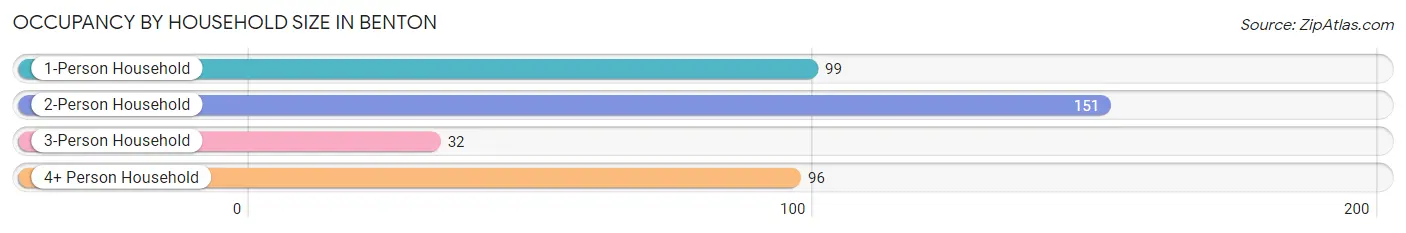
| Household Size | # Housing Units | % Housing Units |
| 1-Person Household | 99 | 26.2% |
| 2-Person Household | 151 | 40.0% |
| 3-Person Household | 32 | 8.5% |
| 4+ Person Household | 96 | 25.4% |
| Total Housing Units | 378 | 100.0% |
Occupancy by Ownership by Household Size in Benton
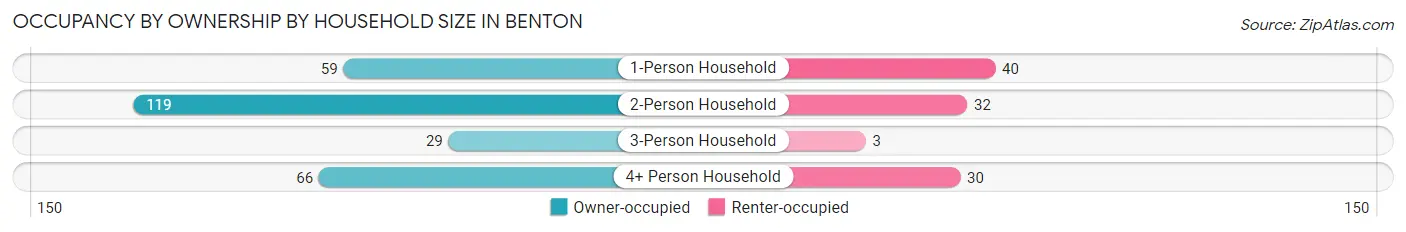
| Household Size | Owner-occupied | Renter-occupied |
| 1-Person Household | 59 (59.6%) | 40 (40.4%) |
| 2-Person Household | 119 (78.8%) | 32 (21.2%) |
| 3-Person Household | 29 (90.6%) | 3 (9.4%) |
| 4+ Person Household | 66 (68.8%) | 30 (31.2%) |
| Total Housing Units | 273 (72.2%) | 105 (27.8%) |
Occupancy by Educational Attainment in Benton
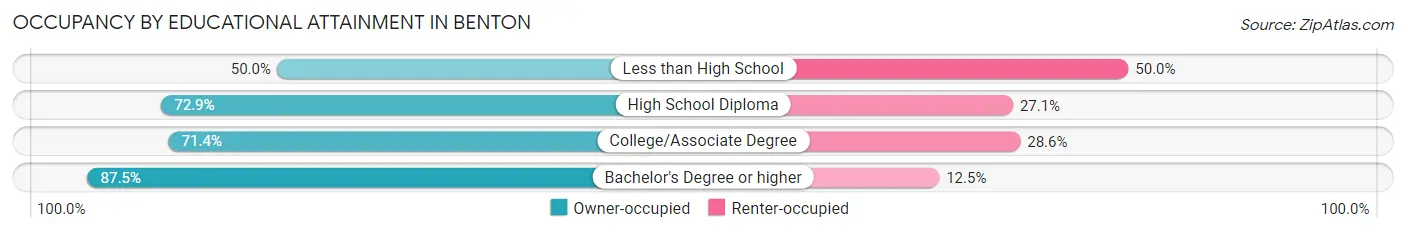
| Household Size | Owner-occupied | Renter-occupied |
| Less than High School | 18 (50.0%) | 18 (50.0%) |
| High School Diploma | 86 (72.9%) | 32 (27.1%) |
| College/Associate Degree | 120 (71.4%) | 48 (28.6%) |
| Bachelor's Degree or higher | 49 (87.5%) | 7 (12.5%) |
Occupancy by Age of Householder in Benton
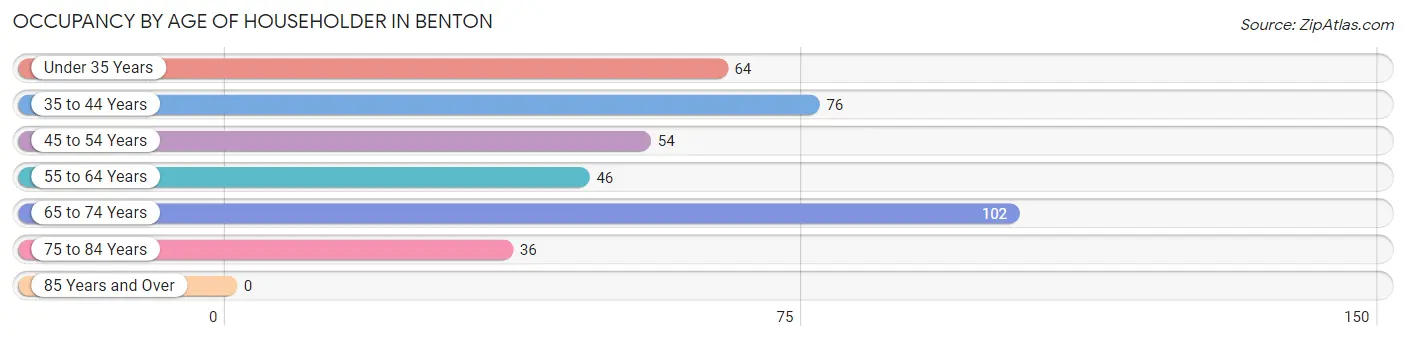
| Age Bracket | # Households | % Households |
| Under 35 Years | 64 | 16.9% |
| 35 to 44 Years | 76 | 20.1% |
| 45 to 54 Years | 54 | 14.3% |
| 55 to 64 Years | 46 | 12.2% |
| 65 to 74 Years | 102 | 27.0% |
| 75 to 84 Years | 36 | 9.5% |
| 85 Years and Over | 0 | 0.0% |
| Total | 378 | 100.0% |
Housing Finances in Benton
Median Income by Occupancy in Benton
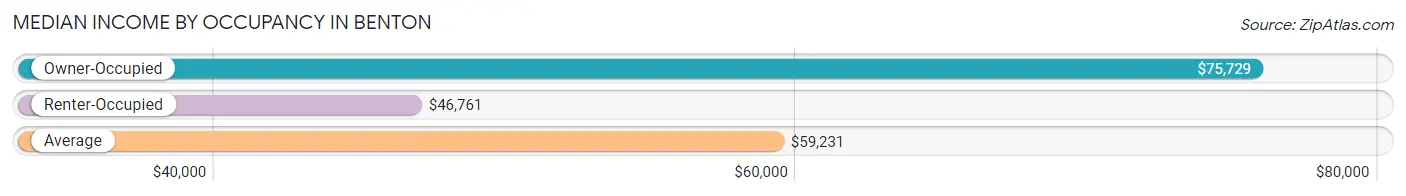
| Occupancy Type | # Households | Median Income |
| Owner-Occupied | 273 (72.2%) | $75,729 |
| Renter-Occupied | 105 (27.8%) | $46,761 |
| Average | 378 (100.0%) | $59,231 |
Occupancy by Householder Income Bracket in Benton
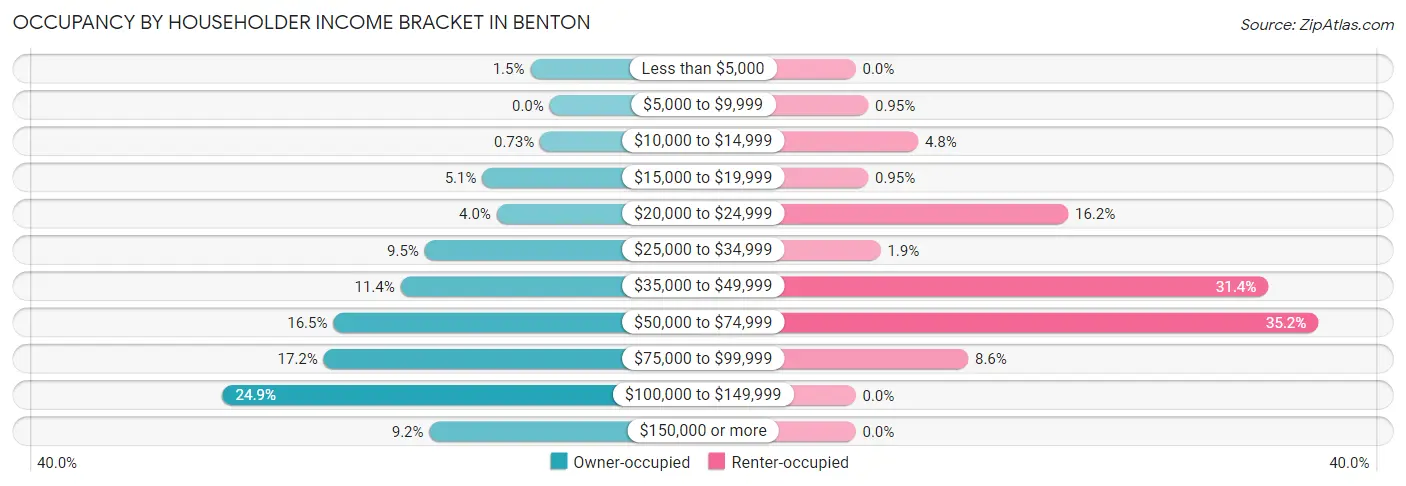
| Income Bracket | Owner-occupied | Renter-occupied |
| Less than $5,000 | 4 (1.5%) | 0 (0.0%) |
| $5,000 to $9,999 | 0 (0.0%) | 1 (0.9%) |
| $10,000 to $14,999 | 2 (0.7%) | 5 (4.8%) |
| $15,000 to $19,999 | 14 (5.1%) | 1 (0.9%) |
| $20,000 to $24,999 | 11 (4.0%) | 17 (16.2%) |
| $25,000 to $34,999 | 26 (9.5%) | 2 (1.9%) |
| $35,000 to $49,999 | 31 (11.4%) | 33 (31.4%) |
| $50,000 to $74,999 | 45 (16.5%) | 37 (35.2%) |
| $75,000 to $99,999 | 47 (17.2%) | 9 (8.6%) |
| $100,000 to $149,999 | 68 (24.9%) | 0 (0.0%) |
| $150,000 or more | 25 (9.2%) | 0 (0.0%) |
| Total | 273 (100.0%) | 105 (100.0%) |
Monthly Housing Cost Tiers in Benton
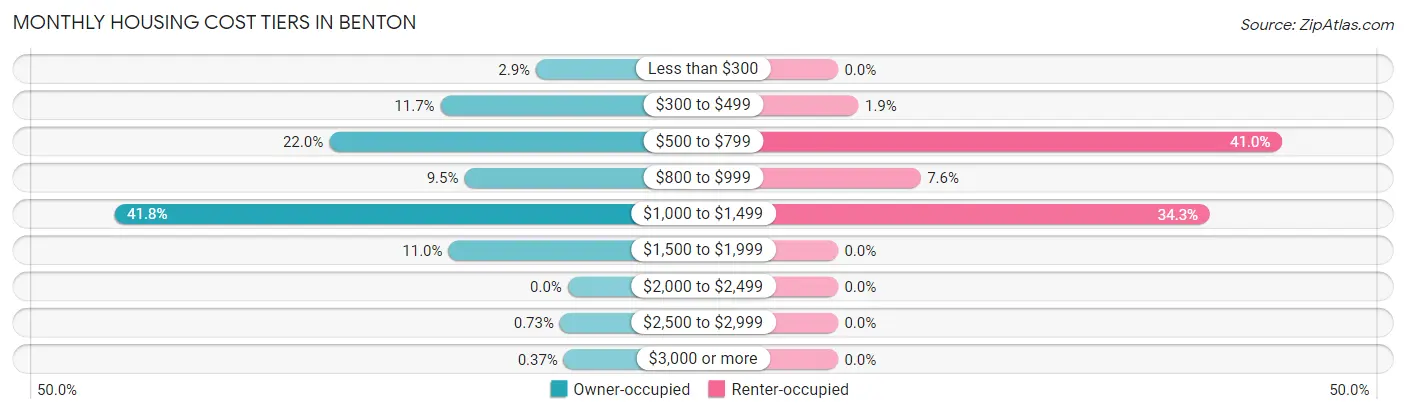
| Monthly Cost | Owner-occupied | Renter-occupied |
| Less than $300 | 8 (2.9%) | 0 (0.0%) |
| $300 to $499 | 32 (11.7%) | 2 (1.9%) |
| $500 to $799 | 60 (22.0%) | 43 (40.9%) |
| $800 to $999 | 26 (9.5%) | 8 (7.6%) |
| $1,000 to $1,499 | 114 (41.8%) | 36 (34.3%) |
| $1,500 to $1,999 | 30 (11.0%) | 0 (0.0%) |
| $2,000 to $2,499 | 0 (0.0%) | 0 (0.0%) |
| $2,500 to $2,999 | 2 (0.7%) | 0 (0.0%) |
| $3,000 or more | 1 (0.4%) | 0 (0.0%) |
| Total | 273 (100.0%) | 105 (100.0%) |
Physical Housing Characteristics in Benton
Housing Structures in Benton
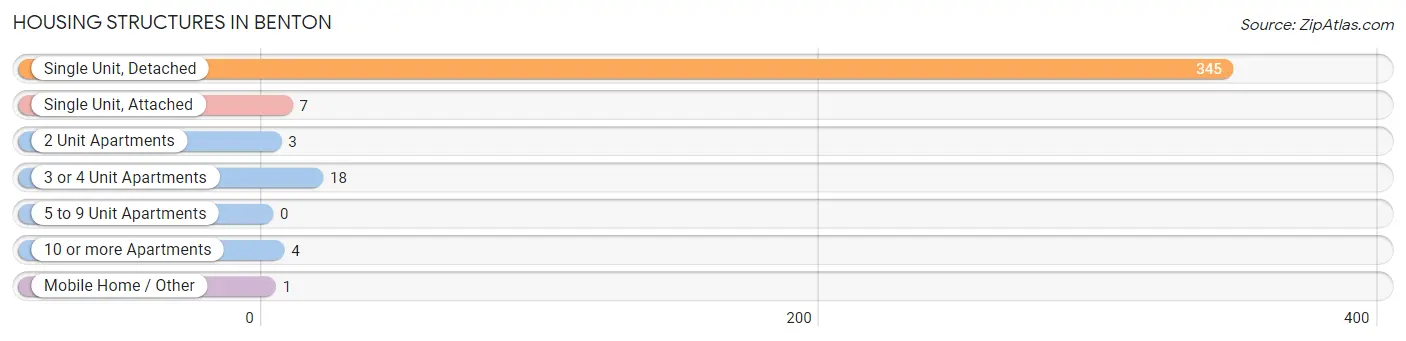
| Structure Type | # Housing Units | % Housing Units |
| Single Unit, Detached | 345 | 91.3% |
| Single Unit, Attached | 7 | 1.8% |
| 2 Unit Apartments | 3 | 0.8% |
| 3 or 4 Unit Apartments | 18 | 4.8% |
| 5 to 9 Unit Apartments | 0 | 0.0% |
| 10 or more Apartments | 4 | 1.1% |
| Mobile Home / Other | 1 | 0.3% |
| Total | 378 | 100.0% |
Housing Structures by Occupancy in Benton
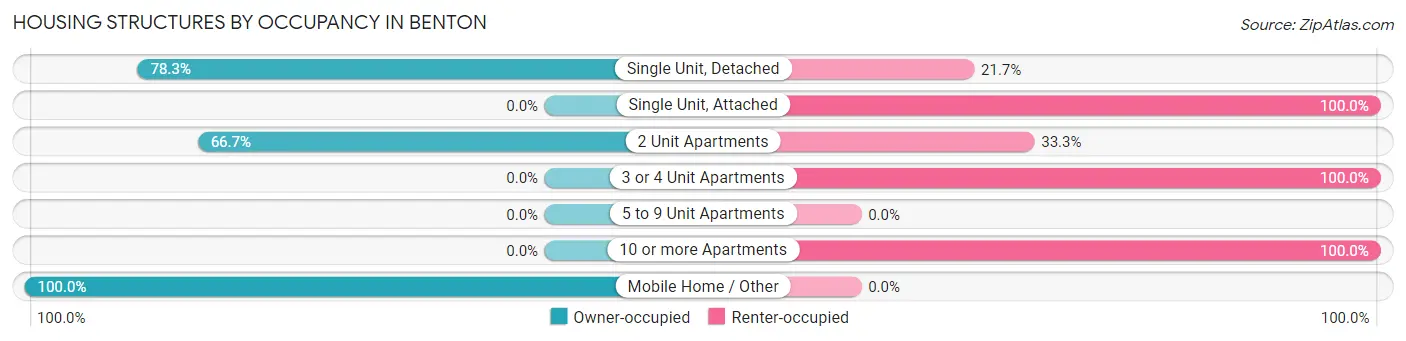
| Structure Type | Owner-occupied | Renter-occupied |
| Single Unit, Detached | 270 (78.3%) | 75 (21.7%) |
| Single Unit, Attached | 0 (0.0%) | 7 (100.0%) |
| 2 Unit Apartments | 2 (66.7%) | 1 (33.3%) |
| 3 or 4 Unit Apartments | 0 (0.0%) | 18 (100.0%) |
| 5 to 9 Unit Apartments | 0 (0.0%) | 0 (0.0%) |
| 10 or more Apartments | 0 (0.0%) | 4 (100.0%) |
| Mobile Home / Other | 1 (100.0%) | 0 (0.0%) |
| Total | 273 (72.2%) | 105 (27.8%) |
Housing Structures by Number of Rooms in Benton
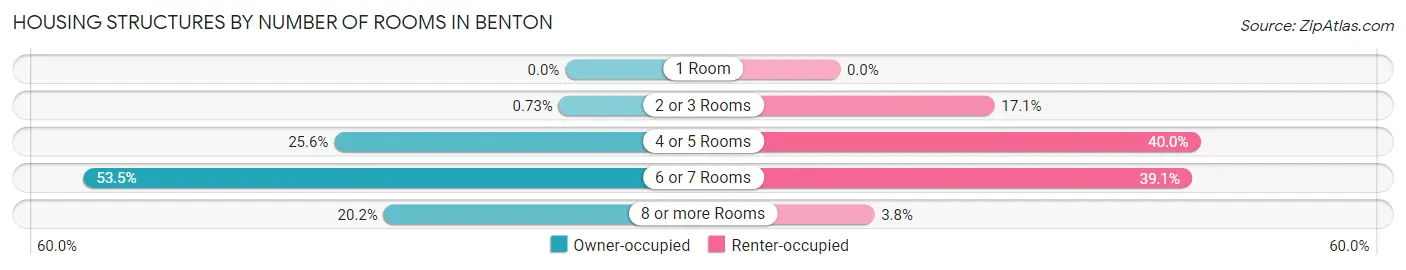
| Number of Rooms | Owner-occupied | Renter-occupied |
| 1 Room | 0 (0.0%) | 0 (0.0%) |
| 2 or 3 Rooms | 2 (0.7%) | 18 (17.1%) |
| 4 or 5 Rooms | 70 (25.6%) | 42 (40.0%) |
| 6 or 7 Rooms | 146 (53.5%) | 41 (39.1%) |
| 8 or more Rooms | 55 (20.2%) | 4 (3.8%) |
| Total | 273 (100.0%) | 105 (100.0%) |
Housing Structure by Heating Type in Benton
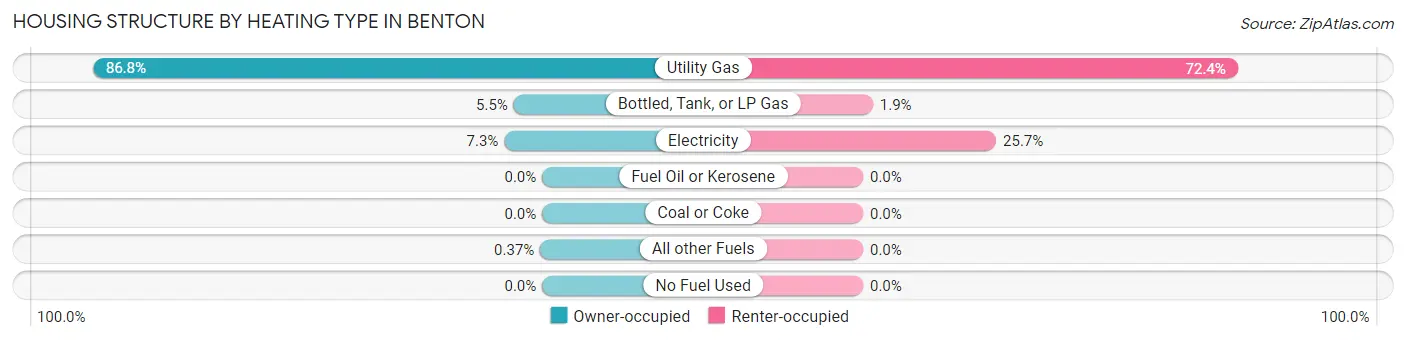
| Heating Type | Owner-occupied | Renter-occupied |
| Utility Gas | 237 (86.8%) | 76 (72.4%) |
| Bottled, Tank, or LP Gas | 15 (5.5%) | 2 (1.9%) |
| Electricity | 20 (7.3%) | 27 (25.7%) |
| Fuel Oil or Kerosene | 0 (0.0%) | 0 (0.0%) |
| Coal or Coke | 0 (0.0%) | 0 (0.0%) |
| All other Fuels | 1 (0.4%) | 0 (0.0%) |
| No Fuel Used | 0 (0.0%) | 0 (0.0%) |
| Total | 273 (100.0%) | 105 (100.0%) |
Household Vehicle Usage in Benton
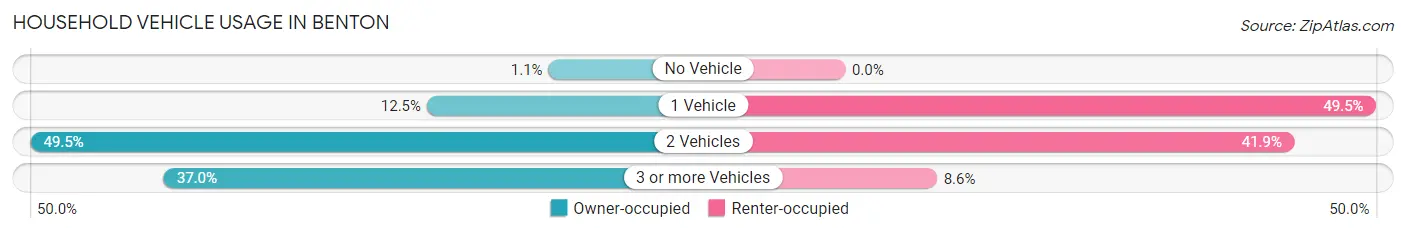
| Vehicles per Household | Owner-occupied | Renter-occupied |
| No Vehicle | 3 (1.1%) | 0 (0.0%) |
| 1 Vehicle | 34 (12.4%) | 52 (49.5%) |
| 2 Vehicles | 135 (49.4%) | 44 (41.9%) |
| 3 or more Vehicles | 101 (37.0%) | 9 (8.6%) |
| Total | 273 (100.0%) | 105 (100.0%) |
Real Estate & Mortgages in Benton
Real Estate and Mortgage Overview in Benton
| Characteristic | Without Mortgage | With Mortgage |
| Housing Units | 99 | 174 |
| Median Property Value | $139,800 | $132,700 |
| Median Household Income | $46,875 | $25 |
| Monthly Housing Costs | $537 | $1 |
| Real Estate Taxes | $2,500 | $0 |
Property Value by Mortgage Status in Benton
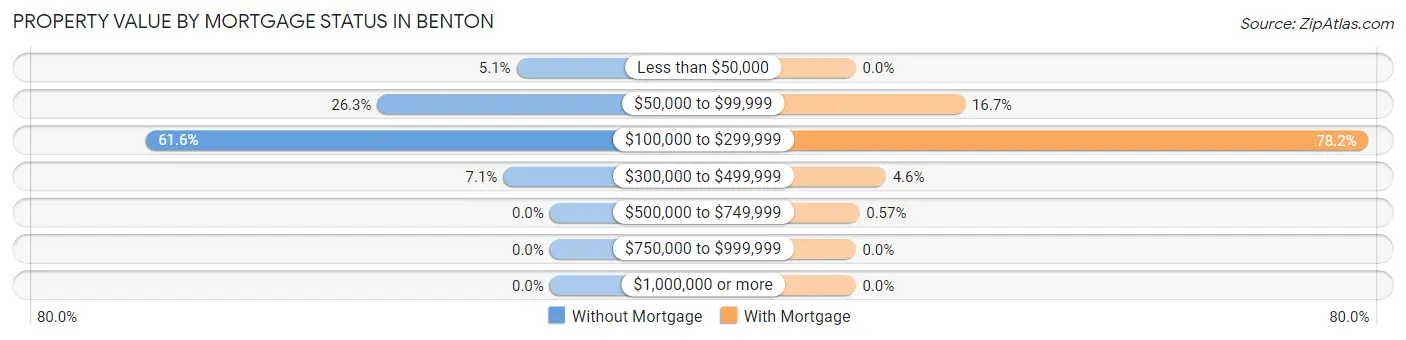
| Property Value | Without Mortgage | With Mortgage |
| Less than $50,000 | 5 (5.1%) | 0 (0.0%) |
| $50,000 to $99,999 | 26 (26.3%) | 29 (16.7%) |
| $100,000 to $299,999 | 61 (61.6%) | 136 (78.2%) |
| $300,000 to $499,999 | 7 (7.1%) | 8 (4.6%) |
| $500,000 to $749,999 | 0 (0.0%) | 1 (0.6%) |
| $750,000 to $999,999 | 0 (0.0%) | 0 (0.0%) |
| $1,000,000 or more | 0 (0.0%) | 0 (0.0%) |
| Total | 99 (100.0%) | 174 (100.0%) |
Household Income by Mortgage Status in Benton
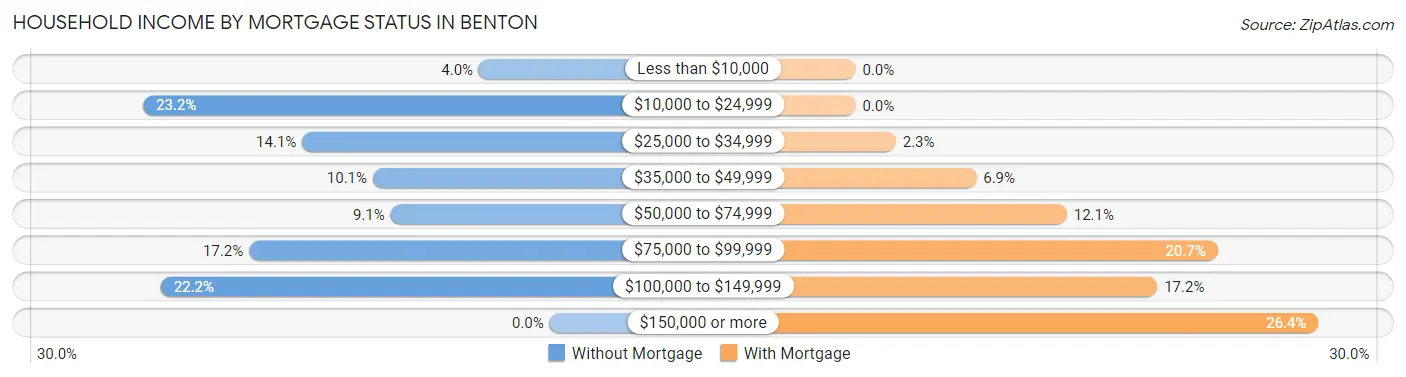
| Household Income | Without Mortgage | With Mortgage |
| Less than $10,000 | 4 (4.0%) | 0 (0.0%) |
| $10,000 to $24,999 | 23 (23.2%) | 0 (0.0%) |
| $25,000 to $34,999 | 14 (14.1%) | 4 (2.3%) |
| $35,000 to $49,999 | 10 (10.1%) | 12 (6.9%) |
| $50,000 to $74,999 | 9 (9.1%) | 21 (12.1%) |
| $75,000 to $99,999 | 17 (17.2%) | 36 (20.7%) |
| $100,000 to $149,999 | 22 (22.2%) | 30 (17.2%) |
| $150,000 or more | 0 (0.0%) | 46 (26.4%) |
| Total | 99 (100.0%) | 174 (100.0%) |
Property Value to Household Income Ratio in Benton
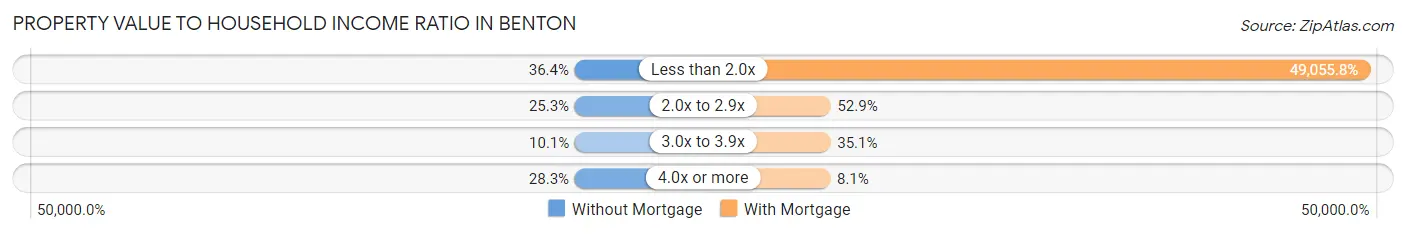
| Value-to-Income Ratio | Without Mortgage | With Mortgage |
| Less than 2.0x | 36 (36.4%) | 85,357 (49,055.8%) |
| 2.0x to 2.9x | 25 (25.3%) | 92 (52.9%) |
| 3.0x to 3.9x | 10 (10.1%) | 61 (35.1%) |
| 4.0x or more | 28 (28.3%) | 14 (8.1%) |
| Total | 99 (100.0%) | 174 (100.0%) |
Real Estate Taxes by Mortgage Status in Benton
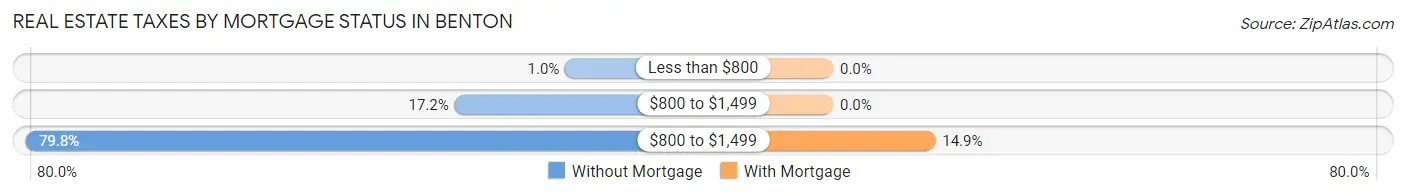
| Property Taxes | Without Mortgage | With Mortgage |
| Less than $800 | 1 (1.0%) | 0 (0.0%) |
| $800 to $1,499 | 17 (17.2%) | 0 (0.0%) |
| $800 to $1,499 | 79 (79.8%) | 26 (14.9%) |
| Total | 99 (100.0%) | 174 (100.0%) |
Health & Disability in Benton
Health Insurance Coverage by Age in Benton
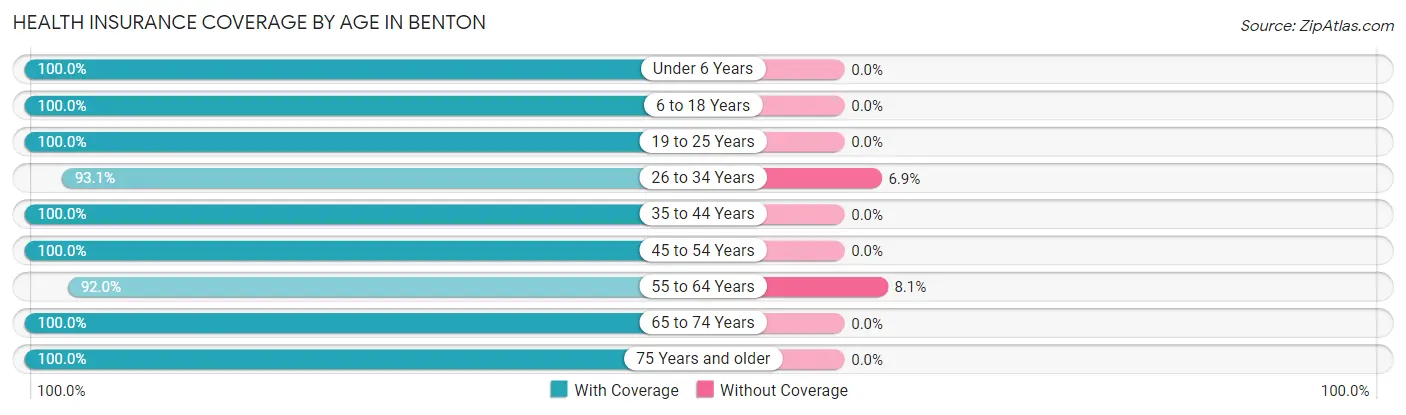
| Age Bracket | With Coverage | Without Coverage |
| Under 6 Years | 63 (100.0%) | 0 (0.0%) |
| 6 to 18 Years | 171 (100.0%) | 0 (0.0%) |
| 19 to 25 Years | 54 (100.0%) | 0 (0.0%) |
| 26 to 34 Years | 94 (93.1%) | 7 (6.9%) |
| 35 to 44 Years | 119 (100.0%) | 0 (0.0%) |
| 45 to 54 Years | 105 (100.0%) | 0 (0.0%) |
| 55 to 64 Years | 80 (91.9%) | 7 (8.1%) |
| 65 to 74 Years | 146 (100.0%) | 0 (0.0%) |
| 75 Years and older | 55 (100.0%) | 0 (0.0%) |
| Total | 887 (98.5%) | 14 (1.5%) |
Health Insurance Coverage by Citizenship Status in Benton
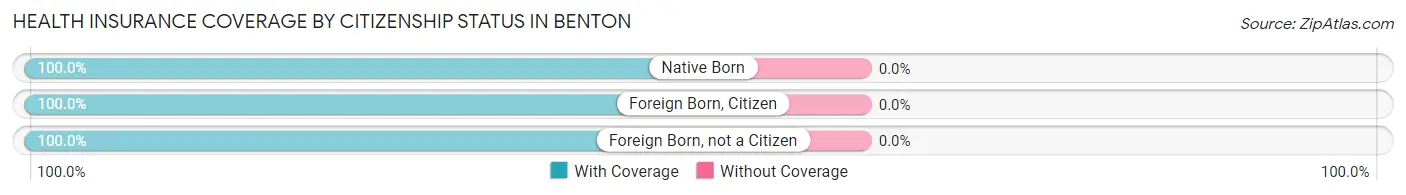
| Citizenship Status | With Coverage | Without Coverage |
| Native Born | 63 (100.0%) | 0 (0.0%) |
| Foreign Born, Citizen | 171 (100.0%) | 0 (0.0%) |
| Foreign Born, not a Citizen | 54 (100.0%) | 0 (0.0%) |
Health Insurance Coverage by Household Income in Benton
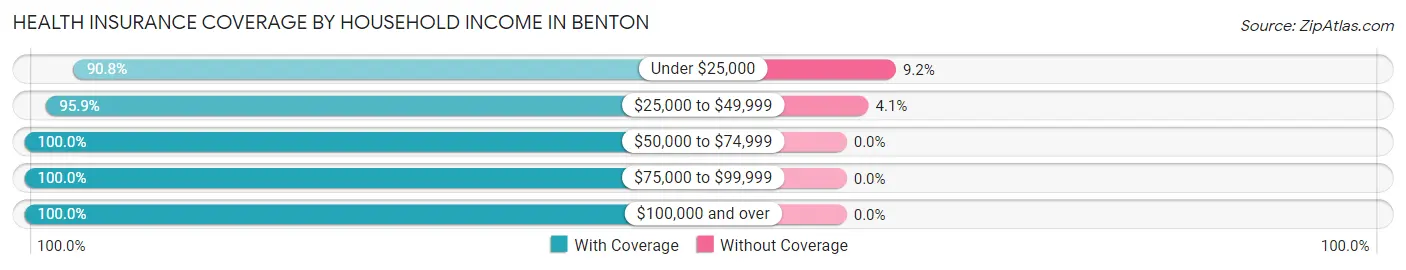
| Household Income | With Coverage | Without Coverage |
| Under $25,000 | 69 (90.8%) | 7 (9.2%) |
| $25,000 to $49,999 | 164 (95.9%) | 7 (4.1%) |
| $50,000 to $74,999 | 230 (100.0%) | 0 (0.0%) |
| $75,000 to $99,999 | 124 (100.0%) | 0 (0.0%) |
| $100,000 and over | 300 (100.0%) | 0 (0.0%) |
Public vs Private Health Insurance Coverage by Age in Benton
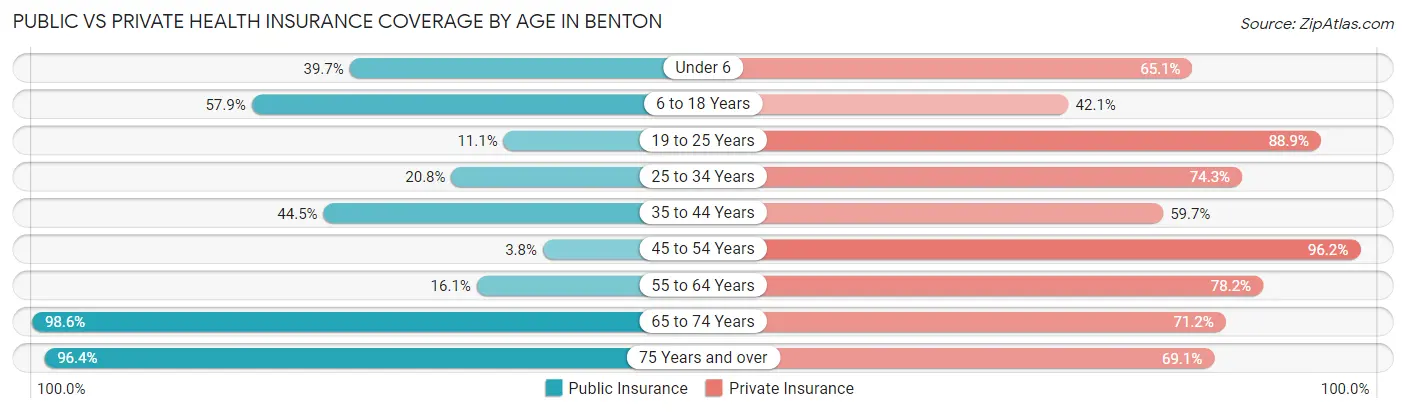
| Age Bracket | Public Insurance | Private Insurance |
| Under 6 | 25 (39.7%) | 41 (65.1%) |
| 6 to 18 Years | 99 (57.9%) | 72 (42.1%) |
| 19 to 25 Years | 6 (11.1%) | 48 (88.9%) |
| 25 to 34 Years | 21 (20.8%) | 75 (74.3%) |
| 35 to 44 Years | 53 (44.5%) | 71 (59.7%) |
| 45 to 54 Years | 4 (3.8%) | 101 (96.2%) |
| 55 to 64 Years | 14 (16.1%) | 68 (78.2%) |
| 65 to 74 Years | 144 (98.6%) | 104 (71.2%) |
| 75 Years and over | 53 (96.4%) | 38 (69.1%) |
| Total | 419 (46.5%) | 618 (68.6%) |
Disability Status by Sex by Age in Benton
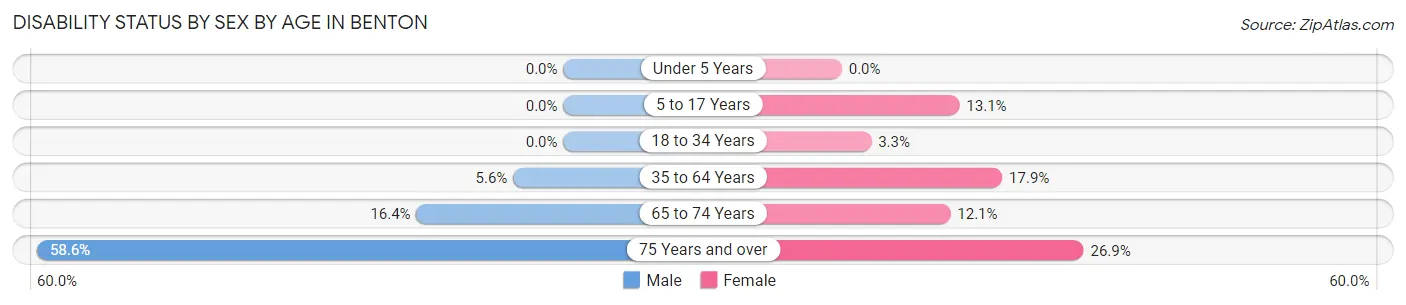
| Age Bracket | Male | Female |
| Under 5 Years | 0 (0.0%) | 0 (0.0%) |
| 5 to 17 Years | 0 (0.0%) | 11 (13.1%) |
| 18 to 34 Years | 0 (0.0%) | 2 (3.3%) |
| 35 to 64 Years | 8 (5.6%) | 30 (17.9%) |
| 65 to 74 Years | 9 (16.4%) | 11 (12.1%) |
| 75 Years and over | 17 (58.6%) | 7 (26.9%) |
Disability Class by Sex by Age in Benton
Disability Class: Hearing Difficulty
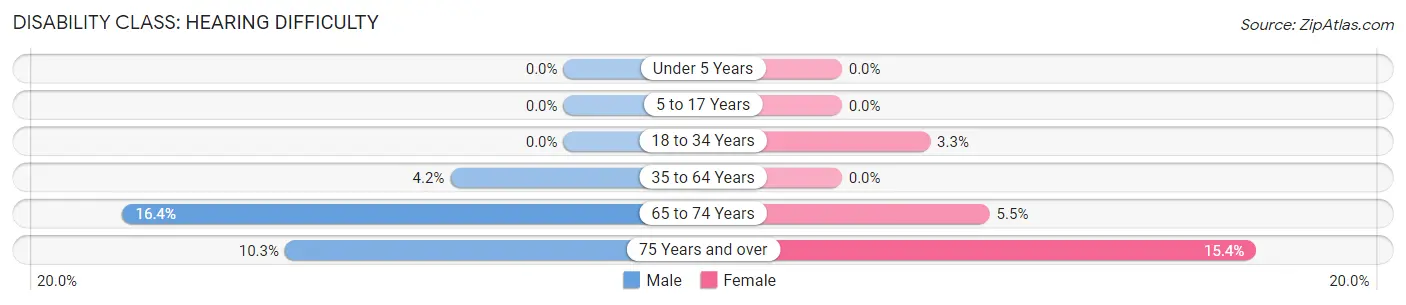
| Age Bracket | Male | Female |
| Under 5 Years | 0 (0.0%) | 0 (0.0%) |
| 5 to 17 Years | 0 (0.0%) | 0 (0.0%) |
| 18 to 34 Years | 0 (0.0%) | 2 (3.3%) |
| 35 to 64 Years | 6 (4.2%) | 0 (0.0%) |
| 65 to 74 Years | 9 (16.4%) | 5 (5.5%) |
| 75 Years and over | 3 (10.3%) | 4 (15.4%) |
Disability Class: Vision Difficulty
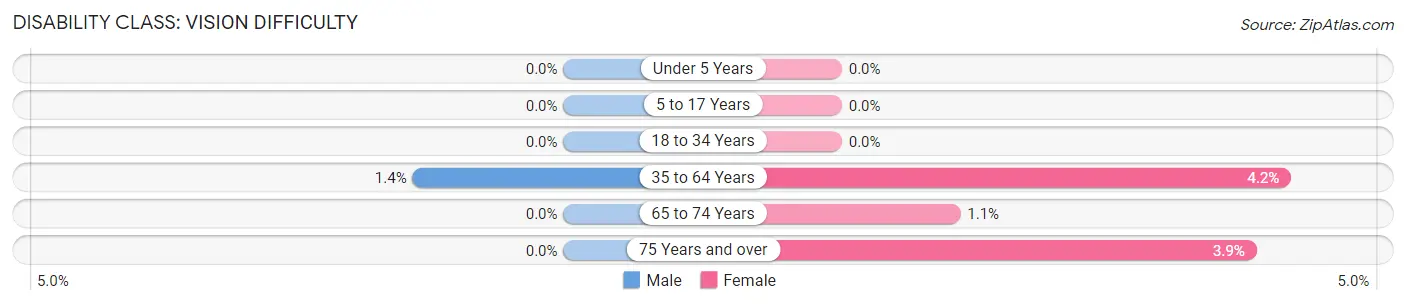
| Age Bracket | Male | Female |
| Under 5 Years | 0 (0.0%) | 0 (0.0%) |
| 5 to 17 Years | 0 (0.0%) | 0 (0.0%) |
| 18 to 34 Years | 0 (0.0%) | 0 (0.0%) |
| 35 to 64 Years | 2 (1.4%) | 7 (4.2%) |
| 65 to 74 Years | 0 (0.0%) | 1 (1.1%) |
| 75 Years and over | 0 (0.0%) | 1 (3.8%) |
Disability Class: Cognitive Difficulty
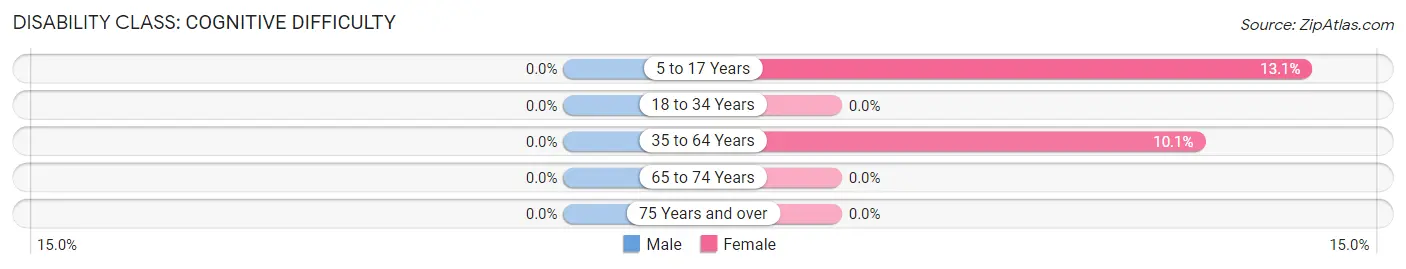
| Age Bracket | Male | Female |
| 5 to 17 Years | 0 (0.0%) | 11 (13.1%) |
| 18 to 34 Years | 0 (0.0%) | 0 (0.0%) |
| 35 to 64 Years | 0 (0.0%) | 17 (10.1%) |
| 65 to 74 Years | 0 (0.0%) | 0 (0.0%) |
| 75 Years and over | 0 (0.0%) | 0 (0.0%) |
Disability Class: Ambulatory Difficulty
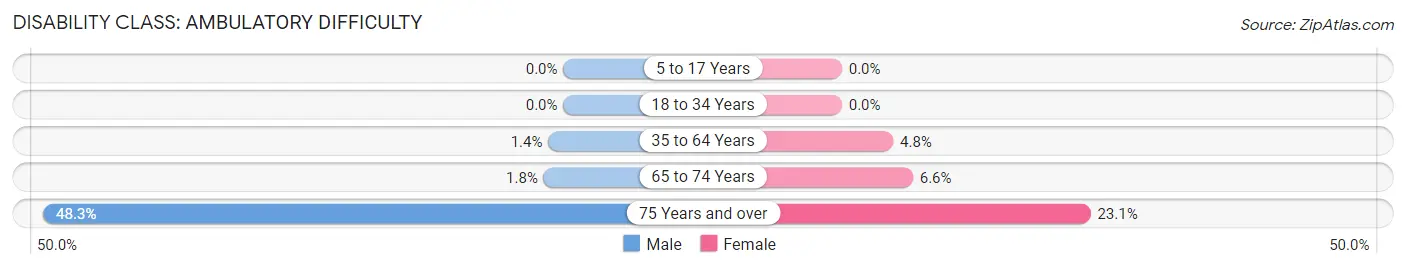
| Age Bracket | Male | Female |
| 5 to 17 Years | 0 (0.0%) | 0 (0.0%) |
| 18 to 34 Years | 0 (0.0%) | 0 (0.0%) |
| 35 to 64 Years | 2 (1.4%) | 8 (4.8%) |
| 65 to 74 Years | 1 (1.8%) | 6 (6.6%) |
| 75 Years and over | 14 (48.3%) | 6 (23.1%) |
Disability Class: Self-Care Difficulty
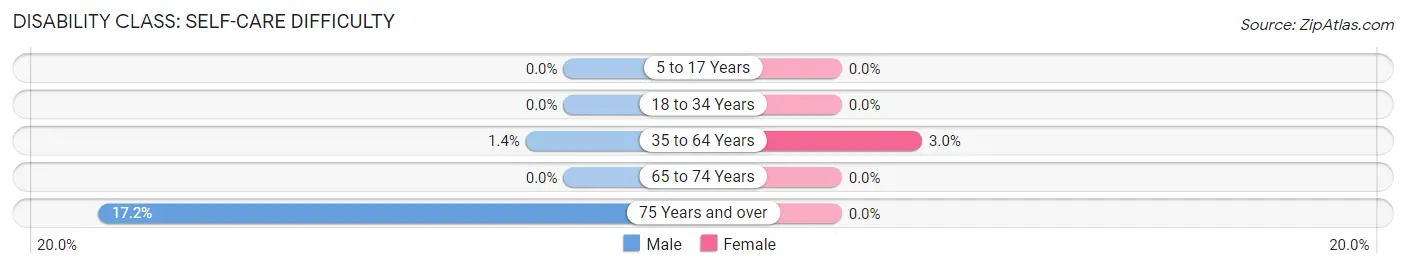
| Age Bracket | Male | Female |
| 5 to 17 Years | 0 (0.0%) | 0 (0.0%) |
| 18 to 34 Years | 0 (0.0%) | 0 (0.0%) |
| 35 to 64 Years | 2 (1.4%) | 5 (3.0%) |
| 65 to 74 Years | 0 (0.0%) | 0 (0.0%) |
| 75 Years and over | 5 (17.2%) | 0 (0.0%) |
Technology Access in Benton
Computing Device Access in Benton
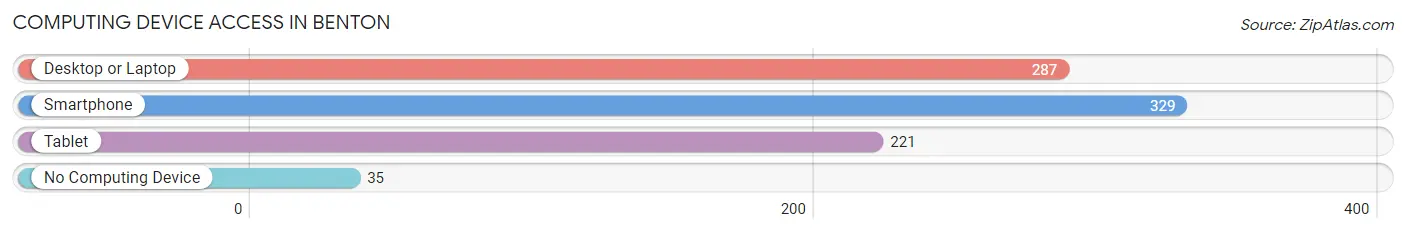
| Device Type | # Households | % Households |
| Desktop or Laptop | 287 | 75.9% |
| Smartphone | 329 | 87.0% |
| Tablet | 221 | 58.5% |
| No Computing Device | 35 | 9.3% |
| Total | 378 | 100.0% |
Internet Access in Benton
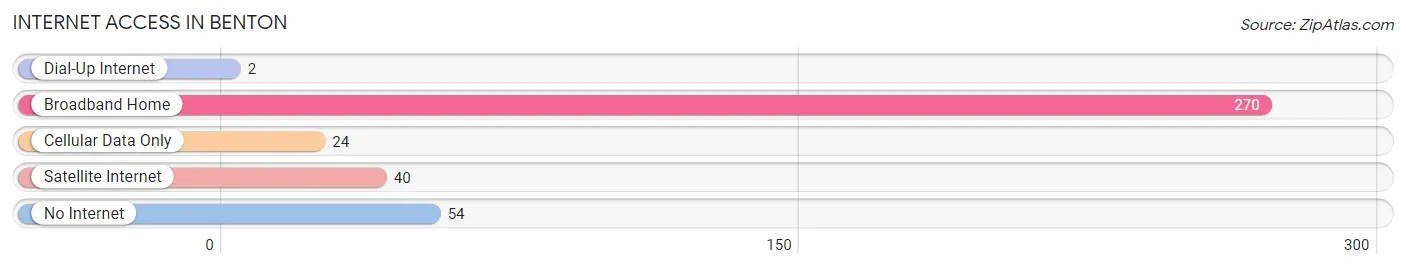
| Internet Type | # Households | % Households |
| Dial-Up Internet | 2 | 0.5% |
| Broadband Home | 270 | 71.4% |
| Cellular Data Only | 24 | 6.4% |
| Satellite Internet | 40 | 10.6% |
| No Internet | 54 | 14.3% |
| Total | 378 | 100.0% |
Benton Summary
Benton is a small town located in Lafayette County, Wisconsin. It is situated on the banks of the Pecatonica River, and is part of the larger Platteville Micropolitan Statistical Area. The town has a population of just over 1,000 people, and is known for its rural charm and friendly atmosphere.
History
Benton was first settled in 1845 by a group of settlers from New York. The town was named after Thomas Hart Benton, a prominent politician from Missouri. The town was officially incorporated in 1856, and the first post office was established in 1857.
In the late 19th century, Benton was a thriving agricultural community. The town was home to several grain mills, a cheese factory, and a number of other businesses. The town also had a railroad station, which connected it to the larger cities of the region.
Geography
Benton is located in southwestern Wisconsin, in Lafayette County. The town is situated on the banks of the Pecatonica River, and is part of the larger Platteville Micropolitan Statistical Area. The town is surrounded by rolling hills and farmland, and is located about 25 miles from the state capital of Madison.
The town has a total area of 1.2 square miles, all of which is land. The town has a humid continental climate, with cold winters and hot summers. The average annual temperature is around 50 degrees Fahrenheit, and the average annual precipitation is around 35 inches.
Economy
Benton’s economy is largely based on agriculture. The town is home to several farms, which produce a variety of crops, including corn, soybeans, and hay. The town also has a number of small businesses, including a grocery store, a hardware store, and a few restaurants.
The town is also home to a number of manufacturing companies, which produce a variety of products, including furniture, automotive parts, and medical supplies. The town is also home to a number of small businesses, including a bakery, a florist, and a few other retail stores.
Demographics
As of the 2010 census, Benton had a population of 1,072 people. The town has a median household income of $45,000, and the median age is 43. The town is predominantly white, with about 95% of the population identifying as such. The town also has a small Hispanic population, with about 4% of the population identifying as such.
Benton is a small, rural town with a friendly atmosphere and a strong sense of community. The town is home to a number of small businesses, and is a popular destination for tourists looking to explore the area’s natural beauty. The town is also home to a number of manufacturing companies, which provide jobs for the local population.
Common Questions
What is Per Capita Income in Benton?
Per Capita income in Benton is $30,055.
What is the Median Family Income in Benton?
Median Family Income in Benton is $71,250.
What is the Median Household income in Benton?
Median Household Income in Benton is $59,231.
What is Income or Wage Gap in Benton?
Income or Wage Gap in Benton is 17.9%.
Women in Benton earn 82.1 cents for every dollar earned by a man.
What is Inequality or Gini Index in Benton?
Inequality or Gini Index in Benton is 0.35.
What is the Total Population of Benton?
Total Population of Benton is 901.
What is the Total Male Population of Benton?
Total Male Population of Benton is 437.
What is the Total Female Population of Benton?
Total Female Population of Benton is 464.
What is the Ratio of Males per 100 Females in Benton?
There are 94.18 Males per 100 Females in Benton.
What is the Ratio of Females per 100 Males in Benton?
There are 106.18 Females per 100 Males in Benton.
What is the Median Population Age in Benton?
Median Population Age in Benton is 38.5 Years.
What is the Average Family Size in Benton
Average Family Size in Benton is 2.8 People.
What is the Average Household Size in Benton
Average Household Size in Benton is 2.4 People.
How Large is the Labor Force in Benton?
There are 458 People in the Labor Forcein in Benton.
What is the Percentage of People in the Labor Force in Benton?
64.1% of People are in the Labor Force in Benton.
What is the Unemployment Rate in Benton?
Unemployment Rate in Benton is 3.9%.