Bay City, WI Map & Demographics
Bay City Map
Bay City Overview
$36,497
PER CAPITA INCOME
$73,750
AVG FAMILY INCOME
$56,071
AVG HOUSEHOLD INCOME
11.6%
WAGE / INCOME GAP [ % ]
88.4¢/ $1
WAGE / INCOME GAP [ $ ]
0.46
INEQUALITY / GINI INDEX
362
TOTAL POPULATION
206
MALE POPULATION
156
FEMALE POPULATION
132.05
MALES / 100 FEMALES
75.73
FEMALES / 100 MALES
44.6
MEDIAN AGE
2.9
AVG FAMILY SIZE
2.2
AVG HOUSEHOLD SIZE
211
LABOR FORCE [ PEOPLE ]
65.3%
PERCENT IN LABOR FORCE
2.4%
UNEMPLOYMENT RATE
Bay City Zip Codes
Bay City Area Codes
Income in Bay City
Income Overview in Bay City
Per Capita Income in Bay City is $36,497, while median incomes of families and households are $73,750 and $56,071 respectively.
| Characteristic | Number | Measure |
| Per Capita Income | 362 | $36,497 |
| Median Family Income | 77 | $73,750 |
| Mean Family Income | 77 | $108,423 |
| Median Household Income | 164 | $56,071 |
| Mean Household Income | 164 | $76,721 |
| Income Deficit | 77 | $0 |
| Wage / Income Gap (%) | 362 | 11.63% |
| Wage / Income Gap ($) | 362 | 88.37¢ per $1 |
| Gini / Inequality Index | 362 | 0.46 |
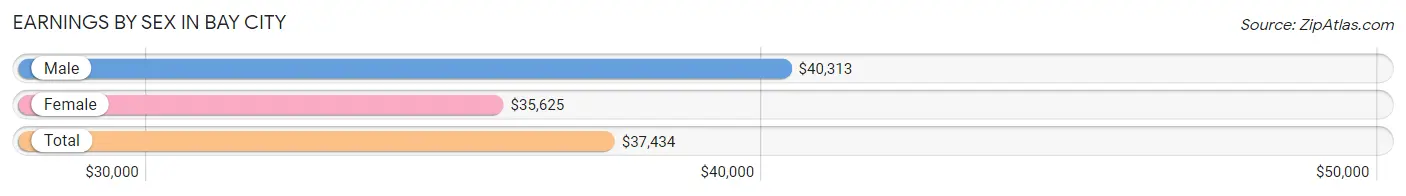
Earnings by Sex in Bay City
Average Earnings in Bay City are $37,434, $40,313 for men and $35,625 for women, a difference of 11.6%.
| Sex | Number | Average Earnings |
| Male | 132 (60.3%) | $40,313 |
| Female | 87 (39.7%) | $35,625 |
| Total | 219 (100.0%) | $37,434 |
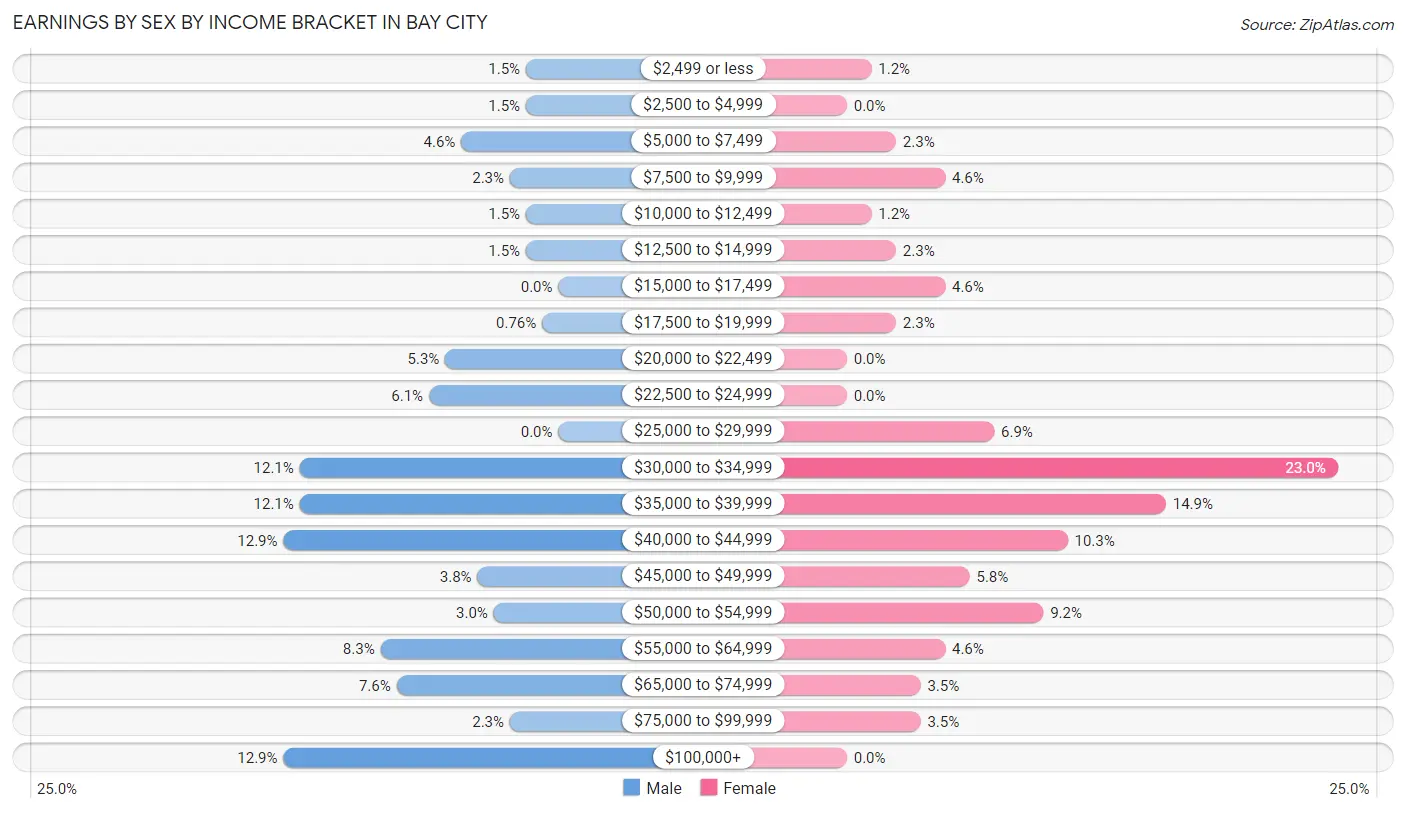
Earnings by Sex by Income Bracket in Bay City
The most common earnings brackets in Bay City are $40,000 to $44,999 for men (17 | 12.9%) and $30,000 to $34,999 for women (20 | 23.0%).
| Income | Male | Female |
| $2,499 or less | 2 (1.5%) | 1 (1.1%) |
| $2,500 to $4,999 | 2 (1.5%) | 0 (0.0%) |
| $5,000 to $7,499 | 6 (4.5%) | 2 (2.3%) |
| $7,500 to $9,999 | 3 (2.3%) | 4 (4.6%) |
| $10,000 to $12,499 | 2 (1.5%) | 1 (1.1%) |
| $12,500 to $14,999 | 2 (1.5%) | 2 (2.3%) |
| $15,000 to $17,499 | 0 (0.0%) | 4 (4.6%) |
| $17,500 to $19,999 | 1 (0.8%) | 2 (2.3%) |
| $20,000 to $22,499 | 7 (5.3%) | 0 (0.0%) |
| $22,500 to $24,999 | 8 (6.1%) | 0 (0.0%) |
| $25,000 to $29,999 | 0 (0.0%) | 6 (6.9%) |
| $30,000 to $34,999 | 16 (12.1%) | 20 (23.0%) |
| $35,000 to $39,999 | 16 (12.1%) | 13 (14.9%) |
| $40,000 to $44,999 | 17 (12.9%) | 9 (10.3%) |
| $45,000 to $49,999 | 5 (3.8%) | 5 (5.8%) |
| $50,000 to $54,999 | 4 (3.0%) | 8 (9.2%) |
| $55,000 to $64,999 | 11 (8.3%) | 4 (4.6%) |
| $65,000 to $74,999 | 10 (7.6%) | 3 (3.5%) |
| $75,000 to $99,999 | 3 (2.3%) | 3 (3.5%) |
| $100,000+ | 17 (12.9%) | 0 (0.0%) |
| Total | 132 (100.0%) | 87 (100.0%) |
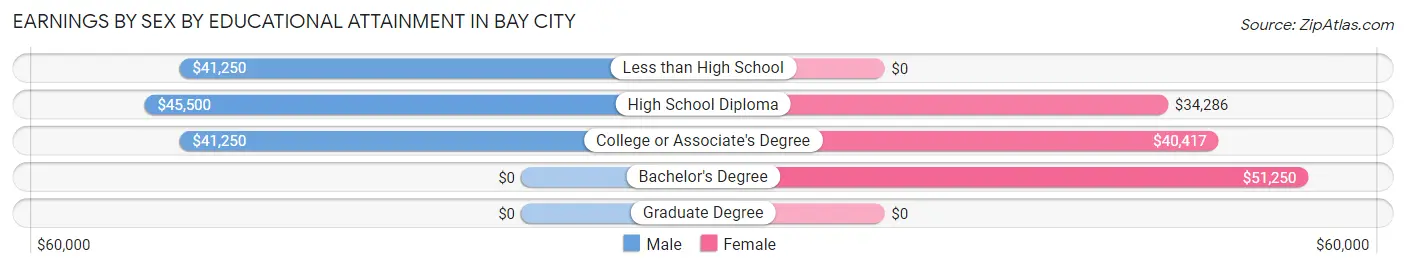
Earnings by Sex by Educational Attainment in Bay City
Average earnings in Bay City are $43,611 for men and $36,875 for women, a difference of 15.4%. Men with an educational attainment of high school diploma enjoy the highest average annual earnings of $45,500, while those with less than high school education earn the least with $41,250. Women with an educational attainment of bachelor's degree earn the most with the average annual earnings of $51,250, while those with high school diploma education have the smallest earnings of $34,286.
| Educational Attainment | Male Income | Female Income |
| Less than High School | $41,250 | $0 |
| High School Diploma | $45,500 | $34,286 |
| College or Associate's Degree | $41,250 | $40,417 |
| Bachelor's Degree | - | - |
| Graduate Degree | - | - |
| Total | $43,611 | $36,875 |
Family Income in Bay City
Family Income Brackets in Bay City
According to the Bay City family income data, there are 14 families falling into the $35,000 to $49,999 income range, which is the most common income bracket and makes up 18.2% of all families.
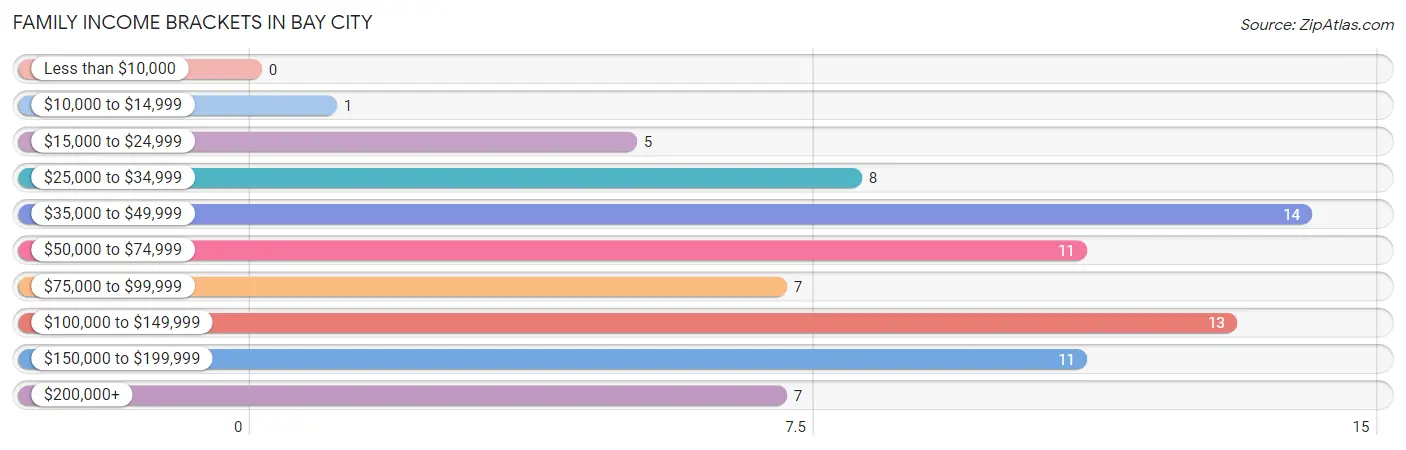
| Income Bracket | # Families | % Families |
| Less than $10,000 | 0 | 0.0% |
| $10,000 to $14,999 | 1 | 1.3% |
| $15,000 to $24,999 | 5 | 6.5% |
| $25,000 to $34,999 | 8 | 10.4% |
| $35,000 to $49,999 | 14 | 18.2% |
| $50,000 to $74,999 | 11 | 14.3% |
| $75,000 to $99,999 | 7 | 9.1% |
| $100,000 to $149,999 | 13 | 16.9% |
| $150,000 to $199,999 | 11 | 14.3% |
| $200,000+ | 7 | 9.1% |
Family Income by Famaliy Size in Bay City
5-person families (7 | 9.1%) account for the highest median family income in Bay City with $139,063 per family, while 4-person families (8 | 10.4%) have the highest median income of $30,625 per family member.
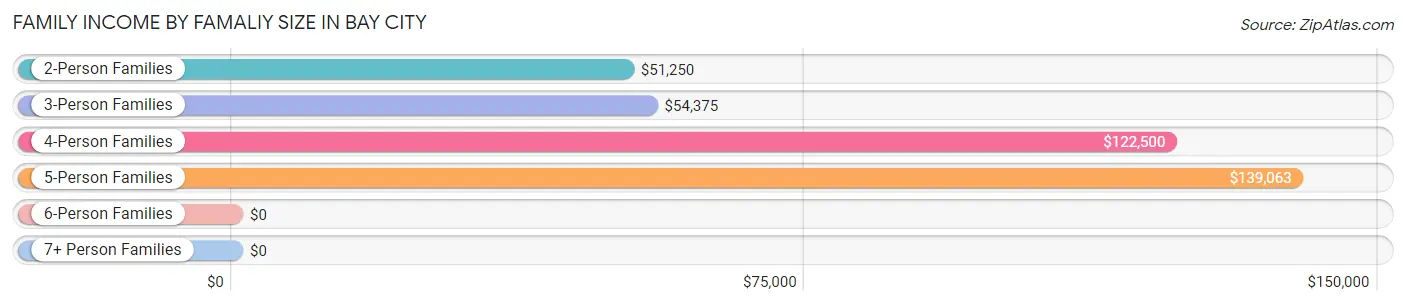
| Income Bracket | # Families | Median Income |
| 2-Person Families | 45 (58.4%) | $51,250 |
| 3-Person Families | 15 (19.5%) | $54,375 |
| 4-Person Families | 8 (10.4%) | $122,500 |
| 5-Person Families | 7 (9.1%) | $139,063 |
| 6-Person Families | 2 (2.6%) | $0 |
| 7+ Person Families | 0 (0.0%) | $0 |
| Total | 77 (100.0%) | $73,750 |
Family Income by Number of Earners in Bay City
The median family income in Bay City is $73,750, with families comprising 3+ earners (8) having the highest median family income of $190,833, while families with 1 earner (25) have the lowest median family income of $42,292, accounting for 10.4% and 32.5% of families, respectively.
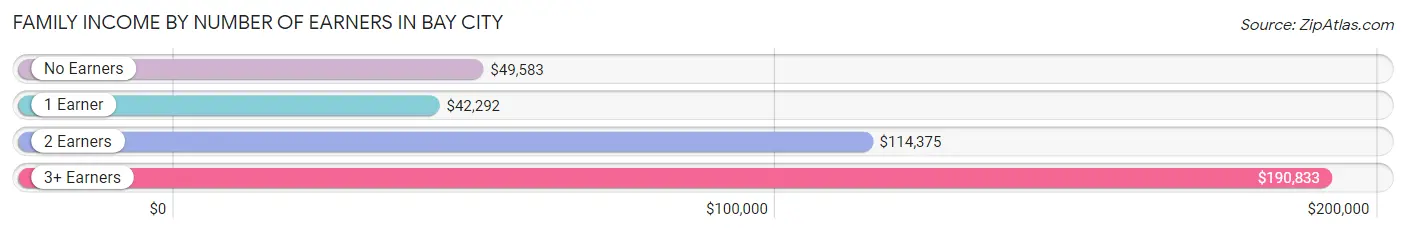
| Number of Earners | # Families | Median Income |
| No Earners | 13 (16.9%) | $49,583 |
| 1 Earner | 25 (32.5%) | $42,292 |
| 2 Earners | 31 (40.3%) | $114,375 |
| 3+ Earners | 8 (10.4%) | $190,833 |
| Total | 77 (100.0%) | $73,750 |
Household Income in Bay City
Household Income Brackets in Bay City
With 32 households falling in the category, the $50,000 to $74,999 income range is the most frequent in Bay City, accounting for 19.5% of all households. In contrast, only 5 households (3.0%) fall into the $10,000 to $14,999 income bracket, making it the least populous group.
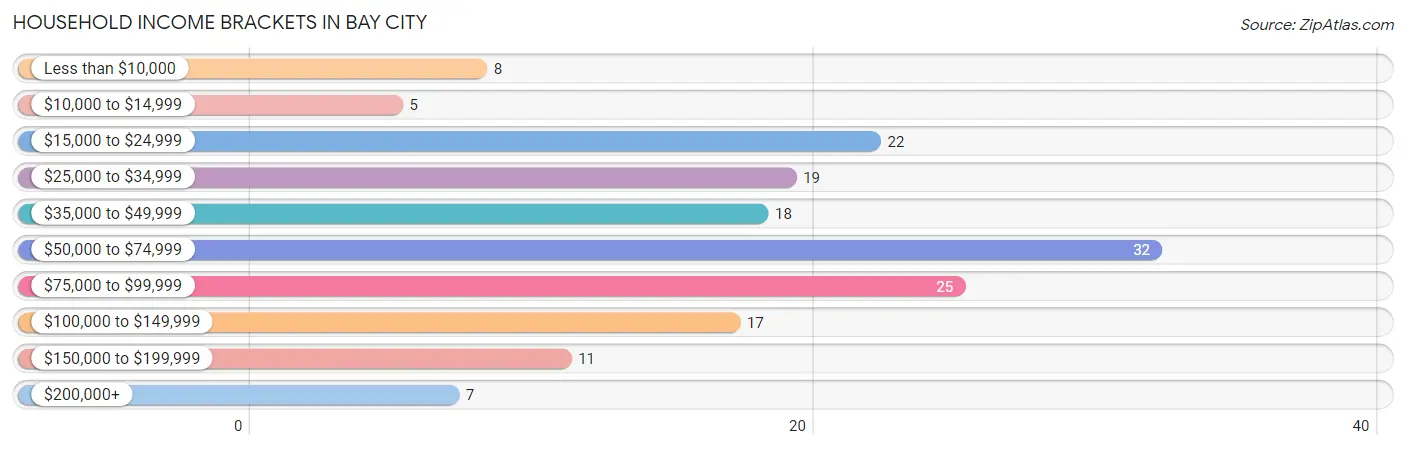
| Income Bracket | # Households | % Households |
| Less than $10,000 | 8 | 4.9% |
| $10,000 to $14,999 | 5 | 3.0% |
| $15,000 to $24,999 | 22 | 13.4% |
| $25,000 to $34,999 | 19 | 11.6% |
| $35,000 to $49,999 | 18 | 11.0% |
| $50,000 to $74,999 | 32 | 19.5% |
| $75,000 to $99,999 | 25 | 15.2% |
| $100,000 to $149,999 | 17 | 10.4% |
| $150,000 to $199,999 | 11 | 6.7% |
| $200,000+ | 7 | 4.3% |
Household Income by Householder Age in Bay City
The median household income in Bay City is $56,071, with the highest median household income of $94,375 found in the 45 to 64 years age bracket for the primary householder. A total of 49 households (29.9%) fall into this category. Meanwhile, the 15 to 24 years age bracket for the primary householder has the lowest median household income of $21,786, with 14 households (8.5%) in this group.
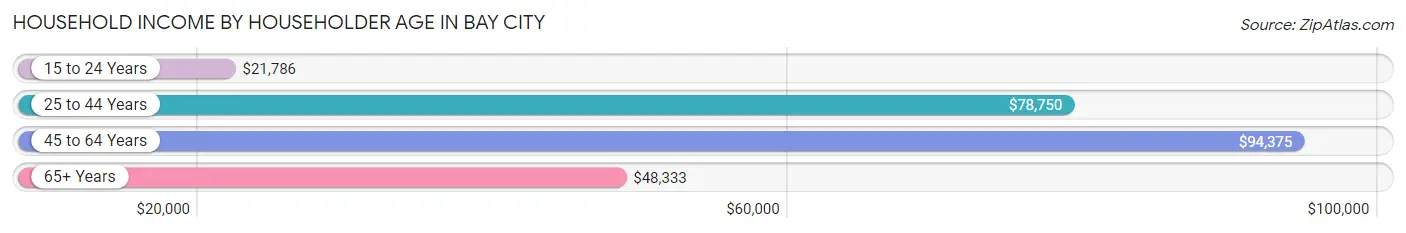
| Income Bracket | # Households | Median Income |
| 15 to 24 Years | 14 (8.5%) | $21,786 |
| 25 to 44 Years | 51 (31.1%) | $78,750 |
| 45 to 64 Years | 49 (29.9%) | $94,375 |
| 65+ Years | 50 (30.5%) | $48,333 |
| Total | 164 (100.0%) | $56,071 |
Poverty in Bay City
Income Below Poverty by Sex and Age in Bay City
With 6.8% poverty level for males and 12.2% for females among the residents of Bay City, 18 to 24 year old males and 65 to 74 year old females are the most vulnerable to poverty, with 5 males (29.4%) and 6 females (28.6%) in their respective age groups living below the poverty level.
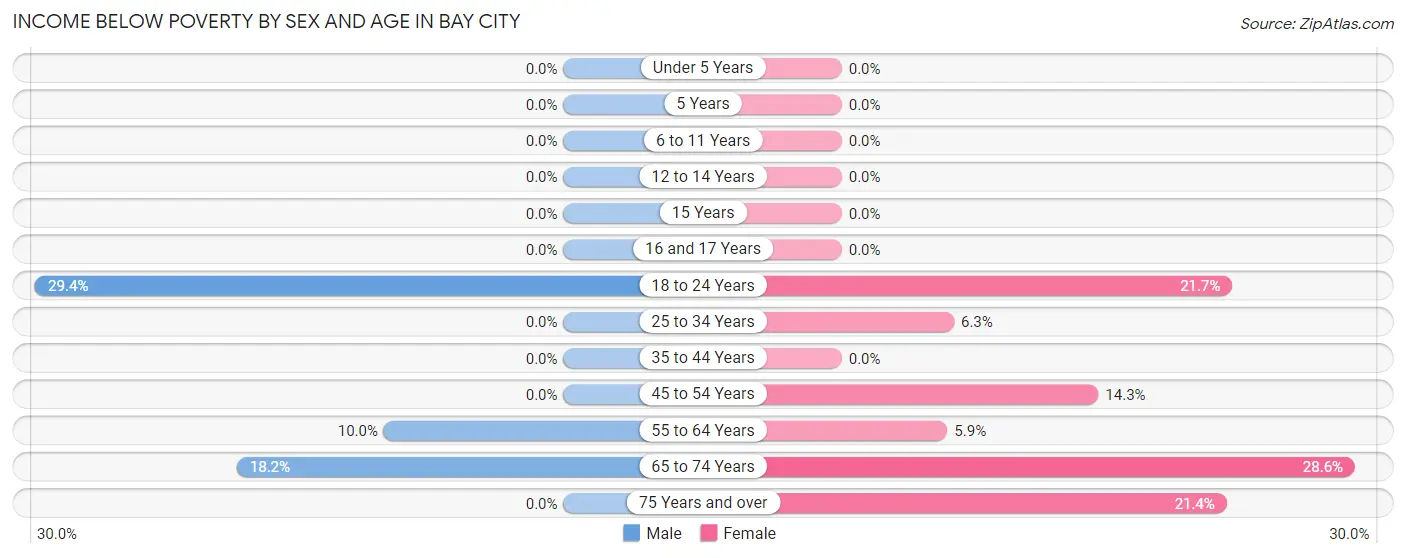
| Age Bracket | Male | Female |
| Under 5 Years | 0 (0.0%) | 0 (0.0%) |
| 5 Years | 0 (0.0%) | 0 (0.0%) |
| 6 to 11 Years | 0 (0.0%) | 0 (0.0%) |
| 12 to 14 Years | 0 (0.0%) | 0 (0.0%) |
| 15 Years | 0 (0.0%) | 0 (0.0%) |
| 16 and 17 Years | 0 (0.0%) | 0 (0.0%) |
| 18 to 24 Years | 5 (29.4%) | 5 (21.7%) |
| 25 to 34 Years | 0 (0.0%) | 1 (6.2%) |
| 35 to 44 Years | 0 (0.0%) | 0 (0.0%) |
| 45 to 54 Years | 0 (0.0%) | 3 (14.3%) |
| 55 to 64 Years | 5 (10.0%) | 1 (5.9%) |
| 65 to 74 Years | 4 (18.2%) | 6 (28.6%) |
| 75 Years and over | 0 (0.0%) | 3 (21.4%) |
| Total | 14 (6.8%) | 19 (12.2%) |
Income Above Poverty by Sex and Age in Bay City
According to the poverty statistics in Bay City, males aged under 5 years and females aged under 5 years are the age groups that are most secure financially, with 100.0% of males and 100.0% of females in these age groups living above the poverty line.
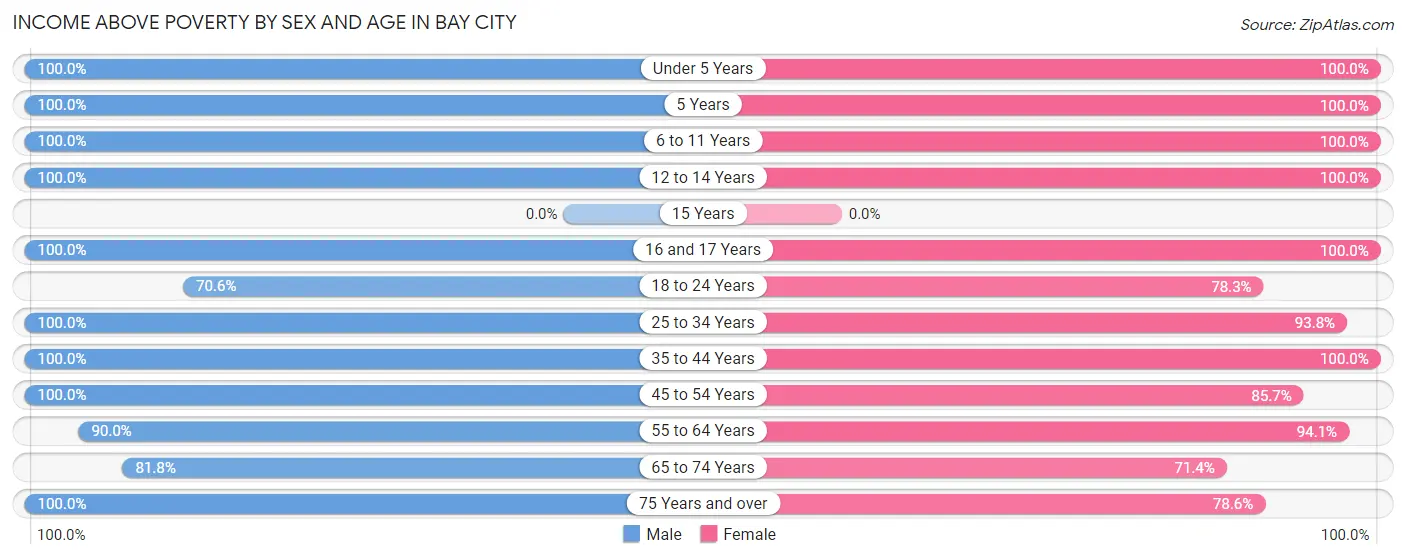
| Age Bracket | Male | Female |
| Under 5 Years | 9 (100.0%) | 6 (100.0%) |
| 5 Years | 2 (100.0%) | 1 (100.0%) |
| 6 to 11 Years | 10 (100.0%) | 3 (100.0%) |
| 12 to 14 Years | 5 (100.0%) | 3 (100.0%) |
| 15 Years | 0 (0.0%) | 0 (0.0%) |
| 16 and 17 Years | 5 (100.0%) | 7 (100.0%) |
| 18 to 24 Years | 12 (70.6%) | 18 (78.3%) |
| 25 to 34 Years | 31 (100.0%) | 15 (93.8%) |
| 35 to 44 Years | 22 (100.0%) | 24 (100.0%) |
| 45 to 54 Years | 17 (100.0%) | 18 (85.7%) |
| 55 to 64 Years | 45 (90.0%) | 16 (94.1%) |
| 65 to 74 Years | 18 (81.8%) | 15 (71.4%) |
| 75 Years and over | 16 (100.0%) | 11 (78.6%) |
| Total | 192 (93.2%) | 137 (87.8%) |
Income Below Poverty Among Married-Couple Families in Bay City
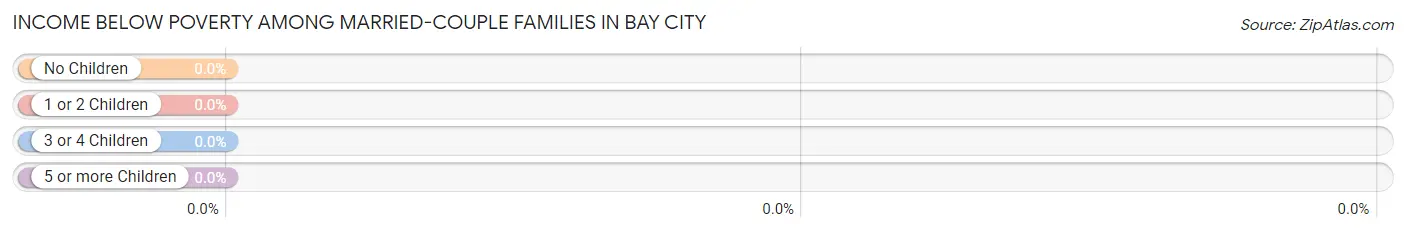
| Children | Above Poverty | Below Poverty |
| No Children | 36 (100.0%) | 0 (0.0%) |
| 1 or 2 Children | 5 (100.0%) | 0 (0.0%) |
| 3 or 4 Children | 7 (100.0%) | 0 (0.0%) |
| 5 or more Children | 0 (0.0%) | 0 (0.0%) |
| Total | 48 (100.0%) | 0 (0.0%) |
Income Below Poverty Among Single-Parent Households in Bay City
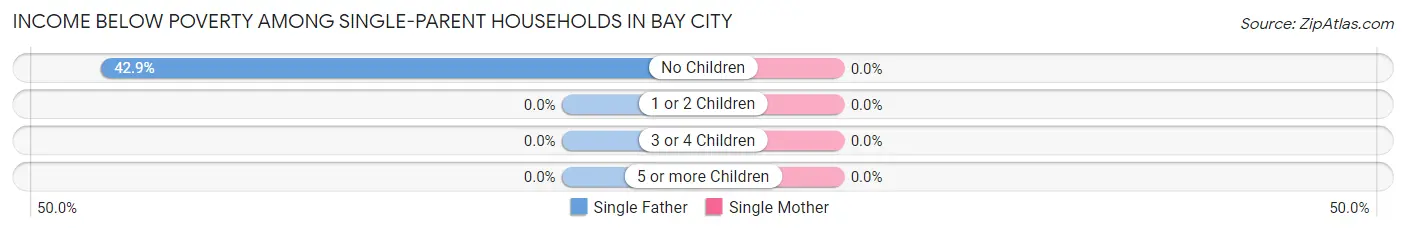
| Children | Single Father | Single Mother |
| No Children | 3 (42.9%) | 0 (0.0%) |
| 1 or 2 Children | 0 (0.0%) | 0 (0.0%) |
| 3 or 4 Children | 0 (0.0%) | 0 (0.0%) |
| 5 or more Children | 0 (0.0%) | 0 (0.0%) |
| Total | 3 (18.8%) | 0 (0.0%) |
Income Below Poverty Among Married-Couple vs Single-Parent Households in Bay City
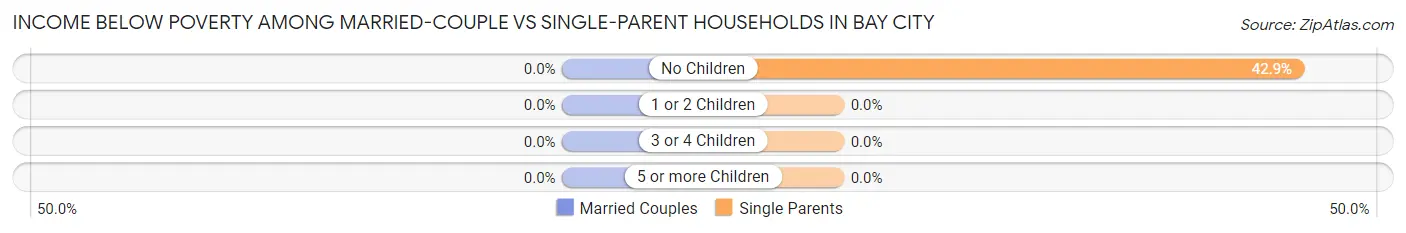
| Children | Married-Couple Families | Single-Parent Households |
| No Children | 0 (0.0%) | 3 (42.9%) |
| 1 or 2 Children | 0 (0.0%) | 0 (0.0%) |
| 3 or 4 Children | 0 (0.0%) | 0 (0.0%) |
| 5 or more Children | 0 (0.0%) | 0 (0.0%) |
| Total | 0 (0.0%) | 3 (10.3%) |
Race in Bay City
The most populous races in Bay City are White / Caucasian (361 | 99.7%), and Two or more Races (1 | 0.3%).
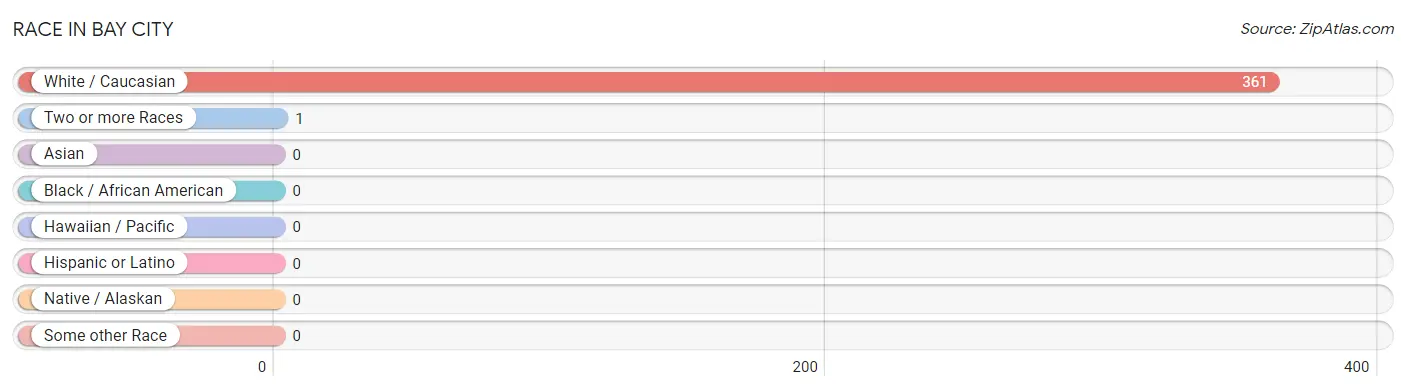
| Race | # Population | % Population |
| Asian | 0 | 0.0% |
| Black / African American | 0 | 0.0% |
| Hawaiian / Pacific | 0 | 0.0% |
| Hispanic or Latino | 0 | 0.0% |
| Native / Alaskan | 0 | 0.0% |
| White / Caucasian | 361 | 99.7% |
| Two or more Races | 1 | 0.3% |
| Some other Race | 0 | 0.0% |
| Total | 362 | 100.0% |
Ancestry in Bay City
The most populous ancestries reported in Bay City are German (160 | 44.2%), Norwegian (67 | 18.5%), American (26 | 7.2%), Irish (23 | 6.4%), and Swedish (23 | 6.4%), together accounting for 82.6% of all Bay City residents.
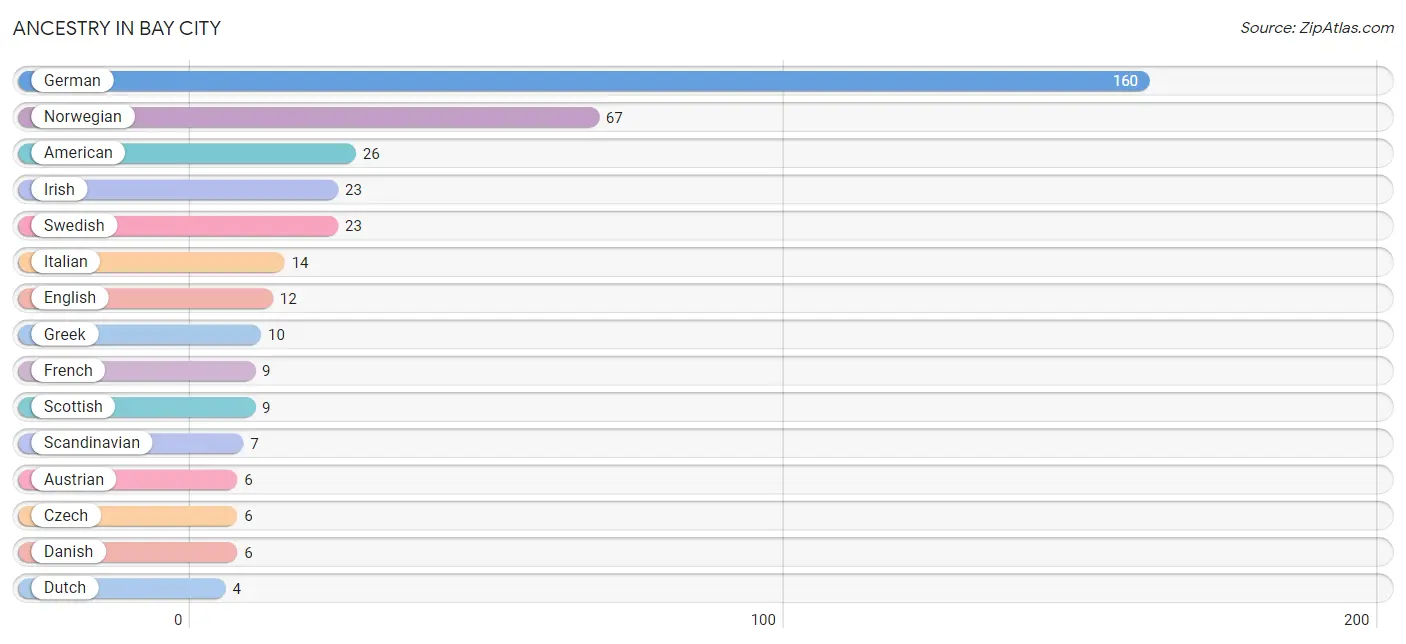
| Ancestry | # Population | % Population |
| American | 26 | 7.2% |
| Austrian | 6 | 1.7% |
| Bulgarian | 1 | 0.3% |
| Czech | 6 | 1.7% |
| Danish | 6 | 1.7% |
| Dutch | 4 | 1.1% |
| English | 12 | 3.3% |
| Finnish | 2 | 0.5% |
| French | 9 | 2.5% |
| French Canadian | 1 | 0.3% |
| German | 160 | 44.2% |
| Greek | 10 | 2.8% |
| Irish | 23 | 6.4% |
| Italian | 14 | 3.9% |
| Norwegian | 67 | 18.5% |
| Polish | 4 | 1.1% |
| Scandinavian | 7 | 1.9% |
| Scottish | 9 | 2.5% |
| Swedish | 23 | 6.4% |
| View All 19 Rows |
Immigrants in Bay City
The most numerous immigrant groups reported in Bay City came from Europe (9 | 2.5%), Northern Europe (8 | 2.2%), Norway (3 | 0.8%), Asia (2 | 0.5%), and Israel (2 | 0.5%), together accounting for 6.6% of all Bay City residents.
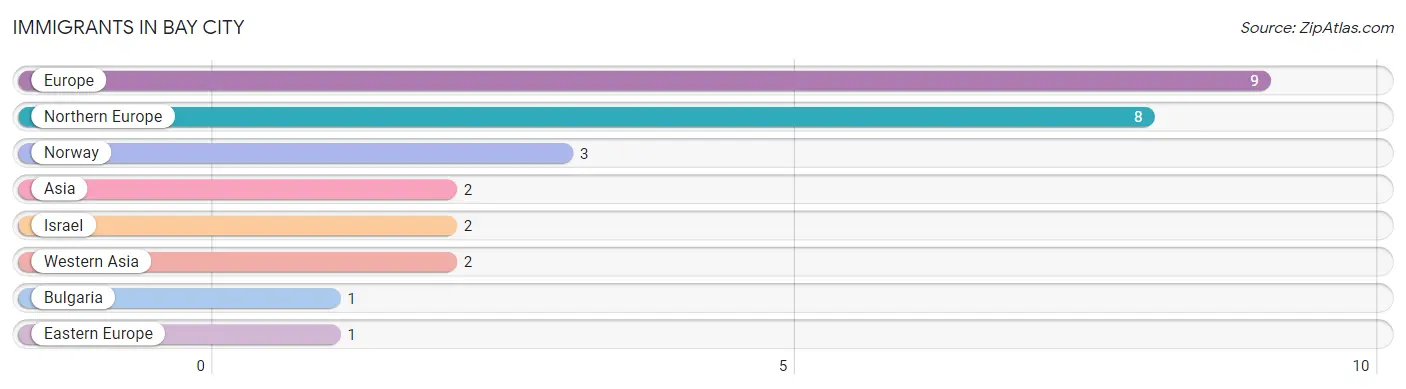
| Immigration Origin | # Population | % Population |
| Asia | 2 | 0.5% |
| Bulgaria | 1 | 0.3% |
| Eastern Europe | 1 | 0.3% |
| Europe | 9 | 2.5% |
| Israel | 2 | 0.5% |
| Northern Europe | 8 | 2.2% |
| Norway | 3 | 0.8% |
| Western Asia | 2 | 0.5% |
| View All 8 Rows |
Sex and Age in Bay City
Sex and Age in Bay City
The most populous age groups in Bay City are 55 to 59 Years (26 | 12.6%) for men and 20 to 24 Years (18 | 11.5%) for women.
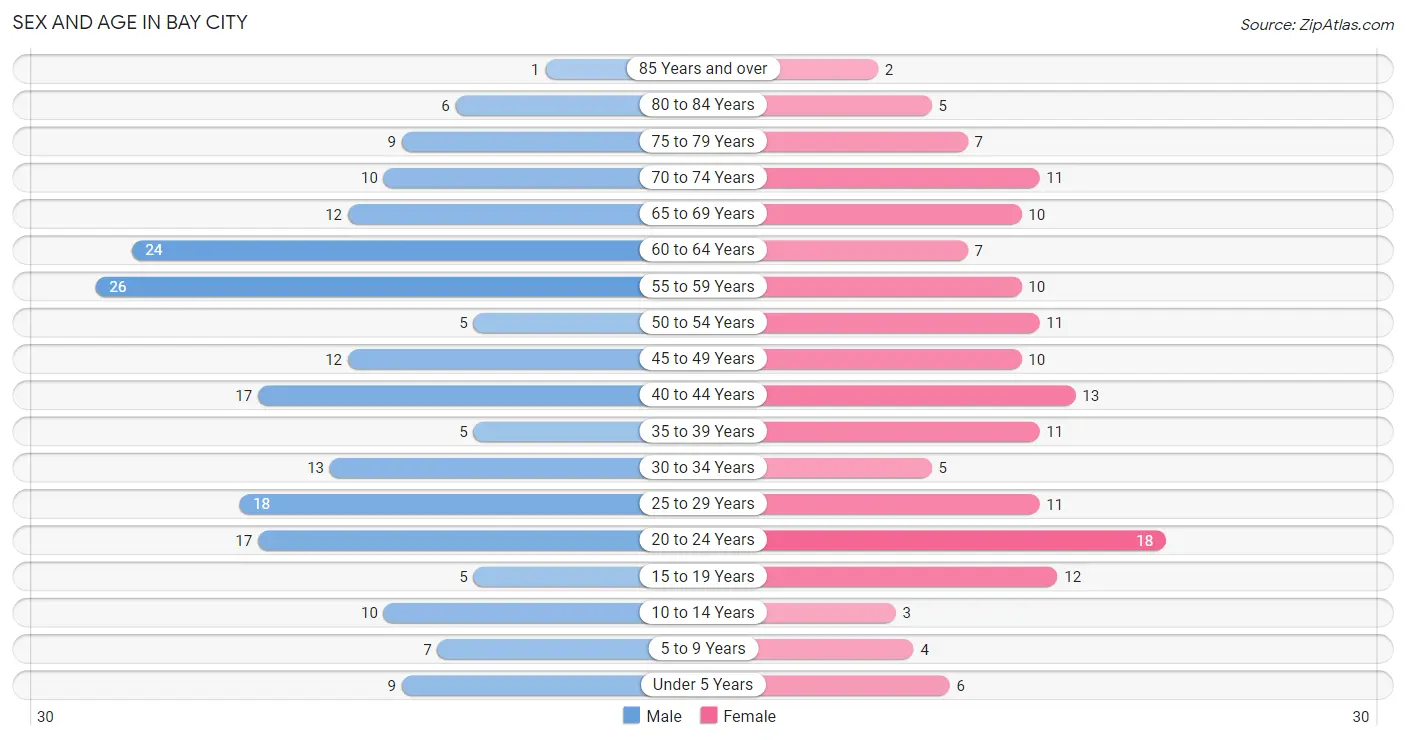
| Age Bracket | Male | Female |
| Under 5 Years | 9 (4.4%) | 6 (3.8%) |
| 5 to 9 Years | 7 (3.4%) | 4 (2.6%) |
| 10 to 14 Years | 10 (4.9%) | 3 (1.9%) |
| 15 to 19 Years | 5 (2.4%) | 12 (7.7%) |
| 20 to 24 Years | 17 (8.3%) | 18 (11.5%) |
| 25 to 29 Years | 18 (8.7%) | 11 (7.0%) |
| 30 to 34 Years | 13 (6.3%) | 5 (3.2%) |
| 35 to 39 Years | 5 (2.4%) | 11 (7.0%) |
| 40 to 44 Years | 17 (8.3%) | 13 (8.3%) |
| 45 to 49 Years | 12 (5.8%) | 10 (6.4%) |
| 50 to 54 Years | 5 (2.4%) | 11 (7.0%) |
| 55 to 59 Years | 26 (12.6%) | 10 (6.4%) |
| 60 to 64 Years | 24 (11.7%) | 7 (4.5%) |
| 65 to 69 Years | 12 (5.8%) | 10 (6.4%) |
| 70 to 74 Years | 10 (4.9%) | 11 (7.0%) |
| 75 to 79 Years | 9 (4.4%) | 7 (4.5%) |
| 80 to 84 Years | 6 (2.9%) | 5 (3.2%) |
| 85 Years and over | 1 (0.5%) | 2 (1.3%) |
| Total | 206 (100.0%) | 156 (100.0%) |
Families and Households in Bay City
Median Family Size in Bay City
The median family size in Bay City is 2.91 persons per family, with married-couple families (48 | 62.3%) accounting for the largest median family size of 3.04 persons per family. On the other hand, single female/mother families (13 | 16.9%) represent the smallest median family size with 2.62 persons per family.
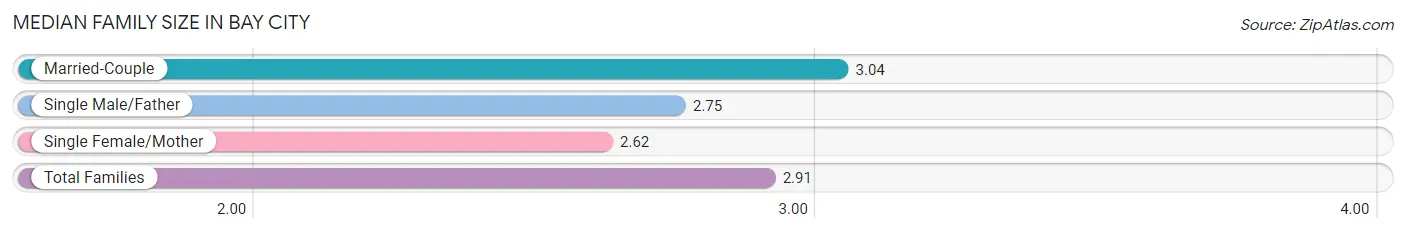
| Family Type | # Families | Family Size |
| Married-Couple | 48 (62.3%) | 3.04 |
| Single Male/Father | 16 (20.8%) | 2.75 |
| Single Female/Mother | 13 (16.9%) | 2.62 |
| Total Families | 77 (100.0%) | 2.91 |
Median Household Size in Bay City
The median household size in Bay City is 2.21 persons per household, with single male/father households (16 | 9.8%) accounting for the largest median household size of 3.25 persons per household. non-family households (87 | 53.0%) represent the smallest median household size with 1.43 persons per household.
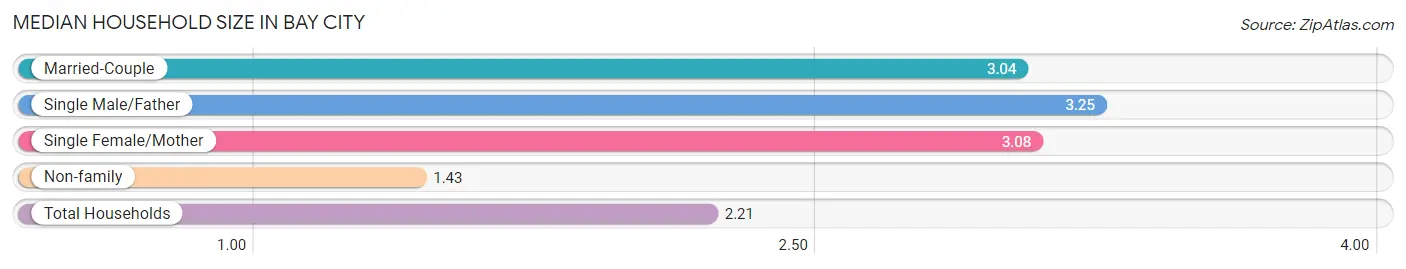
| Household Type | # Households | Household Size |
| Married-Couple | 48 (29.3%) | 3.04 |
| Single Male/Father | 16 (9.8%) | 3.25 |
| Single Female/Mother | 13 (7.9%) | 3.08 |
| Non-family | 87 (53.0%) | 1.43 |
| Total Households | 164 (100.0%) | 2.21 |
Household Size by Marriage Status in Bay City
Out of a total of 164 households in Bay City, 77 (46.9%) are family households, while 87 (53.0%) are nonfamily households. The most numerous type of family households are 2-person households, comprising 38, and the most common type of nonfamily households are 1-person households, comprising 61.
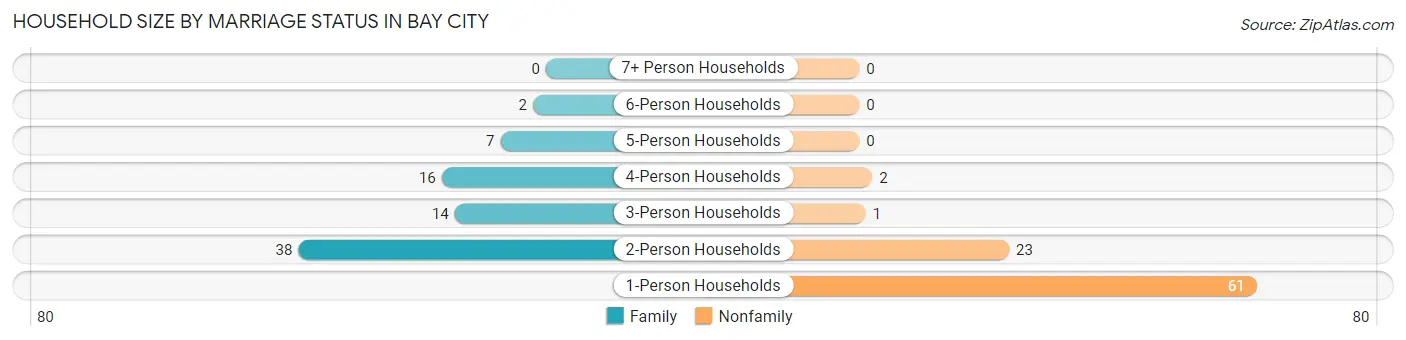
| Household Size | Family Households | Nonfamily Households |
| 1-Person Households | - | 61 (37.2%) |
| 2-Person Households | 38 (23.2%) | 23 (14.0%) |
| 3-Person Households | 14 (8.5%) | 1 (0.6%) |
| 4-Person Households | 16 (9.8%) | 2 (1.2%) |
| 5-Person Households | 7 (4.3%) | 0 (0.0%) |
| 6-Person Households | 2 (1.2%) | 0 (0.0%) |
| 7+ Person Households | 0 (0.0%) | 0 (0.0%) |
| Total | 77 (46.9%) | 87 (53.0%) |
Female Fertility in Bay City
Fertility by Age in Bay City
Average fertility rate in Bay City is 60.0 births per 1,000 women. Women in the age bracket of 20 to 34 years have the highest fertility rate with 147.0 births per 1,000 women. Women in the age bracket of 20 to 34 years acount for 100.0% of all women with births.
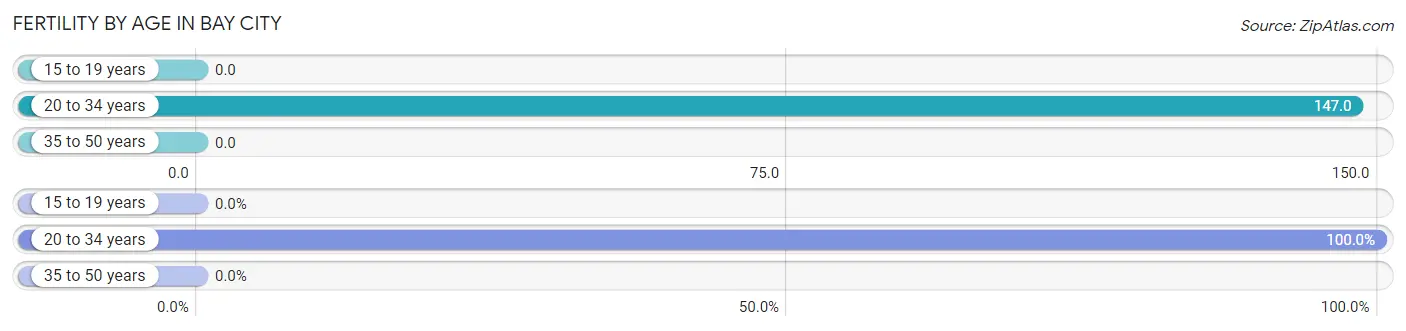
| Age Bracket | Women with Births | Births / 1,000 Women |
| 15 to 19 years | 0 (0.0%) | 0.0 |
| 20 to 34 years | 5 (100.0%) | 147.0 |
| 35 to 50 years | 0 (0.0%) | 0.0 |
| Total | 5 (100.0%) | 60.0 |
Fertility by Age by Marriage Status in Bay City
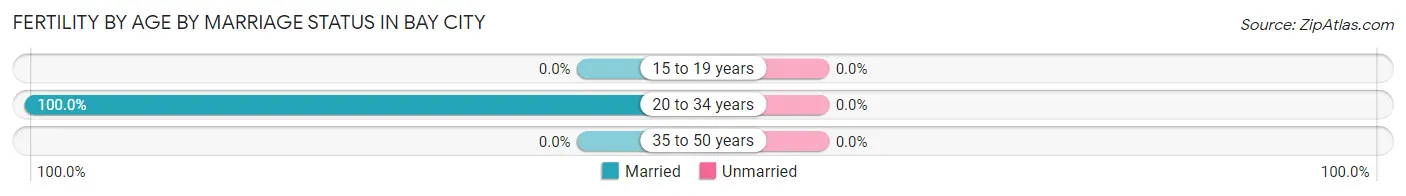
| Age Bracket | Married | Unmarried |
| 15 to 19 years | 0 (0.0%) | 0 (0.0%) |
| 20 to 34 years | 5 (100.0%) | 0 (0.0%) |
| 35 to 50 years | 0 (0.0%) | 0 (0.0%) |
| Total | 5 (100.0%) | 0 (0.0%) |
Fertility by Education in Bay City
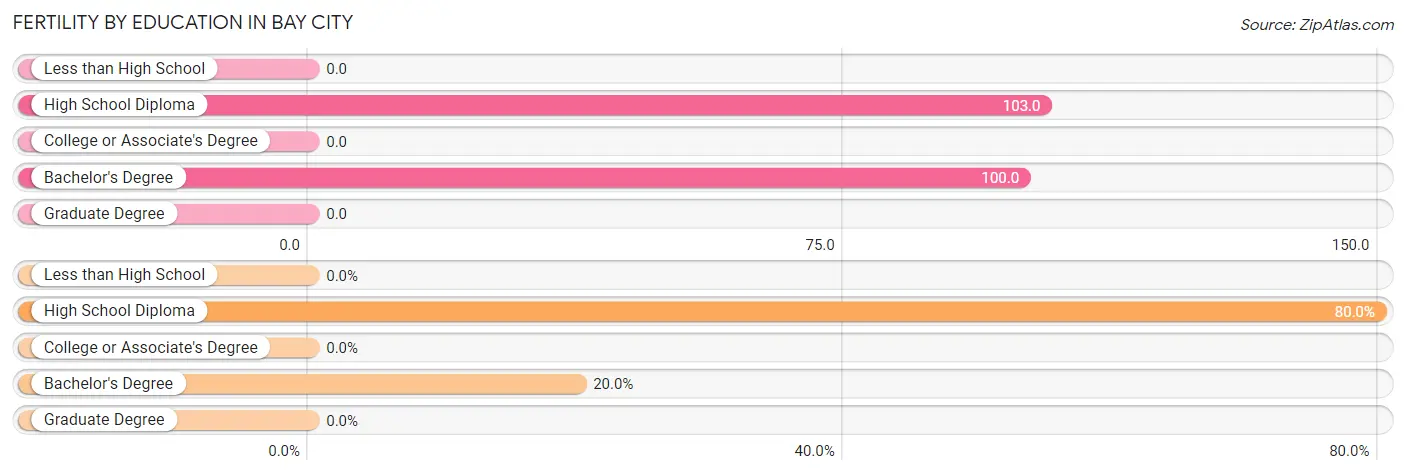
| Educational Attainment | Women with Births | Births / 1,000 Women |
| Less than High School | 0 (0.0%) | 0.0 |
| High School Diploma | 4 (80.0%) | 103.0 |
| College or Associate's Degree | 0 (0.0%) | 0.0 |
| Bachelor's Degree | 1 (20.0%) | 100.0 |
| Graduate Degree | 0 (0.0%) | 0.0 |
| Total | 5 (100.0%) | 60.0 |
Fertility by Education by Marriage Status in Bay City
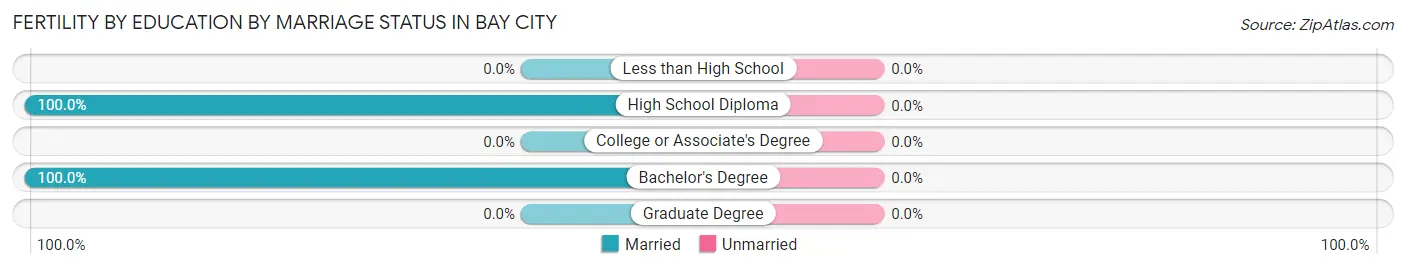
| Educational Attainment | Married | Unmarried |
| Less than High School | 0 (0.0%) | 0 (0.0%) |
| High School Diploma | 4 (100.0%) | 0 (0.0%) |
| College or Associate's Degree | 0 (0.0%) | 0 (0.0%) |
| Bachelor's Degree | 1 (100.0%) | 0 (0.0%) |
| Graduate Degree | 0 (0.0%) | 0 (0.0%) |
| Total | 5 (100.0%) | 0 (0.0%) |
Employment Characteristics in Bay City
Employment by Class of Employer in Bay City
Among the 206 employed individuals in Bay City, private company employees (171 | 83.0%), self-employed (not incorporated) (9 | 4.4%), and local government employees (9 | 4.4%) make up the most common classes of employment.
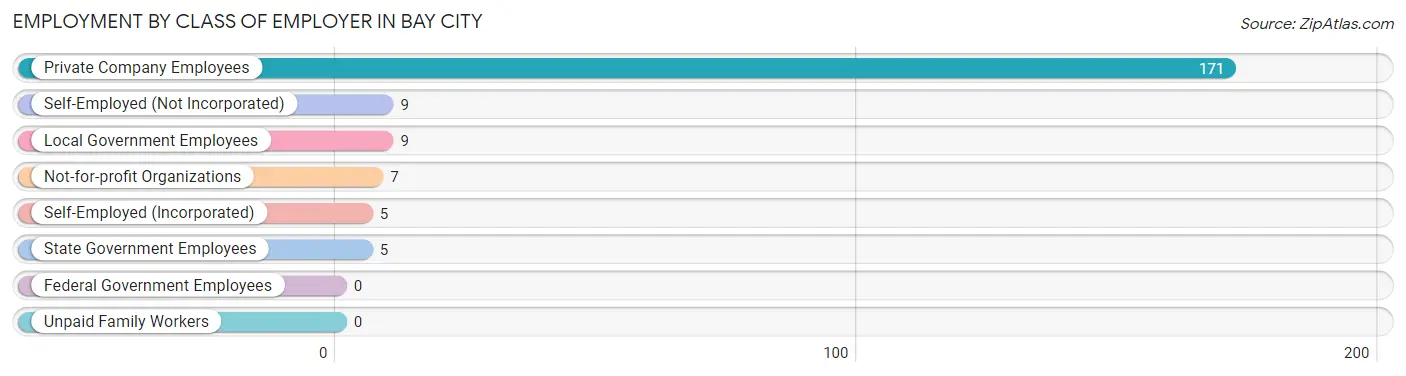
| Employer Class | # Employees | % Employees |
| Private Company Employees | 171 | 83.0% |
| Self-Employed (Incorporated) | 5 | 2.4% |
| Self-Employed (Not Incorporated) | 9 | 4.4% |
| Not-for-profit Organizations | 7 | 3.4% |
| Local Government Employees | 9 | 4.4% |
| State Government Employees | 5 | 2.4% |
| Federal Government Employees | 0 | 0.0% |
| Unpaid Family Workers | 0 | 0.0% |
| Total | 206 | 100.0% |
Employment Status by Age in Bay City
According to the labor force statistics for Bay City, out of the total population over 16 years of age (323), 65.3% or 211 individuals are in the labor force, with 2.4% or 5 of them unemployed. The age group with the highest labor force participation rate is 35 to 44 years, with 97.8% or 45 individuals in the labor force. Within the labor force, the 75 years and over age range has the highest percentage of unemployed individuals, with 66.7% or 2 of them being unemployed.
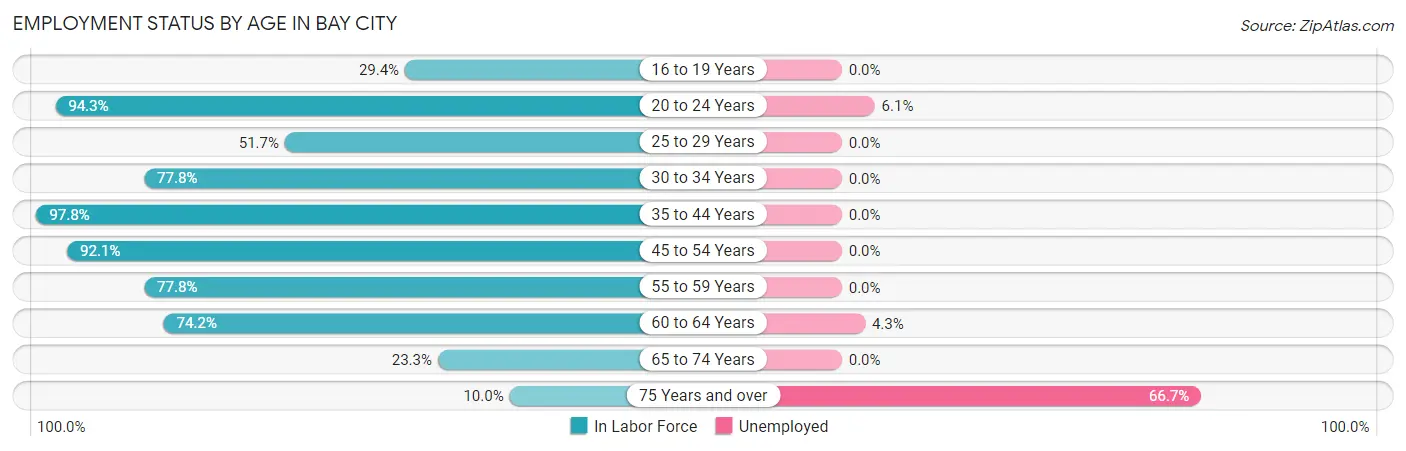
| Age Bracket | In Labor Force | Unemployed |
| 16 to 19 Years | 5 (29.4%) | 0 (0.0%) |
| 20 to 24 Years | 33 (94.3%) | 2 (6.1%) |
| 25 to 29 Years | 15 (51.7%) | 0 (0.0%) |
| 30 to 34 Years | 14 (77.8%) | 0 (0.0%) |
| 35 to 44 Years | 45 (97.8%) | 0 (0.0%) |
| 45 to 54 Years | 35 (92.1%) | 0 (0.0%) |
| 55 to 59 Years | 28 (77.8%) | 0 (0.0%) |
| 60 to 64 Years | 23 (74.2%) | 1 (4.3%) |
| 65 to 74 Years | 10 (23.3%) | 0 (0.0%) |
| 75 Years and over | 3 (10.0%) | 2 (66.7%) |
| Total | 211 (65.3%) | 5 (2.4%) |
Employment Status by Educational Attainment in Bay City
According to labor force statistics for Bay City, 80.8% of individuals (160) out of the total population between 25 and 64 years of age (198) are in the labor force, with 0.6% or 1 of them being unemployed. The group with the highest labor force participation rate are those with the educational attainment of bachelor's degree or higher, with 95.5% or 21 individuals in the labor force. Within the labor force, individuals with bachelor's degree or higher education have the highest percentage of unemployment, with 4.8% or 1 of them being unemployed.
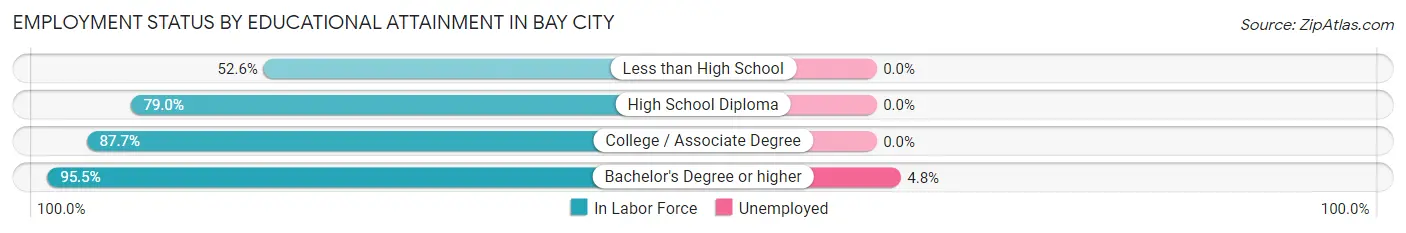
| Educational Attainment | In Labor Force | Unemployed |
| Less than High School | 10 (52.6%) | 0 (0.0%) |
| High School Diploma | 79 (79.0%) | 0 (0.0%) |
| College / Associate Degree | 50 (87.7%) | 0 (0.0%) |
| Bachelor's Degree or higher | 21 (95.5%) | 1 (4.8%) |
| Total | 160 (80.8%) | 1 (0.6%) |
Employment Occupations by Sex in Bay City
Management, Business, Science and Arts Occupations
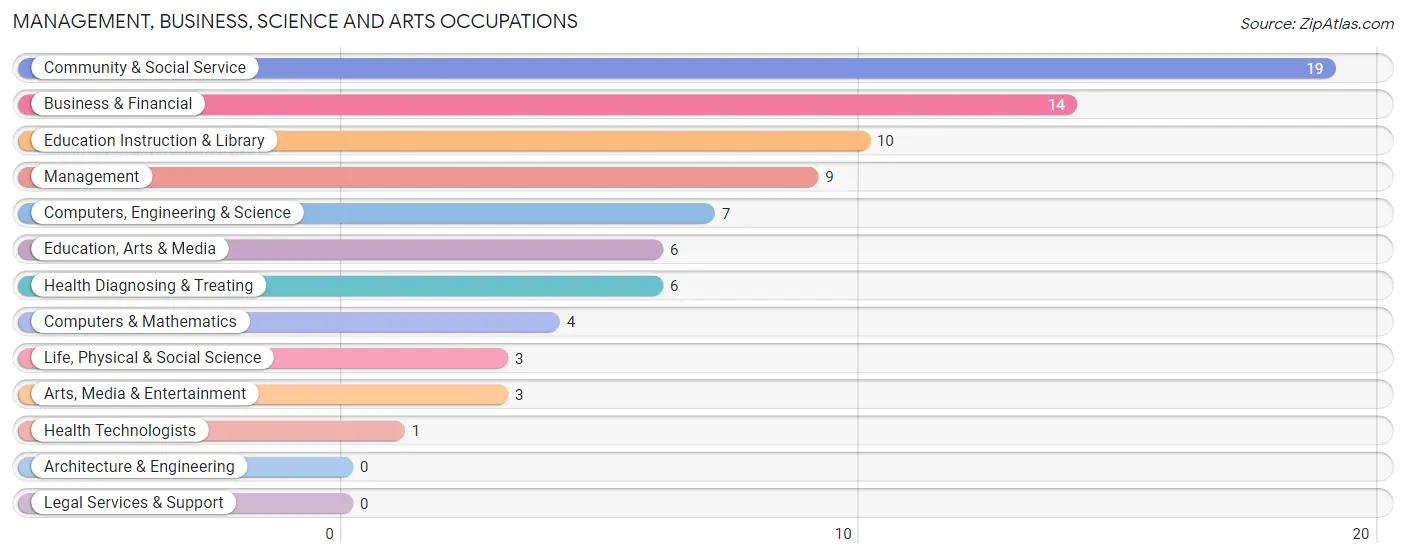
The most common Management, Business, Science and Arts occupations in Bay City are Community & Social Service (19 | 9.2%), Business & Financial (14 | 6.8%), Education Instruction & Library (10 | 4.9%), Management (9 | 4.4%), and Computers, Engineering & Science (7 | 3.4%).
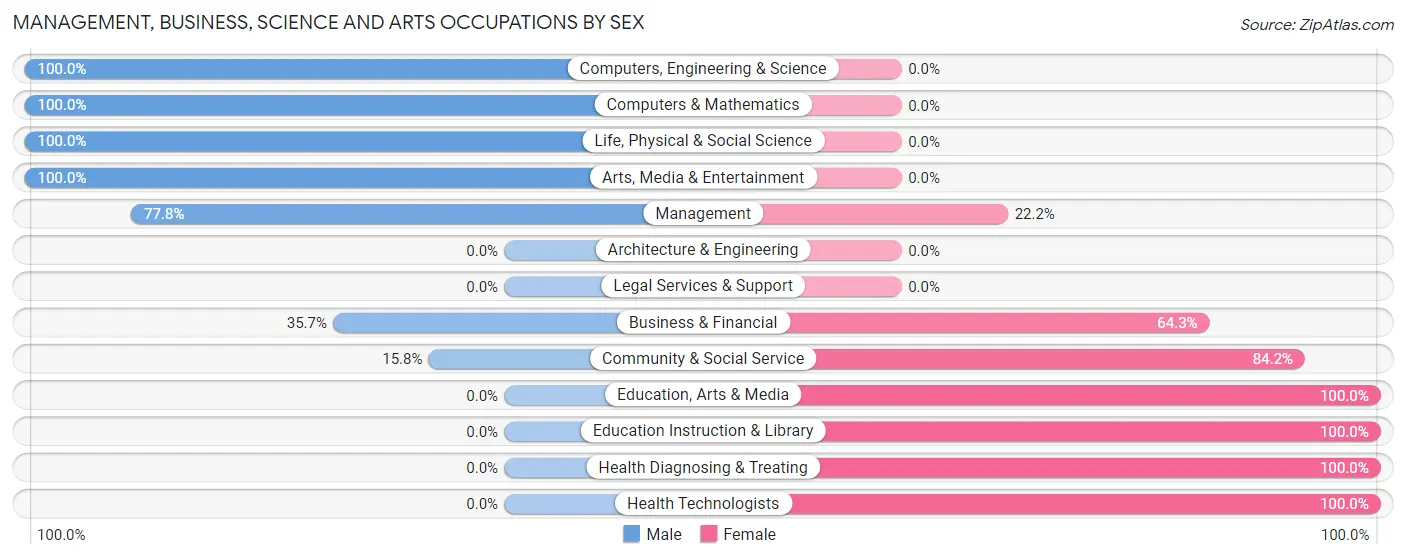
Management, Business, Science and Arts Occupations by Sex
Within the Management, Business, Science and Arts occupations in Bay City, the most male-oriented occupations are Computers, Engineering & Science (100.0%), Computers & Mathematics (100.0%), and Life, Physical & Social Science (100.0%), while the most female-oriented occupations are Education, Arts & Media (100.0%), Education Instruction & Library (100.0%), and Health Diagnosing & Treating (100.0%).
| Occupation | Male | Female |
| Management | 7 (77.8%) | 2 (22.2%) |
| Business & Financial | 5 (35.7%) | 9 (64.3%) |
| Computers, Engineering & Science | 7 (100.0%) | 0 (0.0%) |
| Computers & Mathematics | 4 (100.0%) | 0 (0.0%) |
| Architecture & Engineering | 0 (0.0%) | 0 (0.0%) |
| Life, Physical & Social Science | 3 (100.0%) | 0 (0.0%) |
| Community & Social Service | 3 (15.8%) | 16 (84.2%) |
| Education, Arts & Media | 0 (0.0%) | 6 (100.0%) |
| Legal Services & Support | 0 (0.0%) | 0 (0.0%) |
| Education Instruction & Library | 0 (0.0%) | 10 (100.0%) |
| Arts, Media & Entertainment | 3 (100.0%) | 0 (0.0%) |
| Health Diagnosing & Treating | 0 (0.0%) | 6 (100.0%) |
| Health Technologists | 0 (0.0%) | 1 (100.0%) |
| Total (Category) | 22 (40.0%) | 33 (60.0%) |
| Total (Overall) | 121 (58.7%) | 85 (41.3%) |
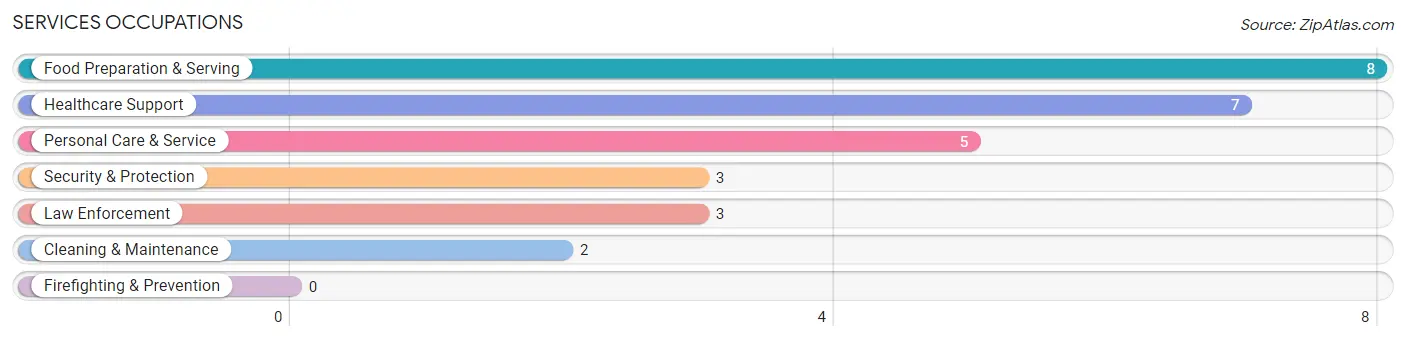
Services Occupations
The most common Services occupations in Bay City are Food Preparation & Serving (8 | 3.9%), Healthcare Support (7 | 3.4%), Personal Care & Service (5 | 2.4%), Security & Protection (3 | 1.5%), and Law Enforcement (3 | 1.5%).
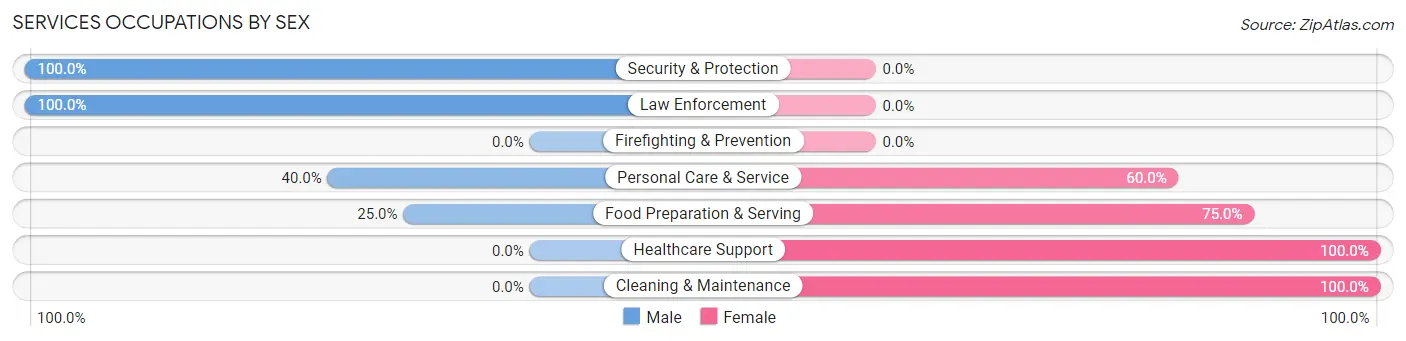
Services Occupations by Sex
Within the Services occupations in Bay City, the most male-oriented occupations are Security & Protection (100.0%), Law Enforcement (100.0%), and Personal Care & Service (40.0%), while the most female-oriented occupations are Healthcare Support (100.0%), Cleaning & Maintenance (100.0%), and Food Preparation & Serving (75.0%).
| Occupation | Male | Female |
| Healthcare Support | 0 (0.0%) | 7 (100.0%) |
| Security & Protection | 3 (100.0%) | 0 (0.0%) |
| Firefighting & Prevention | 0 (0.0%) | 0 (0.0%) |
| Law Enforcement | 3 (100.0%) | 0 (0.0%) |
| Food Preparation & Serving | 2 (25.0%) | 6 (75.0%) |
| Cleaning & Maintenance | 0 (0.0%) | 2 (100.0%) |
| Personal Care & Service | 2 (40.0%) | 3 (60.0%) |
| Total (Category) | 7 (28.0%) | 18 (72.0%) |
| Total (Overall) | 121 (58.7%) | 85 (41.3%) |
Sales and Office Occupations
The most common Sales and Office occupations in Bay City are Sales & Related (19 | 9.2%), and Office & Administration (15 | 7.3%).
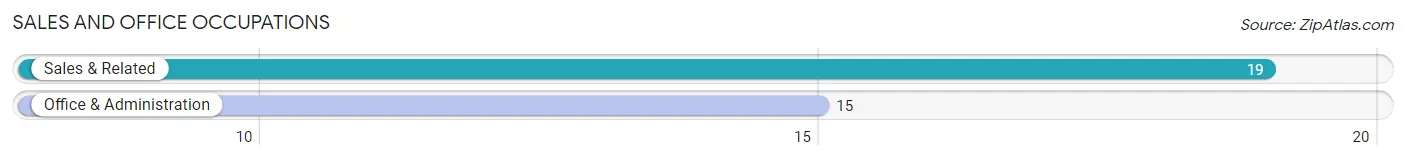
Sales and Office Occupations by Sex
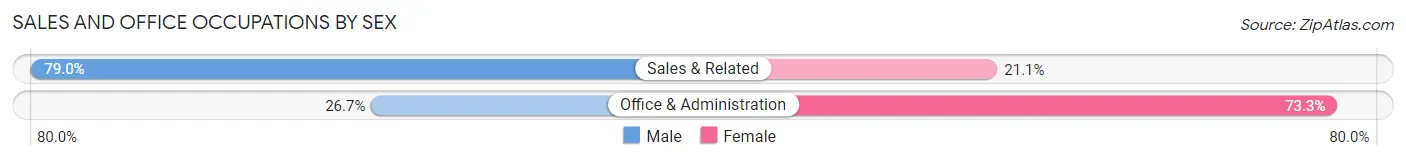
| Occupation | Male | Female |
| Sales & Related | 15 (78.9%) | 4 (21.0%) |
| Office & Administration | 4 (26.7%) | 11 (73.3%) |
| Total (Category) | 19 (55.9%) | 15 (44.1%) |
| Total (Overall) | 121 (58.7%) | 85 (41.3%) |
Natural Resources, Construction and Maintenance Occupations
The most common Natural Resources, Construction and Maintenance occupations in Bay City are Construction & Extraction (19 | 9.2%), and Installation, Maintenance & Repair (18 | 8.7%).
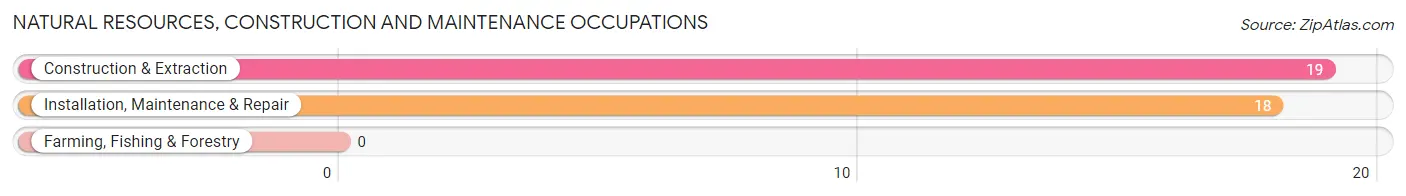
Natural Resources, Construction and Maintenance Occupations by Sex
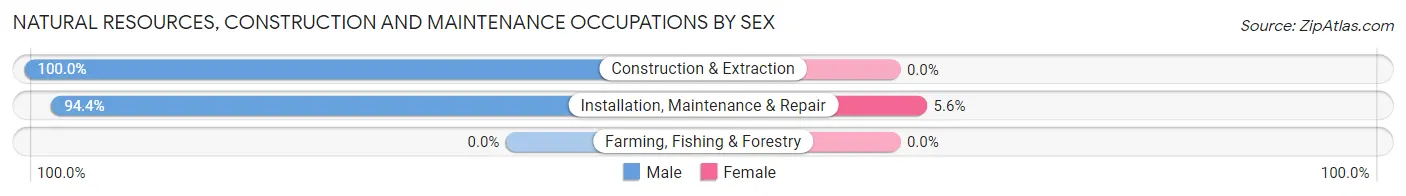
| Occupation | Male | Female |
| Farming, Fishing & Forestry | 0 (0.0%) | 0 (0.0%) |
| Construction & Extraction | 19 (100.0%) | 0 (0.0%) |
| Installation, Maintenance & Repair | 17 (94.4%) | 1 (5.6%) |
| Total (Category) | 36 (97.3%) | 1 (2.7%) |
| Total (Overall) | 121 (58.7%) | 85 (41.3%) |
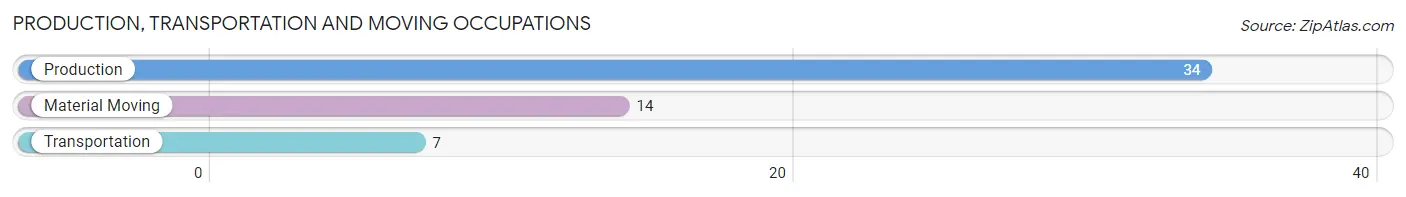
Production, Transportation and Moving Occupations
The most common Production, Transportation and Moving occupations in Bay City are Production (34 | 16.5%), Material Moving (14 | 6.8%), and Transportation (7 | 3.4%).
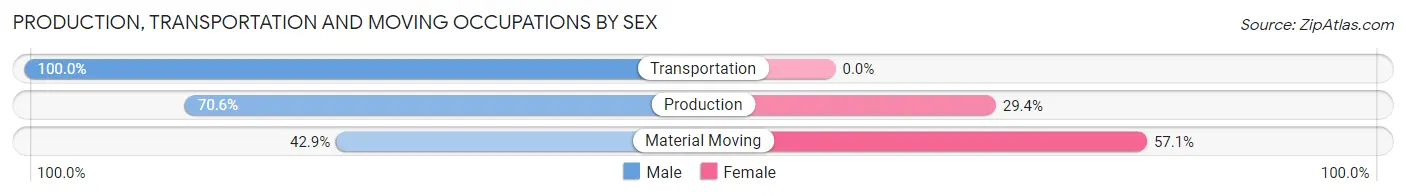
Production, Transportation and Moving Occupations by Sex
| Occupation | Male | Female |
| Production | 24 (70.6%) | 10 (29.4%) |
| Transportation | 7 (100.0%) | 0 (0.0%) |
| Material Moving | 6 (42.9%) | 8 (57.1%) |
| Total (Category) | 37 (67.3%) | 18 (32.7%) |
| Total (Overall) | 121 (58.7%) | 85 (41.3%) |
Employment Industries by Sex in Bay City
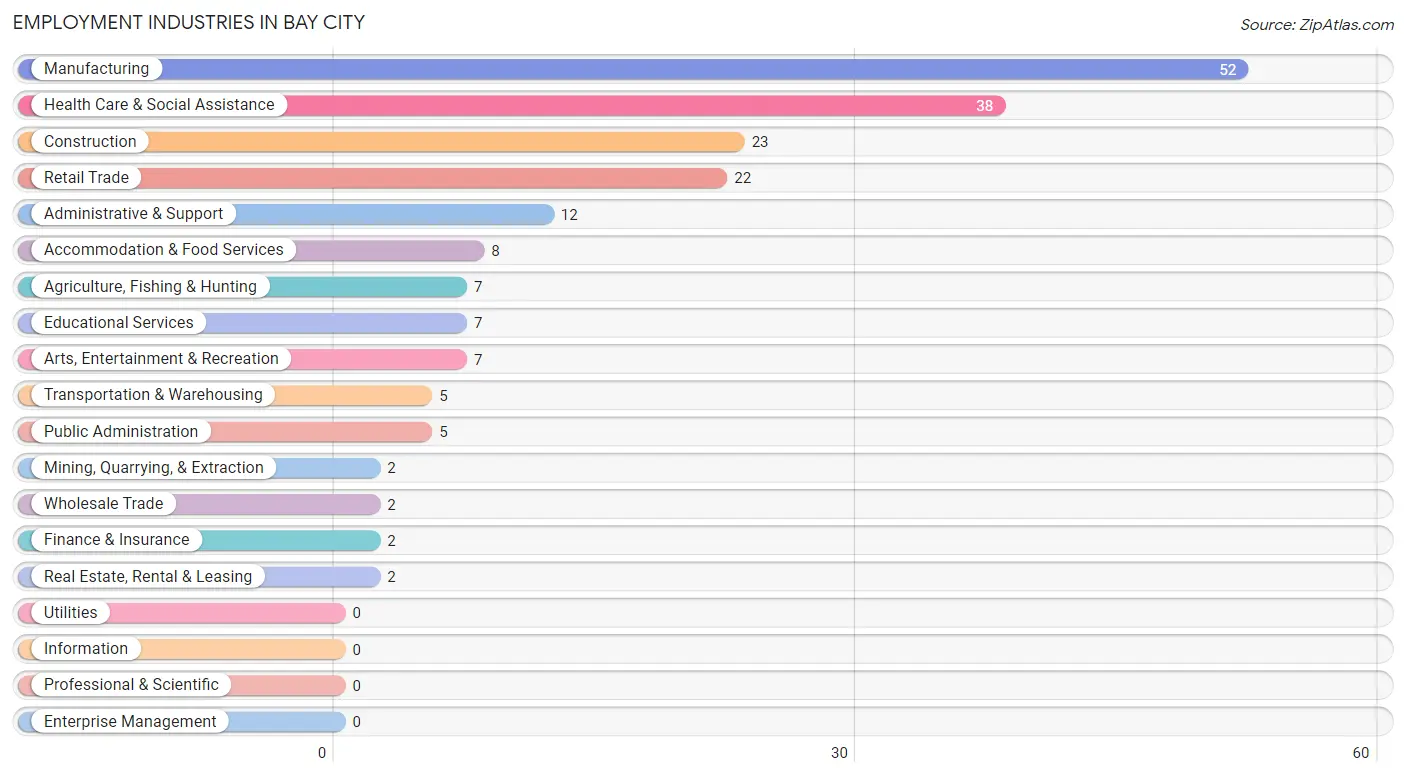
Employment Industries in Bay City
The major employment industries in Bay City include Manufacturing (52 | 25.2%), Health Care & Social Assistance (38 | 18.4%), Construction (23 | 11.2%), Retail Trade (22 | 10.7%), and Administrative & Support (12 | 5.8%).
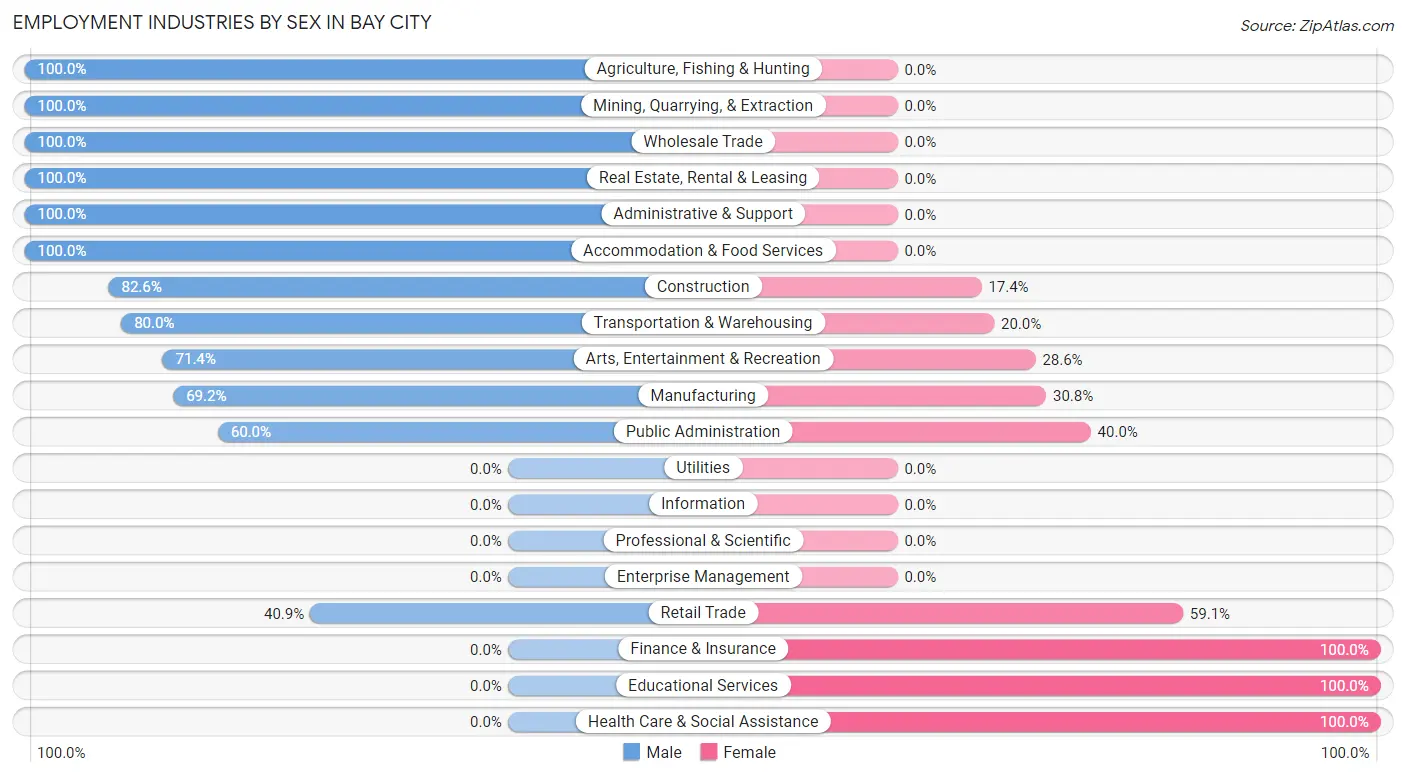
Employment Industries by Sex in Bay City
The Bay City industries that see more men than women are Agriculture, Fishing & Hunting (100.0%), Mining, Quarrying, & Extraction (100.0%), and Wholesale Trade (100.0%), whereas the industries that tend to have a higher number of women are Finance & Insurance (100.0%), Educational Services (100.0%), and Health Care & Social Assistance (100.0%).
| Industry | Male | Female |
| Agriculture, Fishing & Hunting | 7 (100.0%) | 0 (0.0%) |
| Mining, Quarrying, & Extraction | 2 (100.0%) | 0 (0.0%) |
| Construction | 19 (82.6%) | 4 (17.4%) |
| Manufacturing | 36 (69.2%) | 16 (30.8%) |
| Wholesale Trade | 2 (100.0%) | 0 (0.0%) |
| Retail Trade | 9 (40.9%) | 13 (59.1%) |
| Transportation & Warehousing | 4 (80.0%) | 1 (20.0%) |
| Utilities | 0 (0.0%) | 0 (0.0%) |
| Information | 0 (0.0%) | 0 (0.0%) |
| Finance & Insurance | 0 (0.0%) | 2 (100.0%) |
| Real Estate, Rental & Leasing | 2 (100.0%) | 0 (0.0%) |
| Professional & Scientific | 0 (0.0%) | 0 (0.0%) |
| Enterprise Management | 0 (0.0%) | 0 (0.0%) |
| Administrative & Support | 12 (100.0%) | 0 (0.0%) |
| Educational Services | 0 (0.0%) | 7 (100.0%) |
| Health Care & Social Assistance | 0 (0.0%) | 38 (100.0%) |
| Arts, Entertainment & Recreation | 5 (71.4%) | 2 (28.6%) |
| Accommodation & Food Services | 8 (100.0%) | 0 (0.0%) |
| Public Administration | 3 (60.0%) | 2 (40.0%) |
| Total | 121 (58.7%) | 85 (41.3%) |
Education in Bay City
School Enrollment in Bay City
The most common levels of schooling among the 48 students in Bay City are college / undergraduate (13 | 27.1%), elementary school (11 | 22.9%), and middle school (9 | 18.8%).
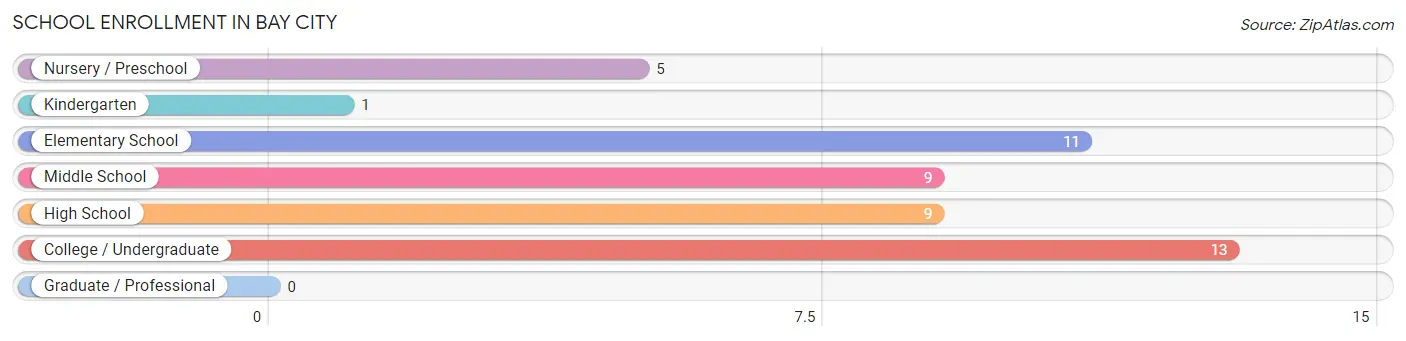
| School Level | # Students | % Students |
| Nursery / Preschool | 5 | 10.4% |
| Kindergarten | 1 | 2.1% |
| Elementary School | 11 | 22.9% |
| Middle School | 9 | 18.8% |
| High School | 9 | 18.8% |
| College / Undergraduate | 13 | 27.1% |
| Graduate / Professional | 0 | 0.0% |
| Total | 48 | 100.0% |
School Enrollment by Age by Funding Source in Bay City
Out of a total of 48 students who are enrolled in schools in Bay City, 1 (2.1%) attend a private institution, while the remaining 47 (97.9%) are enrolled in public schools. The age group of 5 to 9 year old has the highest likelihood of being enrolled in private schools, with 1 (10.0% in the age bracket) enrolled. Conversely, the age group of 3 to 4 year olds has the lowest likelihood of being enrolled in a private school, with 3 (100.0% in the age bracket) attending a public institution.
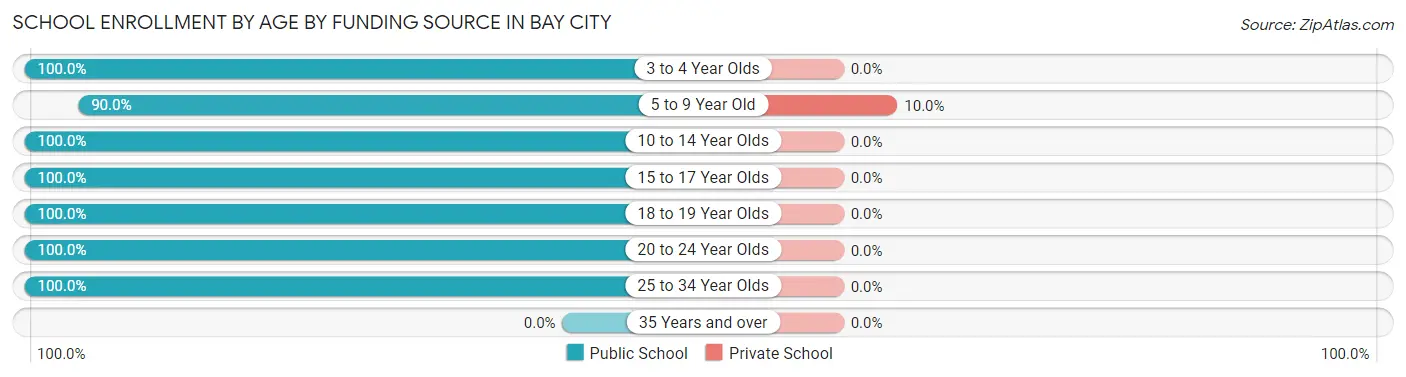
| Age Bracket | Public School | Private School |
| 3 to 4 Year Olds | 3 (100.0%) | 0 (0.0%) |
| 5 to 9 Year Old | 9 (90.0%) | 1 (10.0%) |
| 10 to 14 Year Olds | 13 (100.0%) | 0 (0.0%) |
| 15 to 17 Year Olds | 9 (100.0%) | 0 (0.0%) |
| 18 to 19 Year Olds | 2 (100.0%) | 0 (0.0%) |
| 20 to 24 Year Olds | 6 (100.0%) | 0 (0.0%) |
| 25 to 34 Year Olds | 5 (100.0%) | 0 (0.0%) |
| 35 Years and over | 0 (0.0%) | 0 (0.0%) |
| Total | 47 (97.9%) | 1 (2.1%) |
Educational Attainment by Field of Study in Bay City
Business (10 | 35.7%), education (9 | 32.1%), computers & mathematics (4 | 14.3%), psychology (2 | 7.1%), and physical & health sciences (1 | 3.6%) are the most common fields of study among 28 individuals in Bay City who have obtained a bachelor's degree or higher.
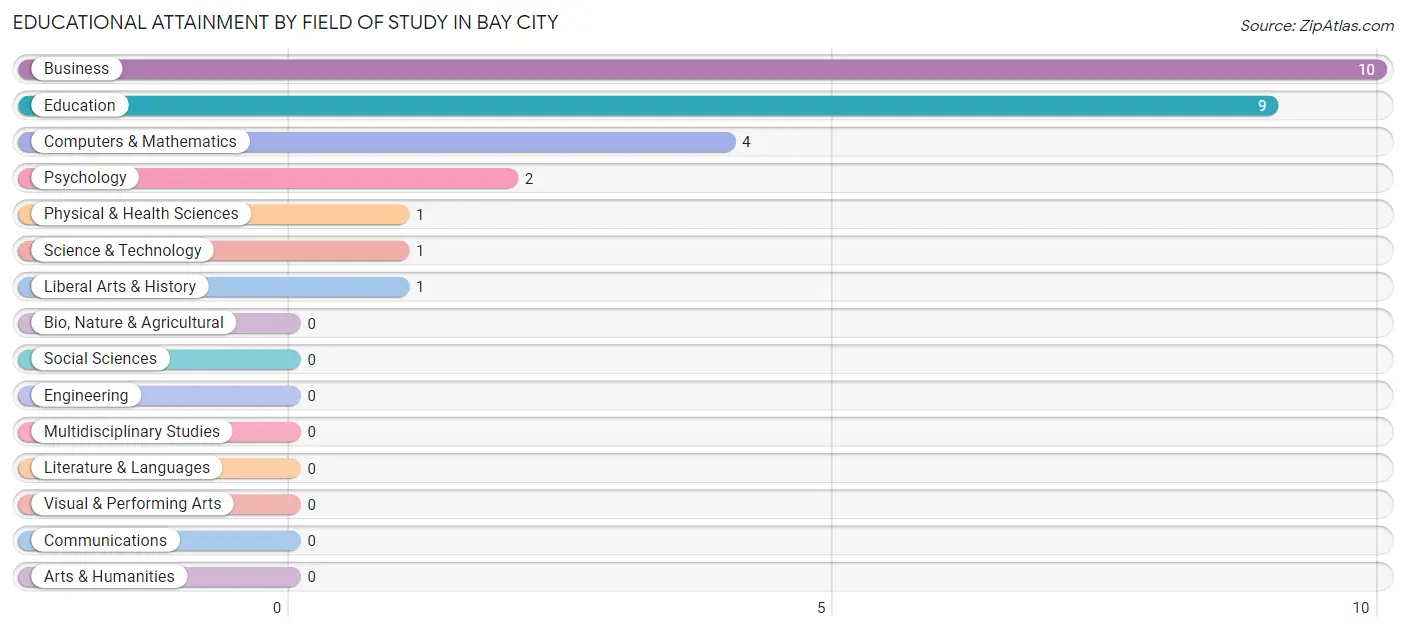
| Field of Study | # Graduates | % Graduates |
| Computers & Mathematics | 4 | 14.3% |
| Bio, Nature & Agricultural | 0 | 0.0% |
| Physical & Health Sciences | 1 | 3.6% |
| Psychology | 2 | 7.1% |
| Social Sciences | 0 | 0.0% |
| Engineering | 0 | 0.0% |
| Multidisciplinary Studies | 0 | 0.0% |
| Science & Technology | 1 | 3.6% |
| Business | 10 | 35.7% |
| Education | 9 | 32.1% |
| Literature & Languages | 0 | 0.0% |
| Liberal Arts & History | 1 | 3.6% |
| Visual & Performing Arts | 0 | 0.0% |
| Communications | 0 | 0.0% |
| Arts & Humanities | 0 | 0.0% |
| Total | 28 | 100.0% |
Transportation & Commute in Bay City
Vehicle Availability by Sex in Bay City
The most prevalent vehicle ownership categories in Bay City are males with 2 vehicles (44, accounting for 36.4%) and females with 2 vehicles (29, making up 51.8%).
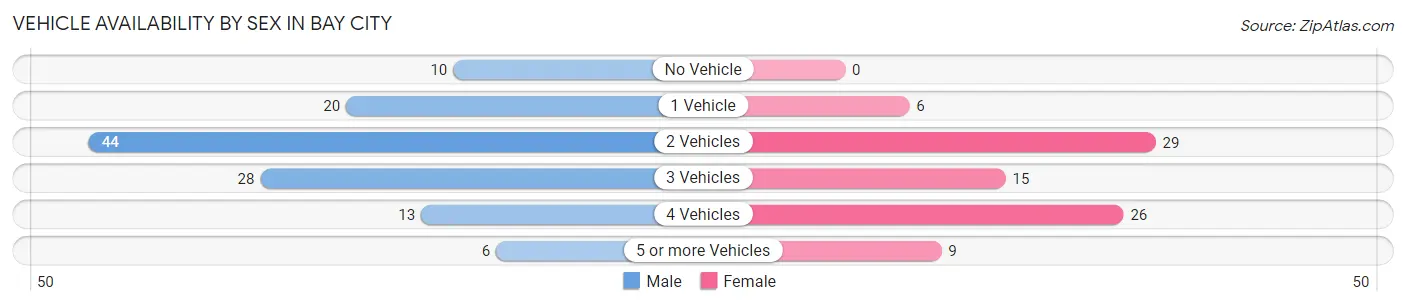
| Vehicles Available | Male | Female |
| No Vehicle | 10 (8.3%) | 0 (0.0%) |
| 1 Vehicle | 20 (16.5%) | 6 (7.1%) |
| 2 Vehicles | 44 (36.4%) | 29 (34.1%) |
| 3 Vehicles | 28 (23.1%) | 15 (17.6%) |
| 4 Vehicles | 13 (10.7%) | 26 (30.6%) |
| 5 or more Vehicles | 6 (5.0%) | 9 (10.6%) |
| Total | 121 (100.0%) | 85 (100.0%) |
Commute Time in Bay City
The most frequently occuring commute durations in Bay City are 20 to 24 minutes (49 commuters, 24.4%), 15 to 19 minutes (44 commuters, 21.9%), and 30 to 34 minutes (25 commuters, 12.4%).
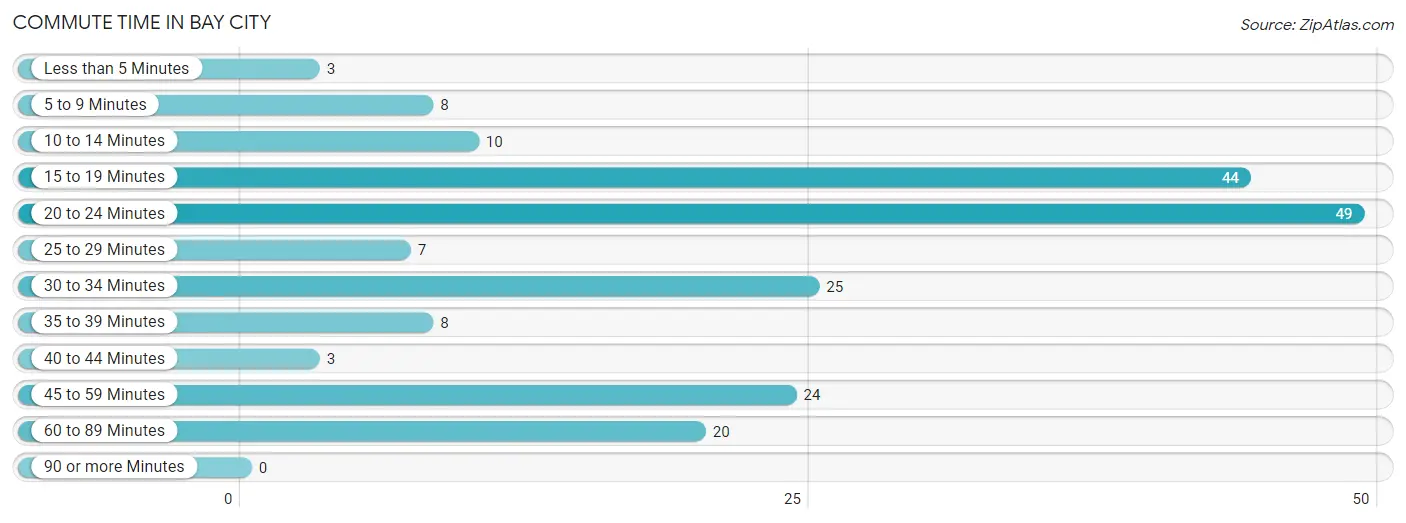
| Commute Time | # Commuters | % Commuters |
| Less than 5 Minutes | 3 | 1.5% |
| 5 to 9 Minutes | 8 | 4.0% |
| 10 to 14 Minutes | 10 | 5.0% |
| 15 to 19 Minutes | 44 | 21.9% |
| 20 to 24 Minutes | 49 | 24.4% |
| 25 to 29 Minutes | 7 | 3.5% |
| 30 to 34 Minutes | 25 | 12.4% |
| 35 to 39 Minutes | 8 | 4.0% |
| 40 to 44 Minutes | 3 | 1.5% |
| 45 to 59 Minutes | 24 | 11.9% |
| 60 to 89 Minutes | 20 | 10.0% |
| 90 or more Minutes | 0 | 0.0% |
Commute Time by Sex in Bay City
The most common commute times in Bay City are 15 to 19 minutes (31 commuters, 26.3%) for males and 20 to 24 minutes (37 commuters, 44.6%) for females.
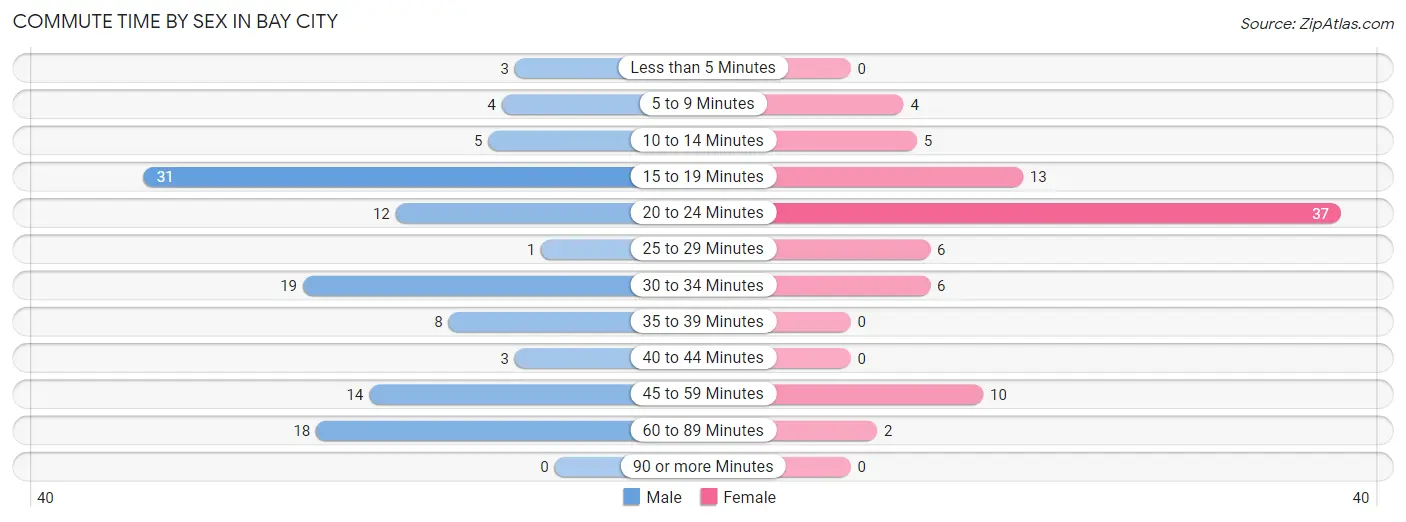
| Commute Time | Male | Female |
| Less than 5 Minutes | 3 (2.5%) | 0 (0.0%) |
| 5 to 9 Minutes | 4 (3.4%) | 4 (4.8%) |
| 10 to 14 Minutes | 5 (4.2%) | 5 (6.0%) |
| 15 to 19 Minutes | 31 (26.3%) | 13 (15.7%) |
| 20 to 24 Minutes | 12 (10.2%) | 37 (44.6%) |
| 25 to 29 Minutes | 1 (0.9%) | 6 (7.2%) |
| 30 to 34 Minutes | 19 (16.1%) | 6 (7.2%) |
| 35 to 39 Minutes | 8 (6.8%) | 0 (0.0%) |
| 40 to 44 Minutes | 3 (2.5%) | 0 (0.0%) |
| 45 to 59 Minutes | 14 (11.9%) | 10 (12.0%) |
| 60 to 89 Minutes | 18 (15.2%) | 2 (2.4%) |
| 90 or more Minutes | 0 (0.0%) | 0 (0.0%) |
Time of Departure to Work by Sex in Bay City
The most frequent times of departure to work in Bay City are 12:00 AM to 4:59 AM (36, 30.5%) for males and 7:00 AM to 7:29 AM (29, 34.9%) for females.
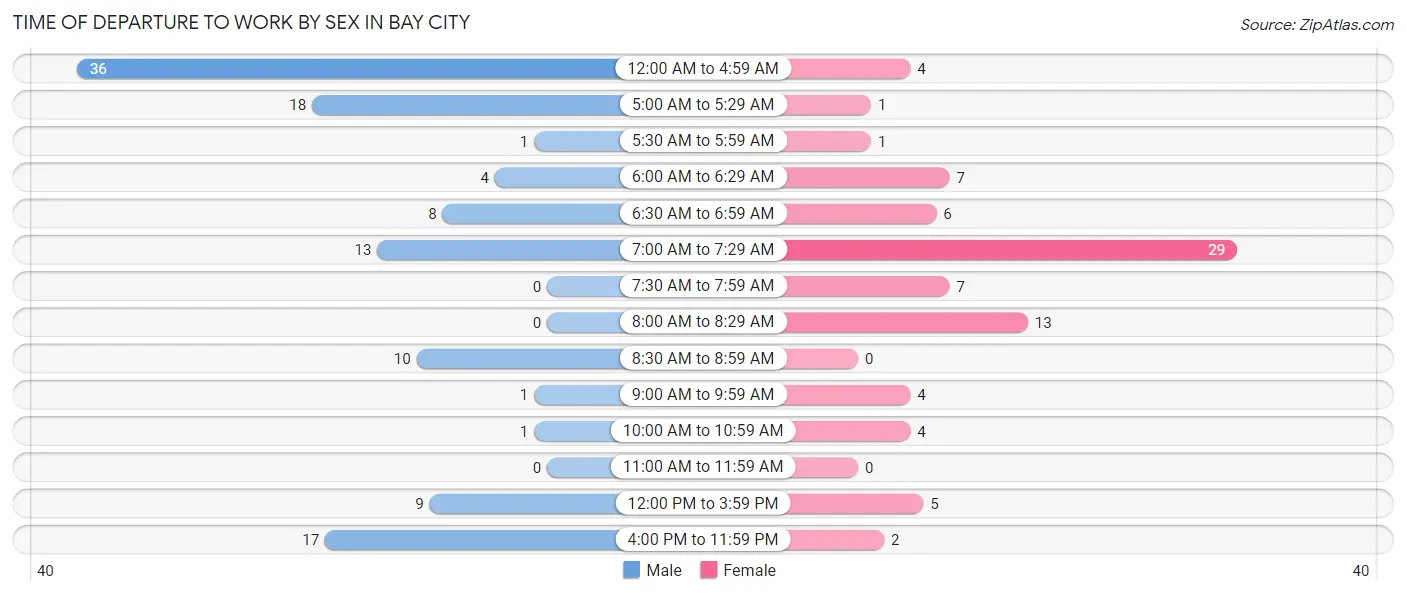
| Time of Departure | Male | Female |
| 12:00 AM to 4:59 AM | 36 (30.5%) | 4 (4.8%) |
| 5:00 AM to 5:29 AM | 18 (15.2%) | 1 (1.2%) |
| 5:30 AM to 5:59 AM | 1 (0.9%) | 1 (1.2%) |
| 6:00 AM to 6:29 AM | 4 (3.4%) | 7 (8.4%) |
| 6:30 AM to 6:59 AM | 8 (6.8%) | 6 (7.2%) |
| 7:00 AM to 7:29 AM | 13 (11.0%) | 29 (34.9%) |
| 7:30 AM to 7:59 AM | 0 (0.0%) | 7 (8.4%) |
| 8:00 AM to 8:29 AM | 0 (0.0%) | 13 (15.7%) |
| 8:30 AM to 8:59 AM | 10 (8.5%) | 0 (0.0%) |
| 9:00 AM to 9:59 AM | 1 (0.9%) | 4 (4.8%) |
| 10:00 AM to 10:59 AM | 1 (0.9%) | 4 (4.8%) |
| 11:00 AM to 11:59 AM | 0 (0.0%) | 0 (0.0%) |
| 12:00 PM to 3:59 PM | 9 (7.6%) | 5 (6.0%) |
| 4:00 PM to 11:59 PM | 17 (14.4%) | 2 (2.4%) |
| Total | 118 (100.0%) | 83 (100.0%) |
Housing Occupancy in Bay City
Occupancy by Ownership in Bay City
Of the total 164 dwellings in Bay City, owner-occupied units account for 142 (86.6%), while renter-occupied units make up 22 (13.4%).
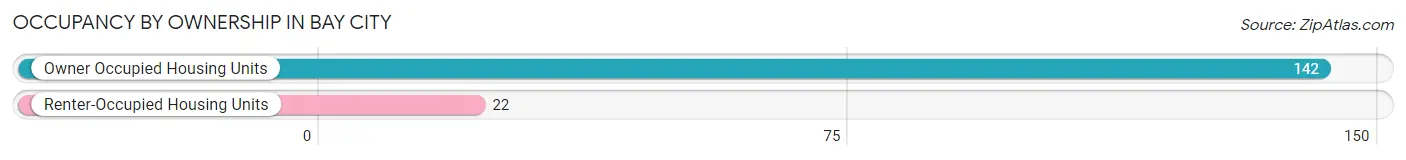
| Occupancy | # Housing Units | % Housing Units |
| Owner Occupied Housing Units | 142 | 86.6% |
| Renter-Occupied Housing Units | 22 | 13.4% |
| Total Occupied Housing Units | 164 | 100.0% |
Occupancy by Household Size in Bay City
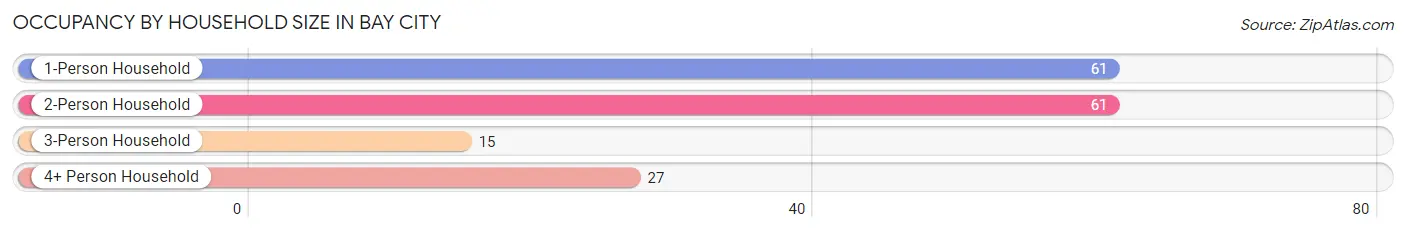
| Household Size | # Housing Units | % Housing Units |
| 1-Person Household | 61 | 37.2% |
| 2-Person Household | 61 | 37.2% |
| 3-Person Household | 15 | 9.1% |
| 4+ Person Household | 27 | 16.5% |
| Total Housing Units | 164 | 100.0% |
Occupancy by Ownership by Household Size in Bay City
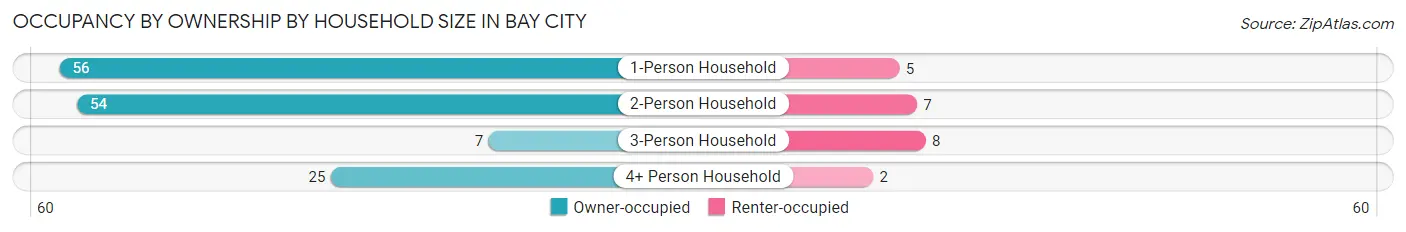
| Household Size | Owner-occupied | Renter-occupied |
| 1-Person Household | 56 (91.8%) | 5 (8.2%) |
| 2-Person Household | 54 (88.5%) | 7 (11.5%) |
| 3-Person Household | 7 (46.7%) | 8 (53.3%) |
| 4+ Person Household | 25 (92.6%) | 2 (7.4%) |
| Total Housing Units | 142 (86.6%) | 22 (13.4%) |
Occupancy by Educational Attainment in Bay City
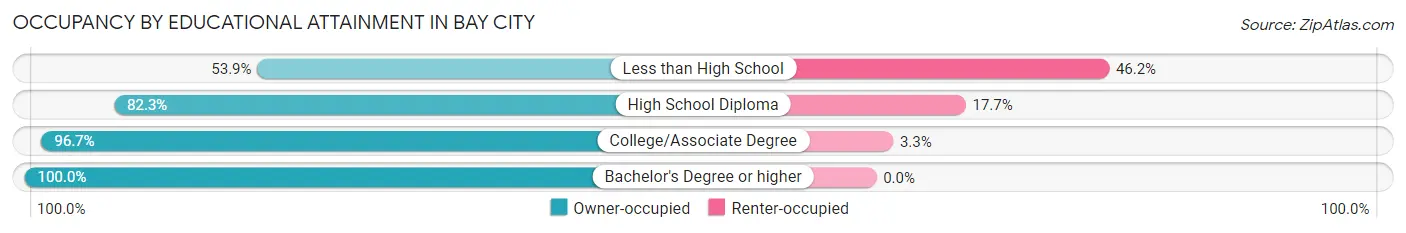
| Household Size | Owner-occupied | Renter-occupied |
| Less than High School | 7 (53.8%) | 6 (46.2%) |
| High School Diploma | 65 (82.3%) | 14 (17.7%) |
| College/Associate Degree | 58 (96.7%) | 2 (3.3%) |
| Bachelor's Degree or higher | 12 (100.0%) | 0 (0.0%) |
Occupancy by Age of Householder in Bay City
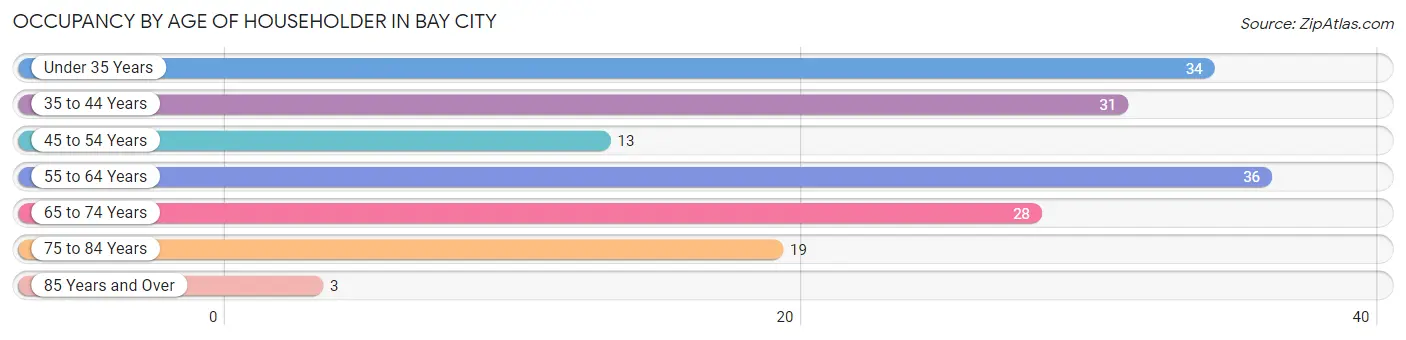
| Age Bracket | # Households | % Households |
| Under 35 Years | 34 | 20.7% |
| 35 to 44 Years | 31 | 18.9% |
| 45 to 54 Years | 13 | 7.9% |
| 55 to 64 Years | 36 | 22.0% |
| 65 to 74 Years | 28 | 17.1% |
| 75 to 84 Years | 19 | 11.6% |
| 85 Years and Over | 3 | 1.8% |
| Total | 164 | 100.0% |
Housing Finances in Bay City
Median Income by Occupancy in Bay City
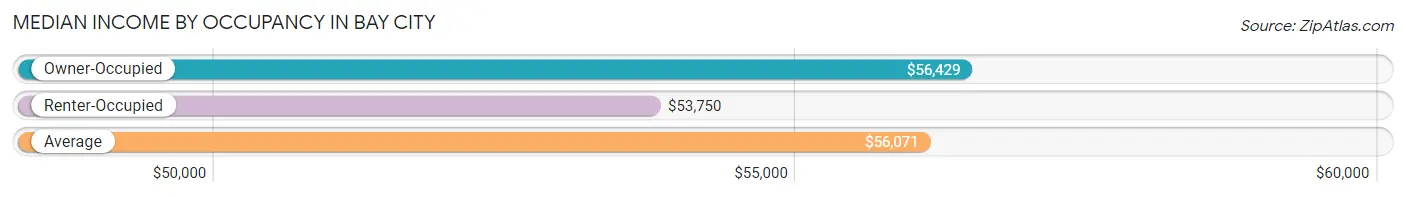
| Occupancy Type | # Households | Median Income |
| Owner-Occupied | 142 (86.6%) | $56,429 |
| Renter-Occupied | 22 (13.4%) | $53,750 |
| Average | 164 (100.0%) | $56,071 |
Occupancy by Householder Income Bracket in Bay City
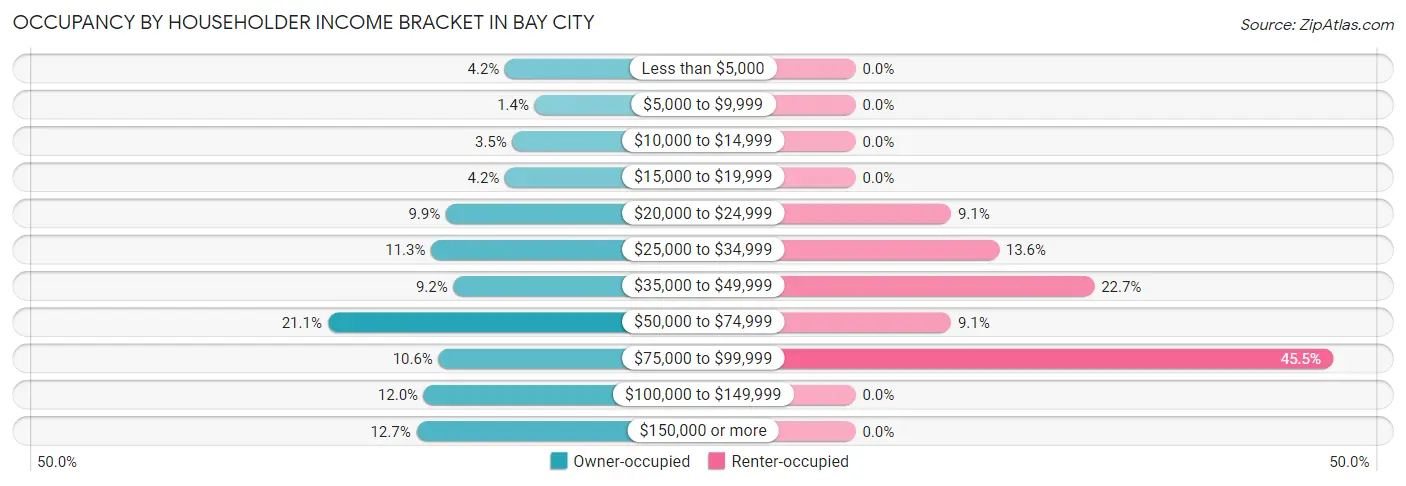
| Income Bracket | Owner-occupied | Renter-occupied |
| Less than $5,000 | 6 (4.2%) | 0 (0.0%) |
| $5,000 to $9,999 | 2 (1.4%) | 0 (0.0%) |
| $10,000 to $14,999 | 5 (3.5%) | 0 (0.0%) |
| $15,000 to $19,999 | 6 (4.2%) | 0 (0.0%) |
| $20,000 to $24,999 | 14 (9.9%) | 2 (9.1%) |
| $25,000 to $34,999 | 16 (11.3%) | 3 (13.6%) |
| $35,000 to $49,999 | 13 (9.1%) | 5 (22.7%) |
| $50,000 to $74,999 | 30 (21.1%) | 2 (9.1%) |
| $75,000 to $99,999 | 15 (10.6%) | 10 (45.5%) |
| $100,000 to $149,999 | 17 (12.0%) | 0 (0.0%) |
| $150,000 or more | 18 (12.7%) | 0 (0.0%) |
| Total | 142 (100.0%) | 22 (100.0%) |
Monthly Housing Cost Tiers in Bay City
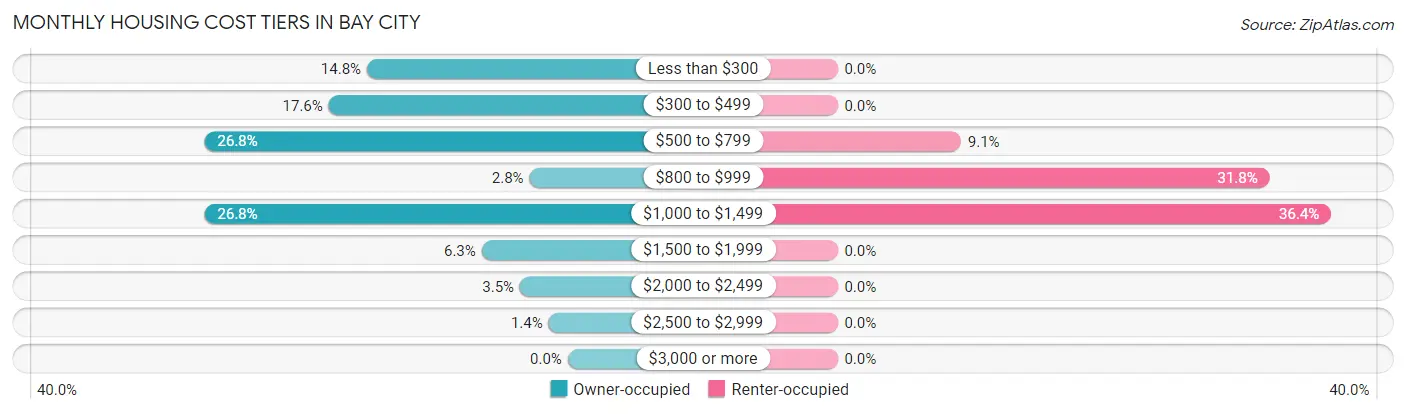
| Monthly Cost | Owner-occupied | Renter-occupied |
| Less than $300 | 21 (14.8%) | 0 (0.0%) |
| $300 to $499 | 25 (17.6%) | 0 (0.0%) |
| $500 to $799 | 38 (26.8%) | 2 (9.1%) |
| $800 to $999 | 4 (2.8%) | 7 (31.8%) |
| $1,000 to $1,499 | 38 (26.8%) | 8 (36.4%) |
| $1,500 to $1,999 | 9 (6.3%) | 0 (0.0%) |
| $2,000 to $2,499 | 5 (3.5%) | 0 (0.0%) |
| $2,500 to $2,999 | 2 (1.4%) | 0 (0.0%) |
| $3,000 or more | 0 (0.0%) | 0 (0.0%) |
| Total | 142 (100.0%) | 22 (100.0%) |
Physical Housing Characteristics in Bay City
Housing Structures in Bay City
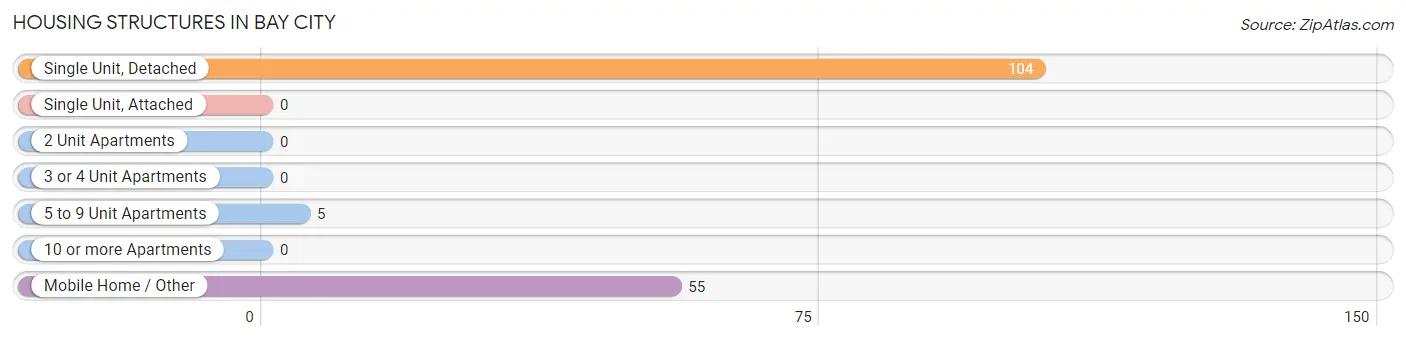
| Structure Type | # Housing Units | % Housing Units |
| Single Unit, Detached | 104 | 63.4% |
| Single Unit, Attached | 0 | 0.0% |
| 2 Unit Apartments | 0 | 0.0% |
| 3 or 4 Unit Apartments | 0 | 0.0% |
| 5 to 9 Unit Apartments | 5 | 3.0% |
| 10 or more Apartments | 0 | 0.0% |
| Mobile Home / Other | 55 | 33.5% |
| Total | 164 | 100.0% |
Housing Structures by Occupancy in Bay City
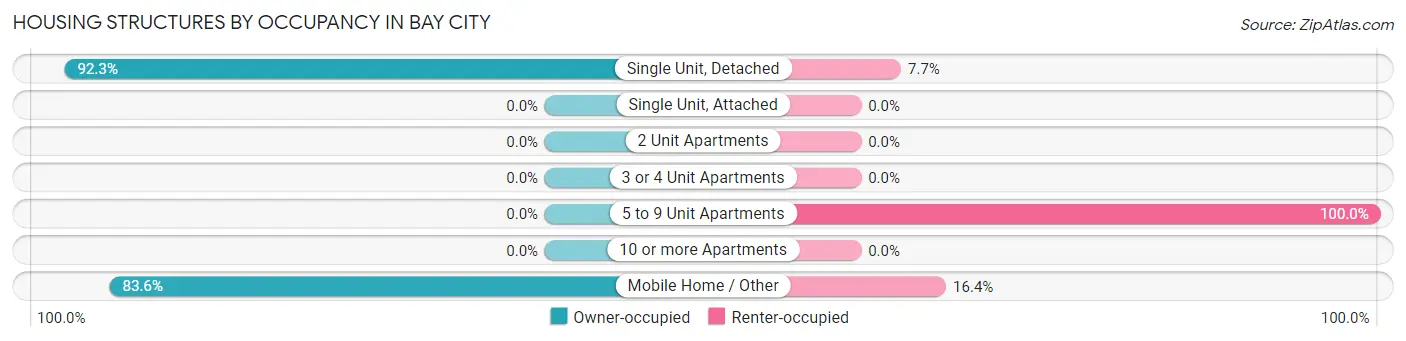
| Structure Type | Owner-occupied | Renter-occupied |
| Single Unit, Detached | 96 (92.3%) | 8 (7.7%) |
| Single Unit, Attached | 0 (0.0%) | 0 (0.0%) |
| 2 Unit Apartments | 0 (0.0%) | 0 (0.0%) |
| 3 or 4 Unit Apartments | 0 (0.0%) | 0 (0.0%) |
| 5 to 9 Unit Apartments | 0 (0.0%) | 5 (100.0%) |
| 10 or more Apartments | 0 (0.0%) | 0 (0.0%) |
| Mobile Home / Other | 46 (83.6%) | 9 (16.4%) |
| Total | 142 (86.6%) | 22 (13.4%) |
Housing Structures by Number of Rooms in Bay City
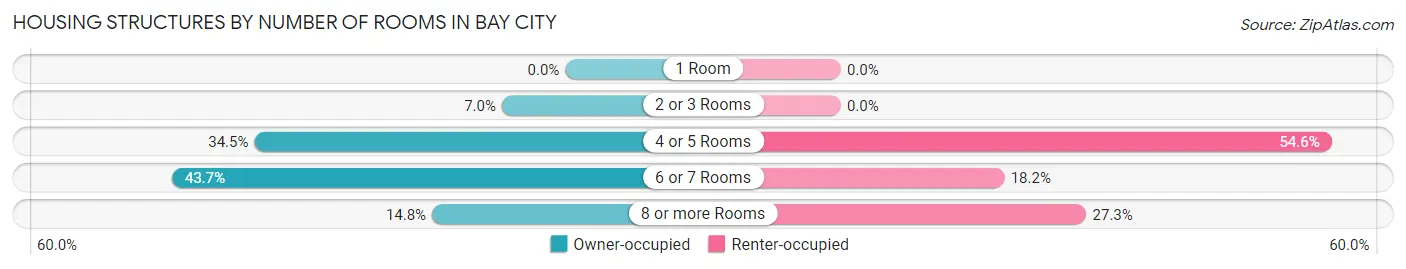
| Number of Rooms | Owner-occupied | Renter-occupied |
| 1 Room | 0 (0.0%) | 0 (0.0%) |
| 2 or 3 Rooms | 10 (7.0%) | 0 (0.0%) |
| 4 or 5 Rooms | 49 (34.5%) | 12 (54.5%) |
| 6 or 7 Rooms | 62 (43.7%) | 4 (18.2%) |
| 8 or more Rooms | 21 (14.8%) | 6 (27.3%) |
| Total | 142 (100.0%) | 22 (100.0%) |
Housing Structure by Heating Type in Bay City
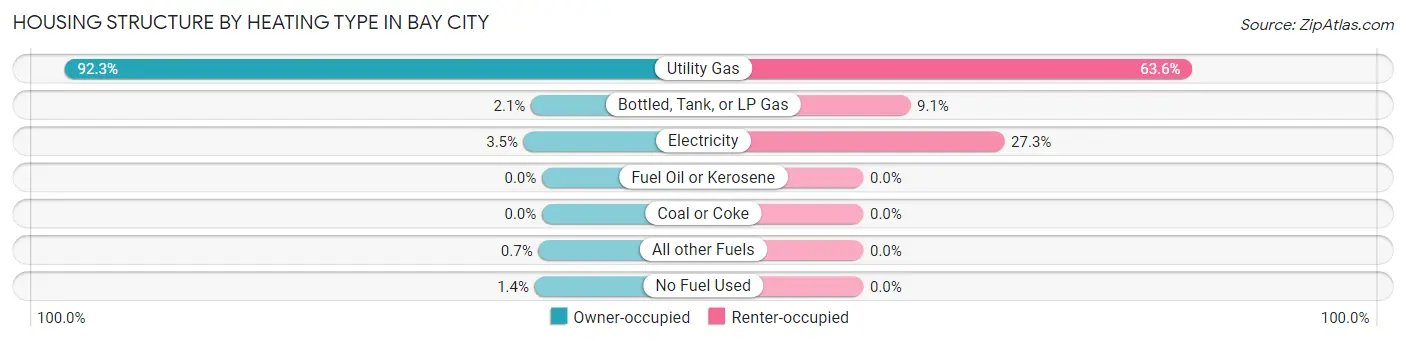
| Heating Type | Owner-occupied | Renter-occupied |
| Utility Gas | 131 (92.2%) | 14 (63.6%) |
| Bottled, Tank, or LP Gas | 3 (2.1%) | 2 (9.1%) |
| Electricity | 5 (3.5%) | 6 (27.3%) |
| Fuel Oil or Kerosene | 0 (0.0%) | 0 (0.0%) |
| Coal or Coke | 0 (0.0%) | 0 (0.0%) |
| All other Fuels | 1 (0.7%) | 0 (0.0%) |
| No Fuel Used | 2 (1.4%) | 0 (0.0%) |
| Total | 142 (100.0%) | 22 (100.0%) |
Household Vehicle Usage in Bay City
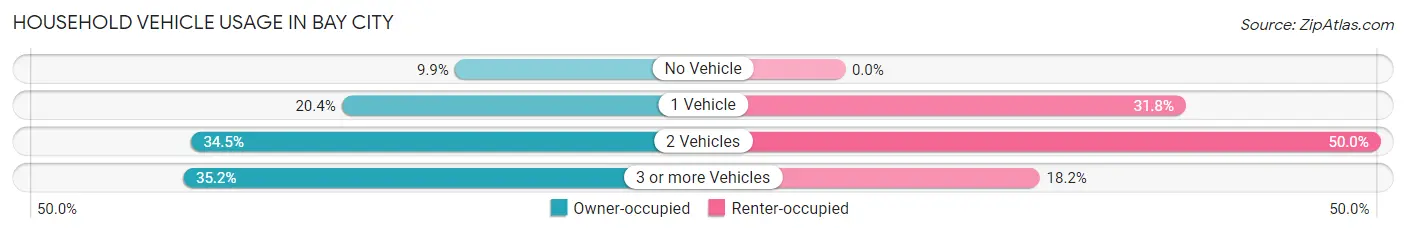
| Vehicles per Household | Owner-occupied | Renter-occupied |
| No Vehicle | 14 (9.9%) | 0 (0.0%) |
| 1 Vehicle | 29 (20.4%) | 7 (31.8%) |
| 2 Vehicles | 49 (34.5%) | 11 (50.0%) |
| 3 or more Vehicles | 50 (35.2%) | 4 (18.2%) |
| Total | 142 (100.0%) | 22 (100.0%) |
Real Estate & Mortgages in Bay City
Real Estate and Mortgage Overview in Bay City
| Characteristic | Without Mortgage | With Mortgage |
| Housing Units | 74 | 68 |
| Median Property Value | $46,000 | $155,000 |
| Median Household Income | $38,750 | $13 |
| Monthly Housing Costs | $420 | $0 |
| Real Estate Taxes | $1,173 | $3 |
Property Value by Mortgage Status in Bay City
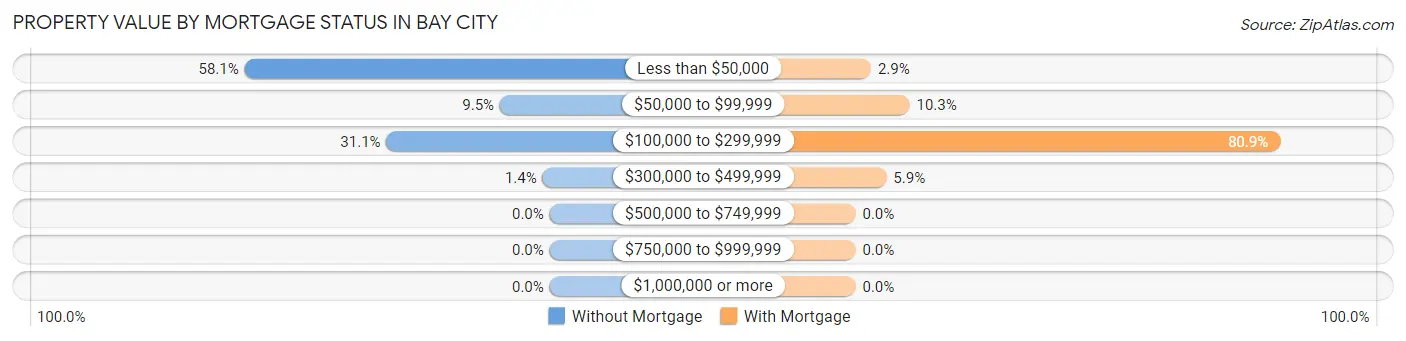
| Property Value | Without Mortgage | With Mortgage |
| Less than $50,000 | 43 (58.1%) | 2 (2.9%) |
| $50,000 to $99,999 | 7 (9.5%) | 7 (10.3%) |
| $100,000 to $299,999 | 23 (31.1%) | 55 (80.9%) |
| $300,000 to $499,999 | 1 (1.3%) | 4 (5.9%) |
| $500,000 to $749,999 | 0 (0.0%) | 0 (0.0%) |
| $750,000 to $999,999 | 0 (0.0%) | 0 (0.0%) |
| $1,000,000 or more | 0 (0.0%) | 0 (0.0%) |
| Total | 74 (100.0%) | 68 (100.0%) |
Household Income by Mortgage Status in Bay City
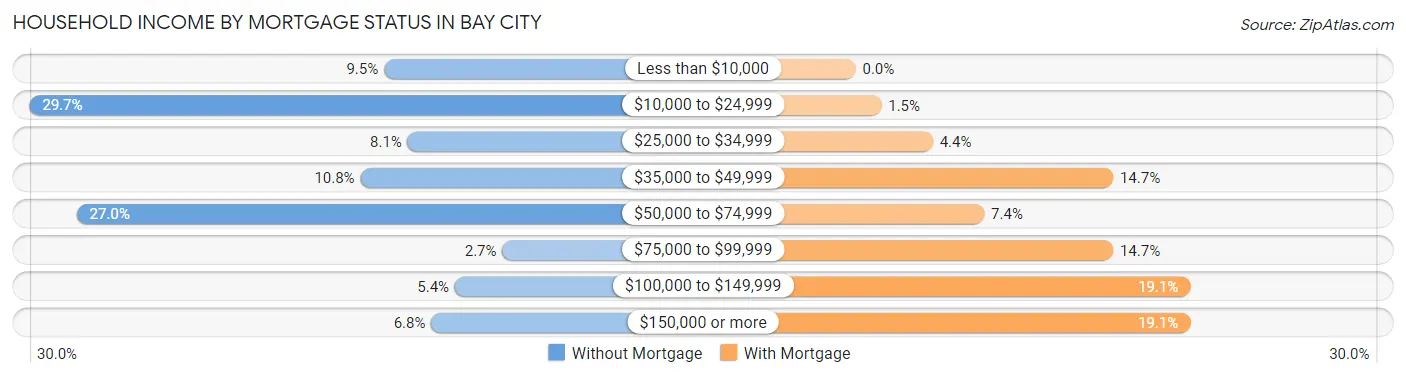
| Household Income | Without Mortgage | With Mortgage |
| Less than $10,000 | 7 (9.5%) | 0 (0.0%) |
| $10,000 to $24,999 | 22 (29.7%) | 1 (1.5%) |
| $25,000 to $34,999 | 6 (8.1%) | 3 (4.4%) |
| $35,000 to $49,999 | 8 (10.8%) | 10 (14.7%) |
| $50,000 to $74,999 | 20 (27.0%) | 5 (7.3%) |
| $75,000 to $99,999 | 2 (2.7%) | 10 (14.7%) |
| $100,000 to $149,999 | 4 (5.4%) | 13 (19.1%) |
| $150,000 or more | 5 (6.8%) | 13 (19.1%) |
| Total | 74 (100.0%) | 68 (100.0%) |
Property Value to Household Income Ratio in Bay City
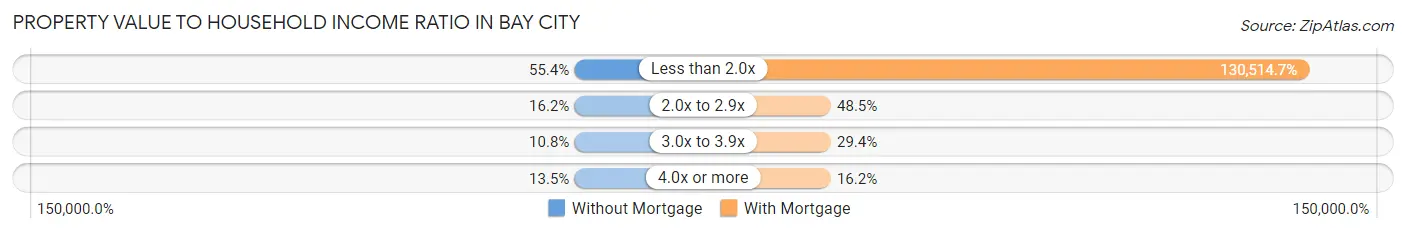
| Value-to-Income Ratio | Without Mortgage | With Mortgage |
| Less than 2.0x | 41 (55.4%) | 88,750 (130,514.7%) |
| 2.0x to 2.9x | 12 (16.2%) | 33 (48.5%) |
| 3.0x to 3.9x | 8 (10.8%) | 20 (29.4%) |
| 4.0x or more | 10 (13.5%) | 11 (16.2%) |
| Total | 74 (100.0%) | 68 (100.0%) |
Real Estate Taxes by Mortgage Status in Bay City
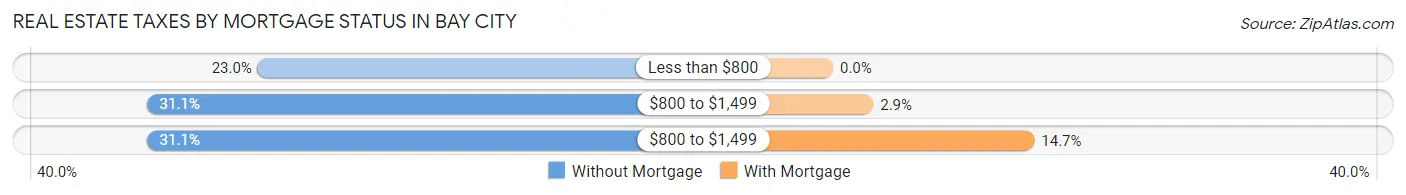
| Property Taxes | Without Mortgage | With Mortgage |
| Less than $800 | 17 (23.0%) | 0 (0.0%) |
| $800 to $1,499 | 23 (31.1%) | 2 (2.9%) |
| $800 to $1,499 | 23 (31.1%) | 10 (14.7%) |
| Total | 74 (100.0%) | 68 (100.0%) |
Health & Disability in Bay City
Health Insurance Coverage by Age in Bay City
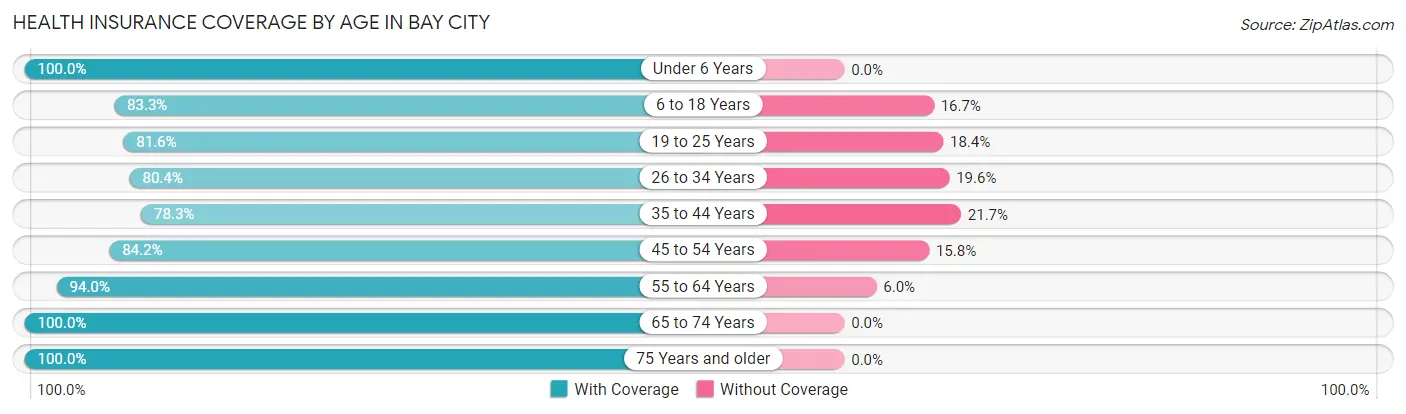
| Age Bracket | With Coverage | Without Coverage |
| Under 6 Years | 18 (100.0%) | 0 (0.0%) |
| 6 to 18 Years | 30 (83.3%) | 6 (16.7%) |
| 19 to 25 Years | 31 (81.6%) | 7 (18.4%) |
| 26 to 34 Years | 37 (80.4%) | 9 (19.6%) |
| 35 to 44 Years | 36 (78.3%) | 10 (21.7%) |
| 45 to 54 Years | 32 (84.2%) | 6 (15.8%) |
| 55 to 64 Years | 63 (94.0%) | 4 (6.0%) |
| 65 to 74 Years | 43 (100.0%) | 0 (0.0%) |
| 75 Years and older | 30 (100.0%) | 0 (0.0%) |
| Total | 320 (88.4%) | 42 (11.6%) |
Health Insurance Coverage by Citizenship Status in Bay City
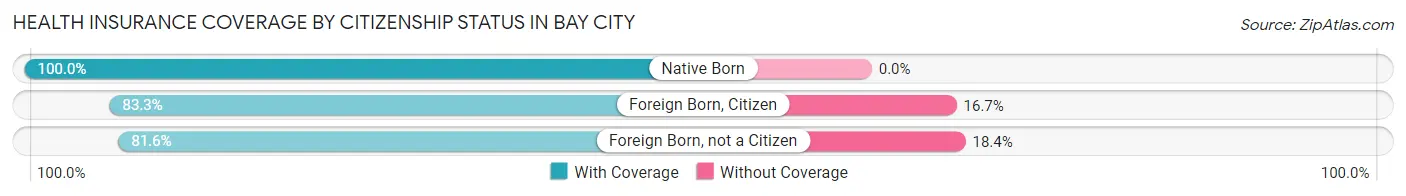
| Citizenship Status | With Coverage | Without Coverage |
| Native Born | 18 (100.0%) | 0 (0.0%) |
| Foreign Born, Citizen | 30 (83.3%) | 6 (16.7%) |
| Foreign Born, not a Citizen | 31 (81.6%) | 7 (18.4%) |
Health Insurance Coverage by Household Income in Bay City
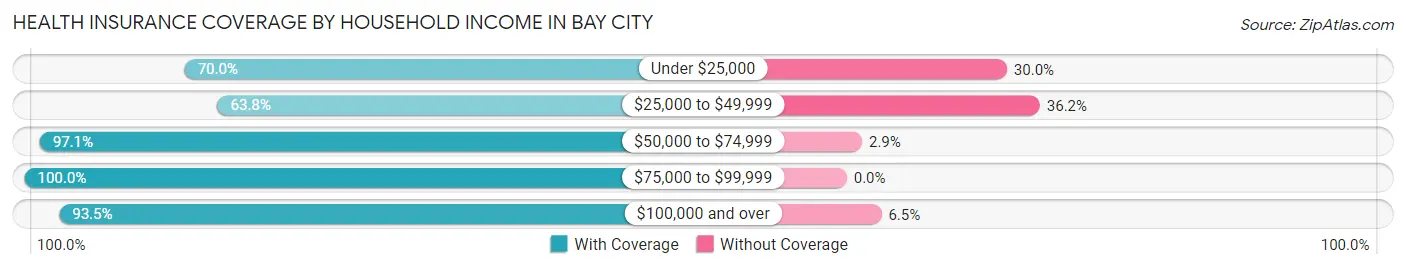
| Household Income | With Coverage | Without Coverage |
| Under $25,000 | 35 (70.0%) | 15 (30.0%) |
| $25,000 to $49,999 | 30 (63.8%) | 17 (36.2%) |
| $50,000 to $74,999 | 68 (97.1%) | 2 (2.9%) |
| $75,000 to $99,999 | 72 (100.0%) | 0 (0.0%) |
| $100,000 and over | 115 (93.5%) | 8 (6.5%) |
Public vs Private Health Insurance Coverage by Age in Bay City
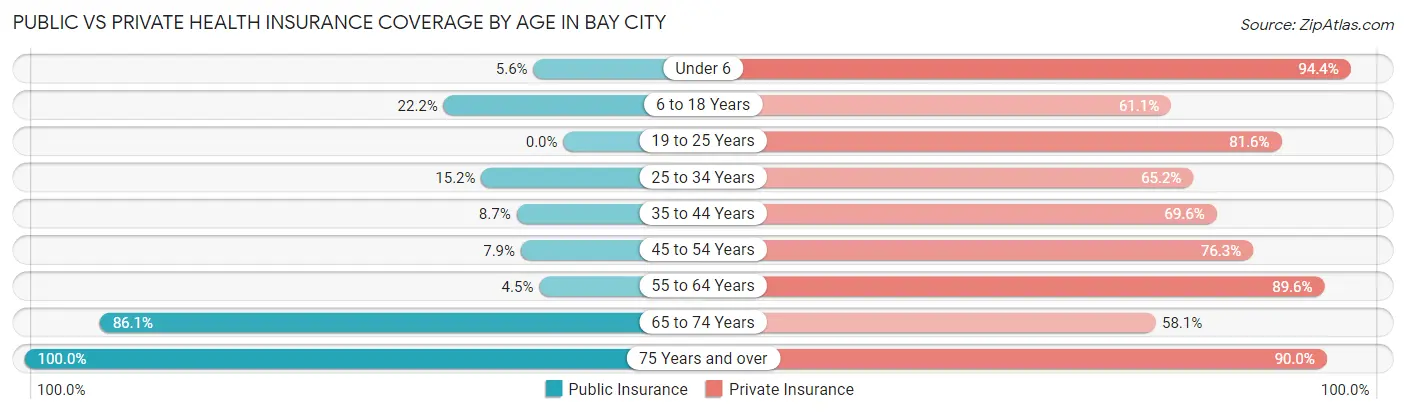
| Age Bracket | Public Insurance | Private Insurance |
| Under 6 | 1 (5.6%) | 17 (94.4%) |
| 6 to 18 Years | 8 (22.2%) | 22 (61.1%) |
| 19 to 25 Years | 0 (0.0%) | 31 (81.6%) |
| 25 to 34 Years | 7 (15.2%) | 30 (65.2%) |
| 35 to 44 Years | 4 (8.7%) | 32 (69.6%) |
| 45 to 54 Years | 3 (7.9%) | 29 (76.3%) |
| 55 to 64 Years | 3 (4.5%) | 60 (89.5%) |
| 65 to 74 Years | 37 (86.1%) | 25 (58.1%) |
| 75 Years and over | 30 (100.0%) | 27 (90.0%) |
| Total | 93 (25.7%) | 273 (75.4%) |
Disability Status by Sex by Age in Bay City
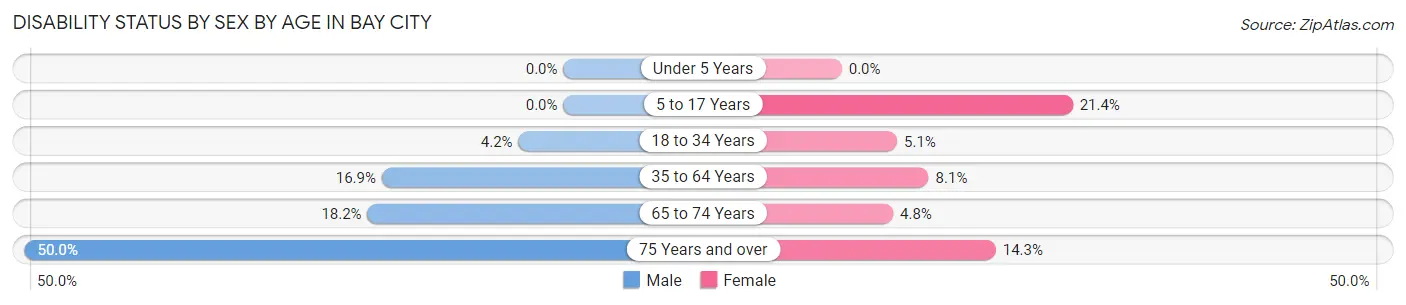
| Age Bracket | Male | Female |
| Under 5 Years | 0 (0.0%) | 0 (0.0%) |
| 5 to 17 Years | 0 (0.0%) | 3 (21.4%) |
| 18 to 34 Years | 2 (4.2%) | 2 (5.1%) |
| 35 to 64 Years | 15 (16.9%) | 5 (8.1%) |
| 65 to 74 Years | 4 (18.2%) | 1 (4.8%) |
| 75 Years and over | 8 (50.0%) | 2 (14.3%) |
Disability Class by Sex by Age in Bay City
Disability Class: Hearing Difficulty
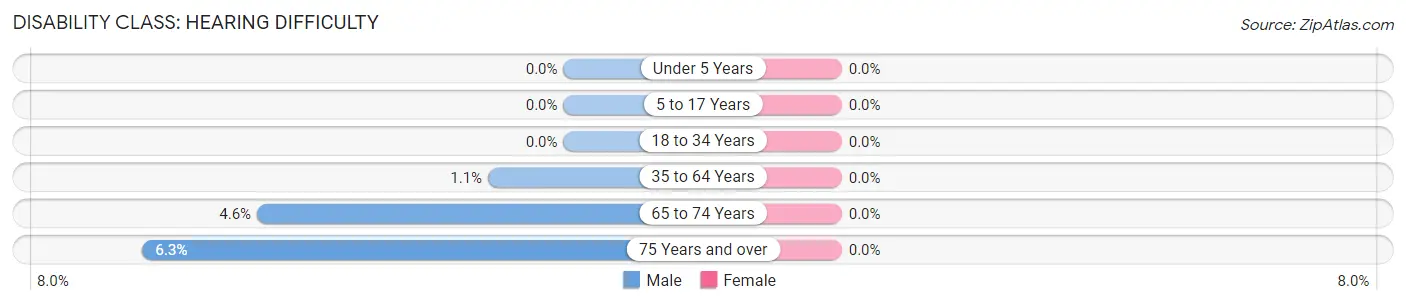
| Age Bracket | Male | Female |
| Under 5 Years | 0 (0.0%) | 0 (0.0%) |
| 5 to 17 Years | 0 (0.0%) | 0 (0.0%) |
| 18 to 34 Years | 0 (0.0%) | 0 (0.0%) |
| 35 to 64 Years | 1 (1.1%) | 0 (0.0%) |
| 65 to 74 Years | 1 (4.5%) | 0 (0.0%) |
| 75 Years and over | 1 (6.2%) | 0 (0.0%) |
Disability Class: Vision Difficulty
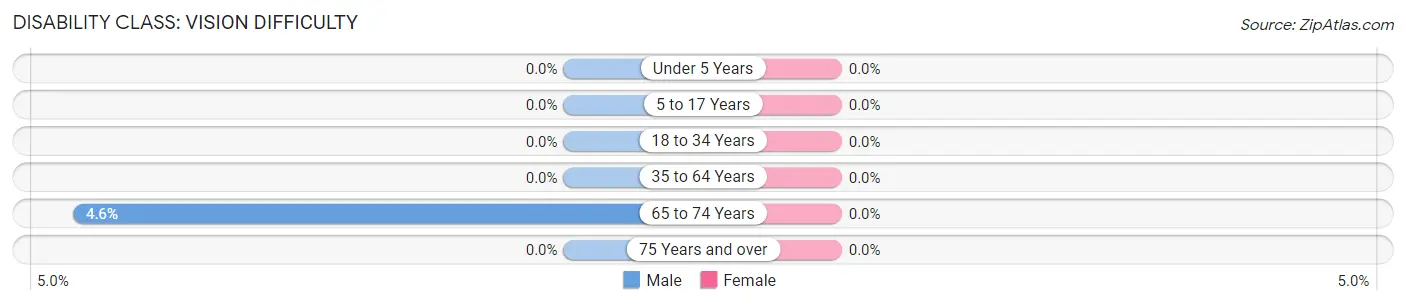
| Age Bracket | Male | Female |
| Under 5 Years | 0 (0.0%) | 0 (0.0%) |
| 5 to 17 Years | 0 (0.0%) | 0 (0.0%) |
| 18 to 34 Years | 0 (0.0%) | 0 (0.0%) |
| 35 to 64 Years | 0 (0.0%) | 0 (0.0%) |
| 65 to 74 Years | 1 (4.5%) | 0 (0.0%) |
| 75 Years and over | 0 (0.0%) | 0 (0.0%) |
Disability Class: Cognitive Difficulty
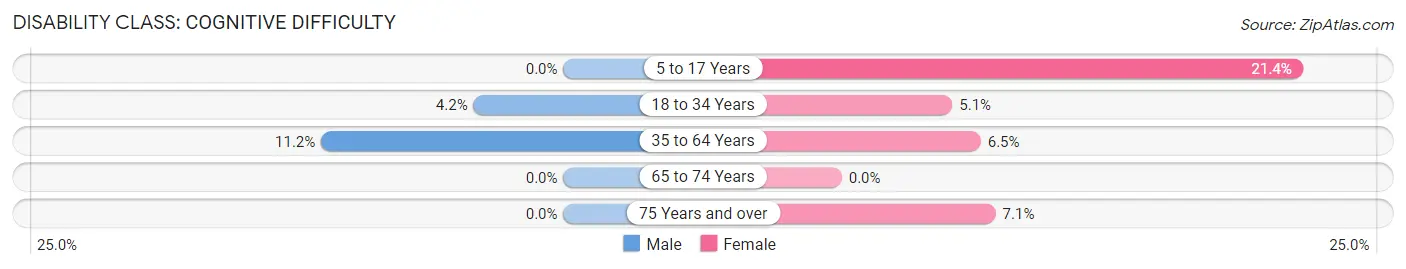
| Age Bracket | Male | Female |
| 5 to 17 Years | 0 (0.0%) | 3 (21.4%) |
| 18 to 34 Years | 2 (4.2%) | 2 (5.1%) |
| 35 to 64 Years | 10 (11.2%) | 4 (6.5%) |
| 65 to 74 Years | 0 (0.0%) | 0 (0.0%) |
| 75 Years and over | 0 (0.0%) | 1 (7.1%) |
Disability Class: Ambulatory Difficulty
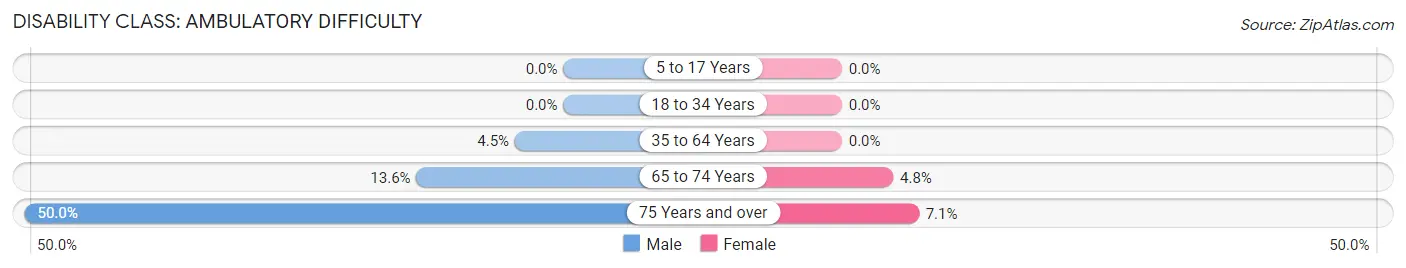
| Age Bracket | Male | Female |
| 5 to 17 Years | 0 (0.0%) | 0 (0.0%) |
| 18 to 34 Years | 0 (0.0%) | 0 (0.0%) |
| 35 to 64 Years | 4 (4.5%) | 0 (0.0%) |
| 65 to 74 Years | 3 (13.6%) | 1 (4.8%) |
| 75 Years and over | 8 (50.0%) | 1 (7.1%) |
Disability Class: Self-Care Difficulty
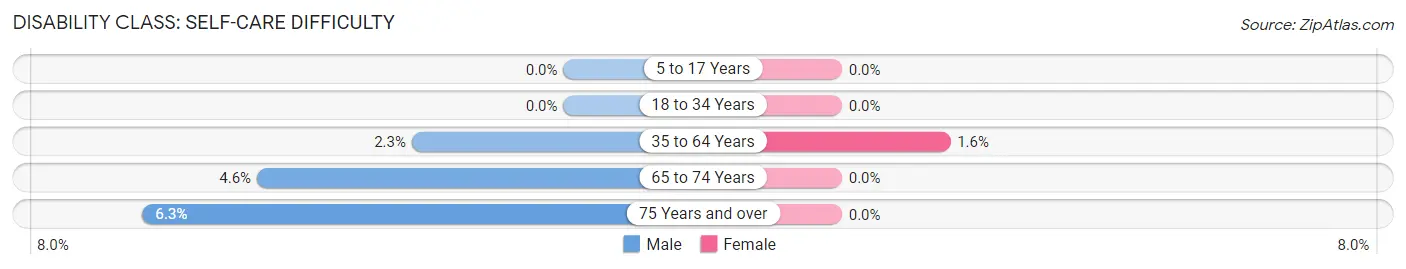
| Age Bracket | Male | Female |
| 5 to 17 Years | 0 (0.0%) | 0 (0.0%) |
| 18 to 34 Years | 0 (0.0%) | 0 (0.0%) |
| 35 to 64 Years | 2 (2.2%) | 1 (1.6%) |
| 65 to 74 Years | 1 (4.5%) | 0 (0.0%) |
| 75 Years and over | 1 (6.2%) | 0 (0.0%) |
Technology Access in Bay City
Computing Device Access in Bay City
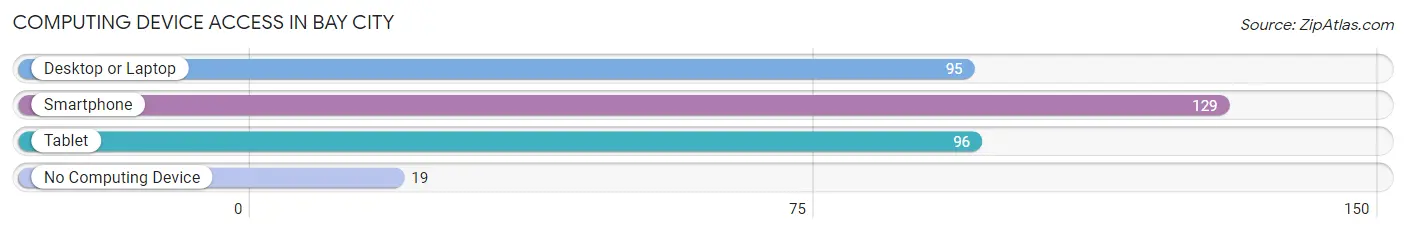
| Device Type | # Households | % Households |
| Desktop or Laptop | 95 | 57.9% |
| Smartphone | 129 | 78.7% |
| Tablet | 96 | 58.5% |
| No Computing Device | 19 | 11.6% |
| Total | 164 | 100.0% |
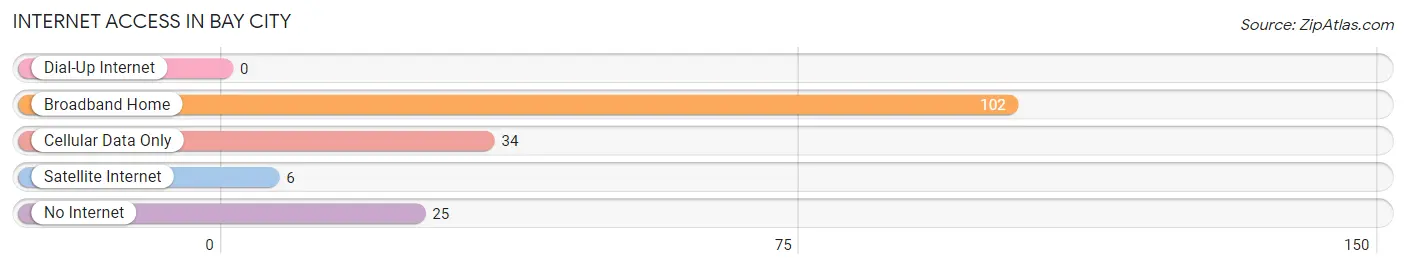
Internet Access in Bay City
| Internet Type | # Households | % Households |
| Dial-Up Internet | 0 | 0.0% |
| Broadband Home | 102 | 62.2% |
| Cellular Data Only | 34 | 20.7% |
| Satellite Internet | 6 | 3.7% |
| No Internet | 25 | 15.2% |
| Total | 164 | 100.0% |
Bay City Summary
Bay City, Wisconsin is a small town located in the northern part of the state, in the county of Bayfield. It is situated on the shore of Lake Superior, and is part of the Apostle Islands National Lakeshore. The town has a population of just over 500 people, and is a popular tourist destination due to its natural beauty and recreational opportunities.
History
The area that is now Bay City was first settled in the late 1800s by Scandinavian immigrants. The town was originally called “Finn Town”, and was home to a large number of Finnish immigrants. The town was officially incorporated in 1891, and was renamed Bay City in 1895.
The town was a popular destination for tourists in the early 1900s, and was home to a number of resorts and hotels. The town was also home to a number of logging and fishing operations, which provided employment for many of the town’s residents.
In the 1950s, the town began to decline as the logging and fishing industries declined. The town’s population decreased, and many of the businesses closed. In the 1970s, the town began to experience a resurgence as a tourist destination, and the population began to increase again.
Geography
Bay City is located in the northern part of Wisconsin, in the county of Bayfield. It is situated on the shore of Lake Superior, and is part of the Apostle Islands National Lakeshore. The town is surrounded by forests and lakes, and is a popular destination for outdoor recreation.
The town is located approximately 30 miles from the city of Duluth, Minnesota, and is accessible by car or boat. The nearest airport is located in Duluth.
Economy
The economy of Bay City is largely based on tourism. The town is a popular destination for outdoor recreation, and is home to a number of resorts and hotels. The town is also home to a number of restaurants and shops, which cater to the needs of tourists.
The town is also home to a number of small businesses, including a marina, a grocery store, and a hardware store. The town is also home to a number of art galleries and studios, which attract visitors from all over the region.
Demographics
As of the 2010 census, the population of Bay City was 514 people. The racial makeup of the town was 97.3% White, 0.6% Native American, 0.2% Asian, 0.2% from other races, and 1.7% from two or more races. The median age of the population was 44.7 years.
The median household income in Bay City was $41,250, and the median family income was $50,000. The per capita income was $20,945. The town had a poverty rate of 11.3%.
Conclusion
Bay City, Wisconsin is a small town located in the northern part of the state, in the county of Bayfield. It is situated on the shore of Lake Superior, and is part of the Apostle Islands National Lakeshore. The town has a population of just over 500 people, and is a popular tourist destination due to its natural beauty and recreational opportunities. The economy of the town is largely based on tourism, and the town is home to a number of small businesses. The town has a diverse population, with a median age of 44.7 years and a median household income of $41,250.
Common Questions
What is Per Capita Income in Bay City?
Per Capita income in Bay City is $36,497.
What is the Median Family Income in Bay City?
Median Family Income in Bay City is $73,750.
What is the Median Household income in Bay City?
Median Household Income in Bay City is $56,071.
What is Income or Wage Gap in Bay City?
Income or Wage Gap in Bay City is 11.6%.
Women in Bay City earn 88.4 cents for every dollar earned by a man.
What is Inequality or Gini Index in Bay City?
Inequality or Gini Index in Bay City is 0.46.
What is the Total Population of Bay City?
Total Population of Bay City is 362.
What is the Total Male Population of Bay City?
Total Male Population of Bay City is 206.
What is the Total Female Population of Bay City?
Total Female Population of Bay City is 156.
What is the Ratio of Males per 100 Females in Bay City?
There are 132.05 Males per 100 Females in Bay City.
What is the Ratio of Females per 100 Males in Bay City?
There are 75.73 Females per 100 Males in Bay City.
What is the Median Population Age in Bay City?
Median Population Age in Bay City is 44.6 Years.
What is the Average Family Size in Bay City
Average Family Size in Bay City is 2.9 People.
What is the Average Household Size in Bay City
Average Household Size in Bay City is 2.2 People.
How Large is the Labor Force in Bay City?
There are 211 People in the Labor Forcein in Bay City.
What is the Percentage of People in the Labor Force in Bay City?
65.3% of People are in the Labor Force in Bay City.
What is the Unemployment Rate in Bay City?
Unemployment Rate in Bay City is 2.4%.