Balsam Lake, WI Map & Demographics
Balsam Lake Map
Balsam Lake Overview
$32,005
PER CAPITA INCOME
$64,773
AVG FAMILY INCOME
$47,857
AVG HOUSEHOLD INCOME
24.9%
WAGE / INCOME GAP [ % ]
75.1¢/ $1
WAGE / INCOME GAP [ $ ]
0.44
INEQUALITY / GINI INDEX
834
TOTAL POPULATION
455
MALE POPULATION
379
FEMALE POPULATION
120.05
MALES / 100 FEMALES
83.30
FEMALES / 100 MALES
41.7
MEDIAN AGE
2.8
AVG FAMILY SIZE
2.0
AVG HOUSEHOLD SIZE
357
LABOR FORCE [ PEOPLE ]
49.2%
PERCENT IN LABOR FORCE
7.8%
UNEMPLOYMENT RATE
Balsam Lake Zip Codes
Balsam Lake Area Codes
Income in Balsam Lake
Income Overview in Balsam Lake
Per Capita Income in Balsam Lake is $32,005, while median incomes of families and households are $64,773 and $47,857 respectively.
| Characteristic | Number | Measure |
| Per Capita Income | 834 | $32,005 |
| Median Family Income | 180 | $64,773 |
| Mean Family Income | 180 | $81,832 |
| Median Household Income | 378 | $47,857 |
| Mean Household Income | 378 | $63,764 |
| Income Deficit | 180 | $0 |
| Wage / Income Gap (%) | 834 | 24.90% |
| Wage / Income Gap ($) | 834 | 75.10¢ per $1 |
| Gini / Inequality Index | 834 | 0.44 |
Earnings by Sex in Balsam Lake
Average Earnings in Balsam Lake are $32,279, $40,132 for men and $30,139 for women, a difference of 24.9%.
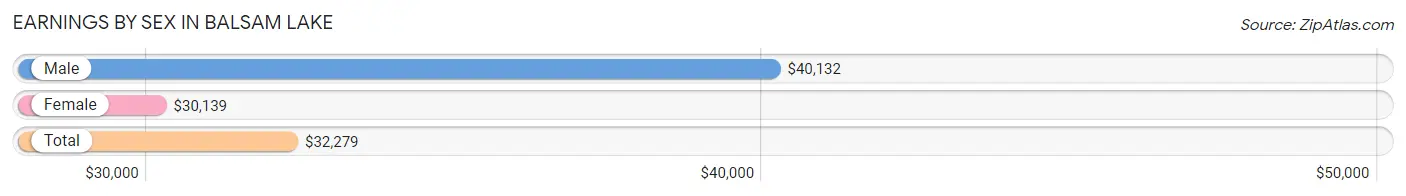
| Sex | Number | Average Earnings |
| Male | 242 (62.2%) | $40,132 |
| Female | 147 (37.8%) | $30,139 |
| Total | 389 (100.0%) | $32,279 |
Earnings by Sex by Income Bracket in Balsam Lake
The most common earnings brackets in Balsam Lake are $65,000 to $74,999 for men (26 | 10.7%) and $45,000 to $49,999 for women (17 | 11.6%).
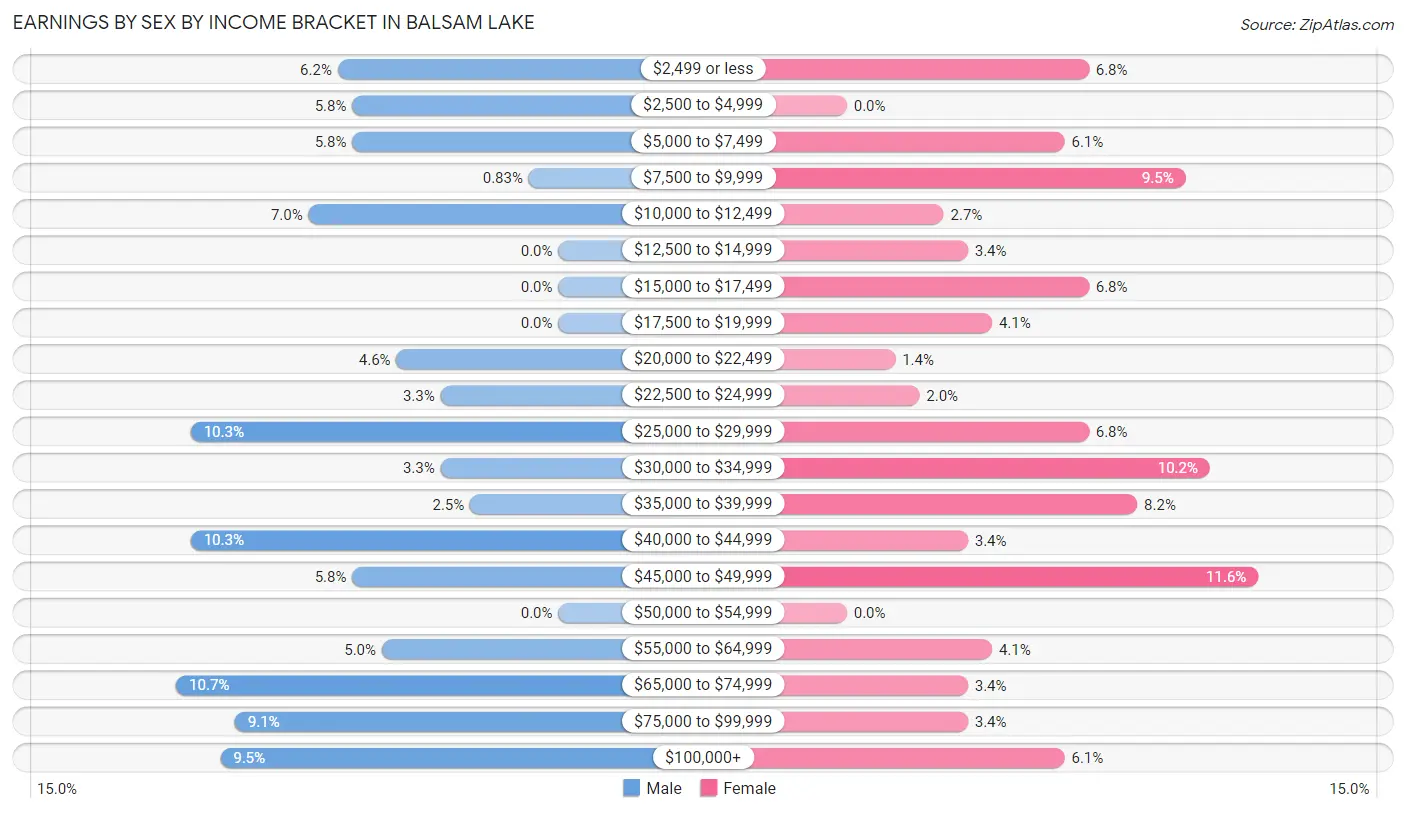
| Income | Male | Female |
| $2,499 or less | 15 (6.2%) | 10 (6.8%) |
| $2,500 to $4,999 | 14 (5.8%) | 0 (0.0%) |
| $5,000 to $7,499 | 14 (5.8%) | 9 (6.1%) |
| $7,500 to $9,999 | 2 (0.8%) | 14 (9.5%) |
| $10,000 to $12,499 | 17 (7.0%) | 4 (2.7%) |
| $12,500 to $14,999 | 0 (0.0%) | 5 (3.4%) |
| $15,000 to $17,499 | 0 (0.0%) | 10 (6.8%) |
| $17,500 to $19,999 | 0 (0.0%) | 6 (4.1%) |
| $20,000 to $22,499 | 11 (4.5%) | 2 (1.4%) |
| $22,500 to $24,999 | 8 (3.3%) | 3 (2.0%) |
| $25,000 to $29,999 | 25 (10.3%) | 10 (6.8%) |
| $30,000 to $34,999 | 8 (3.3%) | 15 (10.2%) |
| $35,000 to $39,999 | 6 (2.5%) | 12 (8.2%) |
| $40,000 to $44,999 | 25 (10.3%) | 5 (3.4%) |
| $45,000 to $49,999 | 14 (5.8%) | 17 (11.6%) |
| $50,000 to $54,999 | 0 (0.0%) | 0 (0.0%) |
| $55,000 to $64,999 | 12 (5.0%) | 6 (4.1%) |
| $65,000 to $74,999 | 26 (10.7%) | 5 (3.4%) |
| $75,000 to $99,999 | 22 (9.1%) | 5 (3.4%) |
| $100,000+ | 23 (9.5%) | 9 (6.1%) |
| Total | 242 (100.0%) | 147 (100.0%) |
Earnings by Sex by Educational Attainment in Balsam Lake
Average earnings in Balsam Lake are $41,974 for men and $30,139 for women, a difference of 28.2%. Men with an educational attainment of high school diploma enjoy the highest average annual earnings of $49,063, while those with college or associate's degree education earn the least with $38,750. Women with an educational attainment of graduate degree earn the most with the average annual earnings of $95,833, while those with bachelor's degree education have the smallest earnings of $16,875.
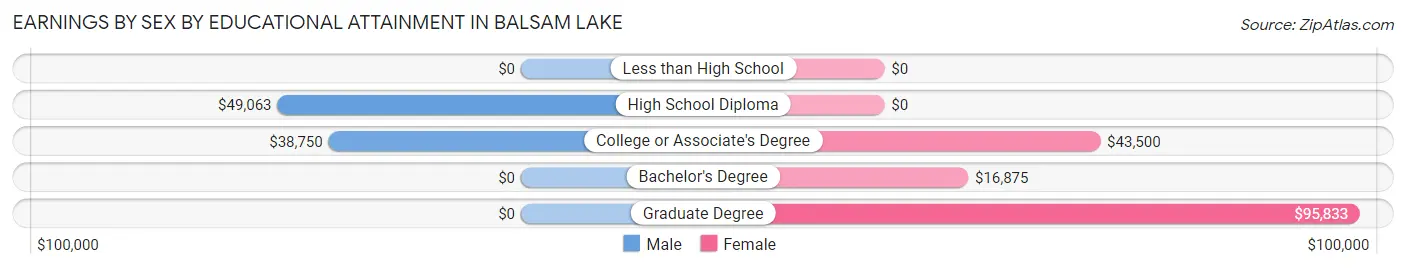
| Educational Attainment | Male Income | Female Income |
| Less than High School | - | - |
| High School Diploma | $49,063 | $0 |
| College or Associate's Degree | $38,750 | $43,500 |
| Bachelor's Degree | - | - |
| Graduate Degree | - | - |
| Total | $41,974 | $30,139 |
Family Income in Balsam Lake
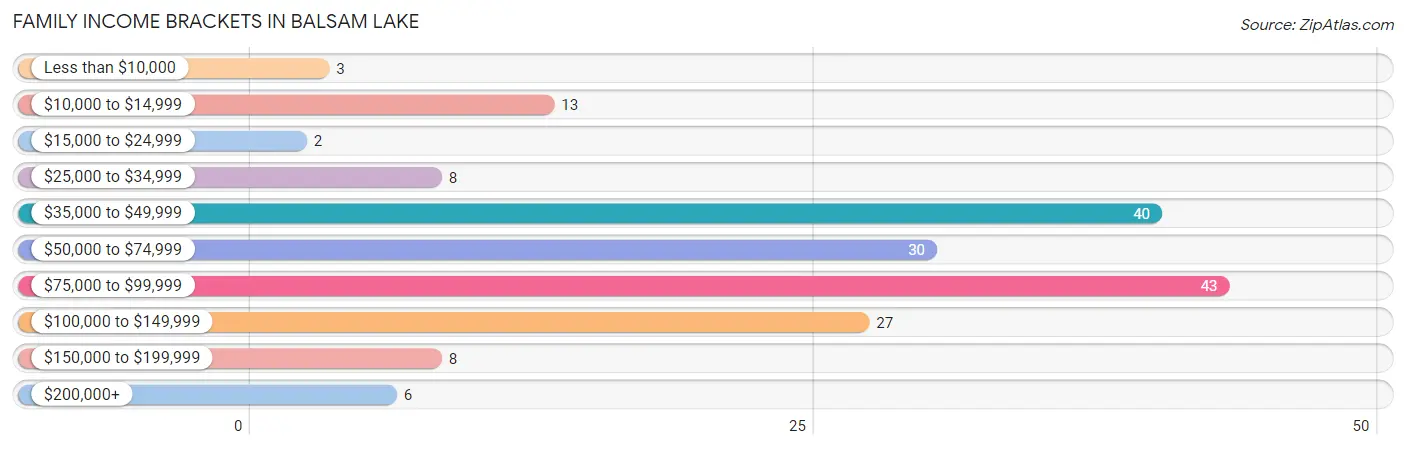
Family Income Brackets in Balsam Lake
According to the Balsam Lake family income data, there are 43 families falling into the $75,000 to $99,999 income range, which is the most common income bracket and makes up 23.9% of all families. Conversely, the $15,000 to $24,999 income bracket is the least frequent group with only 2 families (1.1%) belonging to this category.
| Income Bracket | # Families | % Families |
| Less than $10,000 | 3 | 1.7% |
| $10,000 to $14,999 | 13 | 7.2% |
| $15,000 to $24,999 | 2 | 1.1% |
| $25,000 to $34,999 | 8 | 4.4% |
| $35,000 to $49,999 | 40 | 22.2% |
| $50,000 to $74,999 | 30 | 16.7% |
| $75,000 to $99,999 | 43 | 23.9% |
| $100,000 to $149,999 | 27 | 15.0% |
| $150,000 to $199,999 | 8 | 4.4% |
| $200,000+ | 6 | 3.3% |
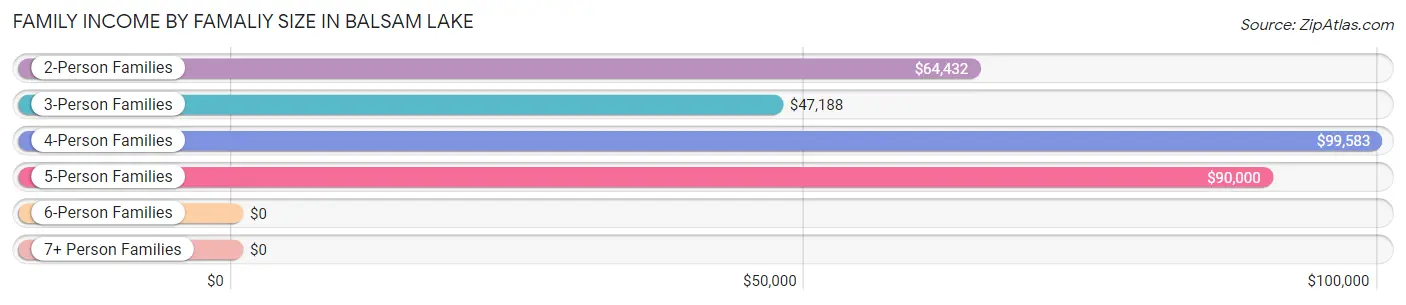
Family Income by Famaliy Size in Balsam Lake
4-person families (27 | 15.0%) account for the highest median family income in Balsam Lake with $99,583 per family, while 2-person families (99 | 55.0%) have the highest median income of $32,216 per family member.
| Income Bracket | # Families | Median Income |
| 2-Person Families | 99 (55.0%) | $64,432 |
| 3-Person Families | 46 (25.6%) | $47,188 |
| 4-Person Families | 27 (15.0%) | $99,583 |
| 5-Person Families | 8 (4.4%) | $90,000 |
| 6-Person Families | 0 (0.0%) | $0 |
| 7+ Person Families | 0 (0.0%) | $0 |
| Total | 180 (100.0%) | $64,773 |
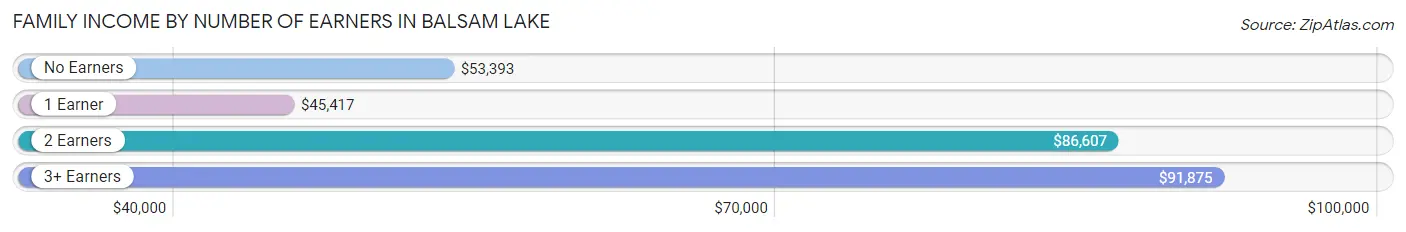
Family Income by Number of Earners in Balsam Lake
The median family income in Balsam Lake is $64,773, with families comprising 3+ earners (13) having the highest median family income of $91,875, while families with 1 earner (29) have the lowest median family income of $45,417, accounting for 7.2% and 16.1% of families, respectively.
| Number of Earners | # Families | Median Income |
| No Earners | 71 (39.4%) | $53,393 |
| 1 Earner | 29 (16.1%) | $45,417 |
| 2 Earners | 67 (37.2%) | $86,607 |
| 3+ Earners | 13 (7.2%) | $91,875 |
| Total | 180 (100.0%) | $64,773 |
Household Income in Balsam Lake
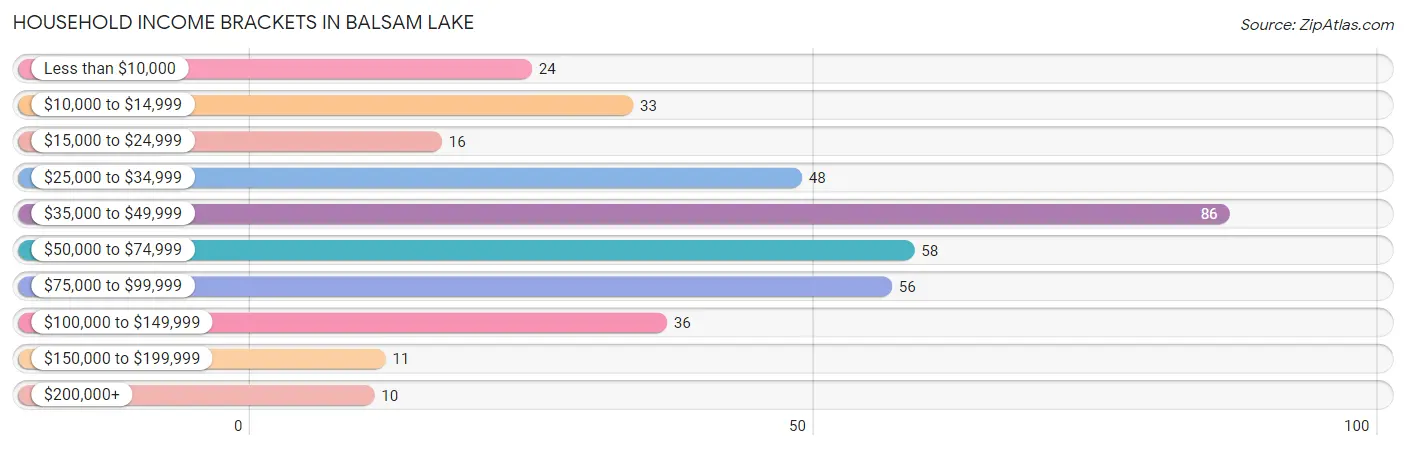
Household Income Brackets in Balsam Lake
With 86 households falling in the category, the $35,000 to $49,999 income range is the most frequent in Balsam Lake, accounting for 22.8% of all households. In contrast, only 10 households (2.6%) fall into the $200,000+ income bracket, making it the least populous group.
| Income Bracket | # Households | % Households |
| Less than $10,000 | 24 | 6.3% |
| $10,000 to $14,999 | 33 | 8.7% |
| $15,000 to $24,999 | 16 | 4.2% |
| $25,000 to $34,999 | 48 | 12.7% |
| $35,000 to $49,999 | 86 | 22.8% |
| $50,000 to $74,999 | 58 | 15.3% |
| $75,000 to $99,999 | 56 | 14.8% |
| $100,000 to $149,999 | 36 | 9.5% |
| $150,000 to $199,999 | 11 | 2.9% |
| $200,000+ | 10 | 2.6% |
Household Income by Householder Age in Balsam Lake
The median household income in Balsam Lake is $47,857, with the highest median household income of $63,036 found in the 45 to 64 years age bracket for the primary householder. A total of 93 households (24.6%) fall into this category. Meanwhile, the 15 to 24 years age bracket for the primary householder has the lowest median household income of $0, with 12 households (3.2%) in this group.
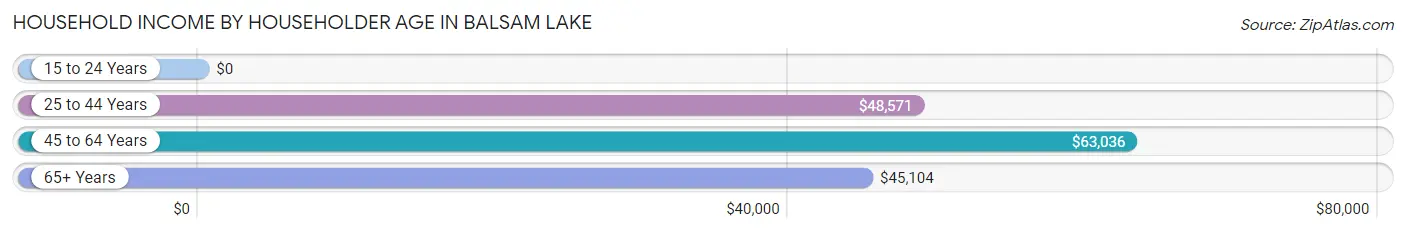
| Income Bracket | # Households | Median Income |
| 15 to 24 Years | 12 (3.2%) | $0 |
| 25 to 44 Years | 124 (32.8%) | $48,571 |
| 45 to 64 Years | 93 (24.6%) | $63,036 |
| 65+ Years | 149 (39.4%) | $45,104 |
| Total | 378 (100.0%) | $47,857 |
Poverty in Balsam Lake
Income Below Poverty by Sex and Age in Balsam Lake
With 14.1% poverty level for males and 17.1% for females among the residents of Balsam Lake, 5 year old males and 45 to 54 year old females are the most vulnerable to poverty, with 4 males (100.0%) and 14 females (43.8%) in their respective age groups living below the poverty level.
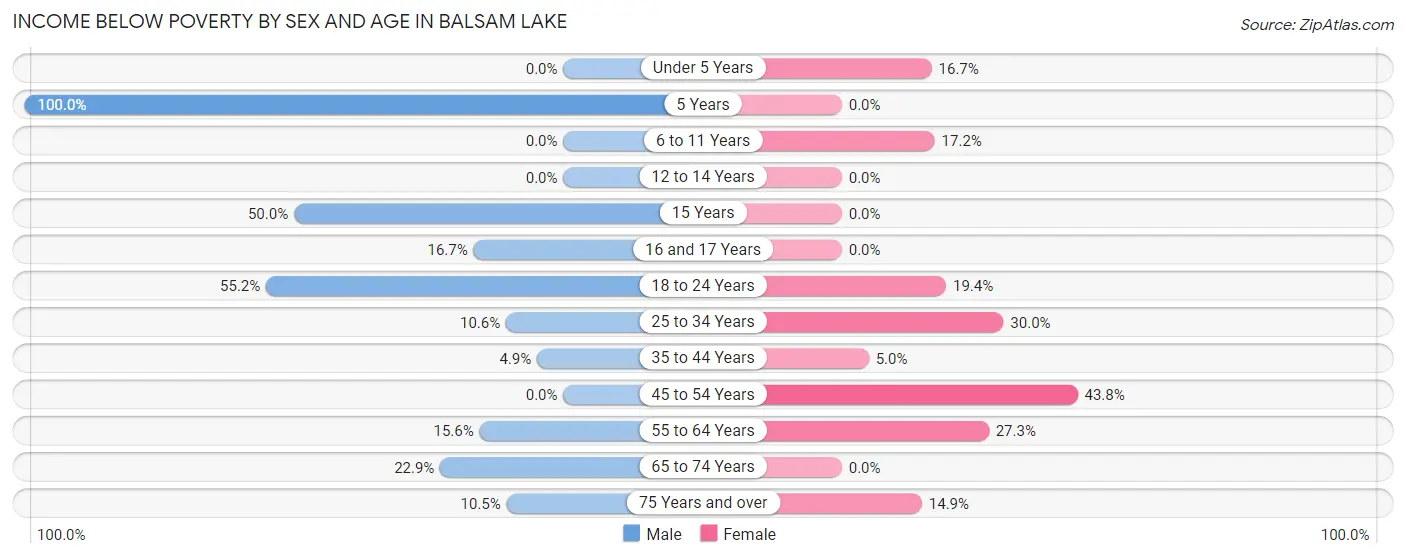
| Age Bracket | Male | Female |
| Under 5 Years | 0 (0.0%) | 2 (16.7%) |
| 5 Years | 4 (100.0%) | 0 (0.0%) |
| 6 to 11 Years | 0 (0.0%) | 5 (17.2%) |
| 12 to 14 Years | 0 (0.0%) | 0 (0.0%) |
| 15 Years | 3 (50.0%) | 0 (0.0%) |
| 16 and 17 Years | 3 (16.7%) | 0 (0.0%) |
| 18 to 24 Years | 16 (55.2%) | 6 (19.4%) |
| 25 to 34 Years | 5 (10.6%) | 12 (30.0%) |
| 35 to 44 Years | 4 (4.9%) | 2 (5.0%) |
| 45 to 54 Years | 0 (0.0%) | 14 (43.8%) |
| 55 to 64 Years | 7 (15.6%) | 12 (27.3%) |
| 65 to 74 Years | 8 (22.9%) | 0 (0.0%) |
| 75 Years and over | 6 (10.5%) | 11 (14.9%) |
| Total | 56 (14.1%) | 64 (17.1%) |
Income Above Poverty by Sex and Age in Balsam Lake
According to the poverty statistics in Balsam Lake, males aged under 5 years and females aged 12 to 14 years are the age groups that are most secure financially, with 100.0% of males and 100.0% of females in these age groups living above the poverty line.
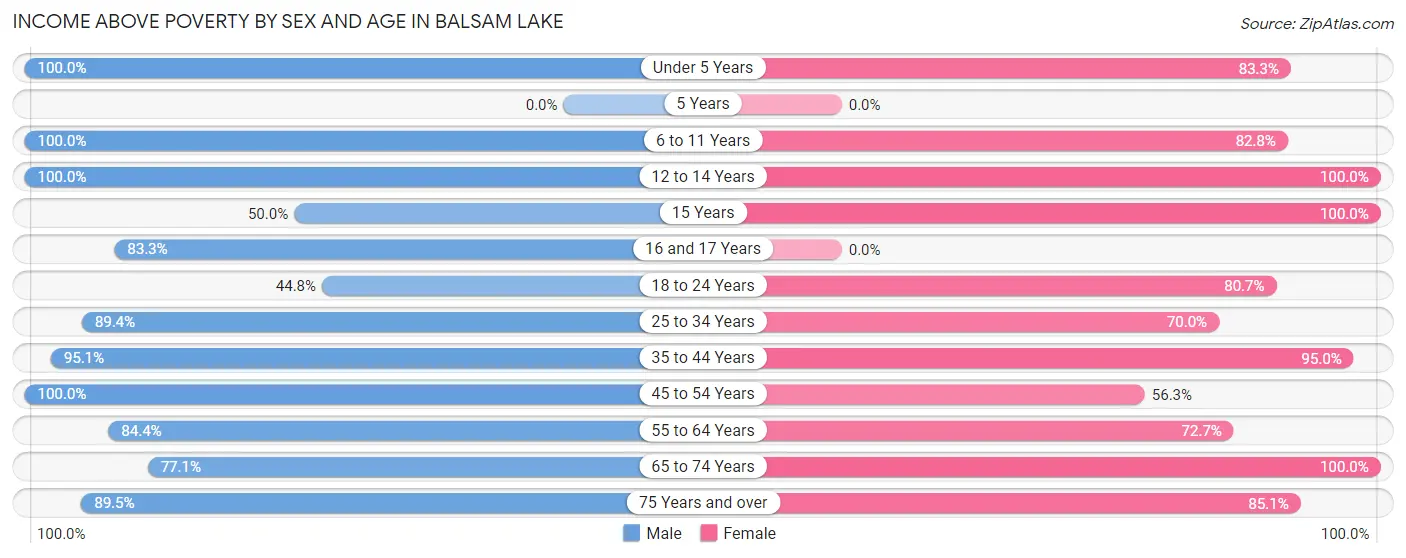
| Age Bracket | Male | Female |
| Under 5 Years | 7 (100.0%) | 10 (83.3%) |
| 5 Years | 0 (0.0%) | 0 (0.0%) |
| 6 to 11 Years | 22 (100.0%) | 24 (82.8%) |
| 12 to 14 Years | 9 (100.0%) | 15 (100.0%) |
| 15 Years | 3 (50.0%) | 1 (100.0%) |
| 16 and 17 Years | 15 (83.3%) | 0 (0.0%) |
| 18 to 24 Years | 13 (44.8%) | 25 (80.6%) |
| 25 to 34 Years | 42 (89.4%) | 28 (70.0%) |
| 35 to 44 Years | 78 (95.1%) | 38 (95.0%) |
| 45 to 54 Years | 37 (100.0%) | 18 (56.2%) |
| 55 to 64 Years | 38 (84.4%) | 32 (72.7%) |
| 65 to 74 Years | 27 (77.1%) | 57 (100.0%) |
| 75 Years and over | 51 (89.5%) | 63 (85.1%) |
| Total | 342 (85.9%) | 311 (82.9%) |
Income Below Poverty Among Married-Couple Families in Balsam Lake
The poverty statistics for married-couple families in Balsam Lake show that 6.1% or 8 of the total 130 families live below the poverty line. Families with no children have the highest poverty rate of 9.2%, comprising of 8 families. On the other hand, families with 1 or 2 children have the lowest poverty rate of 0.0%, which includes 0 families.
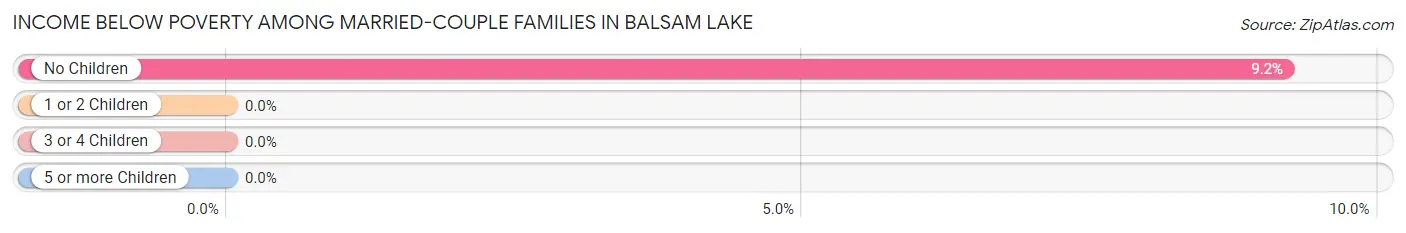
| Children | Above Poverty | Below Poverty |
| No Children | 79 (90.8%) | 8 (9.2%) |
| 1 or 2 Children | 41 (100.0%) | 0 (0.0%) |
| 3 or 4 Children | 2 (100.0%) | 0 (0.0%) |
| 5 or more Children | 0 (0.0%) | 0 (0.0%) |
| Total | 122 (93.9%) | 8 (6.1%) |
Income Below Poverty Among Single-Parent Households in Balsam Lake
According to the poverty data in Balsam Lake, 31.2% or 5 single-father households and 14.7% or 5 single-mother households are living below the poverty line. Among single-father households, those with 1 or 2 children have the highest poverty rate, with 5 households (35.7%) experiencing poverty. Likewise, among single-mother households, those with 3 or 4 children have the highest poverty rate, with 2 households (33.3%) falling below the poverty line.
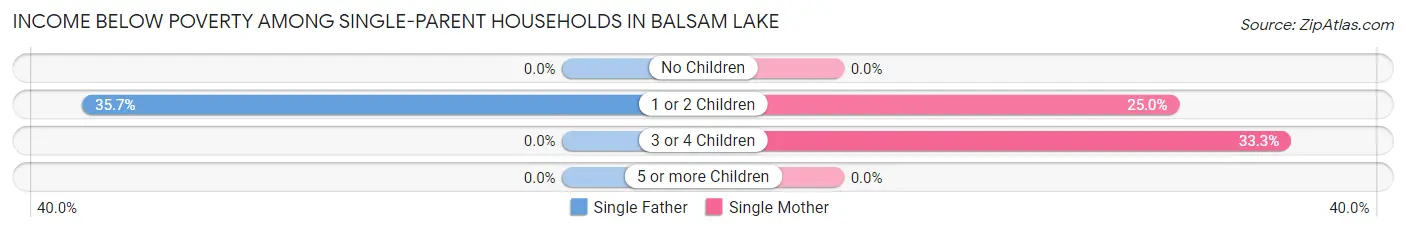
| Children | Single Father | Single Mother |
| No Children | 0 (0.0%) | 0 (0.0%) |
| 1 or 2 Children | 5 (35.7%) | 3 (25.0%) |
| 3 or 4 Children | 0 (0.0%) | 2 (33.3%) |
| 5 or more Children | 0 (0.0%) | 0 (0.0%) |
| Total | 5 (31.2%) | 5 (14.7%) |
Income Below Poverty Among Married-Couple vs Single-Parent Households in Balsam Lake
The poverty data for Balsam Lake shows that 8 of the married-couple family households (6.1%) and 10 of the single-parent households (20.0%) are living below the poverty level. Within the married-couple family households, those with no children have the highest poverty rate, with 8 households (9.2%) falling below the poverty line. Among the single-parent households, those with 3 or 4 children have the highest poverty rate, with 2 household (33.3%) living below poverty.
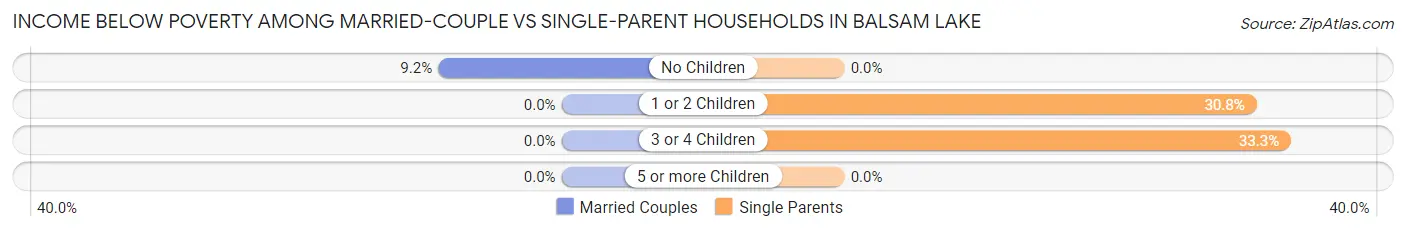
| Children | Married-Couple Families | Single-Parent Households |
| No Children | 8 (9.2%) | 0 (0.0%) |
| 1 or 2 Children | 0 (0.0%) | 8 (30.8%) |
| 3 or 4 Children | 0 (0.0%) | 2 (33.3%) |
| 5 or more Children | 0 (0.0%) | 0 (0.0%) |
| Total | 8 (6.1%) | 10 (20.0%) |
Race in Balsam Lake
The most populous races in Balsam Lake are White / Caucasian (807 | 96.8%), Hispanic or Latino (26 | 3.1%), and Some other Race (13 | 1.6%).
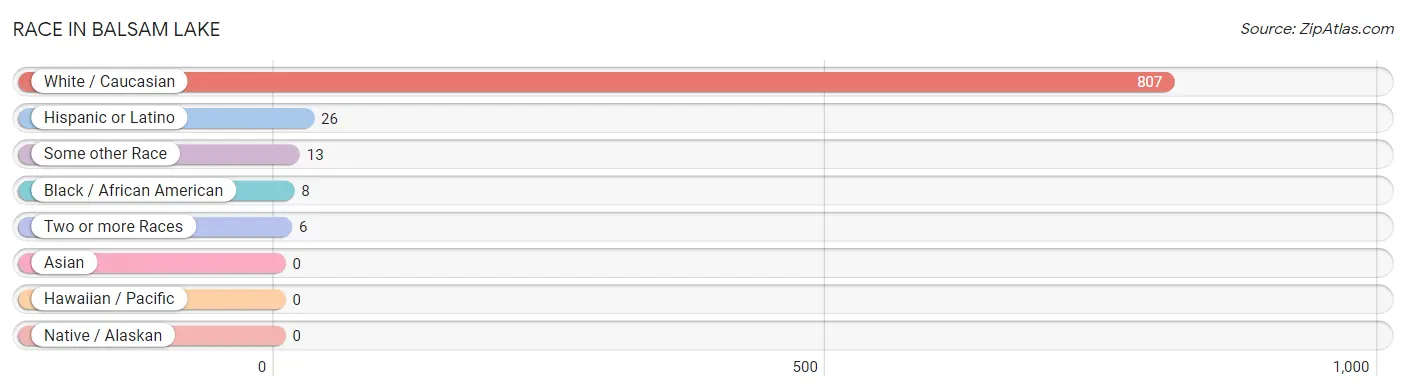
| Race | # Population | % Population |
| Asian | 0 | 0.0% |
| Black / African American | 8 | 1.0% |
| Hawaiian / Pacific | 0 | 0.0% |
| Hispanic or Latino | 26 | 3.1% |
| Native / Alaskan | 0 | 0.0% |
| White / Caucasian | 807 | 96.8% |
| Two or more Races | 6 | 0.7% |
| Some other Race | 13 | 1.6% |
| Total | 834 | 100.0% |
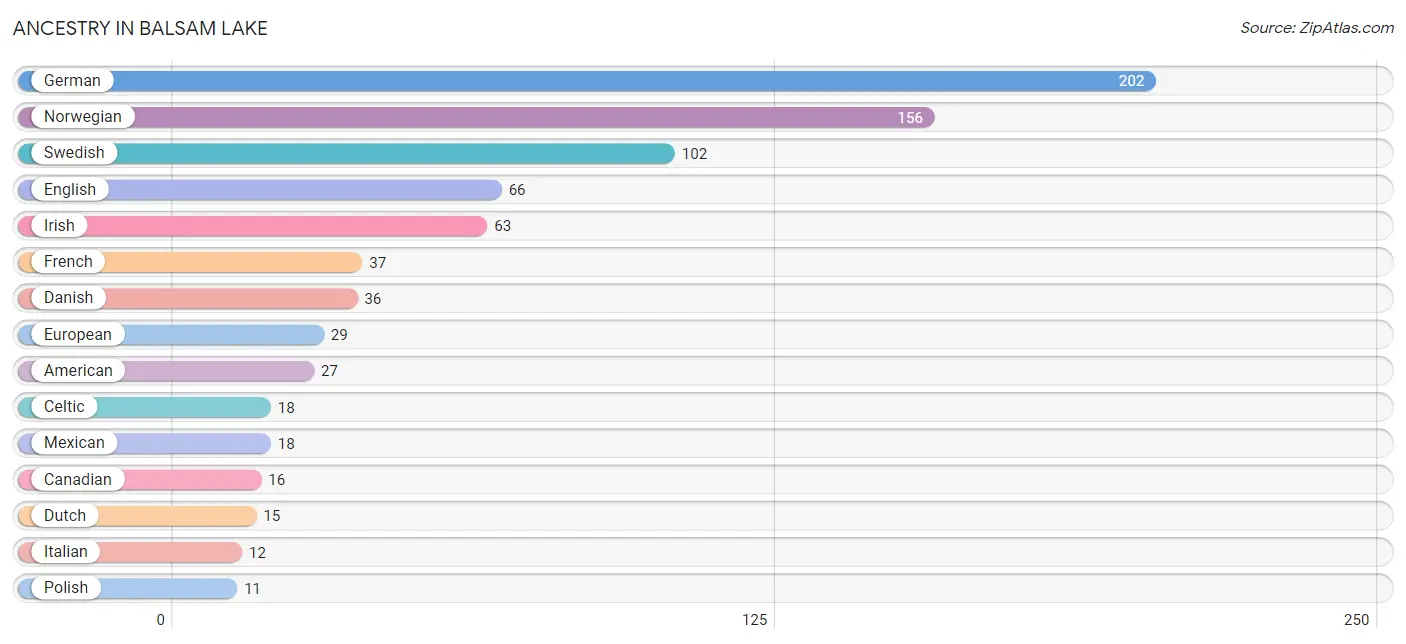
Ancestry in Balsam Lake
The most populous ancestries reported in Balsam Lake are German (202 | 24.2%), Norwegian (156 | 18.7%), Swedish (102 | 12.2%), English (66 | 7.9%), and Irish (63 | 7.5%), together accounting for 70.6% of all Balsam Lake residents.
| Ancestry | # Population | % Population |
| American | 27 | 3.2% |
| Canadian | 16 | 1.9% |
| Celtic | 18 | 2.2% |
| Croatian | 3 | 0.4% |
| Czech | 2 | 0.2% |
| Czechoslovakian | 3 | 0.4% |
| Danish | 36 | 4.3% |
| Dutch | 15 | 1.8% |
| English | 66 | 7.9% |
| European | 29 | 3.5% |
| French | 37 | 4.4% |
| French Canadian | 3 | 0.4% |
| German | 202 | 24.2% |
| Irish | 63 | 7.5% |
| Italian | 12 | 1.4% |
| Korean | 3 | 0.4% |
| Luxembourger | 3 | 0.4% |
| Mexican | 18 | 2.2% |
| Native Hawaiian | 3 | 0.4% |
| Norwegian | 156 | 18.7% |
| Polish | 11 | 1.3% |
| Puerto Rican | 8 | 1.0% |
| Russian | 2 | 0.2% |
| Scandinavian | 6 | 0.7% |
| Scottish | 10 | 1.2% |
| Slovak | 2 | 0.2% |
| Slovene | 2 | 0.2% |
| Swedish | 102 | 12.2% |
| Welsh | 3 | 0.4% | View All 29 Rows |
Immigrants in Balsam Lake

| Immigration Origin | # Population | % Population | View All 0 Rows |
Sex and Age in Balsam Lake
Sex and Age in Balsam Lake
The most populous age groups in Balsam Lake are 35 to 39 Years (63 | 13.9%) for men and 80 to 84 Years (41 | 10.8%) for women.
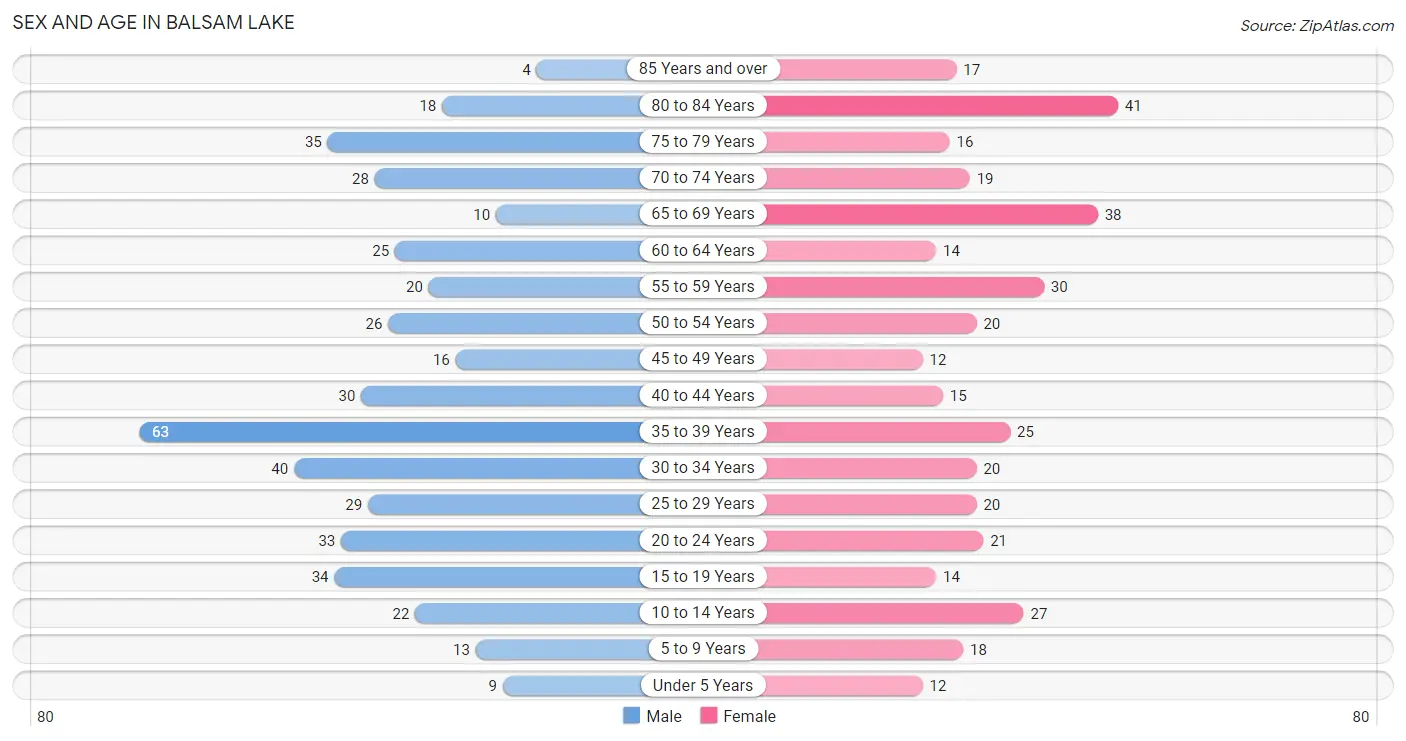
| Age Bracket | Male | Female |
| Under 5 Years | 9 (2.0%) | 12 (3.2%) |
| 5 to 9 Years | 13 (2.9%) | 18 (4.8%) |
| 10 to 14 Years | 22 (4.8%) | 27 (7.1%) |
| 15 to 19 Years | 34 (7.5%) | 14 (3.7%) |
| 20 to 24 Years | 33 (7.2%) | 21 (5.5%) |
| 25 to 29 Years | 29 (6.4%) | 20 (5.3%) |
| 30 to 34 Years | 40 (8.8%) | 20 (5.3%) |
| 35 to 39 Years | 63 (13.9%) | 25 (6.6%) |
| 40 to 44 Years | 30 (6.6%) | 15 (4.0%) |
| 45 to 49 Years | 16 (3.5%) | 12 (3.2%) |
| 50 to 54 Years | 26 (5.7%) | 20 (5.3%) |
| 55 to 59 Years | 20 (4.4%) | 30 (7.9%) |
| 60 to 64 Years | 25 (5.5%) | 14 (3.7%) |
| 65 to 69 Years | 10 (2.2%) | 38 (10.0%) |
| 70 to 74 Years | 28 (6.1%) | 19 (5.0%) |
| 75 to 79 Years | 35 (7.7%) | 16 (4.2%) |
| 80 to 84 Years | 18 (4.0%) | 41 (10.8%) |
| 85 Years and over | 4 (0.9%) | 17 (4.5%) |
| Total | 455 (100.0%) | 379 (100.0%) |
Families and Households in Balsam Lake
Median Family Size in Balsam Lake
The median family size in Balsam Lake is 2.84 persons per family, with single female/mother families (34 | 18.9%) accounting for the largest median family size of 3.06 persons per family. On the other hand, single male/father families (16 | 8.9%) represent the smallest median family size with 2.38 persons per family.
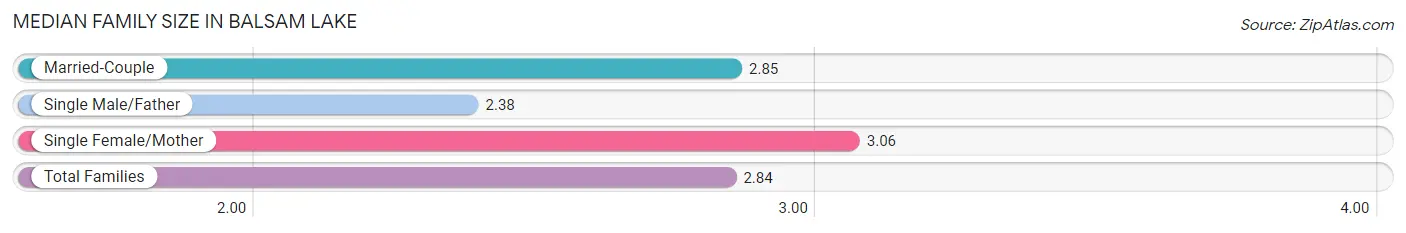
| Family Type | # Families | Family Size |
| Married-Couple | 130 (72.2%) | 2.85 |
| Single Male/Father | 16 (8.9%) | 2.38 |
| Single Female/Mother | 34 (18.9%) | 3.06 |
| Total Families | 180 (100.0%) | 2.84 |
Median Household Size in Balsam Lake
The median household size in Balsam Lake is 2.02 persons per household, with single female/mother households (34 | 9.0%) accounting for the largest median household size of 3.76 persons per household. non-family households (198 | 52.4%) represent the smallest median household size with 1.14 persons per household.
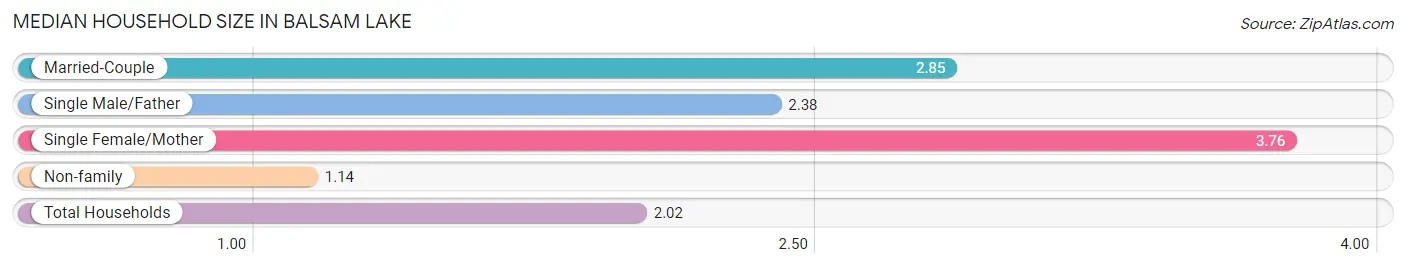
| Household Type | # Households | Household Size |
| Married-Couple | 130 (34.4%) | 2.85 |
| Single Male/Father | 16 (4.2%) | 2.38 |
| Single Female/Mother | 34 (9.0%) | 3.76 |
| Non-family | 198 (52.4%) | 1.14 |
| Total Households | 378 (100.0%) | 2.02 |
Household Size by Marriage Status in Balsam Lake
Out of a total of 378 households in Balsam Lake, 180 (47.6%) are family households, while 198 (52.4%) are nonfamily households. The most numerous type of family households are 2-person households, comprising 99, and the most common type of nonfamily households are 1-person households, comprising 183.
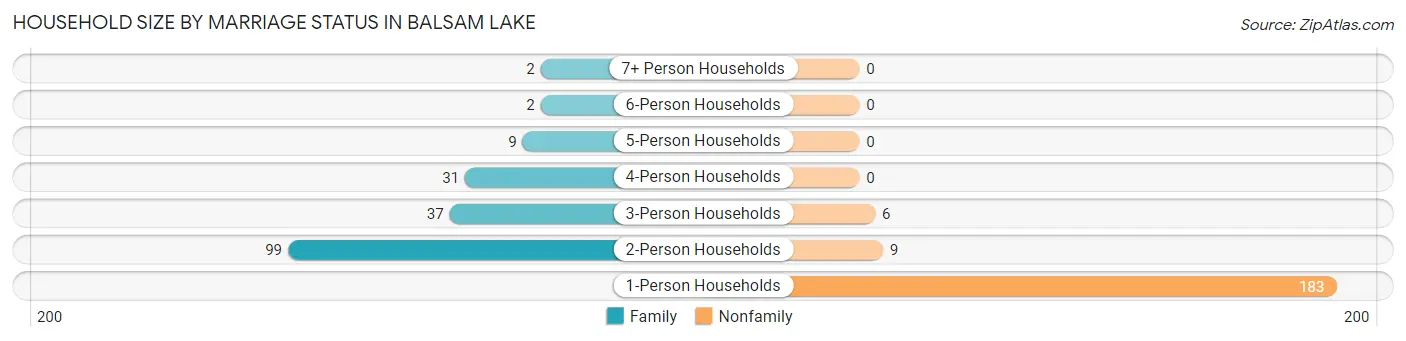
| Household Size | Family Households | Nonfamily Households |
| 1-Person Households | - | 183 (48.4%) |
| 2-Person Households | 99 (26.2%) | 9 (2.4%) |
| 3-Person Households | 37 (9.8%) | 6 (1.6%) |
| 4-Person Households | 31 (8.2%) | 0 (0.0%) |
| 5-Person Households | 9 (2.4%) | 0 (0.0%) |
| 6-Person Households | 2 (0.5%) | 0 (0.0%) |
| 7+ Person Households | 2 (0.5%) | 0 (0.0%) |
| Total | 180 (47.6%) | 198 (52.4%) |
Female Fertility in Balsam Lake
Fertility by Age in Balsam Lake
Average fertility rate in Balsam Lake is 61.0 births per 1,000 women. Women in the age bracket of 15 to 19 years have the highest fertility rate with 214.0 births per 1,000 women. Women in the age bracket of 15 to 19 years acount for 37.5% of all women with births.
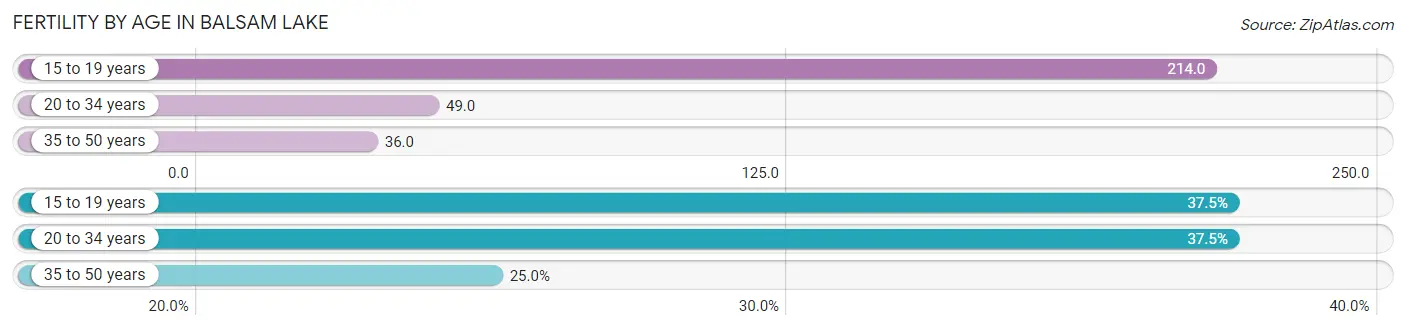
| Age Bracket | Women with Births | Births / 1,000 Women |
| 15 to 19 years | 3 (37.5%) | 214.0 |
| 20 to 34 years | 3 (37.5%) | 49.0 |
| 35 to 50 years | 2 (25.0%) | 36.0 |
| Total | 8 (100.0%) | 61.0 |
Fertility by Age by Marriage Status in Balsam Lake
62.5% of women with births (8) in Balsam Lake are married. The highest percentage of unmarried women with births falls into 15 to 19 years age bracket with 100.0% of them unmarried at the time of birth, while the lowest percentage of unmarried women with births belong to 20 to 34 years age bracket with 0.0% of them unmarried.
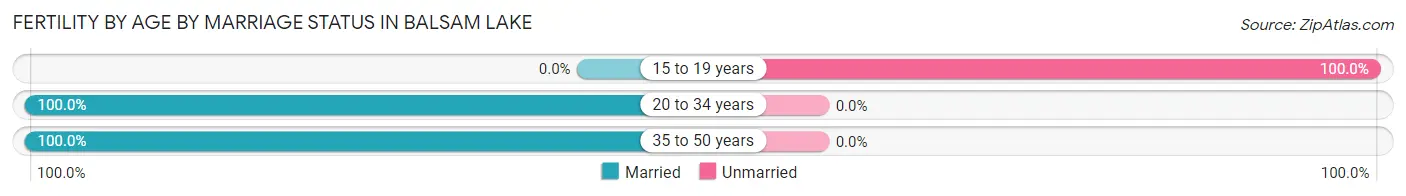
| Age Bracket | Married | Unmarried |
| 15 to 19 years | 0 (0.0%) | 3 (100.0%) |
| 20 to 34 years | 3 (100.0%) | 0 (0.0%) |
| 35 to 50 years | 2 (100.0%) | 0 (0.0%) |
| Total | 5 (62.5%) | 3 (37.5%) |
Fertility by Education in Balsam Lake
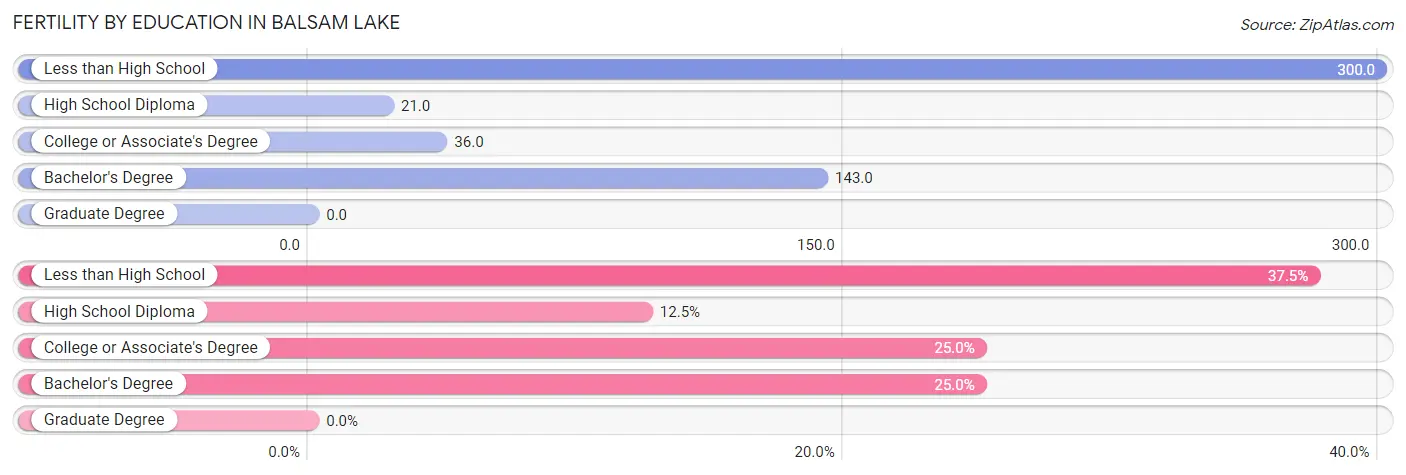
| Educational Attainment | Women with Births | Births / 1,000 Women |
| Less than High School | 3 (37.5%) | 300.0 |
| High School Diploma | 1 (12.5%) | 21.0 |
| College or Associate's Degree | 2 (25.0%) | 36.0 |
| Bachelor's Degree | 2 (25.0%) | 143.0 |
| Graduate Degree | 0 (0.0%) | 0.0 |
| Total | 8 (100.0%) | 61.0 |
Fertility by Education by Marriage Status in Balsam Lake
37.5% of women with births in Balsam Lake are unmarried. Women with the educational attainment of high school diploma are most likely to be married with 100.0% of them married at childbirth, while women with the educational attainment of less than high school are least likely to be married with 100.0% of them unmarried at childbirth.
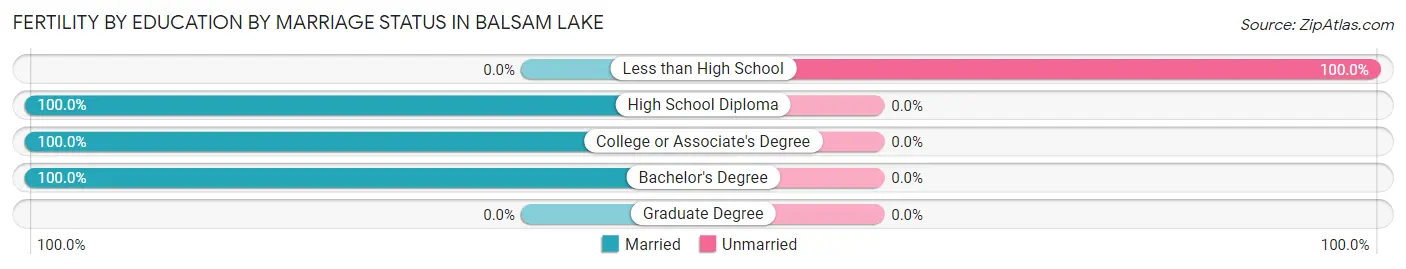
| Educational Attainment | Married | Unmarried |
| Less than High School | 0 (0.0%) | 3 (100.0%) |
| High School Diploma | 1 (100.0%) | 0 (0.0%) |
| College or Associate's Degree | 2 (100.0%) | 0 (0.0%) |
| Bachelor's Degree | 2 (100.0%) | 0 (0.0%) |
| Graduate Degree | 0 (0.0%) | 0 (0.0%) |
| Total | 5 (62.5%) | 3 (37.5%) |
Employment Characteristics in Balsam Lake
Employment by Class of Employer in Balsam Lake
Among the 324 employed individuals in Balsam Lake, private company employees (233 | 71.9%), not-for-profit organizations (38 | 11.7%), and self-employed (not incorporated) (18 | 5.6%) make up the most common classes of employment.
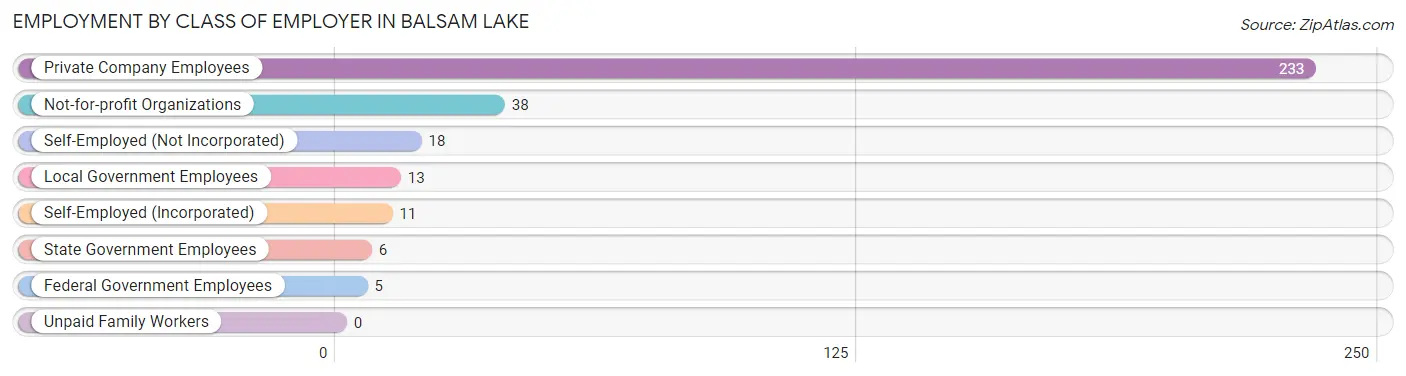
| Employer Class | # Employees | % Employees |
| Private Company Employees | 233 | 71.9% |
| Self-Employed (Incorporated) | 11 | 3.4% |
| Self-Employed (Not Incorporated) | 18 | 5.6% |
| Not-for-profit Organizations | 38 | 11.7% |
| Local Government Employees | 13 | 4.0% |
| State Government Employees | 6 | 1.8% |
| Federal Government Employees | 5 | 1.5% |
| Unpaid Family Workers | 0 | 0.0% |
| Total | 324 | 100.0% |
Employment Status by Age in Balsam Lake
According to the labor force statistics for Balsam Lake, out of the total population over 16 years of age (726), 49.2% or 357 individuals are in the labor force, with 7.8% or 28 of them unemployed. The age group with the highest labor force participation rate is 35 to 44 years, with 85.0% or 113 individuals in the labor force. Within the labor force, the 16 to 19 years age range has the highest percentage of unemployed individuals, with 30.8% or 8 of them being unemployed.
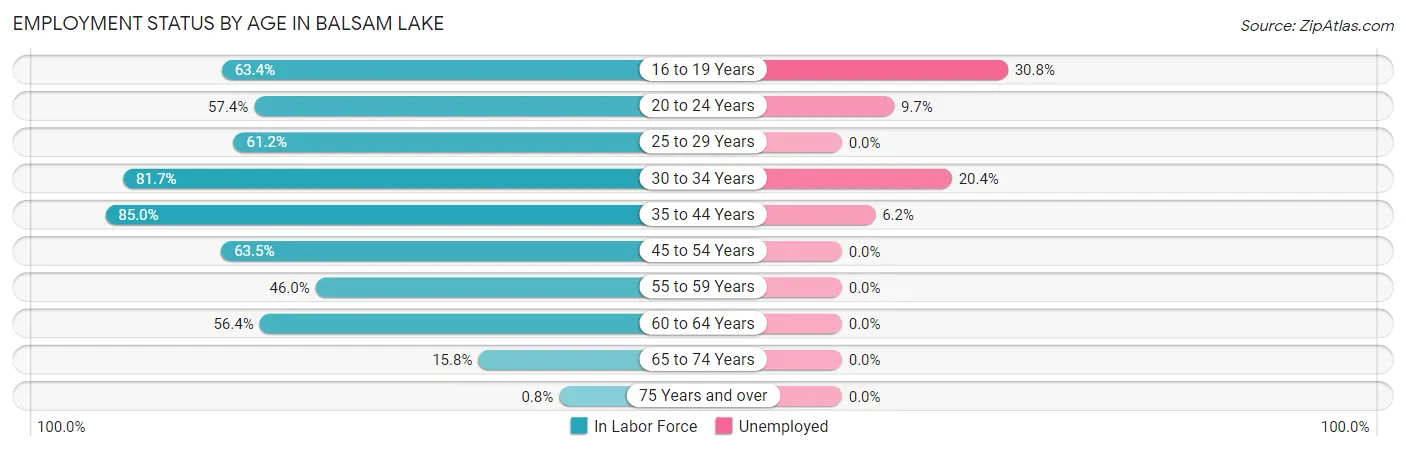
| Age Bracket | In Labor Force | Unemployed |
| 16 to 19 Years | 26 (63.4%) | 8 (30.8%) |
| 20 to 24 Years | 31 (57.4%) | 3 (9.7%) |
| 25 to 29 Years | 30 (61.2%) | 0 (0.0%) |
| 30 to 34 Years | 49 (81.7%) | 10 (20.4%) |
| 35 to 44 Years | 113 (85.0%) | 7 (6.2%) |
| 45 to 54 Years | 47 (63.5%) | 0 (0.0%) |
| 55 to 59 Years | 23 (46.0%) | 0 (0.0%) |
| 60 to 64 Years | 22 (56.4%) | 0 (0.0%) |
| 65 to 74 Years | 15 (15.8%) | 0 (0.0%) |
| 75 Years and over | 1 (0.8%) | 0 (0.0%) |
| Total | 357 (49.2%) | 28 (7.8%) |
Employment Status by Educational Attainment in Balsam Lake
According to labor force statistics for Balsam Lake, 70.1% of individuals (284) out of the total population between 25 and 64 years of age (405) are in the labor force, with 6.0% or 17 of them being unemployed. The group with the highest labor force participation rate are those with the educational attainment of bachelor's degree or higher, with 89.8% or 44 individuals in the labor force. Within the labor force, individuals with less than high school education have the highest percentage of unemployment, with 46.7% or 7 of them being unemployed.
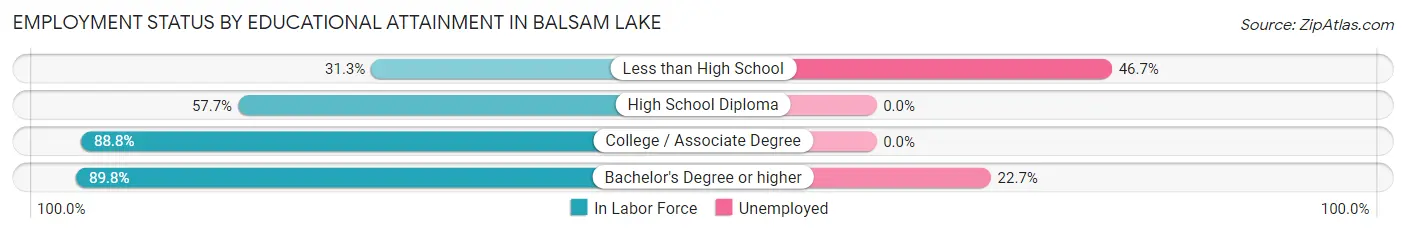
| Educational Attainment | In Labor Force | Unemployed |
| Less than High School | 15 (31.3%) | 22 (46.7%) |
| High School Diploma | 90 (57.7%) | 0 (0.0%) |
| College / Associate Degree | 135 (88.8%) | 0 (0.0%) |
| Bachelor's Degree or higher | 44 (89.8%) | 11 (22.7%) |
| Total | 284 (70.1%) | 24 (6.0%) |
Employment Occupations by Sex in Balsam Lake
Management, Business, Science and Arts Occupations
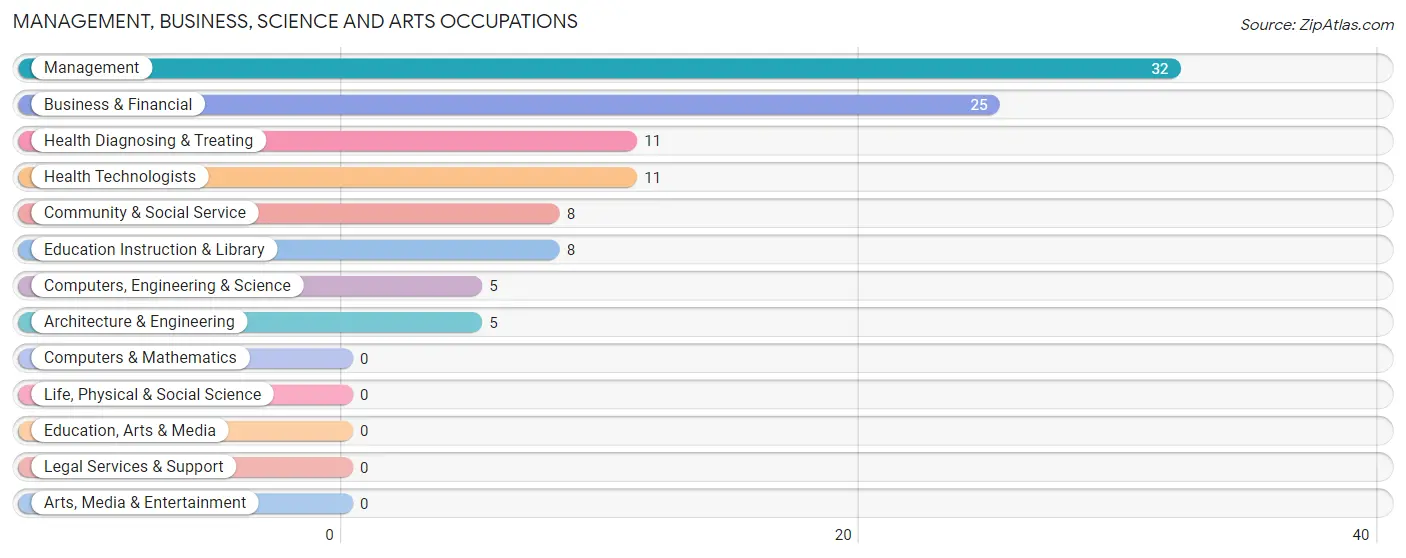
The most common Management, Business, Science and Arts occupations in Balsam Lake are Management (32 | 9.7%), Business & Financial (25 | 7.6%), Health Diagnosing & Treating (11 | 3.3%), Health Technologists (11 | 3.3%), and Community & Social Service (8 | 2.4%).
Management, Business, Science and Arts Occupations by Sex
Within the Management, Business, Science and Arts occupations in Balsam Lake, the most male-oriented occupations are Computers, Engineering & Science (100.0%), Architecture & Engineering (100.0%), and Management (56.2%), while the most female-oriented occupations are Health Diagnosing & Treating (100.0%), Health Technologists (100.0%), and Business & Financial (68.0%).
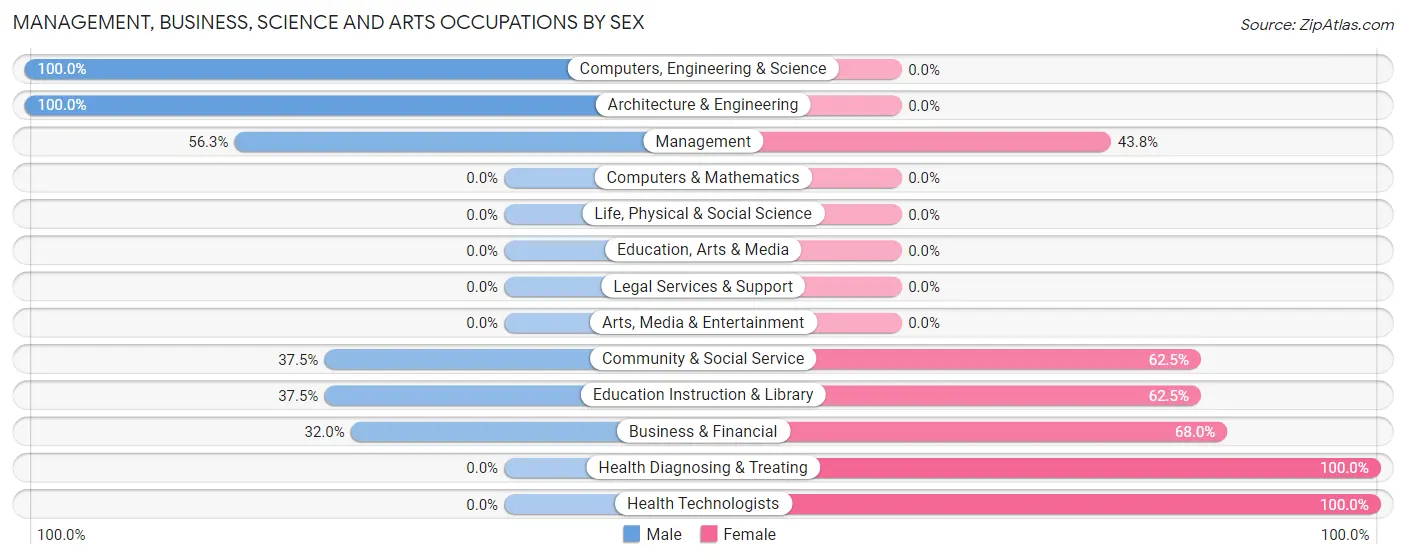
| Occupation | Male | Female |
| Management | 18 (56.2%) | 14 (43.8%) |
| Business & Financial | 8 (32.0%) | 17 (68.0%) |
| Computers, Engineering & Science | 5 (100.0%) | 0 (0.0%) |
| Computers & Mathematics | 0 (0.0%) | 0 (0.0%) |
| Architecture & Engineering | 5 (100.0%) | 0 (0.0%) |
| Life, Physical & Social Science | 0 (0.0%) | 0 (0.0%) |
| Community & Social Service | 3 (37.5%) | 5 (62.5%) |
| Education, Arts & Media | 0 (0.0%) | 0 (0.0%) |
| Legal Services & Support | 0 (0.0%) | 0 (0.0%) |
| Education Instruction & Library | 3 (37.5%) | 5 (62.5%) |
| Arts, Media & Entertainment | 0 (0.0%) | 0 (0.0%) |
| Health Diagnosing & Treating | 0 (0.0%) | 11 (100.0%) |
| Health Technologists | 0 (0.0%) | 11 (100.0%) |
| Total (Category) | 34 (42.0%) | 47 (58.0%) |
| Total (Overall) | 192 (58.4%) | 137 (41.6%) |
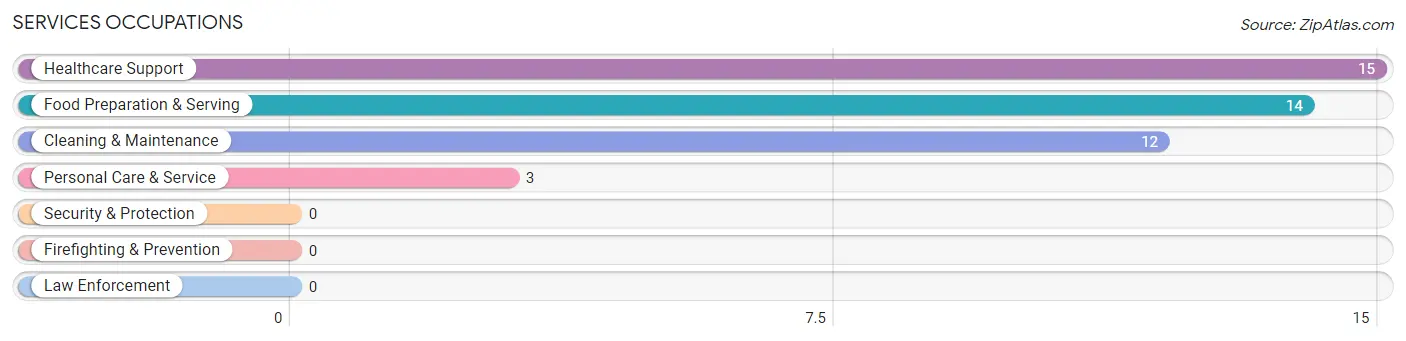
Services Occupations
The most common Services occupations in Balsam Lake are Healthcare Support (15 | 4.6%), Food Preparation & Serving (14 | 4.3%), Cleaning & Maintenance (12 | 3.6%), and Personal Care & Service (3 | 0.9%).
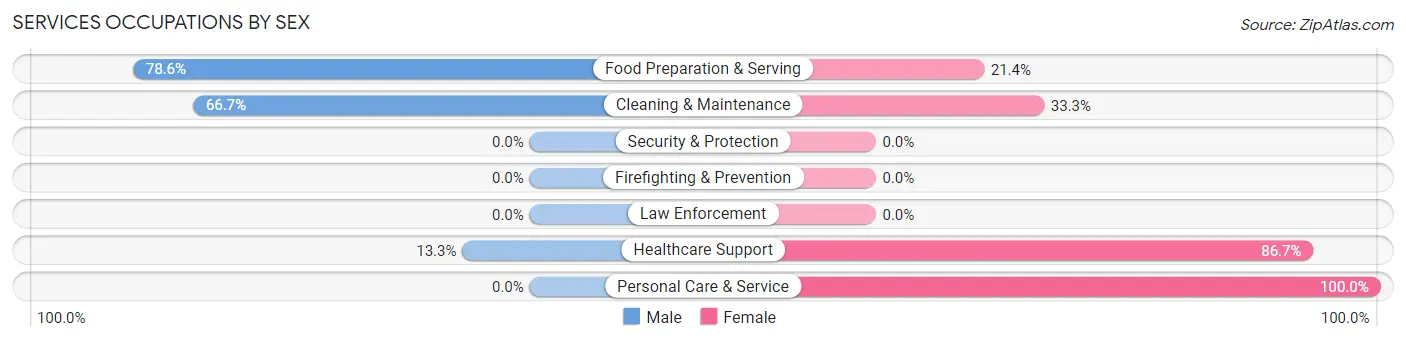
Services Occupations by Sex
Within the Services occupations in Balsam Lake, the most male-oriented occupations are Food Preparation & Serving (78.6%), Cleaning & Maintenance (66.7%), and Healthcare Support (13.3%), while the most female-oriented occupations are Personal Care & Service (100.0%), Healthcare Support (86.7%), and Cleaning & Maintenance (33.3%).
| Occupation | Male | Female |
| Healthcare Support | 2 (13.3%) | 13 (86.7%) |
| Security & Protection | 0 (0.0%) | 0 (0.0%) |
| Firefighting & Prevention | 0 (0.0%) | 0 (0.0%) |
| Law Enforcement | 0 (0.0%) | 0 (0.0%) |
| Food Preparation & Serving | 11 (78.6%) | 3 (21.4%) |
| Cleaning & Maintenance | 8 (66.7%) | 4 (33.3%) |
| Personal Care & Service | 0 (0.0%) | 3 (100.0%) |
| Total (Category) | 21 (47.7%) | 23 (52.3%) |
| Total (Overall) | 192 (58.4%) | 137 (41.6%) |
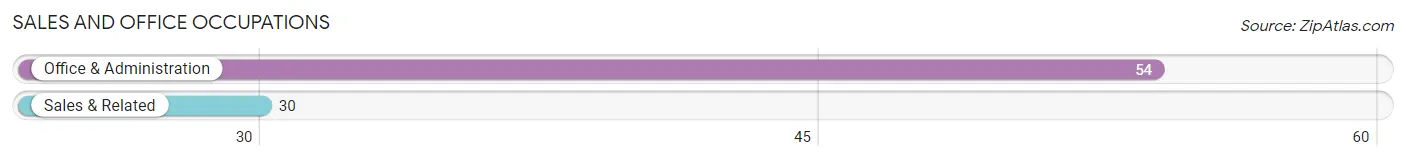
Sales and Office Occupations
The most common Sales and Office occupations in Balsam Lake are Office & Administration (54 | 16.4%), and Sales & Related (30 | 9.1%).
Sales and Office Occupations by Sex
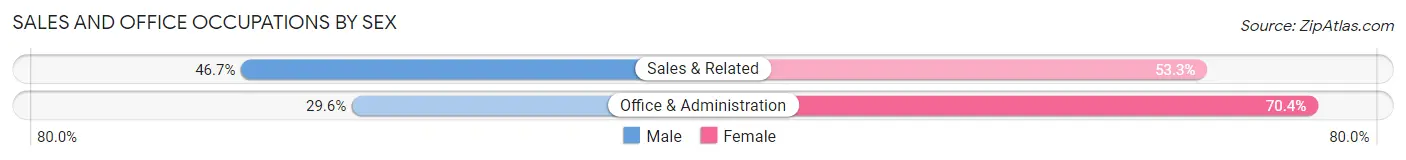
| Occupation | Male | Female |
| Sales & Related | 14 (46.7%) | 16 (53.3%) |
| Office & Administration | 16 (29.6%) | 38 (70.4%) |
| Total (Category) | 30 (35.7%) | 54 (64.3%) |
| Total (Overall) | 192 (58.4%) | 137 (41.6%) |
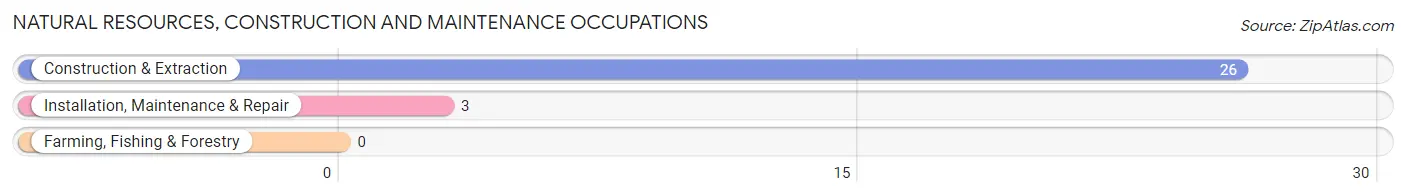
Natural Resources, Construction and Maintenance Occupations
The most common Natural Resources, Construction and Maintenance occupations in Balsam Lake are Construction & Extraction (26 | 7.9%), and Installation, Maintenance & Repair (3 | 0.9%).
Natural Resources, Construction and Maintenance Occupations by Sex
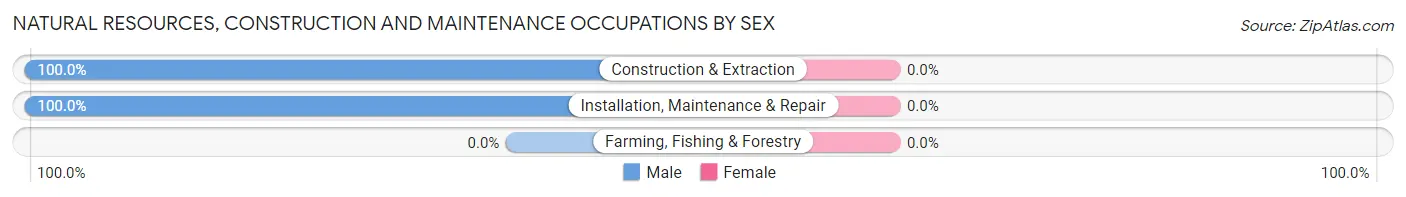
| Occupation | Male | Female |
| Farming, Fishing & Forestry | 0 (0.0%) | 0 (0.0%) |
| Construction & Extraction | 26 (100.0%) | 0 (0.0%) |
| Installation, Maintenance & Repair | 3 (100.0%) | 0 (0.0%) |
| Total (Category) | 29 (100.0%) | 0 (0.0%) |
| Total (Overall) | 192 (58.4%) | 137 (41.6%) |
Production, Transportation and Moving Occupations
The most common Production, Transportation and Moving occupations in Balsam Lake are Production (43 | 13.1%), Transportation (28 | 8.5%), and Material Moving (20 | 6.1%).
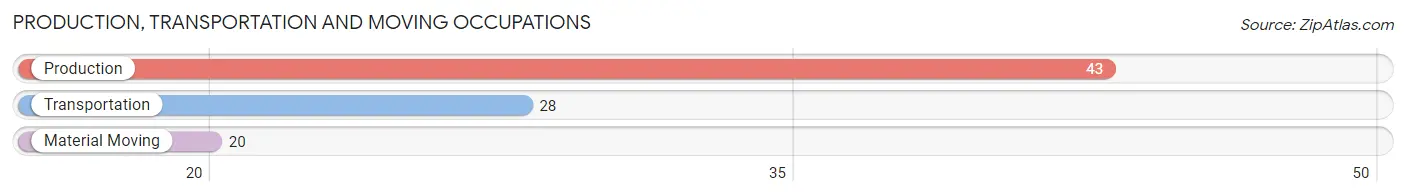
Production, Transportation and Moving Occupations by Sex
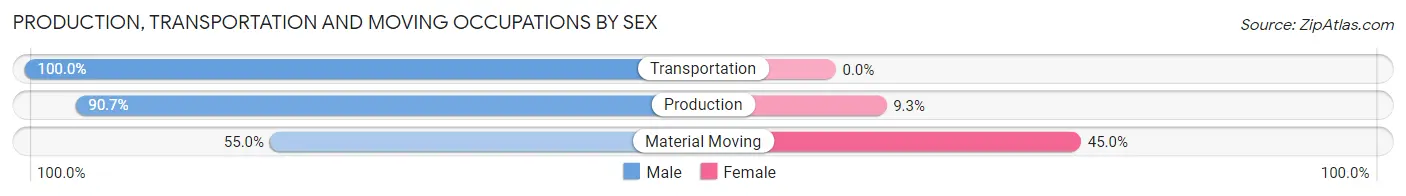
| Occupation | Male | Female |
| Production | 39 (90.7%) | 4 (9.3%) |
| Transportation | 28 (100.0%) | 0 (0.0%) |
| Material Moving | 11 (55.0%) | 9 (45.0%) |
| Total (Category) | 78 (85.7%) | 13 (14.3%) |
| Total (Overall) | 192 (58.4%) | 137 (41.6%) |
Employment Industries by Sex in Balsam Lake
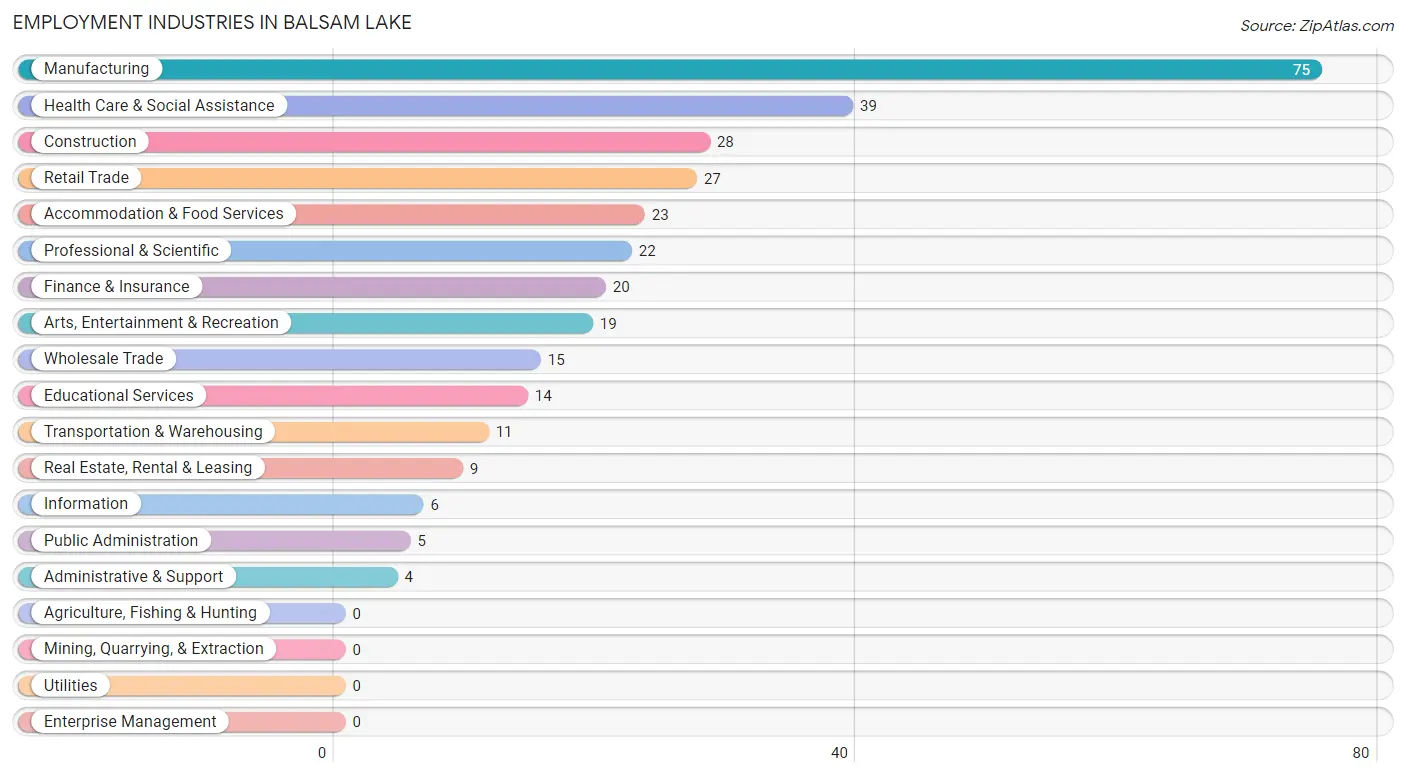
Employment Industries in Balsam Lake
The major employment industries in Balsam Lake include Manufacturing (75 | 22.8%), Health Care & Social Assistance (39 | 11.8%), Construction (28 | 8.5%), Retail Trade (27 | 8.2%), and Accommodation & Food Services (23 | 7.0%).
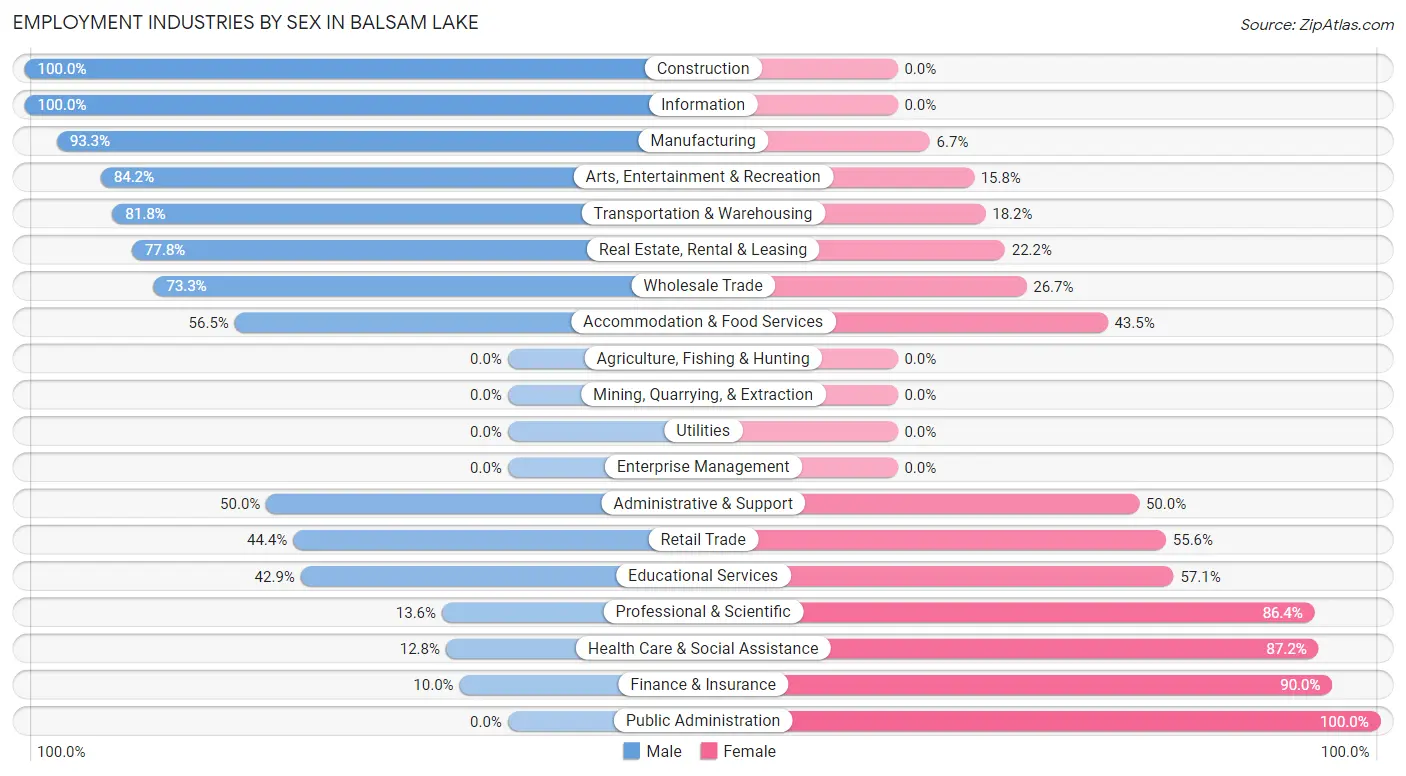
Employment Industries by Sex in Balsam Lake
The Balsam Lake industries that see more men than women are Construction (100.0%), Information (100.0%), and Manufacturing (93.3%), whereas the industries that tend to have a higher number of women are Public Administration (100.0%), Finance & Insurance (90.0%), and Health Care & Social Assistance (87.2%).
| Industry | Male | Female |
| Agriculture, Fishing & Hunting | 0 (0.0%) | 0 (0.0%) |
| Mining, Quarrying, & Extraction | 0 (0.0%) | 0 (0.0%) |
| Construction | 28 (100.0%) | 0 (0.0%) |
| Manufacturing | 70 (93.3%) | 5 (6.7%) |
| Wholesale Trade | 11 (73.3%) | 4 (26.7%) |
| Retail Trade | 12 (44.4%) | 15 (55.6%) |
| Transportation & Warehousing | 9 (81.8%) | 2 (18.2%) |
| Utilities | 0 (0.0%) | 0 (0.0%) |
| Information | 6 (100.0%) | 0 (0.0%) |
| Finance & Insurance | 2 (10.0%) | 18 (90.0%) |
| Real Estate, Rental & Leasing | 7 (77.8%) | 2 (22.2%) |
| Professional & Scientific | 3 (13.6%) | 19 (86.4%) |
| Enterprise Management | 0 (0.0%) | 0 (0.0%) |
| Administrative & Support | 2 (50.0%) | 2 (50.0%) |
| Educational Services | 6 (42.9%) | 8 (57.1%) |
| Health Care & Social Assistance | 5 (12.8%) | 34 (87.2%) |
| Arts, Entertainment & Recreation | 16 (84.2%) | 3 (15.8%) |
| Accommodation & Food Services | 13 (56.5%) | 10 (43.5%) |
| Public Administration | 0 (0.0%) | 5 (100.0%) |
| Total | 192 (58.4%) | 137 (41.6%) |
Education in Balsam Lake
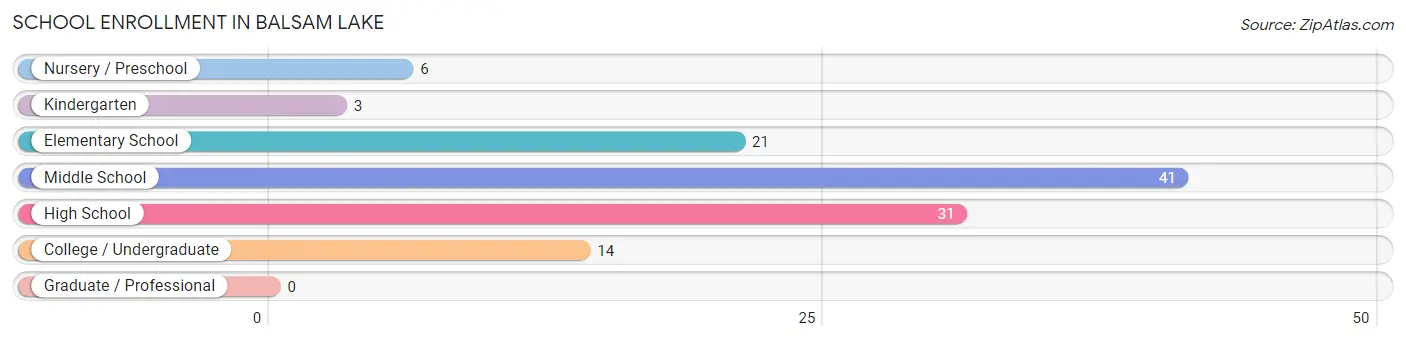
School Enrollment in Balsam Lake
The most common levels of schooling among the 116 students in Balsam Lake are middle school (41 | 35.3%), high school (31 | 26.7%), and elementary school (21 | 18.1%).
| School Level | # Students | % Students |
| Nursery / Preschool | 6 | 5.2% |
| Kindergarten | 3 | 2.6% |
| Elementary School | 21 | 18.1% |
| Middle School | 41 | 35.3% |
| High School | 31 | 26.7% |
| College / Undergraduate | 14 | 12.1% |
| Graduate / Professional | 0 | 0.0% |
| Total | 116 | 100.0% |
School Enrollment by Age by Funding Source in Balsam Lake
Out of a total of 116 students who are enrolled in schools in Balsam Lake, 18 (15.5%) attend a private institution, while the remaining 98 (84.5%) are enrolled in public schools. The age group of 18 to 19 year olds has the highest likelihood of being enrolled in private schools, with 3 (50.0% in the age bracket) enrolled. Conversely, the age group of 3 to 4 year olds has the lowest likelihood of being enrolled in a private school, with 2 (100.0% in the age bracket) attending a public institution.

| Age Bracket | Public School | Private School |
| 3 to 4 Year Olds | 2 (100.0%) | 0 (0.0%) |
| 5 to 9 Year Old | 22 (84.6%) | 4 (15.4%) |
| 10 to 14 Year Olds | 38 (77.5%) | 11 (22.5%) |
| 15 to 17 Year Olds | 25 (100.0%) | 0 (0.0%) |
| 18 to 19 Year Olds | 3 (50.0%) | 3 (50.0%) |
| 20 to 24 Year Olds | 3 (100.0%) | 0 (0.0%) |
| 25 to 34 Year Olds | 5 (100.0%) | 0 (0.0%) |
| 35 Years and over | 0 (0.0%) | 0 (0.0%) |
| Total | 98 (84.5%) | 18 (15.5%) |
Educational Attainment by Field of Study in Balsam Lake
Business (23 | 17.7%), education (21 | 16.2%), bio, nature & agricultural (14 | 10.8%), science & technology (14 | 10.8%), and arts & humanities (13 | 10.0%) are the most common fields of study among 130 individuals in Balsam Lake who have obtained a bachelor's degree or higher.
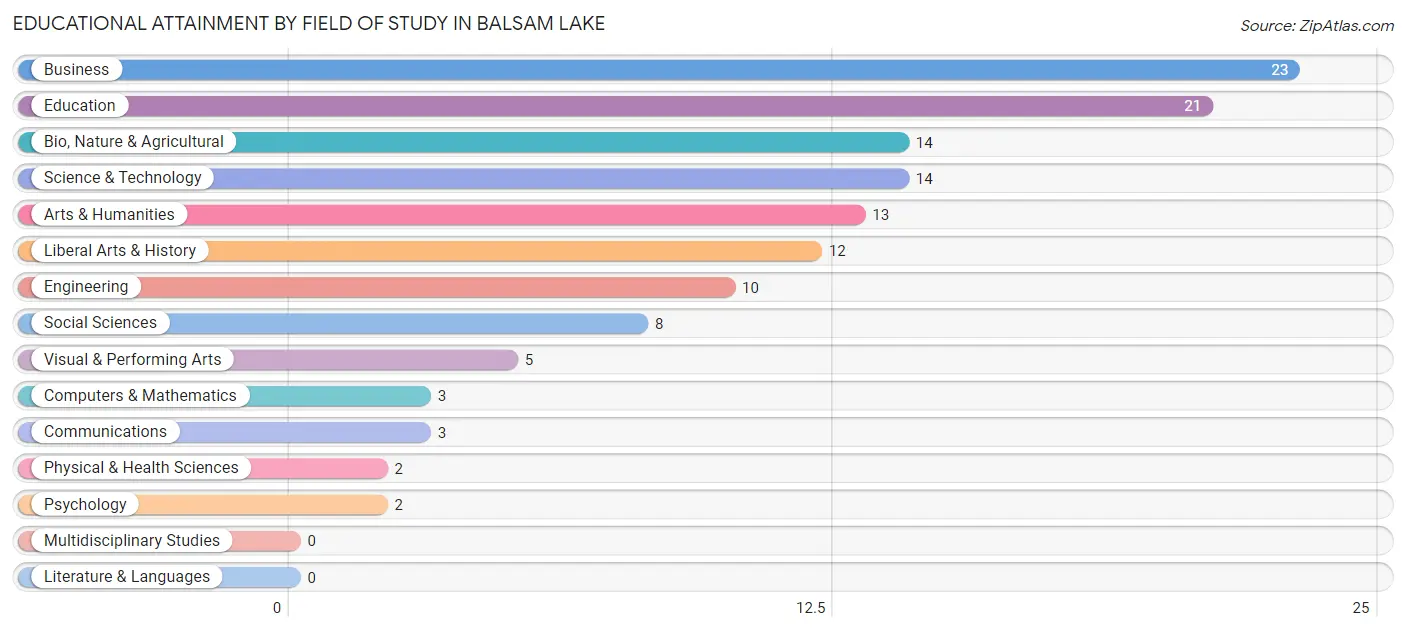
| Field of Study | # Graduates | % Graduates |
| Computers & Mathematics | 3 | 2.3% |
| Bio, Nature & Agricultural | 14 | 10.8% |
| Physical & Health Sciences | 2 | 1.5% |
| Psychology | 2 | 1.5% |
| Social Sciences | 8 | 6.1% |
| Engineering | 10 | 7.7% |
| Multidisciplinary Studies | 0 | 0.0% |
| Science & Technology | 14 | 10.8% |
| Business | 23 | 17.7% |
| Education | 21 | 16.2% |
| Literature & Languages | 0 | 0.0% |
| Liberal Arts & History | 12 | 9.2% |
| Visual & Performing Arts | 5 | 3.8% |
| Communications | 3 | 2.3% |
| Arts & Humanities | 13 | 10.0% |
| Total | 130 | 100.0% |
Transportation & Commute in Balsam Lake
Vehicle Availability by Sex in Balsam Lake
The most prevalent vehicle ownership categories in Balsam Lake are males with 2 vehicles (56, accounting for 29.6%) and females with 2 vehicles (39, making up 41.5%).
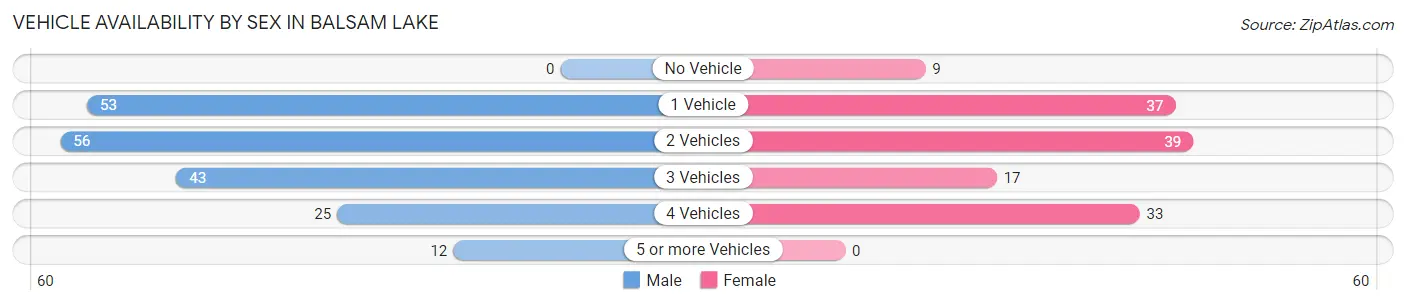
| Vehicles Available | Male | Female |
| No Vehicle | 0 (0.0%) | 9 (6.7%) |
| 1 Vehicle | 53 (28.0%) | 37 (27.4%) |
| 2 Vehicles | 56 (29.6%) | 39 (28.9%) |
| 3 Vehicles | 43 (22.8%) | 17 (12.6%) |
| 4 Vehicles | 25 (13.2%) | 33 (24.4%) |
| 5 or more Vehicles | 12 (6.4%) | 0 (0.0%) |
| Total | 189 (100.0%) | 135 (100.0%) |
Commute Time in Balsam Lake
The most frequently occuring commute durations in Balsam Lake are 15 to 19 minutes (43 commuters, 14.4%), less than 5 minutes (41 commuters, 13.8%), and 30 to 34 minutes (40 commuters, 13.4%).
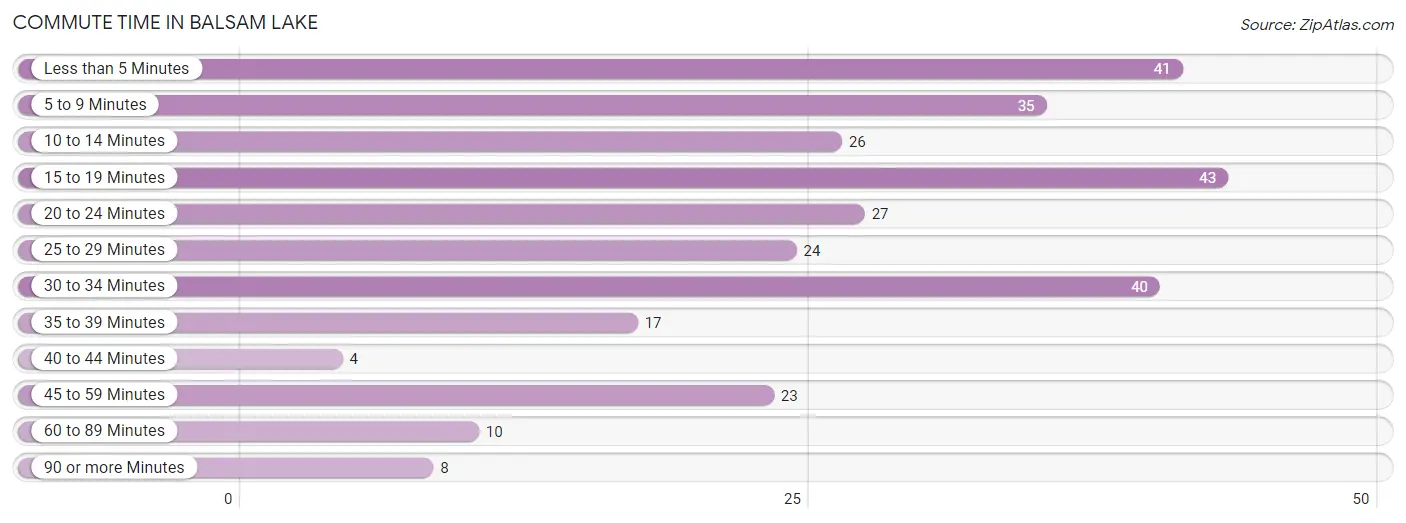
| Commute Time | # Commuters | % Commuters |
| Less than 5 Minutes | 41 | 13.8% |
| 5 to 9 Minutes | 35 | 11.7% |
| 10 to 14 Minutes | 26 | 8.7% |
| 15 to 19 Minutes | 43 | 14.4% |
| 20 to 24 Minutes | 27 | 9.1% |
| 25 to 29 Minutes | 24 | 8.1% |
| 30 to 34 Minutes | 40 | 13.4% |
| 35 to 39 Minutes | 17 | 5.7% |
| 40 to 44 Minutes | 4 | 1.3% |
| 45 to 59 Minutes | 23 | 7.7% |
| 60 to 89 Minutes | 10 | 3.4% |
| 90 or more Minutes | 8 | 2.7% |
Commute Time by Sex in Balsam Lake
The most common commute times in Balsam Lake are less than 5 minutes (26 commuters, 14.3%) for males and 15 to 19 minutes (30 commuters, 25.9%) for females.
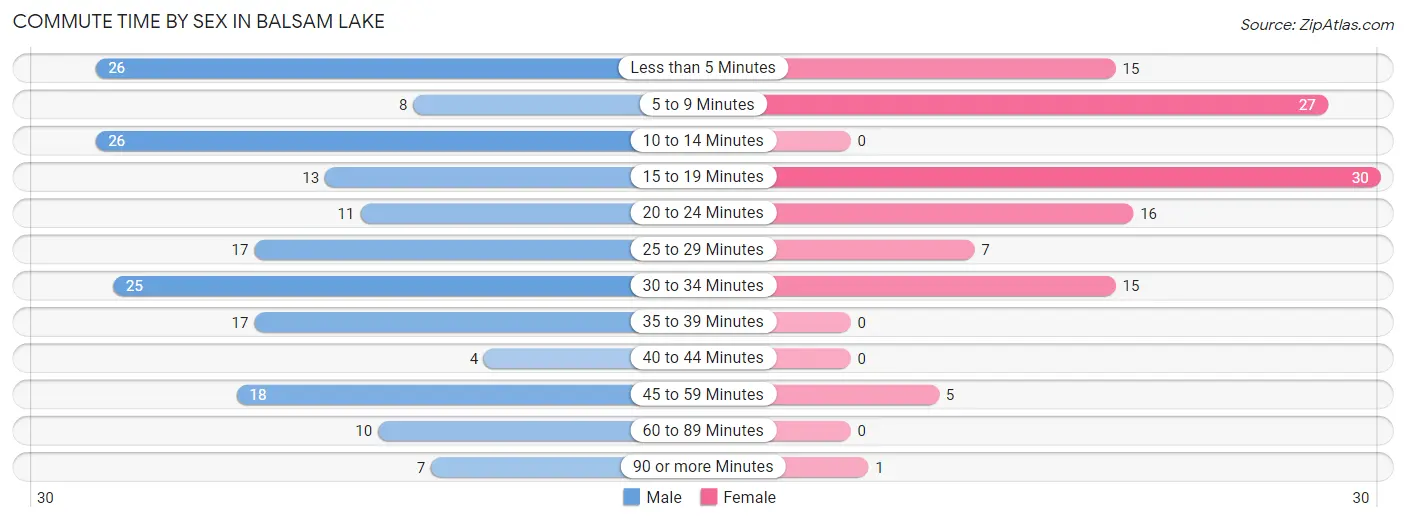
| Commute Time | Male | Female |
| Less than 5 Minutes | 26 (14.3%) | 15 (12.9%) |
| 5 to 9 Minutes | 8 (4.4%) | 27 (23.3%) |
| 10 to 14 Minutes | 26 (14.3%) | 0 (0.0%) |
| 15 to 19 Minutes | 13 (7.1%) | 30 (25.9%) |
| 20 to 24 Minutes | 11 (6.0%) | 16 (13.8%) |
| 25 to 29 Minutes | 17 (9.3%) | 7 (6.0%) |
| 30 to 34 Minutes | 25 (13.7%) | 15 (12.9%) |
| 35 to 39 Minutes | 17 (9.3%) | 0 (0.0%) |
| 40 to 44 Minutes | 4 (2.2%) | 0 (0.0%) |
| 45 to 59 Minutes | 18 (9.9%) | 5 (4.3%) |
| 60 to 89 Minutes | 10 (5.5%) | 0 (0.0%) |
| 90 or more Minutes | 7 (3.8%) | 1 (0.9%) |
Time of Departure to Work by Sex in Balsam Lake
The most frequent times of departure to work in Balsam Lake are 10:00 AM to 10:59 AM (21, 11.5%) for males and 7:30 AM to 7:59 AM (27, 23.3%) for females.
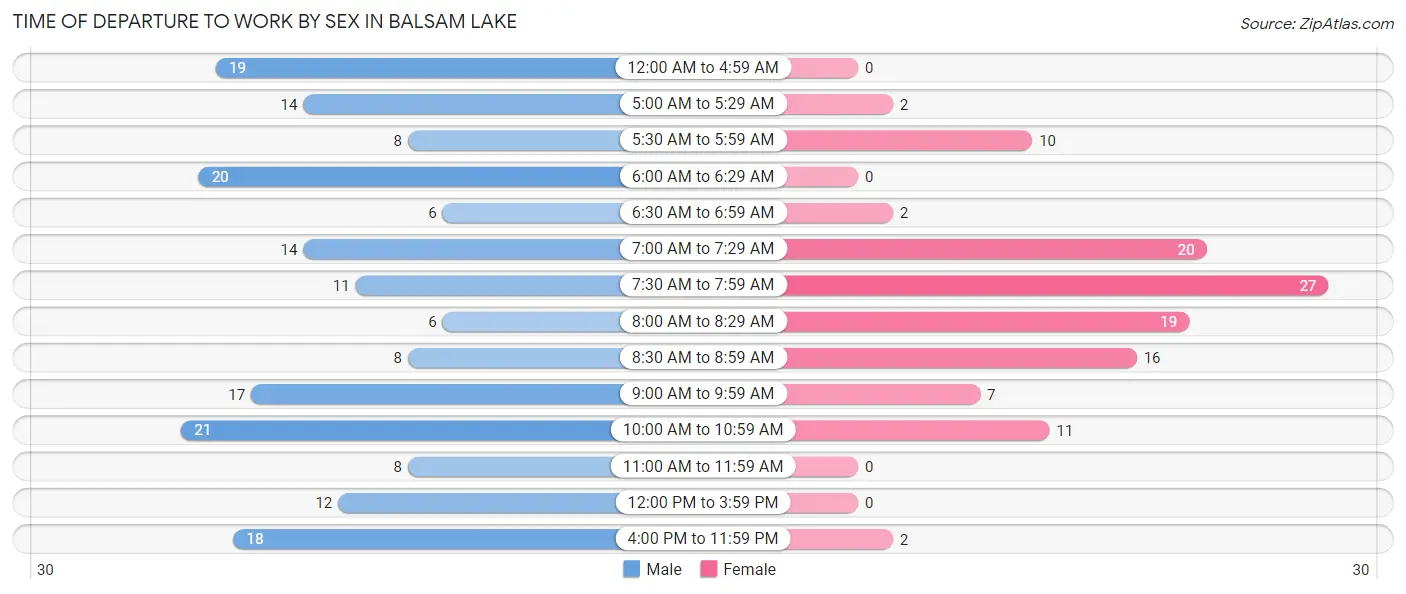
| Time of Departure | Male | Female |
| 12:00 AM to 4:59 AM | 19 (10.4%) | 0 (0.0%) |
| 5:00 AM to 5:29 AM | 14 (7.7%) | 2 (1.7%) |
| 5:30 AM to 5:59 AM | 8 (4.4%) | 10 (8.6%) |
| 6:00 AM to 6:29 AM | 20 (11.0%) | 0 (0.0%) |
| 6:30 AM to 6:59 AM | 6 (3.3%) | 2 (1.7%) |
| 7:00 AM to 7:29 AM | 14 (7.7%) | 20 (17.2%) |
| 7:30 AM to 7:59 AM | 11 (6.0%) | 27 (23.3%) |
| 8:00 AM to 8:29 AM | 6 (3.3%) | 19 (16.4%) |
| 8:30 AM to 8:59 AM | 8 (4.4%) | 16 (13.8%) |
| 9:00 AM to 9:59 AM | 17 (9.3%) | 7 (6.0%) |
| 10:00 AM to 10:59 AM | 21 (11.5%) | 11 (9.5%) |
| 11:00 AM to 11:59 AM | 8 (4.4%) | 0 (0.0%) |
| 12:00 PM to 3:59 PM | 12 (6.6%) | 0 (0.0%) |
| 4:00 PM to 11:59 PM | 18 (9.9%) | 2 (1.7%) |
| Total | 182 (100.0%) | 116 (100.0%) |
Housing Occupancy in Balsam Lake
Occupancy by Ownership in Balsam Lake
Of the total 378 dwellings in Balsam Lake, owner-occupied units account for 285 (75.4%), while renter-occupied units make up 93 (24.6%).
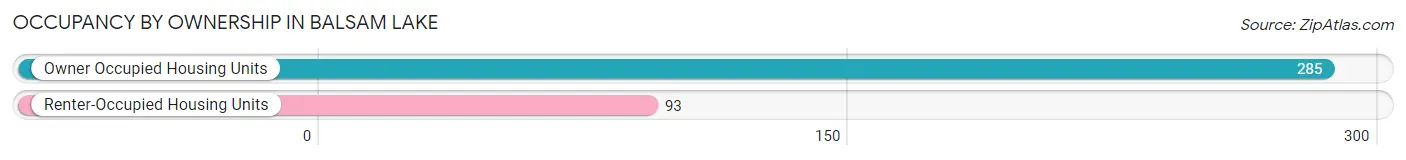
| Occupancy | # Housing Units | % Housing Units |
| Owner Occupied Housing Units | 285 | 75.4% |
| Renter-Occupied Housing Units | 93 | 24.6% |
| Total Occupied Housing Units | 378 | 100.0% |
Occupancy by Household Size in Balsam Lake
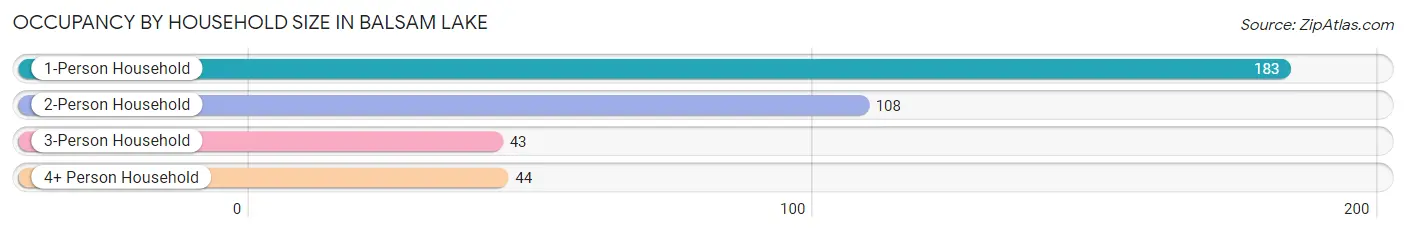
| Household Size | # Housing Units | % Housing Units |
| 1-Person Household | 183 | 48.4% |
| 2-Person Household | 108 | 28.6% |
| 3-Person Household | 43 | 11.4% |
| 4+ Person Household | 44 | 11.6% |
| Total Housing Units | 378 | 100.0% |
Occupancy by Ownership by Household Size in Balsam Lake
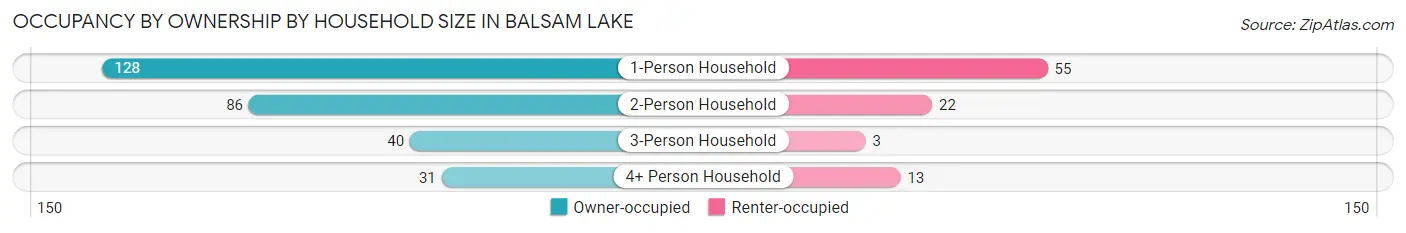
| Household Size | Owner-occupied | Renter-occupied |
| 1-Person Household | 128 (70.0%) | 55 (30.0%) |
| 2-Person Household | 86 (79.6%) | 22 (20.4%) |
| 3-Person Household | 40 (93.0%) | 3 (7.0%) |
| 4+ Person Household | 31 (70.5%) | 13 (29.5%) |
| Total Housing Units | 285 (75.4%) | 93 (24.6%) |
Occupancy by Educational Attainment in Balsam Lake
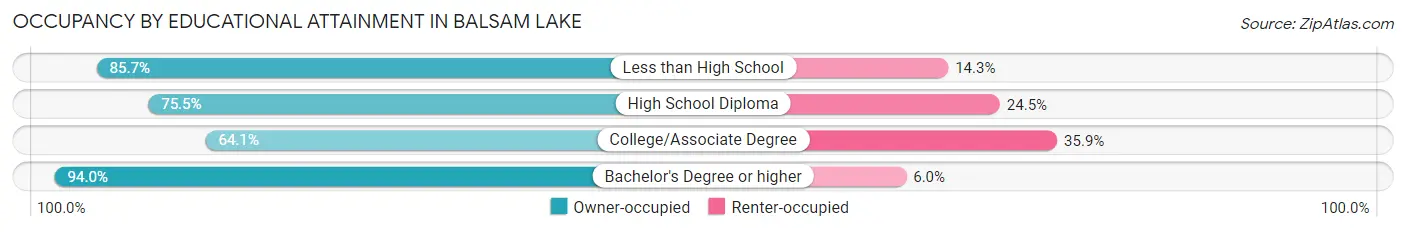
| Household Size | Owner-occupied | Renter-occupied |
| Less than High School | 18 (85.7%) | 3 (14.3%) |
| High School Diploma | 120 (75.5%) | 39 (24.5%) |
| College/Associate Degree | 84 (64.1%) | 47 (35.9%) |
| Bachelor's Degree or higher | 63 (94.0%) | 4 (6.0%) |
Occupancy by Age of Householder in Balsam Lake
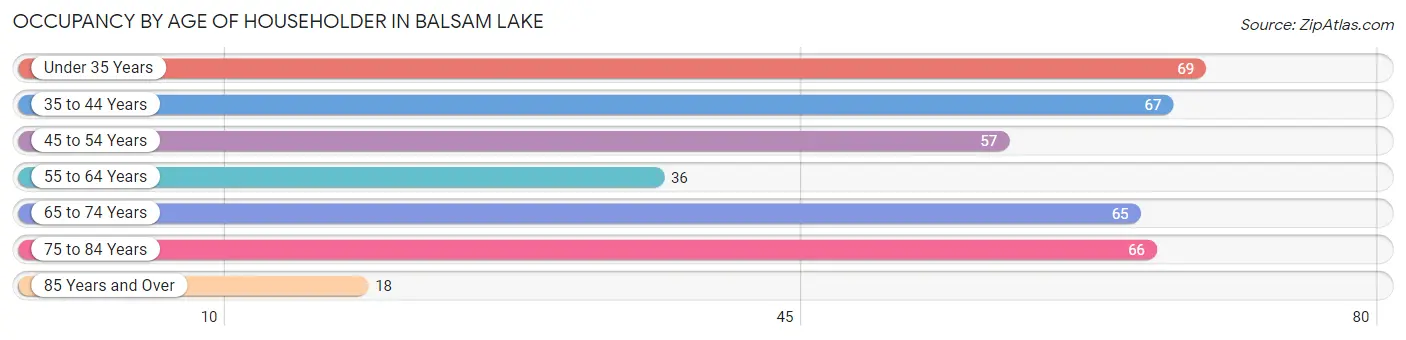
| Age Bracket | # Households | % Households |
| Under 35 Years | 69 | 18.2% |
| 35 to 44 Years | 67 | 17.7% |
| 45 to 54 Years | 57 | 15.1% |
| 55 to 64 Years | 36 | 9.5% |
| 65 to 74 Years | 65 | 17.2% |
| 75 to 84 Years | 66 | 17.5% |
| 85 Years and Over | 18 | 4.8% |
| Total | 378 | 100.0% |
Housing Finances in Balsam Lake
Median Income by Occupancy in Balsam Lake
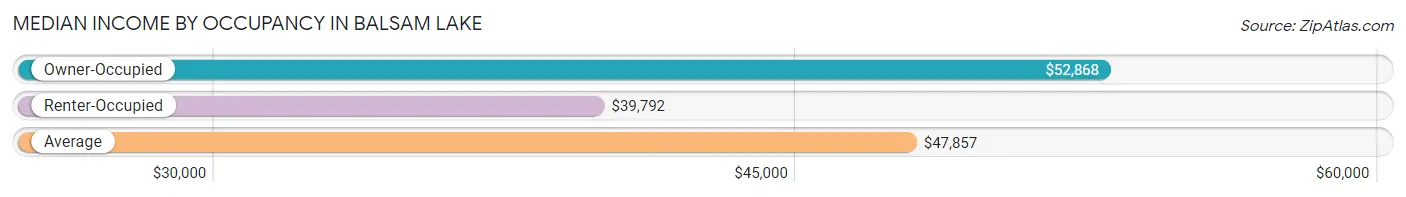
| Occupancy Type | # Households | Median Income |
| Owner-Occupied | 285 (75.4%) | $52,868 |
| Renter-Occupied | 93 (24.6%) | $39,792 |
| Average | 378 (100.0%) | $47,857 |
Occupancy by Householder Income Bracket in Balsam Lake
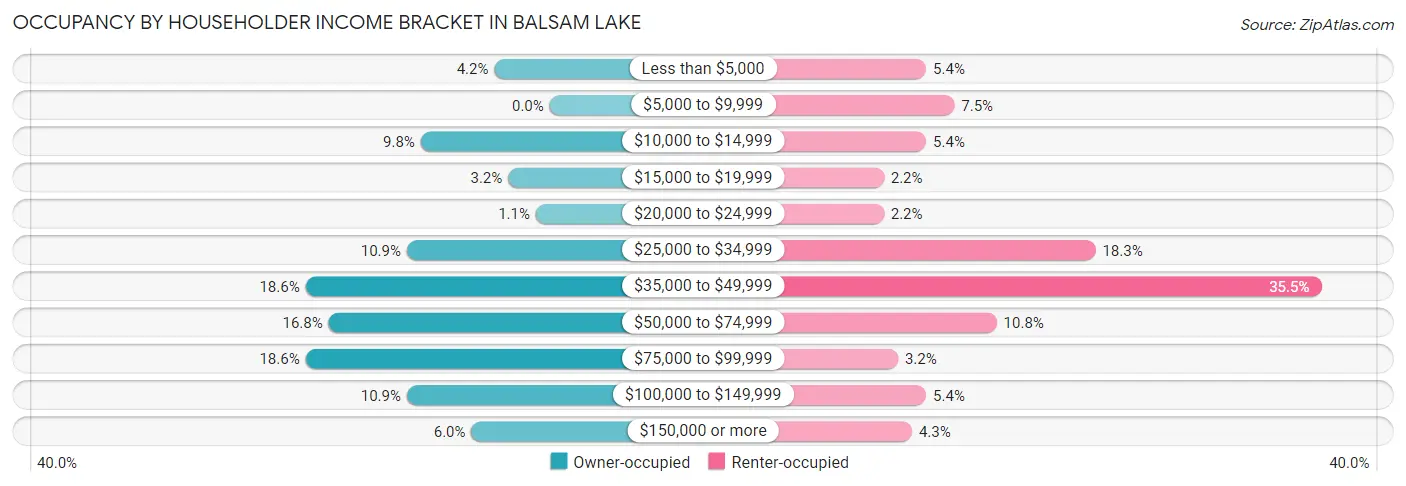
| Income Bracket | Owner-occupied | Renter-occupied |
| Less than $5,000 | 12 (4.2%) | 5 (5.4%) |
| $5,000 to $9,999 | 0 (0.0%) | 7 (7.5%) |
| $10,000 to $14,999 | 28 (9.8%) | 5 (5.4%) |
| $15,000 to $19,999 | 9 (3.2%) | 2 (2.1%) |
| $20,000 to $24,999 | 3 (1.1%) | 2 (2.1%) |
| $25,000 to $34,999 | 31 (10.9%) | 17 (18.3%) |
| $35,000 to $49,999 | 53 (18.6%) | 33 (35.5%) |
| $50,000 to $74,999 | 48 (16.8%) | 10 (10.7%) |
| $75,000 to $99,999 | 53 (18.6%) | 3 (3.2%) |
| $100,000 to $149,999 | 31 (10.9%) | 5 (5.4%) |
| $150,000 or more | 17 (6.0%) | 4 (4.3%) |
| Total | 285 (100.0%) | 93 (100.0%) |
Monthly Housing Cost Tiers in Balsam Lake
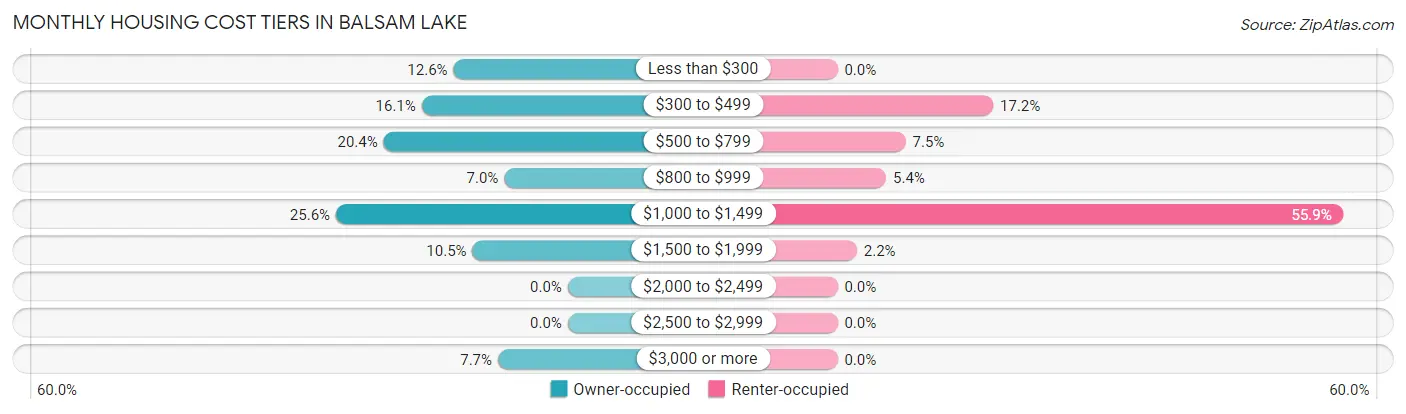
| Monthly Cost | Owner-occupied | Renter-occupied |
| Less than $300 | 36 (12.6%) | 0 (0.0%) |
| $300 to $499 | 46 (16.1%) | 16 (17.2%) |
| $500 to $799 | 58 (20.3%) | 7 (7.5%) |
| $800 to $999 | 20 (7.0%) | 5 (5.4%) |
| $1,000 to $1,499 | 73 (25.6%) | 52 (55.9%) |
| $1,500 to $1,999 | 30 (10.5%) | 2 (2.1%) |
| $2,000 to $2,499 | 0 (0.0%) | 0 (0.0%) |
| $2,500 to $2,999 | 0 (0.0%) | 0 (0.0%) |
| $3,000 or more | 22 (7.7%) | 0 (0.0%) |
| Total | 285 (100.0%) | 93 (100.0%) |
Physical Housing Characteristics in Balsam Lake
Housing Structures in Balsam Lake
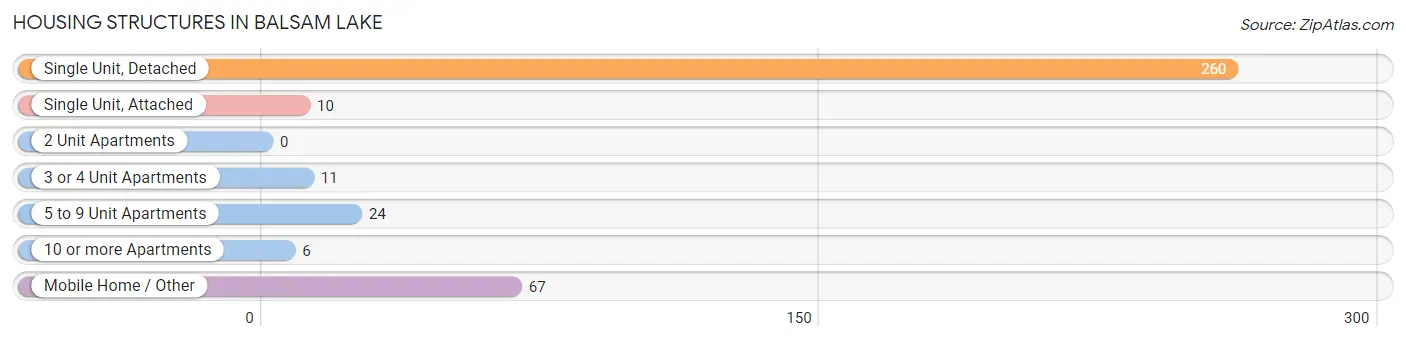
| Structure Type | # Housing Units | % Housing Units |
| Single Unit, Detached | 260 | 68.8% |
| Single Unit, Attached | 10 | 2.6% |
| 2 Unit Apartments | 0 | 0.0% |
| 3 or 4 Unit Apartments | 11 | 2.9% |
| 5 to 9 Unit Apartments | 24 | 6.4% |
| 10 or more Apartments | 6 | 1.6% |
| Mobile Home / Other | 67 | 17.7% |
| Total | 378 | 100.0% |
Housing Structures by Occupancy in Balsam Lake
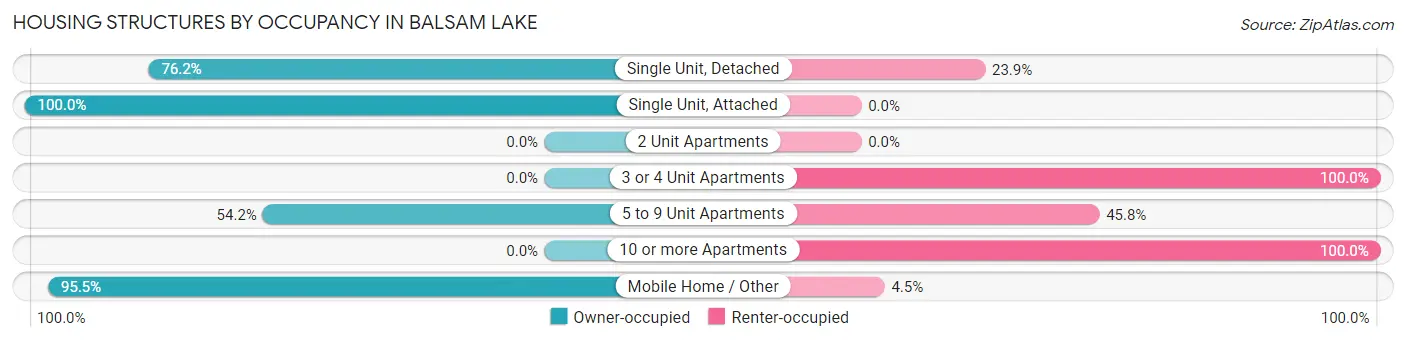
| Structure Type | Owner-occupied | Renter-occupied |
| Single Unit, Detached | 198 (76.1%) | 62 (23.8%) |
| Single Unit, Attached | 10 (100.0%) | 0 (0.0%) |
| 2 Unit Apartments | 0 (0.0%) | 0 (0.0%) |
| 3 or 4 Unit Apartments | 0 (0.0%) | 11 (100.0%) |
| 5 to 9 Unit Apartments | 13 (54.2%) | 11 (45.8%) |
| 10 or more Apartments | 0 (0.0%) | 6 (100.0%) |
| Mobile Home / Other | 64 (95.5%) | 3 (4.5%) |
| Total | 285 (75.4%) | 93 (24.6%) |
Housing Structures by Number of Rooms in Balsam Lake
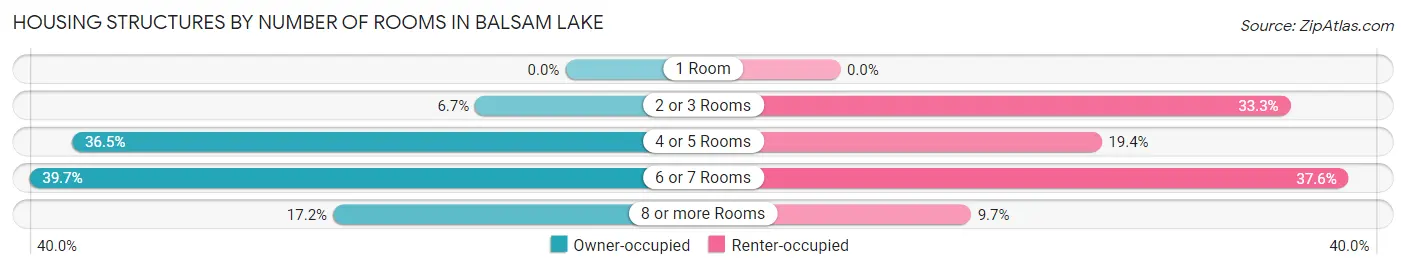
| Number of Rooms | Owner-occupied | Renter-occupied |
| 1 Room | 0 (0.0%) | 0 (0.0%) |
| 2 or 3 Rooms | 19 (6.7%) | 31 (33.3%) |
| 4 or 5 Rooms | 104 (36.5%) | 18 (19.4%) |
| 6 or 7 Rooms | 113 (39.7%) | 35 (37.6%) |
| 8 or more Rooms | 49 (17.2%) | 9 (9.7%) |
| Total | 285 (100.0%) | 93 (100.0%) |
Housing Structure by Heating Type in Balsam Lake
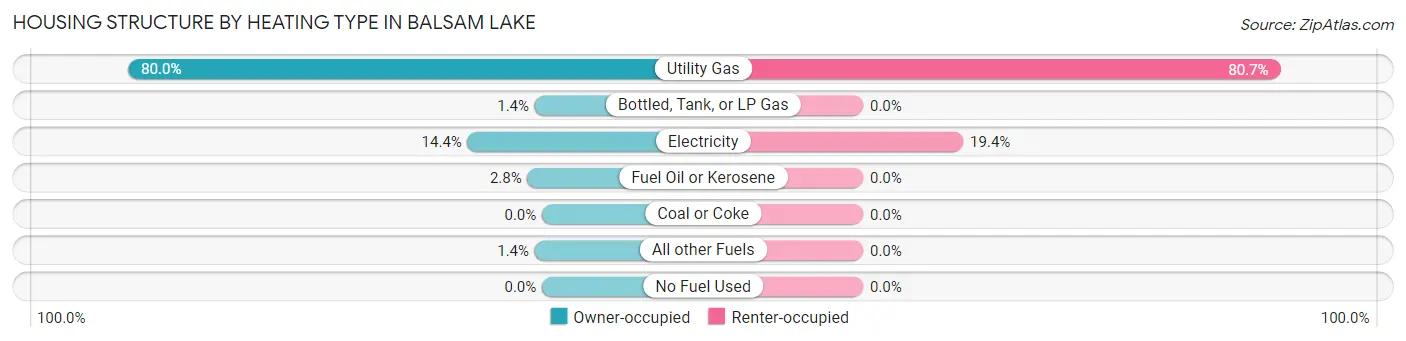
| Heating Type | Owner-occupied | Renter-occupied |
| Utility Gas | 228 (80.0%) | 75 (80.6%) |
| Bottled, Tank, or LP Gas | 4 (1.4%) | 0 (0.0%) |
| Electricity | 41 (14.4%) | 18 (19.4%) |
| Fuel Oil or Kerosene | 8 (2.8%) | 0 (0.0%) |
| Coal or Coke | 0 (0.0%) | 0 (0.0%) |
| All other Fuels | 4 (1.4%) | 0 (0.0%) |
| No Fuel Used | 0 (0.0%) | 0 (0.0%) |
| Total | 285 (100.0%) | 93 (100.0%) |
Household Vehicle Usage in Balsam Lake
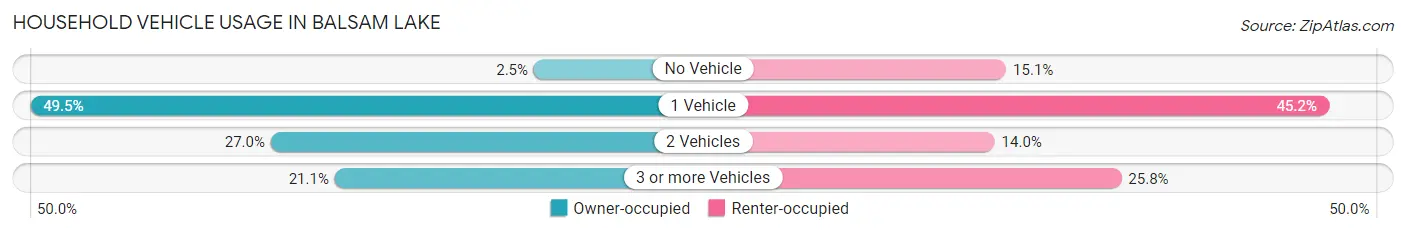
| Vehicles per Household | Owner-occupied | Renter-occupied |
| No Vehicle | 7 (2.5%) | 14 (15.0%) |
| 1 Vehicle | 141 (49.5%) | 42 (45.2%) |
| 2 Vehicles | 77 (27.0%) | 13 (14.0%) |
| 3 or more Vehicles | 60 (21.0%) | 24 (25.8%) |
| Total | 285 (100.0%) | 93 (100.0%) |
Real Estate & Mortgages in Balsam Lake
Real Estate and Mortgage Overview in Balsam Lake
| Characteristic | Without Mortgage | With Mortgage |
| Housing Units | 168 | 117 |
| Median Property Value | $140,000 | $212,500 |
| Median Household Income | $40,250 | $11 |
| Monthly Housing Costs | $513 | $19 |
| Real Estate Taxes | $2,021 | $0 |
Property Value by Mortgage Status in Balsam Lake
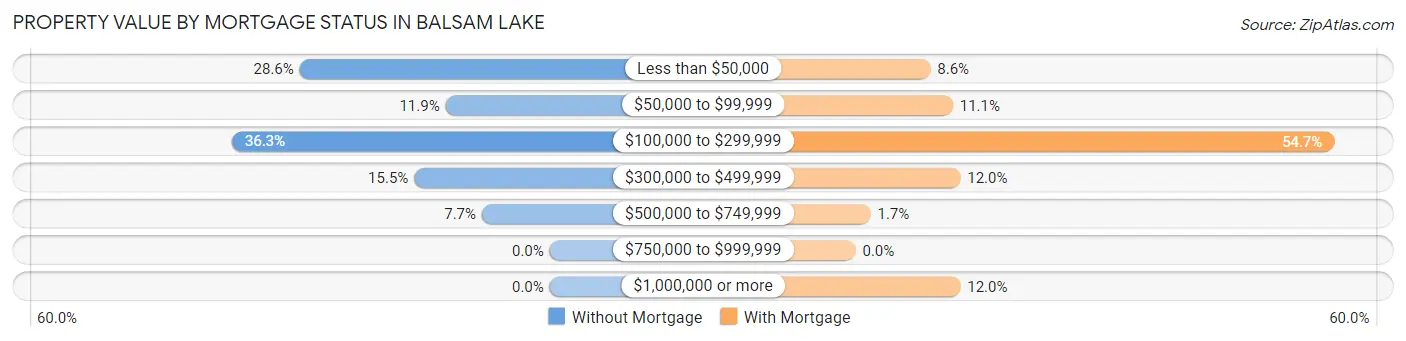
| Property Value | Without Mortgage | With Mortgage |
| Less than $50,000 | 48 (28.6%) | 10 (8.6%) |
| $50,000 to $99,999 | 20 (11.9%) | 13 (11.1%) |
| $100,000 to $299,999 | 61 (36.3%) | 64 (54.7%) |
| $300,000 to $499,999 | 26 (15.5%) | 14 (12.0%) |
| $500,000 to $749,999 | 13 (7.7%) | 2 (1.7%) |
| $750,000 to $999,999 | 0 (0.0%) | 0 (0.0%) |
| $1,000,000 or more | 0 (0.0%) | 14 (12.0%) |
| Total | 168 (100.0%) | 117 (100.0%) |
Household Income by Mortgage Status in Balsam Lake
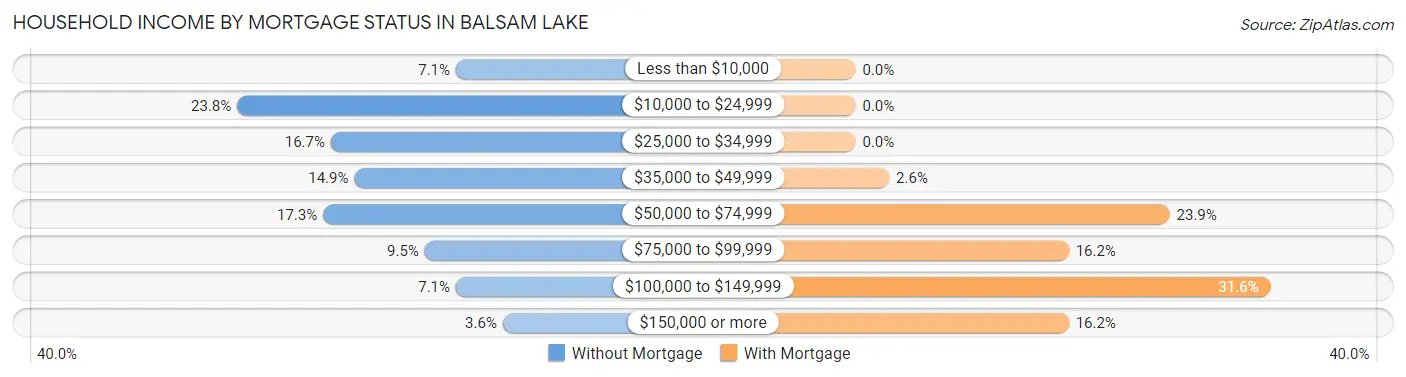
| Household Income | Without Mortgage | With Mortgage |
| Less than $10,000 | 12 (7.1%) | 0 (0.0%) |
| $10,000 to $24,999 | 40 (23.8%) | 0 (0.0%) |
| $25,000 to $34,999 | 28 (16.7%) | 0 (0.0%) |
| $35,000 to $49,999 | 25 (14.9%) | 3 (2.6%) |
| $50,000 to $74,999 | 29 (17.3%) | 28 (23.9%) |
| $75,000 to $99,999 | 16 (9.5%) | 19 (16.2%) |
| $100,000 to $149,999 | 12 (7.1%) | 37 (31.6%) |
| $150,000 or more | 6 (3.6%) | 19 (16.2%) |
| Total | 168 (100.0%) | 117 (100.0%) |
Property Value to Household Income Ratio in Balsam Lake
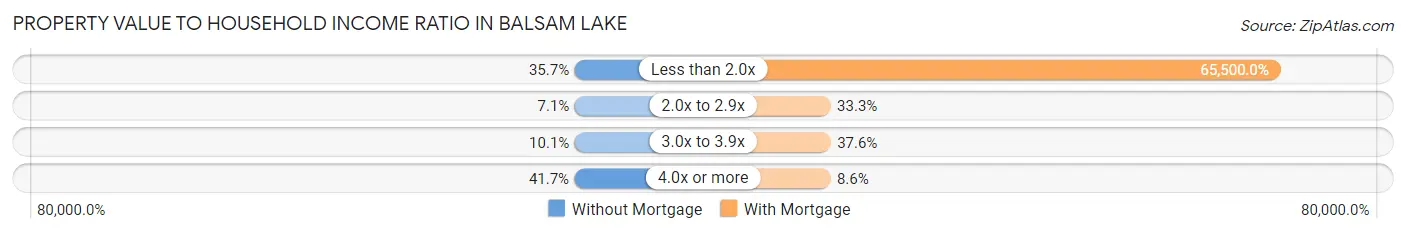
| Value-to-Income Ratio | Without Mortgage | With Mortgage |
| Less than 2.0x | 60 (35.7%) | 76,635 (65,500.0%) |
| 2.0x to 2.9x | 12 (7.1%) | 39 (33.3%) |
| 3.0x to 3.9x | 17 (10.1%) | 44 (37.6%) |
| 4.0x or more | 70 (41.7%) | 10 (8.6%) |
| Total | 168 (100.0%) | 117 (100.0%) |
Real Estate Taxes by Mortgage Status in Balsam Lake
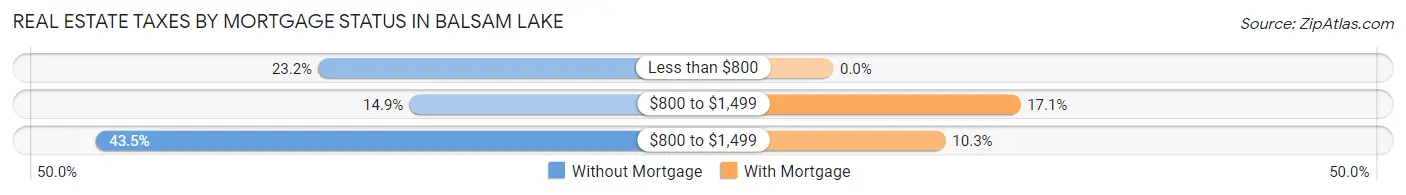
| Property Taxes | Without Mortgage | With Mortgage |
| Less than $800 | 39 (23.2%) | 0 (0.0%) |
| $800 to $1,499 | 25 (14.9%) | 20 (17.1%) |
| $800 to $1,499 | 73 (43.4%) | 12 (10.3%) |
| Total | 168 (100.0%) | 117 (100.0%) |
Health & Disability in Balsam Lake
Health Insurance Coverage by Age in Balsam Lake
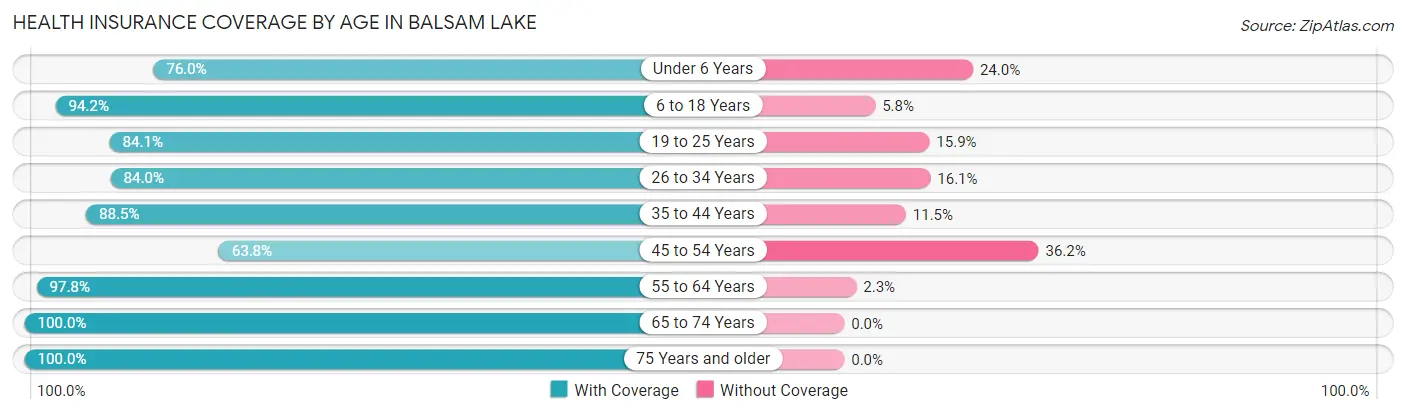
| Age Bracket | With Coverage | Without Coverage |
| Under 6 Years | 19 (76.0%) | 6 (24.0%) |
| 6 to 18 Years | 98 (94.2%) | 6 (5.8%) |
| 19 to 25 Years | 53 (84.1%) | 10 (15.9%) |
| 26 to 34 Years | 68 (84.0%) | 13 (16.1%) |
| 35 to 44 Years | 108 (88.5%) | 14 (11.5%) |
| 45 to 54 Years | 44 (63.8%) | 25 (36.2%) |
| 55 to 64 Years | 87 (97.8%) | 2 (2.2%) |
| 65 to 74 Years | 92 (100.0%) | 0 (0.0%) |
| 75 Years and older | 131 (100.0%) | 0 (0.0%) |
| Total | 700 (90.2%) | 76 (9.8%) |
Health Insurance Coverage by Citizenship Status in Balsam Lake
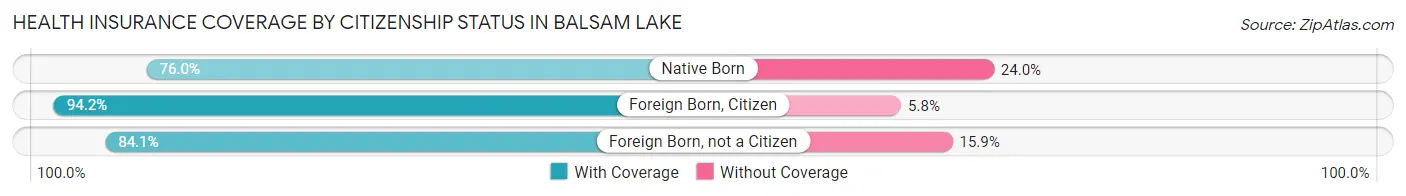
| Citizenship Status | With Coverage | Without Coverage |
| Native Born | 19 (76.0%) | 6 (24.0%) |
| Foreign Born, Citizen | 98 (94.2%) | 6 (5.8%) |
| Foreign Born, not a Citizen | 53 (84.1%) | 10 (15.9%) |
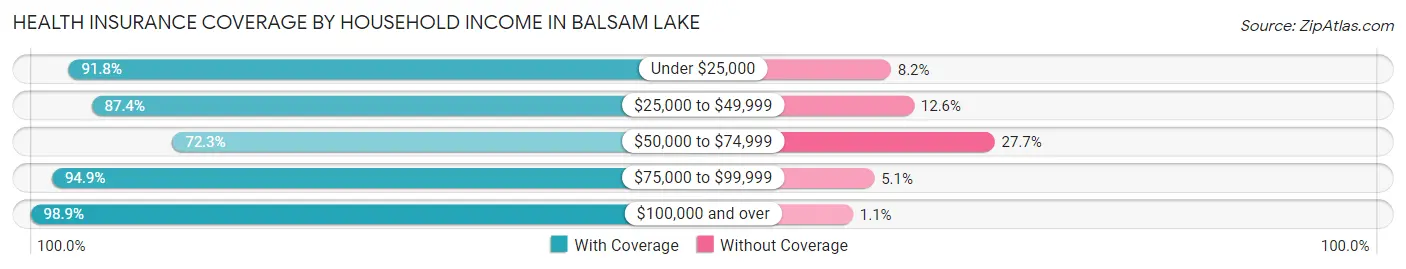
Health Insurance Coverage by Household Income in Balsam Lake
| Household Income | With Coverage | Without Coverage |
| Under $25,000 | 78 (91.8%) | 7 (8.2%) |
| $25,000 to $49,999 | 188 (87.4%) | 27 (12.6%) |
| $50,000 to $74,999 | 81 (72.3%) | 31 (27.7%) |
| $75,000 to $99,999 | 166 (94.9%) | 9 (5.1%) |
| $100,000 and over | 173 (98.9%) | 2 (1.1%) |
Public vs Private Health Insurance Coverage by Age in Balsam Lake

| Age Bracket | Public Insurance | Private Insurance |
| Under 6 | 13 (52.0%) | 6 (24.0%) |
| 6 to 18 Years | 39 (37.5%) | 67 (64.4%) |
| 19 to 25 Years | 10 (15.9%) | 49 (77.8%) |
| 25 to 34 Years | 12 (14.8%) | 56 (69.1%) |
| 35 to 44 Years | 34 (27.9%) | 79 (64.7%) |
| 45 to 54 Years | 20 (29.0%) | 24 (34.8%) |
| 55 to 64 Years | 23 (25.8%) | 69 (77.5%) |
| 65 to 74 Years | 92 (100.0%) | 69 (75.0%) |
| 75 Years and over | 131 (100.0%) | 112 (85.5%) |
| Total | 374 (48.2%) | 531 (68.4%) |
Disability Status by Sex by Age in Balsam Lake
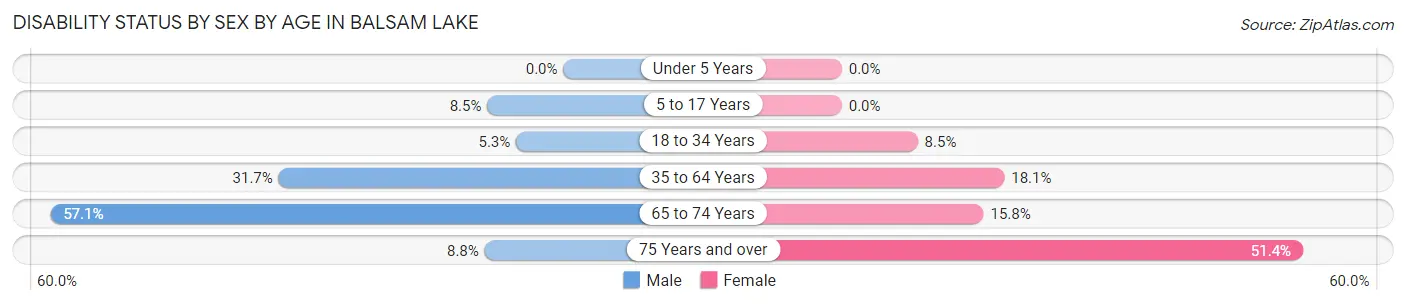
| Age Bracket | Male | Female |
| Under 5 Years | 0 (0.0%) | 0 (0.0%) |
| 5 to 17 Years | 5 (8.5%) | 0 (0.0%) |
| 18 to 34 Years | 4 (5.3%) | 6 (8.5%) |
| 35 to 64 Years | 52 (31.7%) | 21 (18.1%) |
| 65 to 74 Years | 20 (57.1%) | 9 (15.8%) |
| 75 Years and over | 5 (8.8%) | 38 (51.3%) |
Disability Class by Sex by Age in Balsam Lake
Disability Class: Hearing Difficulty
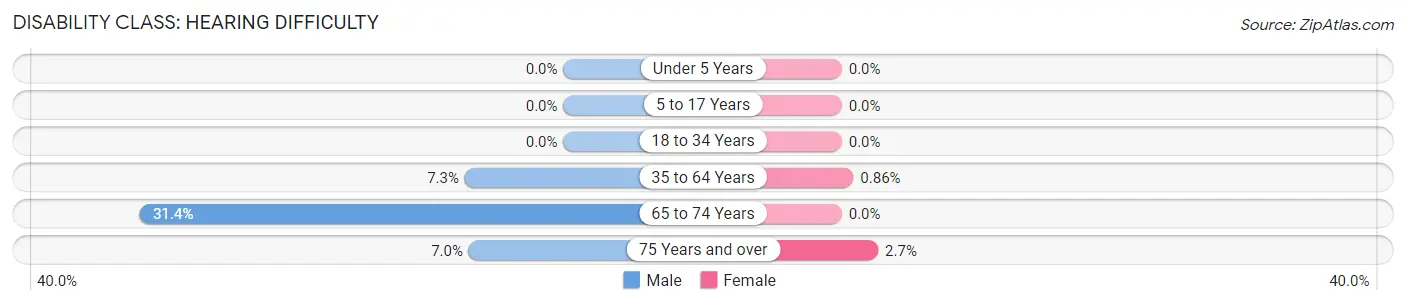
| Age Bracket | Male | Female |
| Under 5 Years | 0 (0.0%) | 0 (0.0%) |
| 5 to 17 Years | 0 (0.0%) | 0 (0.0%) |
| 18 to 34 Years | 0 (0.0%) | 0 (0.0%) |
| 35 to 64 Years | 12 (7.3%) | 1 (0.9%) |
| 65 to 74 Years | 11 (31.4%) | 0 (0.0%) |
| 75 Years and over | 4 (7.0%) | 2 (2.7%) |
Disability Class: Vision Difficulty
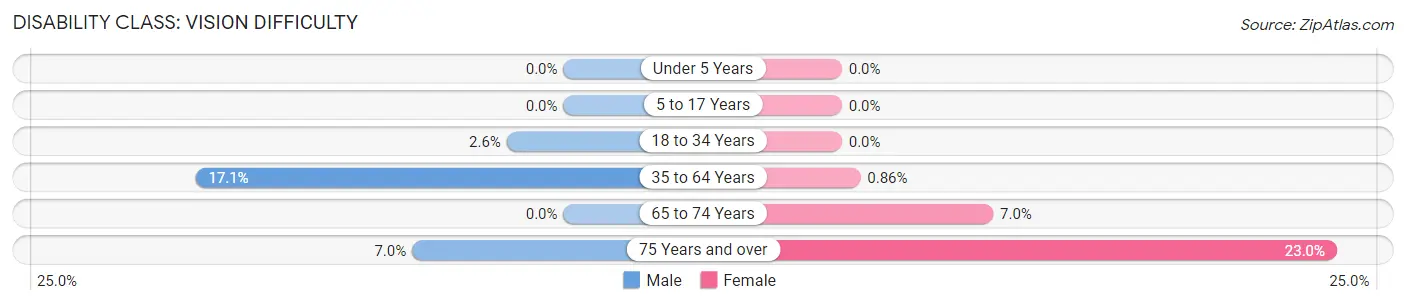
| Age Bracket | Male | Female |
| Under 5 Years | 0 (0.0%) | 0 (0.0%) |
| 5 to 17 Years | 0 (0.0%) | 0 (0.0%) |
| 18 to 34 Years | 2 (2.6%) | 0 (0.0%) |
| 35 to 64 Years | 28 (17.1%) | 1 (0.9%) |
| 65 to 74 Years | 0 (0.0%) | 4 (7.0%) |
| 75 Years and over | 4 (7.0%) | 17 (23.0%) |
Disability Class: Cognitive Difficulty
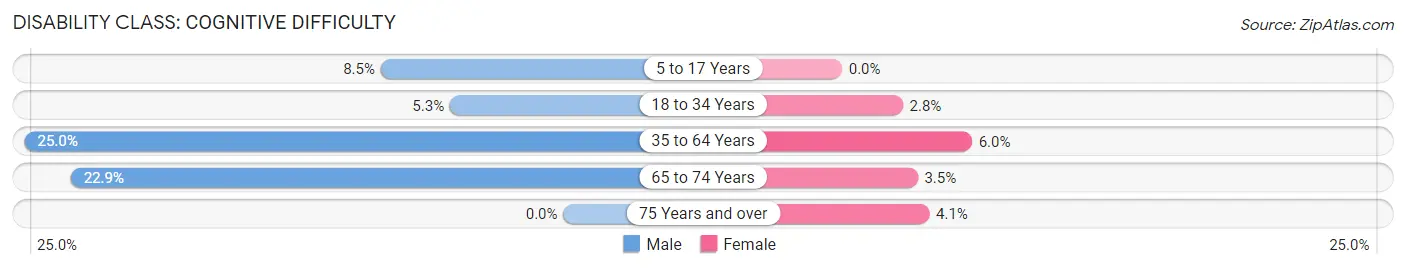
| Age Bracket | Male | Female |
| 5 to 17 Years | 5 (8.5%) | 0 (0.0%) |
| 18 to 34 Years | 4 (5.3%) | 2 (2.8%) |
| 35 to 64 Years | 41 (25.0%) | 7 (6.0%) |
| 65 to 74 Years | 8 (22.9%) | 2 (3.5%) |
| 75 Years and over | 0 (0.0%) | 3 (4.1%) |
Disability Class: Ambulatory Difficulty
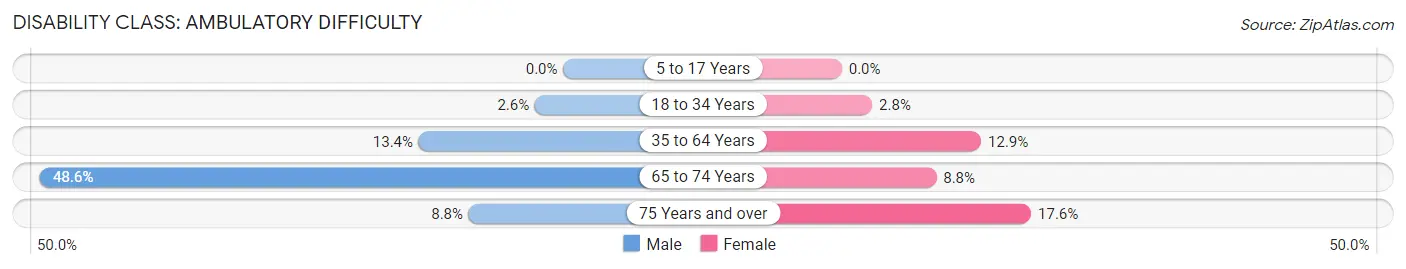
| Age Bracket | Male | Female |
| 5 to 17 Years | 0 (0.0%) | 0 (0.0%) |
| 18 to 34 Years | 2 (2.6%) | 2 (2.8%) |
| 35 to 64 Years | 22 (13.4%) | 15 (12.9%) |
| 65 to 74 Years | 17 (48.6%) | 5 (8.8%) |
| 75 Years and over | 5 (8.8%) | 13 (17.6%) |
Disability Class: Self-Care Difficulty
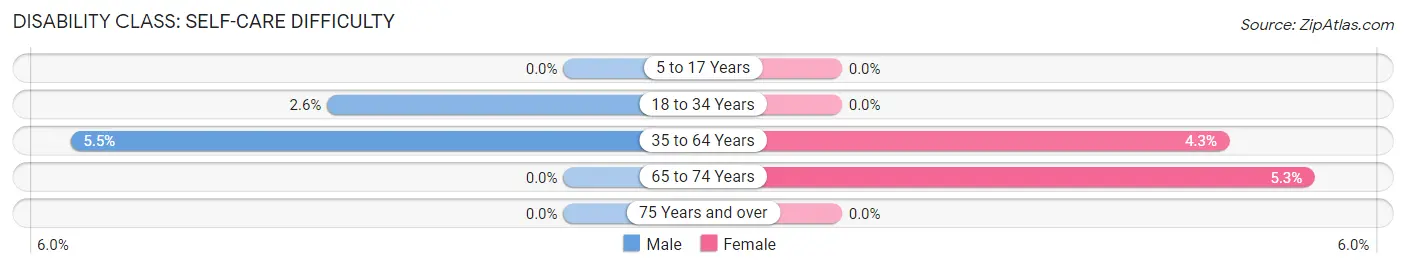
| Age Bracket | Male | Female |
| 5 to 17 Years | 0 (0.0%) | 0 (0.0%) |
| 18 to 34 Years | 2 (2.6%) | 0 (0.0%) |
| 35 to 64 Years | 9 (5.5%) | 5 (4.3%) |
| 65 to 74 Years | 0 (0.0%) | 3 (5.3%) |
| 75 Years and over | 0 (0.0%) | 0 (0.0%) |
Technology Access in Balsam Lake
Computing Device Access in Balsam Lake
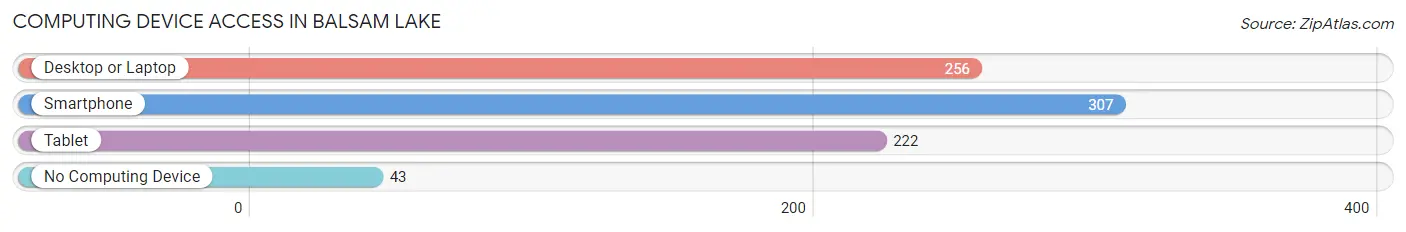
| Device Type | # Households | % Households |
| Desktop or Laptop | 256 | 67.7% |
| Smartphone | 307 | 81.2% |
| Tablet | 222 | 58.7% |
| No Computing Device | 43 | 11.4% |
| Total | 378 | 100.0% |
Internet Access in Balsam Lake
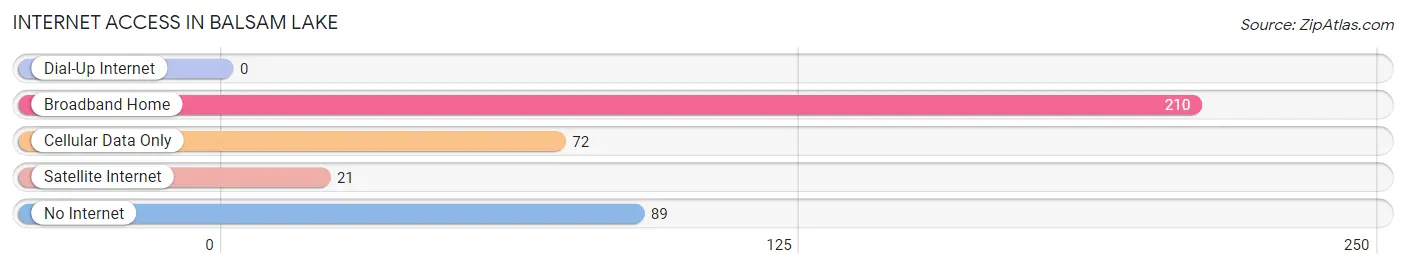
| Internet Type | # Households | % Households |
| Dial-Up Internet | 0 | 0.0% |
| Broadband Home | 210 | 55.6% |
| Cellular Data Only | 72 | 19.1% |
| Satellite Internet | 21 | 5.6% |
| No Internet | 89 | 23.5% |
| Total | 378 | 100.0% |
Balsam Lake Summary
Balsam Lake is a small town located in Polk County, Wisconsin, United States. The population was 1,093 at the 2010 census. It is the county seat of Polk County.
History
The area that is now Balsam Lake was first settled in the 1840s by a group of Norwegian immigrants. The town was originally known as "Balsam" and was later changed to "Balsam Lake" when the lake of the same name was discovered nearby. The town was officially incorporated in 1876.
In the late 19th century, Balsam Lake was a popular tourist destination, with many visitors coming to the area to fish and hunt. The town was also home to a number of resorts, including the Balsam Lake Hotel, which was built in 1887 and is still in operation today.
Geography
Balsam Lake is located at 45 30 25 North 92 25 45 West 45 506944 92 429167
According to the United States Census Bureau, the town has a total area of 1.2 square miles (3.1 km2), all of it land.
Economy
The economy of Balsam Lake is largely based on tourism and agriculture. The town is home to a number of resorts, including the Balsam Lake Hotel, which is still in operation today. The town is also home to a number of farms, which produce a variety of crops, including corn, soybeans, and hay.
Demographics
As of the census of 2000, there were 1,093 people, 441 households, and 287 families residing in the town. The population density was 890.3 people per square mile (344.3/km2). There were 471 housing units at an average density of 382.3 per square mile (147.6/km2). The racial makeup of the town was 98.90% White, 0.09% African American, 0.09% Native American, 0.09% Asian, 0.09% from other races, and 0.73% from two or more races. Hispanic or Latino of any race were 0.37% of the population.
There were 441 households, out of which 28.2% had children under the age of 18 living with them, 54.2% were married couples living together, 8.4% had a female householder with no husband present, and 33.3% were non-families. 28.2% of all households were made up of individuals, and 14.3% had someone living alone who was 65 years of age or older. The average household size was 2.47 and the average family size was 3.04.
In the town, the population was spread out, with 25.2% under the age of 18, 6.7% from 18 to 24, 25.2% from 25 to 44, 24.2% from 45 to 64, and 18.7% who were 65 years of age or older. The median age was 40 years. For every 100 females, there were 97.2 males. For every 100 females age 18 and over, there were 94.2 males.
The median income for a household in the town was $37,500, and the median income for a family was $45,000. Males had a median income of $30,000 versus $21,250 for females. The per capita income for the town was $17,945. About 5.2% of families and 8.2% of the population were below the poverty line, including 8.3% of those under age 18 and 8.3% of those age 65 or over.
Common Questions
What is Per Capita Income in Balsam Lake?
Per Capita income in Balsam Lake is $32,005.
What is the Median Family Income in Balsam Lake?
Median Family Income in Balsam Lake is $64,773.
What is the Median Household income in Balsam Lake?
Median Household Income in Balsam Lake is $47,857.
What is Income or Wage Gap in Balsam Lake?
Income or Wage Gap in Balsam Lake is 24.9%.
Women in Balsam Lake earn 75.1 cents for every dollar earned by a man.
What is Inequality or Gini Index in Balsam Lake?
Inequality or Gini Index in Balsam Lake is 0.44.
What is the Total Population of Balsam Lake?
Total Population of Balsam Lake is 834.
What is the Total Male Population of Balsam Lake?
Total Male Population of Balsam Lake is 455.
What is the Total Female Population of Balsam Lake?
Total Female Population of Balsam Lake is 379.
What is the Ratio of Males per 100 Females in Balsam Lake?
There are 120.05 Males per 100 Females in Balsam Lake.
What is the Ratio of Females per 100 Males in Balsam Lake?
There are 83.30 Females per 100 Males in Balsam Lake.
What is the Median Population Age in Balsam Lake?
Median Population Age in Balsam Lake is 41.7 Years.
What is the Average Family Size in Balsam Lake
Average Family Size in Balsam Lake is 2.8 People.
What is the Average Household Size in Balsam Lake
Average Household Size in Balsam Lake is 2.0 People.
How Large is the Labor Force in Balsam Lake?
There are 357 People in the Labor Forcein in Balsam Lake.
What is the Percentage of People in the Labor Force in Balsam Lake?
49.2% of People are in the Labor Force in Balsam Lake.
What is the Unemployment Rate in Balsam Lake?
Unemployment Rate in Balsam Lake is 7.8%.