Augusta, WI Map & Demographics
Augusta Map
Augusta Overview
$27,388
PER CAPITA INCOME
$65,750
AVG FAMILY INCOME
$50,243
AVG HOUSEHOLD INCOME
19.8%
WAGE / INCOME GAP [ % ]
80.2¢/ $1
WAGE / INCOME GAP [ $ ]
0.44
INEQUALITY / GINI INDEX
1,254
TOTAL POPULATION
595
MALE POPULATION
659
FEMALE POPULATION
90.29
MALES / 100 FEMALES
110.76
FEMALES / 100 MALES
40.1
MEDIAN AGE
3.2
AVG FAMILY SIZE
2.3
AVG HOUSEHOLD SIZE
518
LABOR FORCE [ PEOPLE ]
52.6%
PERCENT IN LABOR FORCE
4.2%
UNEMPLOYMENT RATE
Augusta Zip Codes
Augusta Area Codes
Income in Augusta
Income Overview in Augusta
Per Capita Income in Augusta is $27,388, while median incomes of families and households are $65,750 and $50,243 respectively.
| Characteristic | Number | Measure |
| Per Capita Income | 1,254 | $27,388 |
| Median Family Income | 241 | $65,750 |
| Mean Family Income | 241 | $79,896 |
| Median Household Income | 511 | $50,243 |
| Mean Household Income | 511 | $64,295 |
| Income Deficit | 241 | $0 |
| Wage / Income Gap (%) | 1,254 | 19.77% |
| Wage / Income Gap ($) | 1,254 | 80.23¢ per $1 |
| Gini / Inequality Index | 1,254 | 0.44 |
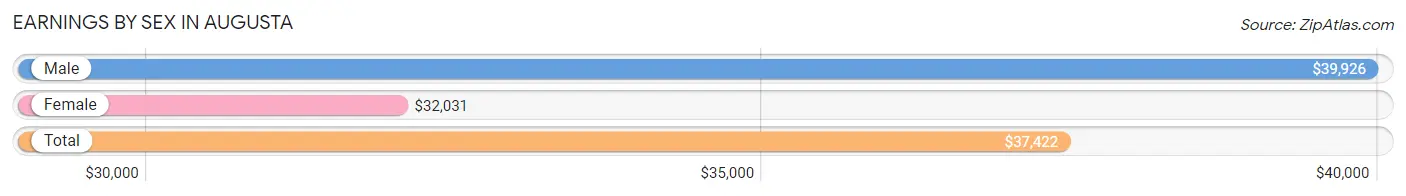
Earnings by Sex in Augusta
Average Earnings in Augusta are $37,422, $39,926 for men and $32,031 for women, a difference of 19.8%.
| Sex | Number | Average Earnings |
| Male | 297 (52.7%) | $39,926 |
| Female | 266 (47.2%) | $32,031 |
| Total | 563 (100.0%) | $37,422 |
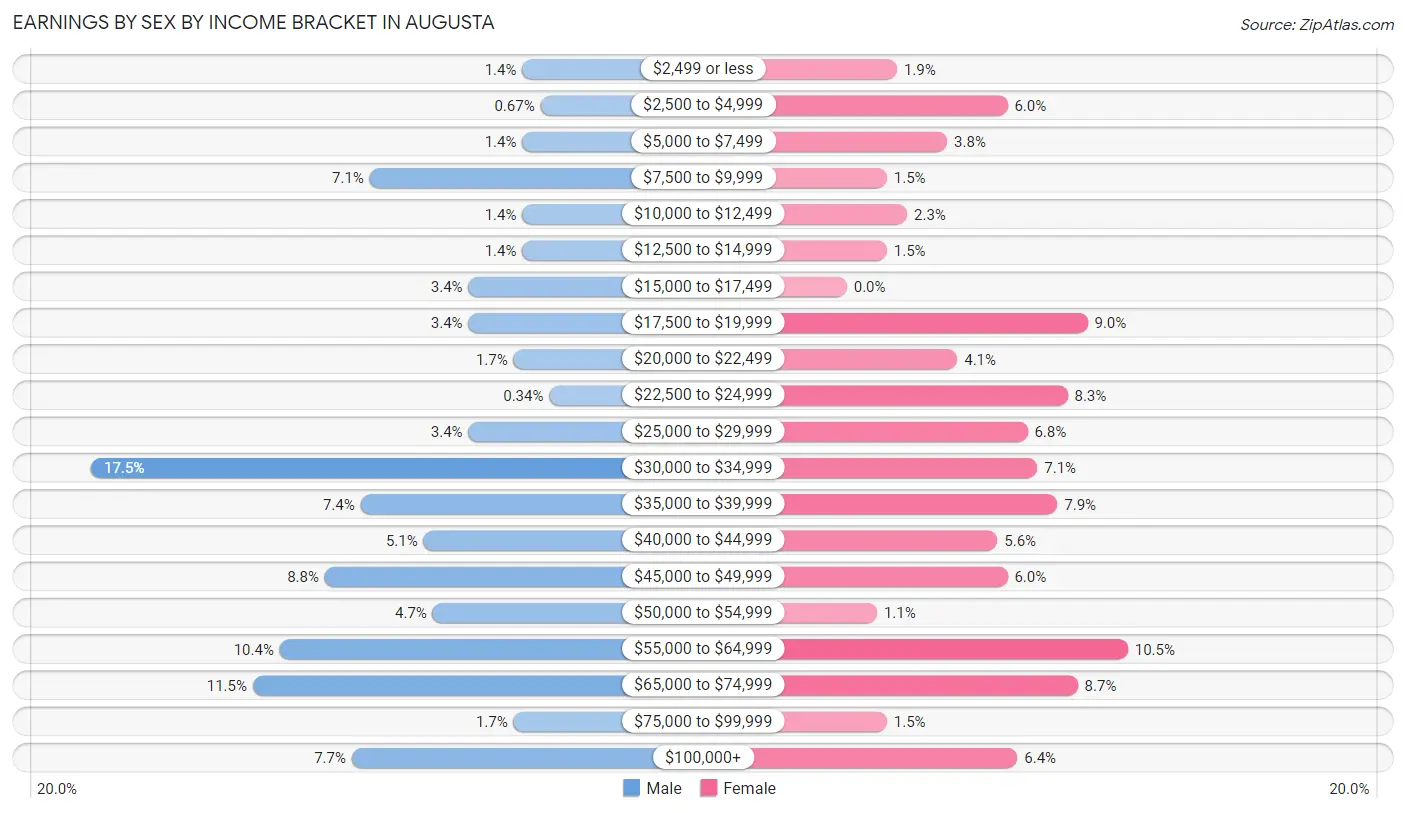
Earnings by Sex by Income Bracket in Augusta
The most common earnings brackets in Augusta are $30,000 to $34,999 for men (52 | 17.5%) and $55,000 to $64,999 for women (28 | 10.5%).
| Income | Male | Female |
| $2,499 or less | 4 (1.3%) | 5 (1.9%) |
| $2,500 to $4,999 | 2 (0.7%) | 16 (6.0%) |
| $5,000 to $7,499 | 4 (1.3%) | 10 (3.8%) |
| $7,500 to $9,999 | 21 (7.1%) | 4 (1.5%) |
| $10,000 to $12,499 | 4 (1.3%) | 6 (2.3%) |
| $12,500 to $14,999 | 4 (1.3%) | 4 (1.5%) |
| $15,000 to $17,499 | 10 (3.4%) | 0 (0.0%) |
| $17,500 to $19,999 | 10 (3.4%) | 24 (9.0%) |
| $20,000 to $22,499 | 5 (1.7%) | 11 (4.1%) |
| $22,500 to $24,999 | 1 (0.3%) | 22 (8.3%) |
| $25,000 to $29,999 | 10 (3.4%) | 18 (6.8%) |
| $30,000 to $34,999 | 52 (17.5%) | 19 (7.1%) |
| $35,000 to $39,999 | 22 (7.4%) | 21 (7.9%) |
| $40,000 to $44,999 | 15 (5.1%) | 15 (5.6%) |
| $45,000 to $49,999 | 26 (8.7%) | 16 (6.0%) |
| $50,000 to $54,999 | 14 (4.7%) | 3 (1.1%) |
| $55,000 to $64,999 | 31 (10.4%) | 28 (10.5%) |
| $65,000 to $74,999 | 34 (11.5%) | 23 (8.6%) |
| $75,000 to $99,999 | 5 (1.7%) | 4 (1.5%) |
| $100,000+ | 23 (7.7%) | 17 (6.4%) |
| Total | 297 (100.0%) | 266 (100.0%) |
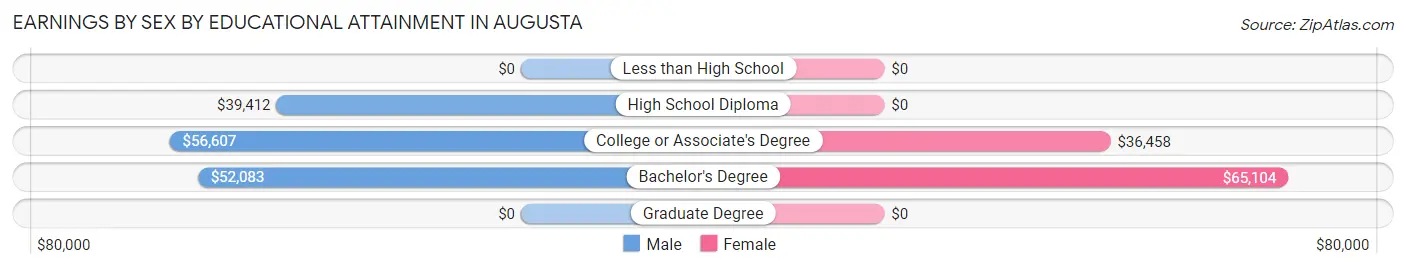
Earnings by Sex by Educational Attainment in Augusta
Average earnings in Augusta are $43,542 for men and $36,023 for women, a difference of 17.3%. Men with an educational attainment of college or associate's degree enjoy the highest average annual earnings of $56,607, while those with high school diploma education earn the least with $39,412. Women with an educational attainment of bachelor's degree earn the most with the average annual earnings of $65,104, while those with college or associate's degree education have the smallest earnings of $36,458.
| Educational Attainment | Male Income | Female Income |
| Less than High School | - | - |
| High School Diploma | $39,412 | $0 |
| College or Associate's Degree | $56,607 | $36,458 |
| Bachelor's Degree | $52,083 | $65,104 |
| Graduate Degree | - | - |
| Total | $43,542 | $36,023 |
Family Income in Augusta
Family Income Brackets in Augusta
According to the Augusta family income data, there are 58 families falling into the $50,000 to $74,999 income range, which is the most common income bracket and makes up 24.1% of all families.
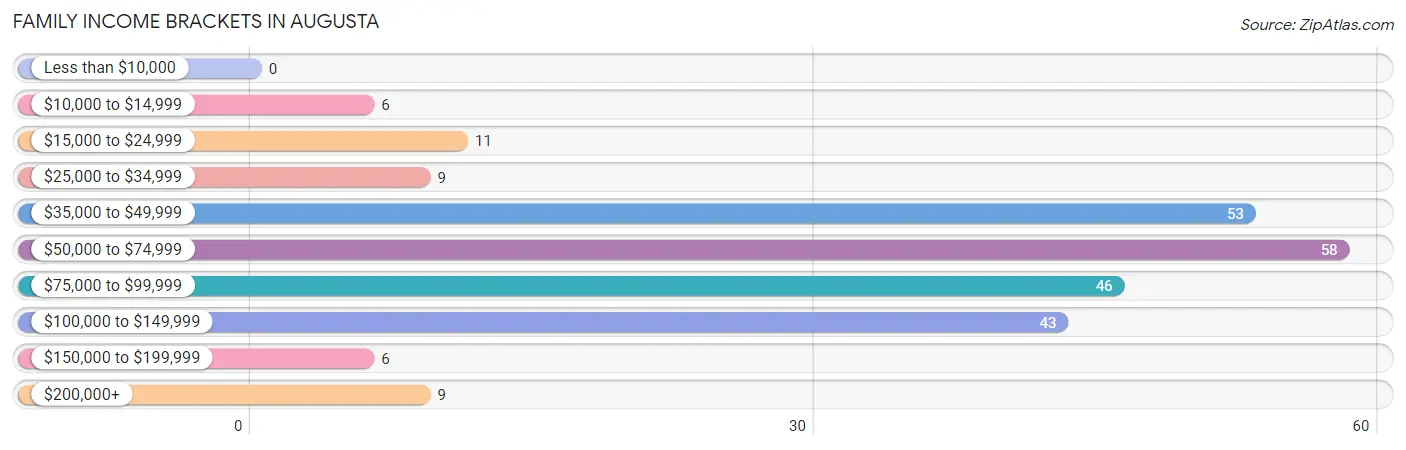
| Income Bracket | # Families | % Families |
| Less than $10,000 | 0 | 0.0% |
| $10,000 to $14,999 | 6 | 2.5% |
| $15,000 to $24,999 | 11 | 4.6% |
| $25,000 to $34,999 | 9 | 3.7% |
| $35,000 to $49,999 | 53 | 22.0% |
| $50,000 to $74,999 | 58 | 24.1% |
| $75,000 to $99,999 | 46 | 19.1% |
| $100,000 to $149,999 | 43 | 17.8% |
| $150,000 to $199,999 | 6 | 2.5% |
| $200,000+ | 9 | 3.7% |
Family Income by Famaliy Size in Augusta
5-person families (26 | 10.8%) account for the highest median family income in Augusta with $129,688 per family, while 2-person families (127 | 52.7%) have the highest median income of $27,708 per family member.
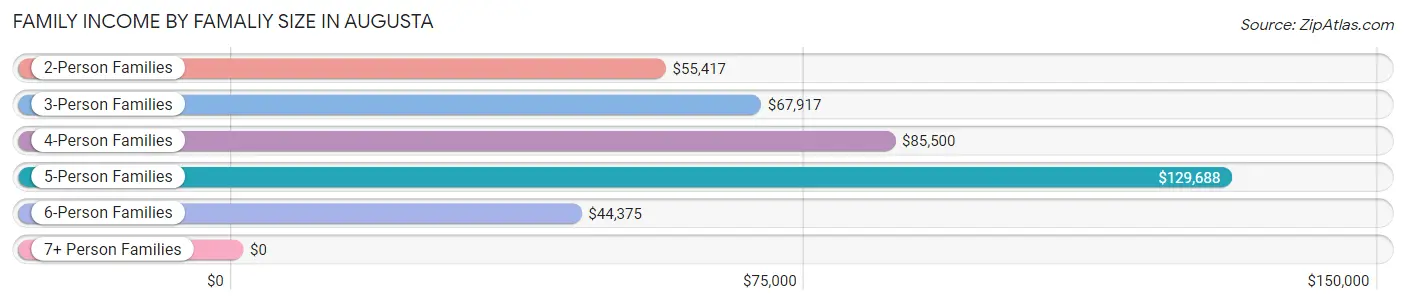
| Income Bracket | # Families | Median Income |
| 2-Person Families | 127 (52.7%) | $55,417 |
| 3-Person Families | 41 (17.0%) | $67,917 |
| 4-Person Families | 28 (11.6%) | $85,500 |
| 5-Person Families | 26 (10.8%) | $129,688 |
| 6-Person Families | 19 (7.9%) | $44,375 |
| 7+ Person Families | 0 (0.0%) | $0 |
| Total | 241 (100.0%) | $65,750 |
Family Income by Number of Earners in Augusta
The median family income in Augusta is $65,750, with families comprising 3+ earners (20) having the highest median family income of $136,667, while families with no earners (25) have the lowest median family income of $44,375, accounting for 8.3% and 10.4% of families, respectively.
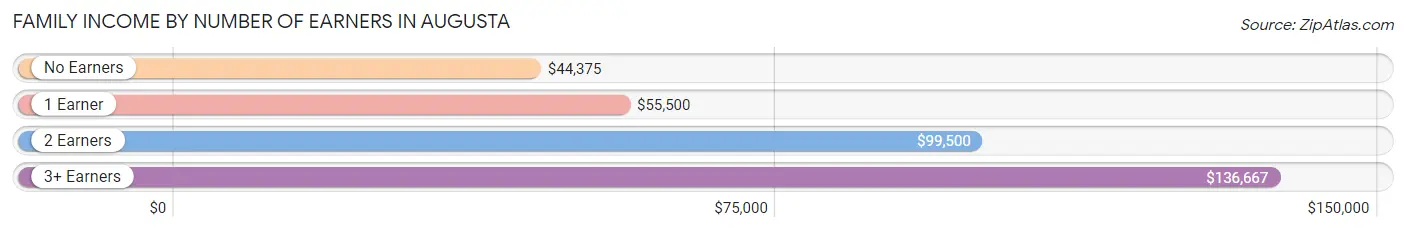
| Number of Earners | # Families | Median Income |
| No Earners | 25 (10.4%) | $44,375 |
| 1 Earner | 118 (49.0%) | $55,500 |
| 2 Earners | 78 (32.4%) | $99,500 |
| 3+ Earners | 20 (8.3%) | $136,667 |
| Total | 241 (100.0%) | $65,750 |
Household Income in Augusta
Household Income Brackets in Augusta
With 117 households falling in the category, the $50,000 to $74,999 income range is the most frequent in Augusta, accounting for 22.9% of all households. In contrast, only 17 households (3.3%) fall into the $200,000+ income bracket, making it the least populous group.
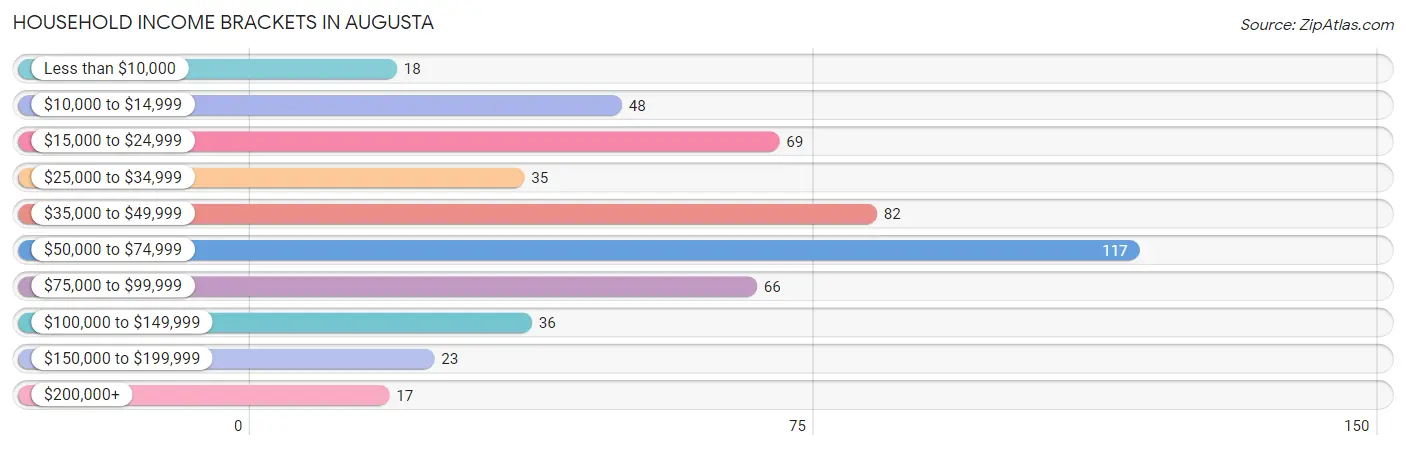
| Income Bracket | # Households | % Households |
| Less than $10,000 | 18 | 3.5% |
| $10,000 to $14,999 | 48 | 9.4% |
| $15,000 to $24,999 | 69 | 13.5% |
| $25,000 to $34,999 | 35 | 6.8% |
| $35,000 to $49,999 | 82 | 16.0% |
| $50,000 to $74,999 | 117 | 22.9% |
| $75,000 to $99,999 | 66 | 12.9% |
| $100,000 to $149,999 | 36 | 7.0% |
| $150,000 to $199,999 | 23 | 4.5% |
| $200,000+ | 17 | 3.3% |
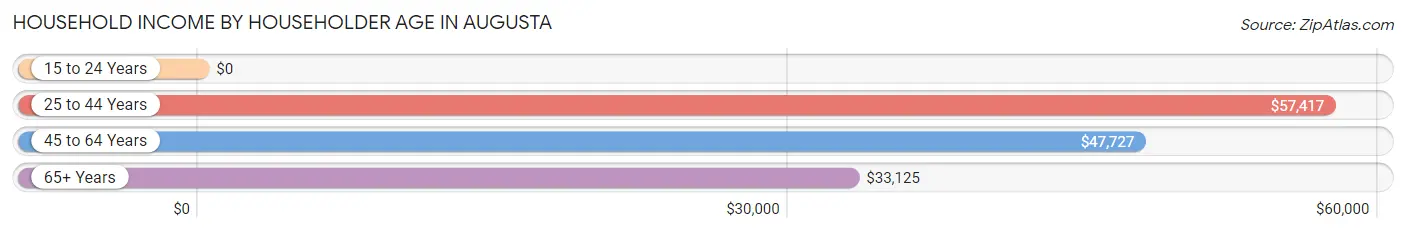
Household Income by Householder Age in Augusta
The median household income in Augusta is $50,243, with the highest median household income of $57,417 found in the 25 to 44 years age bracket for the primary householder. A total of 171 households (33.5%) fall into this category. Meanwhile, the 15 to 24 years age bracket for the primary householder has the lowest median household income of $0, with 21 households (4.1%) in this group.
| Income Bracket | # Households | Median Income |
| 15 to 24 Years | 21 (4.1%) | $0 |
| 25 to 44 Years | 171 (33.5%) | $57,417 |
| 45 to 64 Years | 172 (33.7%) | $47,727 |
| 65+ Years | 147 (28.8%) | $33,125 |
| Total | 511 (100.0%) | $50,243 |
Poverty in Augusta
Income Below Poverty by Sex and Age in Augusta
With 13.4% poverty level for males and 12.5% for females among the residents of Augusta, 55 to 64 year old males and 18 to 24 year old females are the most vulnerable to poverty, with 50 males (40.0%) and 12 females (38.7%) in their respective age groups living below the poverty level.
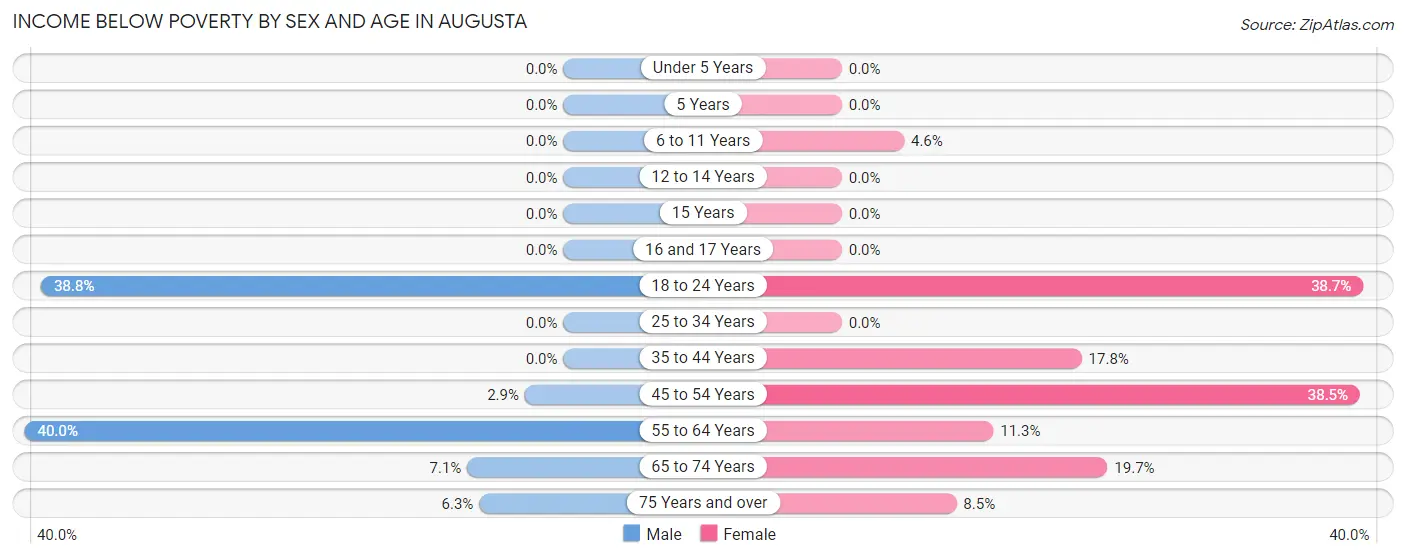
| Age Bracket | Male | Female |
| Under 5 Years | 0 (0.0%) | 0 (0.0%) |
| 5 Years | 0 (0.0%) | 0 (0.0%) |
| 6 to 11 Years | 0 (0.0%) | 3 (4.6%) |
| 12 to 14 Years | 0 (0.0%) | 0 (0.0%) |
| 15 Years | 0 (0.0%) | 0 (0.0%) |
| 16 and 17 Years | 0 (0.0%) | 0 (0.0%) |
| 18 to 24 Years | 19 (38.8%) | 12 (38.7%) |
| 25 to 34 Years | 0 (0.0%) | 0 (0.0%) |
| 35 to 44 Years | 0 (0.0%) | 13 (17.8%) |
| 45 to 54 Years | 1 (2.9%) | 20 (38.5%) |
| 55 to 64 Years | 50 (40.0%) | 9 (11.3%) |
| 65 to 74 Years | 4 (7.1%) | 14 (19.7%) |
| 75 Years and over | 2 (6.2%) | 4 (8.5%) |
| Total | 76 (13.4%) | 75 (12.5%) |
Income Above Poverty by Sex and Age in Augusta
According to the poverty statistics in Augusta, males aged under 5 years and females aged under 5 years are the age groups that are most secure financially, with 100.0% of males and 100.0% of females in these age groups living above the poverty line.
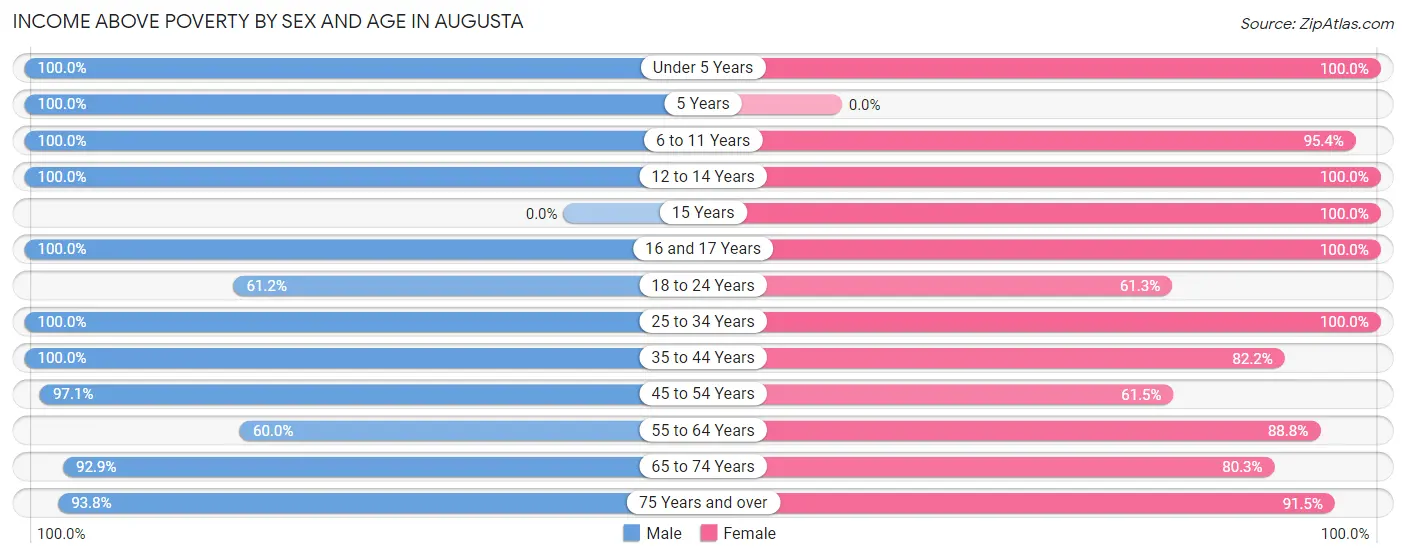
| Age Bracket | Male | Female |
| Under 5 Years | 53 (100.0%) | 45 (100.0%) |
| 5 Years | 11 (100.0%) | 0 (0.0%) |
| 6 to 11 Years | 27 (100.0%) | 62 (95.4%) |
| 12 to 14 Years | 6 (100.0%) | 27 (100.0%) |
| 15 Years | 0 (0.0%) | 6 (100.0%) |
| 16 and 17 Years | 7 (100.0%) | 17 (100.0%) |
| 18 to 24 Years | 30 (61.2%) | 19 (61.3%) |
| 25 to 34 Years | 85 (100.0%) | 88 (100.0%) |
| 35 to 44 Years | 81 (100.0%) | 60 (82.2%) |
| 45 to 54 Years | 34 (97.1%) | 32 (61.5%) |
| 55 to 64 Years | 75 (60.0%) | 71 (88.7%) |
| 65 to 74 Years | 52 (92.9%) | 57 (80.3%) |
| 75 Years and over | 30 (93.8%) | 43 (91.5%) |
| Total | 491 (86.6%) | 527 (87.5%) |
Income Below Poverty Among Married-Couple Families in Augusta
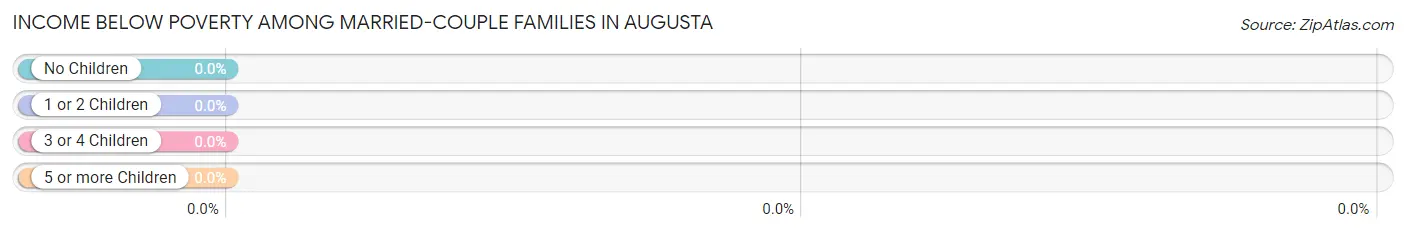
| Children | Above Poverty | Below Poverty |
| No Children | 91 (100.0%) | 0 (0.0%) |
| 1 or 2 Children | 48 (100.0%) | 0 (0.0%) |
| 3 or 4 Children | 33 (100.0%) | 0 (0.0%) |
| 5 or more Children | 0 (0.0%) | 0 (0.0%) |
| Total | 172 (100.0%) | 0 (0.0%) |
Income Below Poverty Among Single-Parent Households in Augusta
According to the poverty data in Augusta, 4.9% or 2 single-father households and 14.3% or 4 single-mother households are living below the poverty line. Among single-father households, those with no children have the highest poverty rate, with 2 households (18.2%) experiencing poverty. Likewise, among single-mother households, those with 1 or 2 children have the highest poverty rate, with 4 households (26.7%) falling below the poverty line.
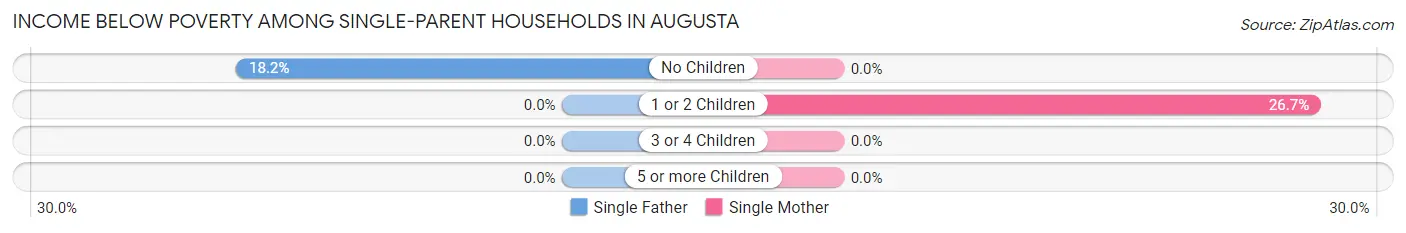
| Children | Single Father | Single Mother |
| No Children | 2 (18.2%) | 0 (0.0%) |
| 1 or 2 Children | 0 (0.0%) | 4 (26.7%) |
| 3 or 4 Children | 0 (0.0%) | 0 (0.0%) |
| 5 or more Children | 0 (0.0%) | 0 (0.0%) |
| Total | 2 (4.9%) | 4 (14.3%) |
Income Below Poverty Among Married-Couple vs Single-Parent Households in Augusta
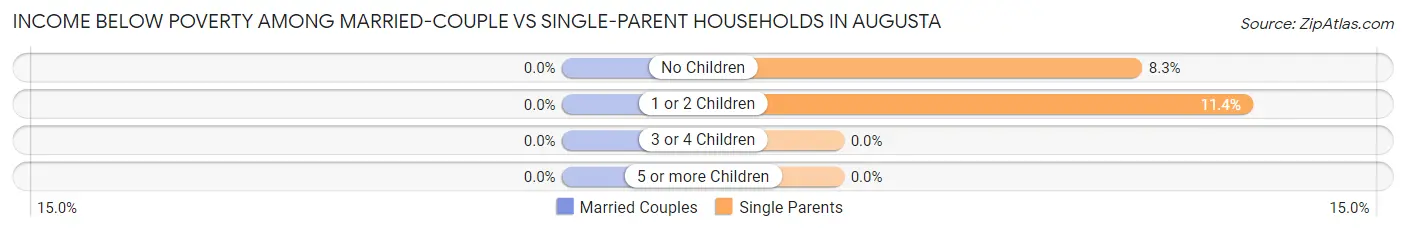
| Children | Married-Couple Families | Single-Parent Households |
| No Children | 0 (0.0%) | 2 (8.3%) |
| 1 or 2 Children | 0 (0.0%) | 4 (11.4%) |
| 3 or 4 Children | 0 (0.0%) | 0 (0.0%) |
| 5 or more Children | 0 (0.0%) | 0 (0.0%) |
| Total | 0 (0.0%) | 6 (8.7%) |
Race in Augusta
The most populous races in Augusta are White / Caucasian (1,121 | 89.4%), Two or more Races (128 | 10.2%), and Hispanic or Latino (19 | 1.5%).
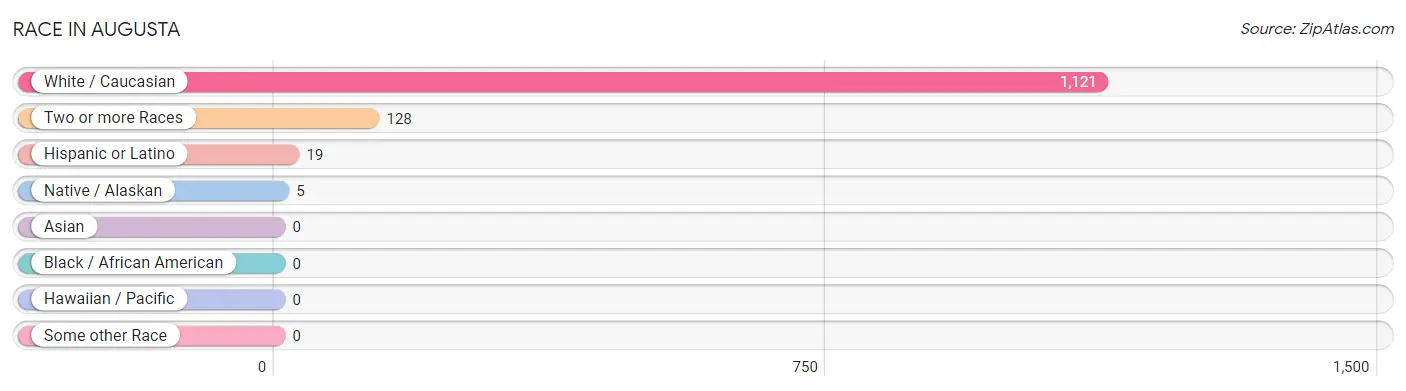
| Race | # Population | % Population |
| Asian | 0 | 0.0% |
| Black / African American | 0 | 0.0% |
| Hawaiian / Pacific | 0 | 0.0% |
| Hispanic or Latino | 19 | 1.5% |
| Native / Alaskan | 5 | 0.4% |
| White / Caucasian | 1,121 | 89.4% |
| Two or more Races | 128 | 10.2% |
| Some other Race | 0 | 0.0% |
| Total | 1,254 | 100.0% |
Ancestry in Augusta
The most populous ancestries reported in Augusta are German (463 | 36.9%), Norwegian (204 | 16.3%), Irish (98 | 7.8%), American (59 | 4.7%), and English (59 | 4.7%), together accounting for 70.4% of all Augusta residents.
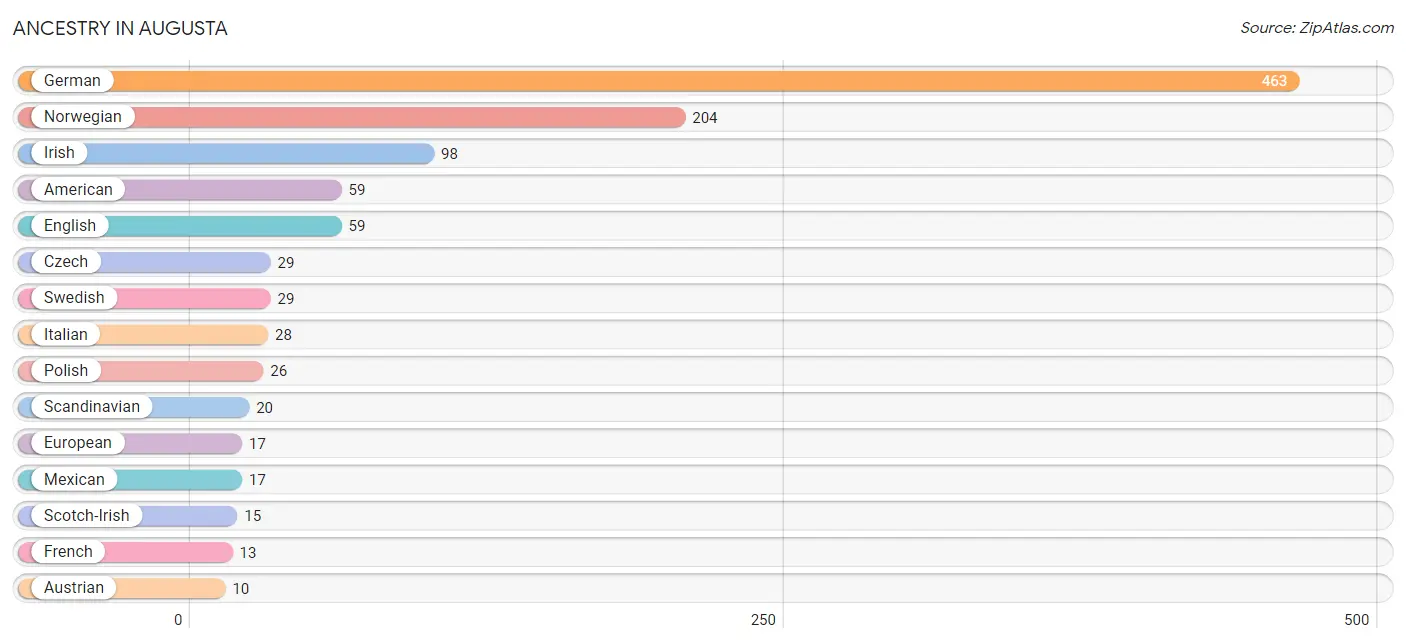
| Ancestry | # Population | % Population |
| American | 59 | 4.7% |
| Austrian | 10 | 0.8% |
| Chippewa | 6 | 0.5% |
| Cuban | 2 | 0.2% |
| Czech | 29 | 2.3% |
| Czechoslovakian | 5 | 0.4% |
| Danish | 2 | 0.2% |
| Dutch | 4 | 0.3% |
| Eastern European | 6 | 0.5% |
| English | 59 | 4.7% |
| European | 17 | 1.4% |
| Finnish | 6 | 0.5% |
| French | 13 | 1.0% |
| French Canadian | 9 | 0.7% |
| German | 463 | 36.9% |
| Hungarian | 7 | 0.6% |
| Irish | 98 | 7.8% |
| Italian | 28 | 2.2% |
| Mexican | 17 | 1.4% |
| Norwegian | 204 | 16.3% |
| Polish | 26 | 2.1% |
| Scandinavian | 20 | 1.6% |
| Scotch-Irish | 15 | 1.2% |
| Swedish | 29 | 2.3% | View All 24 Rows |
Immigrants in Augusta

| Immigration Origin | # Population | % Population | View All 0 Rows |
Sex and Age in Augusta
Sex and Age in Augusta
The most populous age groups in Augusta are 60 to 64 Years (91 | 15.3%) for men and 5 to 9 Years (56 | 8.5%) for women.
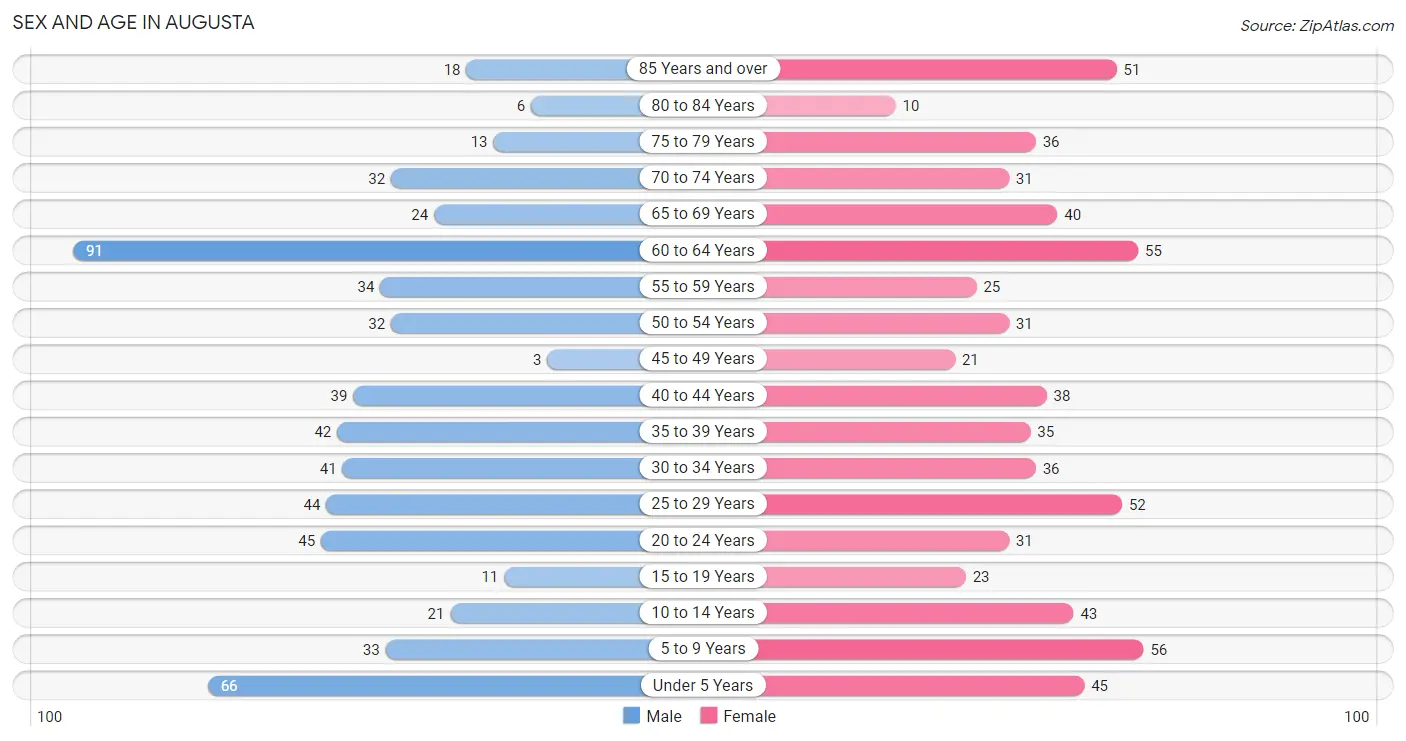
| Age Bracket | Male | Female |
| Under 5 Years | 66 (11.1%) | 45 (6.8%) |
| 5 to 9 Years | 33 (5.6%) | 56 (8.5%) |
| 10 to 14 Years | 21 (3.5%) | 43 (6.5%) |
| 15 to 19 Years | 11 (1.8%) | 23 (3.5%) |
| 20 to 24 Years | 45 (7.6%) | 31 (4.7%) |
| 25 to 29 Years | 44 (7.4%) | 52 (7.9%) |
| 30 to 34 Years | 41 (6.9%) | 36 (5.5%) |
| 35 to 39 Years | 42 (7.1%) | 35 (5.3%) |
| 40 to 44 Years | 39 (6.6%) | 38 (5.8%) |
| 45 to 49 Years | 3 (0.5%) | 21 (3.2%) |
| 50 to 54 Years | 32 (5.4%) | 31 (4.7%) |
| 55 to 59 Years | 34 (5.7%) | 25 (3.8%) |
| 60 to 64 Years | 91 (15.3%) | 55 (8.4%) |
| 65 to 69 Years | 24 (4.0%) | 40 (6.1%) |
| 70 to 74 Years | 32 (5.4%) | 31 (4.7%) |
| 75 to 79 Years | 13 (2.2%) | 36 (5.5%) |
| 80 to 84 Years | 6 (1.0%) | 10 (1.5%) |
| 85 Years and over | 18 (3.0%) | 51 (7.7%) |
| Total | 595 (100.0%) | 659 (100.0%) |
Families and Households in Augusta
Median Family Size in Augusta
The median family size in Augusta is 3.20 persons per family, with married-couple families (172 | 71.4%) accounting for the largest median family size of 3.26 persons per family. On the other hand, single female/mother families (28 | 11.6%) represent the smallest median family size with 2.93 persons per family.
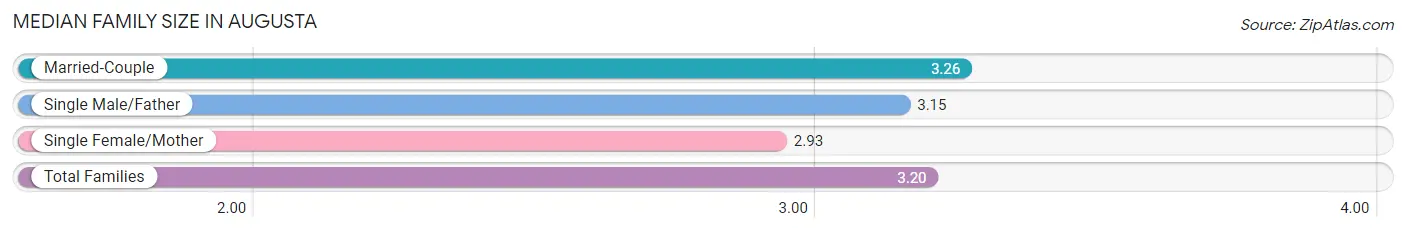
| Family Type | # Families | Family Size |
| Married-Couple | 172 (71.4%) | 3.26 |
| Single Male/Father | 41 (17.0%) | 3.15 |
| Single Female/Mother | 28 (11.6%) | 2.93 |
| Total Families | 241 (100.0%) | 3.20 |
Median Household Size in Augusta
The median household size in Augusta is 2.33 persons per household, with single male/father households (41 | 8.0%) accounting for the largest median household size of 4.12 persons per household. non-family households (270 | 52.8%) represent the smallest median household size with 1.25 persons per household.
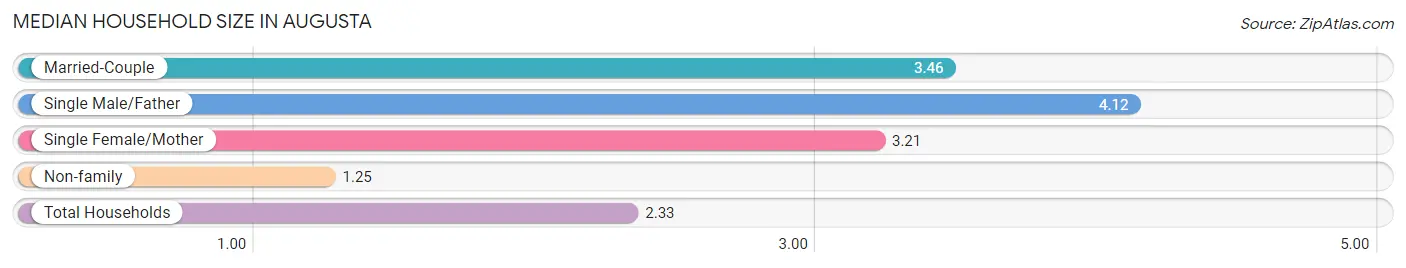
| Household Type | # Households | Household Size |
| Married-Couple | 172 (33.7%) | 3.46 |
| Single Male/Father | 41 (8.0%) | 4.12 |
| Single Female/Mother | 28 (5.5%) | 3.21 |
| Non-family | 270 (52.8%) | 1.25 |
| Total Households | 511 (100.0%) | 2.33 |
Household Size by Marriage Status in Augusta
Out of a total of 511 households in Augusta, 241 (47.2%) are family households, while 270 (52.8%) are nonfamily households. The most numerous type of family households are 2-person households, comprising 105, and the most common type of nonfamily households are 1-person households, comprising 205.
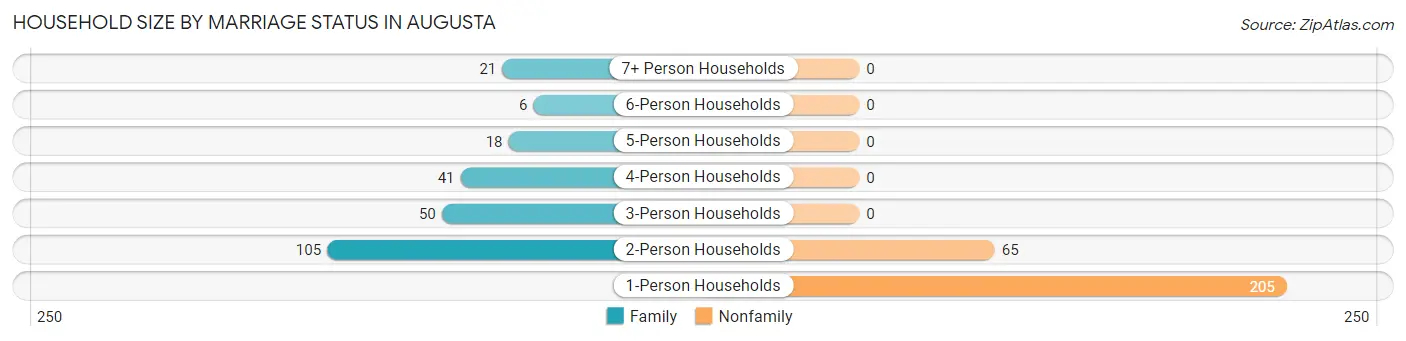
| Household Size | Family Households | Nonfamily Households |
| 1-Person Households | - | 205 (40.1%) |
| 2-Person Households | 105 (20.5%) | 65 (12.7%) |
| 3-Person Households | 50 (9.8%) | 0 (0.0%) |
| 4-Person Households | 41 (8.0%) | 0 (0.0%) |
| 5-Person Households | 18 (3.5%) | 0 (0.0%) |
| 6-Person Households | 6 (1.2%) | 0 (0.0%) |
| 7+ Person Households | 21 (4.1%) | 0 (0.0%) |
| Total | 241 (47.2%) | 270 (52.8%) |
Female Fertility in Augusta
Fertility by Age in Augusta
Average fertility rate in Augusta is 61.0 births per 1,000 women. Women in the age bracket of 20 to 34 years have the highest fertility rate with 92.0 births per 1,000 women. Women in the age bracket of 20 to 34 years acount for 73.3% of all women with births.
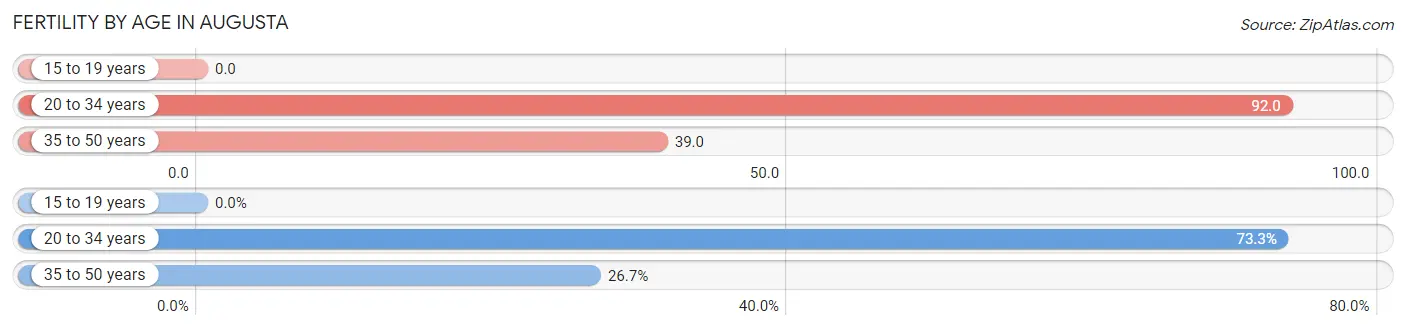
| Age Bracket | Women with Births | Births / 1,000 Women |
| 15 to 19 years | 0 (0.0%) | 0.0 |
| 20 to 34 years | 11 (73.3%) | 92.0 |
| 35 to 50 years | 4 (26.7%) | 39.0 |
| Total | 15 (100.0%) | 61.0 |
Fertility by Age by Marriage Status in Augusta
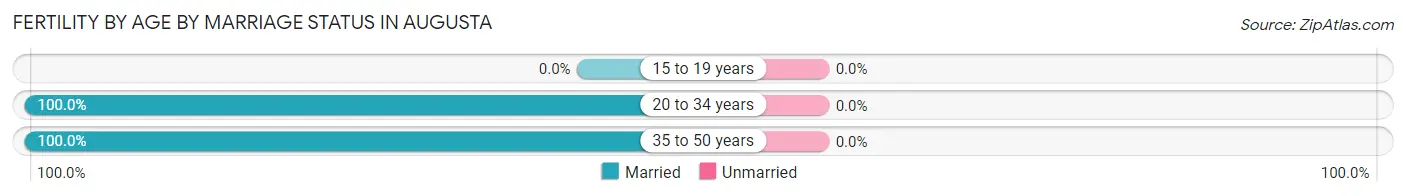
| Age Bracket | Married | Unmarried |
| 15 to 19 years | 0 (0.0%) | 0 (0.0%) |
| 20 to 34 years | 11 (100.0%) | 0 (0.0%) |
| 35 to 50 years | 4 (100.0%) | 0 (0.0%) |
| Total | 15 (100.0%) | 0 (0.0%) |
Fertility by Education in Augusta
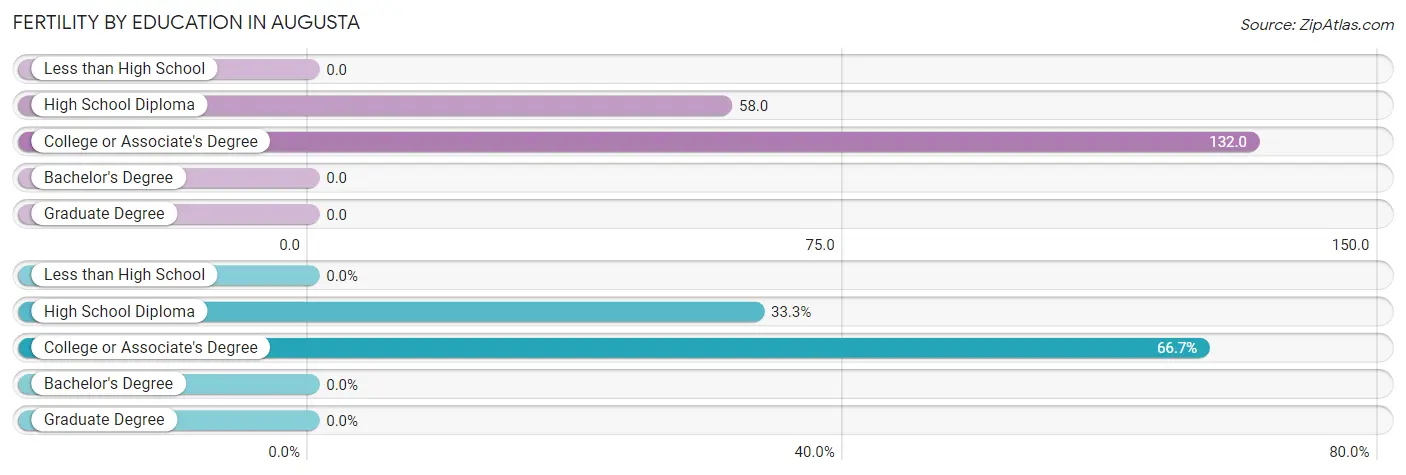
| Educational Attainment | Women with Births | Births / 1,000 Women |
| Less than High School | 0 (0.0%) | 0.0 |
| High School Diploma | 5 (33.3%) | 58.0 |
| College or Associate's Degree | 10 (66.7%) | 132.0 |
| Bachelor's Degree | 0 (0.0%) | 0.0 |
| Graduate Degree | 0 (0.0%) | 0.0 |
| Total | 15 (100.0%) | 61.0 |
Fertility by Education by Marriage Status in Augusta
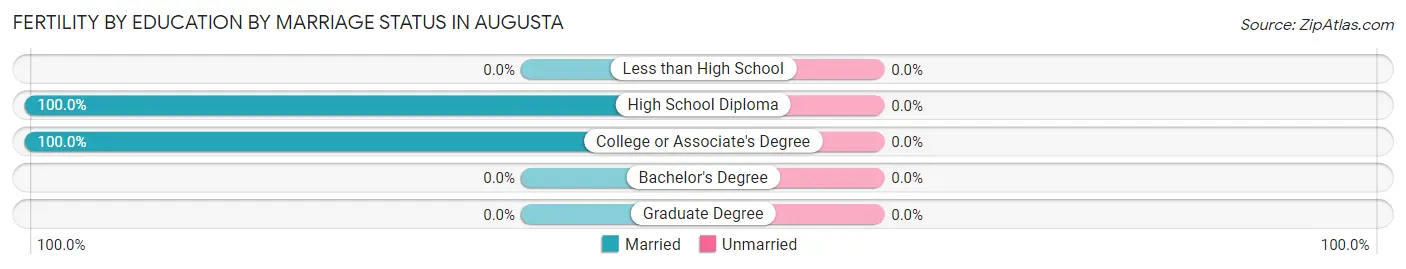
| Educational Attainment | Married | Unmarried |
| Less than High School | 0 (0.0%) | 0 (0.0%) |
| High School Diploma | 5 (100.0%) | 0 (0.0%) |
| College or Associate's Degree | 10 (100.0%) | 0 (0.0%) |
| Bachelor's Degree | 0 (0.0%) | 0 (0.0%) |
| Graduate Degree | 0 (0.0%) | 0 (0.0%) |
| Total | 15 (100.0%) | 0 (0.0%) |
Employment Characteristics in Augusta
Employment by Class of Employer in Augusta
Among the 496 employed individuals in Augusta, private company employees (373 | 75.2%), not-for-profit organizations (43 | 8.7%), and self-employed (not incorporated) (28 | 5.7%) make up the most common classes of employment.
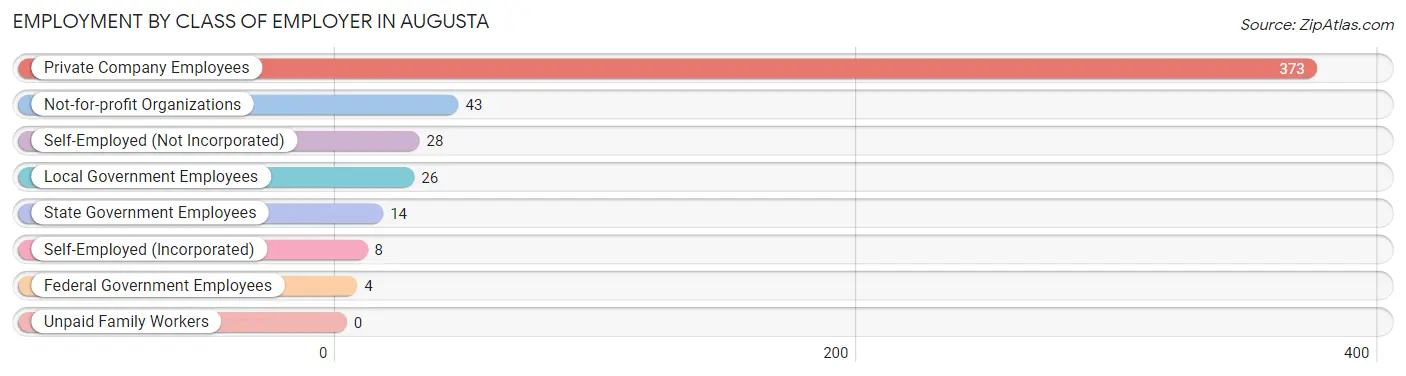
| Employer Class | # Employees | % Employees |
| Private Company Employees | 373 | 75.2% |
| Self-Employed (Incorporated) | 8 | 1.6% |
| Self-Employed (Not Incorporated) | 28 | 5.7% |
| Not-for-profit Organizations | 43 | 8.7% |
| Local Government Employees | 26 | 5.2% |
| State Government Employees | 14 | 2.8% |
| Federal Government Employees | 4 | 0.8% |
| Unpaid Family Workers | 0 | 0.0% |
| Total | 496 | 100.0% |
Employment Status by Age in Augusta
According to the labor force statistics for Augusta, out of the total population over 16 years of age (984), 52.6% or 518 individuals are in the labor force, with 4.2% or 22 of them unemployed. The age group with the highest labor force participation rate is 25 to 29 years, with 100.0% or 96 individuals in the labor force. Within the labor force, the 16 to 19 years age range has the highest percentage of unemployed individuals, with 20.0% or 4 of them being unemployed.
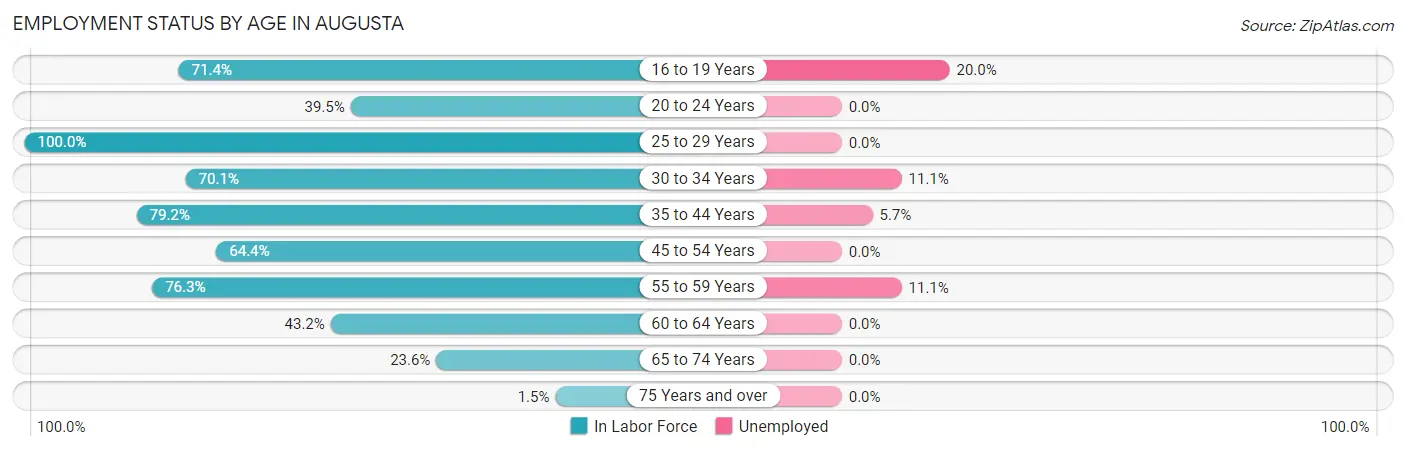
| Age Bracket | In Labor Force | Unemployed |
| 16 to 19 Years | 20 (71.4%) | 4 (20.0%) |
| 20 to 24 Years | 30 (39.5%) | 0 (0.0%) |
| 25 to 29 Years | 96 (100.0%) | 0 (0.0%) |
| 30 to 34 Years | 54 (70.1%) | 6 (11.1%) |
| 35 to 44 Years | 122 (79.2%) | 7 (5.7%) |
| 45 to 54 Years | 56 (64.4%) | 0 (0.0%) |
| 55 to 59 Years | 45 (76.3%) | 5 (11.1%) |
| 60 to 64 Years | 63 (43.2%) | 0 (0.0%) |
| 65 to 74 Years | 30 (23.6%) | 0 (0.0%) |
| 75 Years and over | 2 (1.5%) | 0 (0.0%) |
| Total | 518 (52.6%) | 22 (4.2%) |
Employment Status by Educational Attainment in Augusta
According to labor force statistics for Augusta, 70.4% of individuals (436) out of the total population between 25 and 64 years of age (619) are in the labor force, with 4.1% or 18 of them being unemployed. The group with the highest labor force participation rate are those with the educational attainment of bachelor's degree or higher, with 89.0% or 65 individuals in the labor force. Within the labor force, individuals with less than high school education have the highest percentage of unemployment, with 14.8% or 4 of them being unemployed.
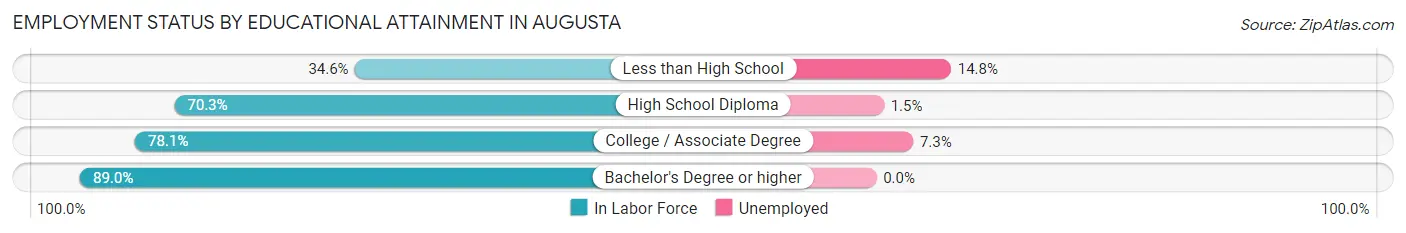
| Educational Attainment | In Labor Force | Unemployed |
| Less than High School | 27 (34.6%) | 12 (14.8%) |
| High School Diploma | 194 (70.3%) | 4 (1.5%) |
| College / Associate Degree | 150 (78.1%) | 14 (7.3%) |
| Bachelor's Degree or higher | 65 (89.0%) | 0 (0.0%) |
| Total | 436 (70.4%) | 25 (4.1%) |
Employment Occupations by Sex in Augusta
Management, Business, Science and Arts Occupations
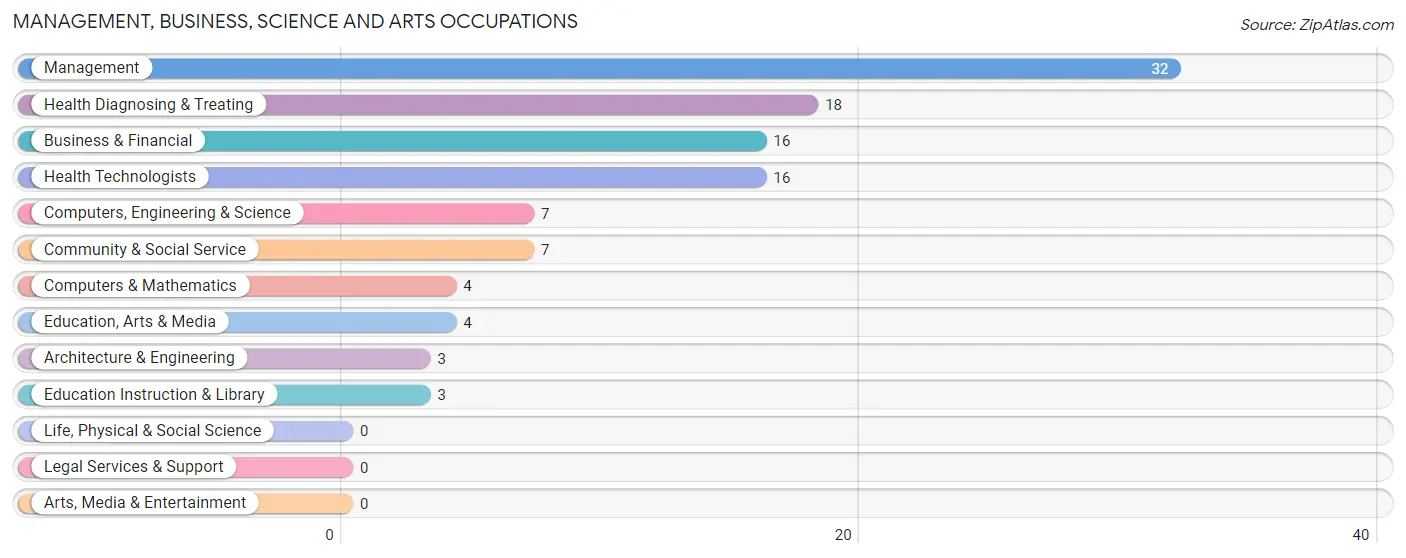
The most common Management, Business, Science and Arts occupations in Augusta are Management (32 | 6.5%), Health Diagnosing & Treating (18 | 3.6%), Business & Financial (16 | 3.2%), Health Technologists (16 | 3.2%), and Computers, Engineering & Science (7 | 1.4%).
Management, Business, Science and Arts Occupations by Sex
Within the Management, Business, Science and Arts occupations in Augusta, the most male-oriented occupations are Architecture & Engineering (100.0%), Business & Financial (62.5%), and Computers, Engineering & Science (42.9%), while the most female-oriented occupations are Computers & Mathematics (100.0%), Education Instruction & Library (100.0%), and Health Diagnosing & Treating (100.0%).
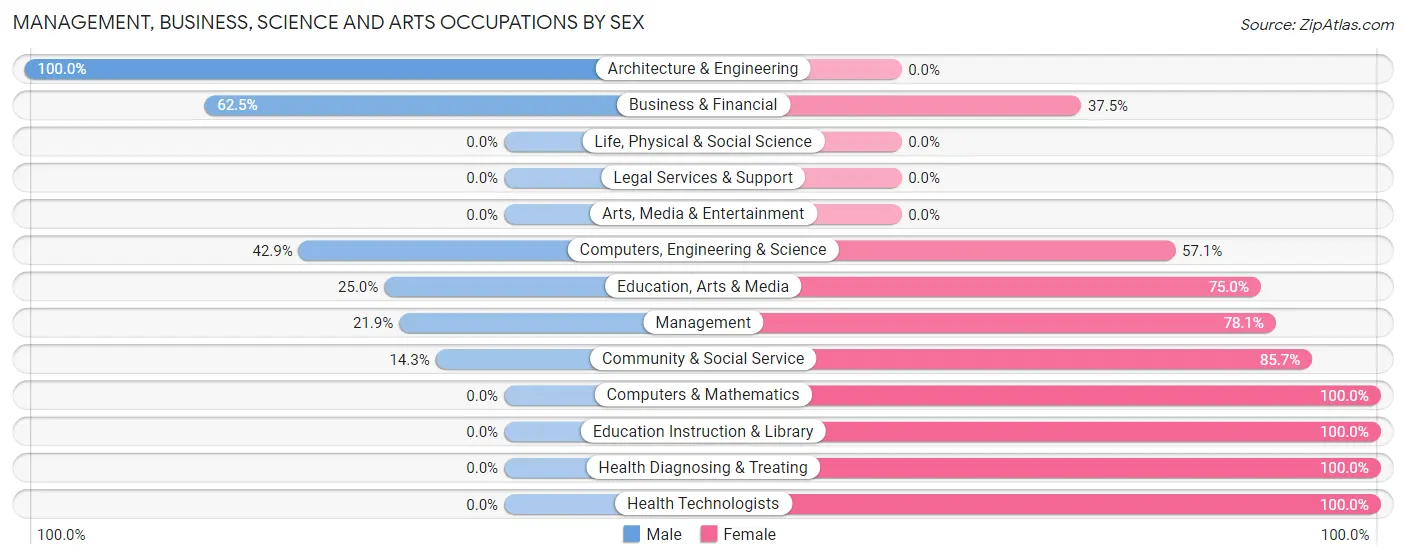
| Occupation | Male | Female |
| Management | 7 (21.9%) | 25 (78.1%) |
| Business & Financial | 10 (62.5%) | 6 (37.5%) |
| Computers, Engineering & Science | 3 (42.9%) | 4 (57.1%) |
| Computers & Mathematics | 0 (0.0%) | 4 (100.0%) |
| Architecture & Engineering | 3 (100.0%) | 0 (0.0%) |
| Life, Physical & Social Science | 0 (0.0%) | 0 (0.0%) |
| Community & Social Service | 1 (14.3%) | 6 (85.7%) |
| Education, Arts & Media | 1 (25.0%) | 3 (75.0%) |
| Legal Services & Support | 0 (0.0%) | 0 (0.0%) |
| Education Instruction & Library | 0 (0.0%) | 3 (100.0%) |
| Arts, Media & Entertainment | 0 (0.0%) | 0 (0.0%) |
| Health Diagnosing & Treating | 0 (0.0%) | 18 (100.0%) |
| Health Technologists | 0 (0.0%) | 16 (100.0%) |
| Total (Category) | 21 (26.3%) | 59 (73.8%) |
| Total (Overall) | 259 (52.2%) | 237 (47.8%) |
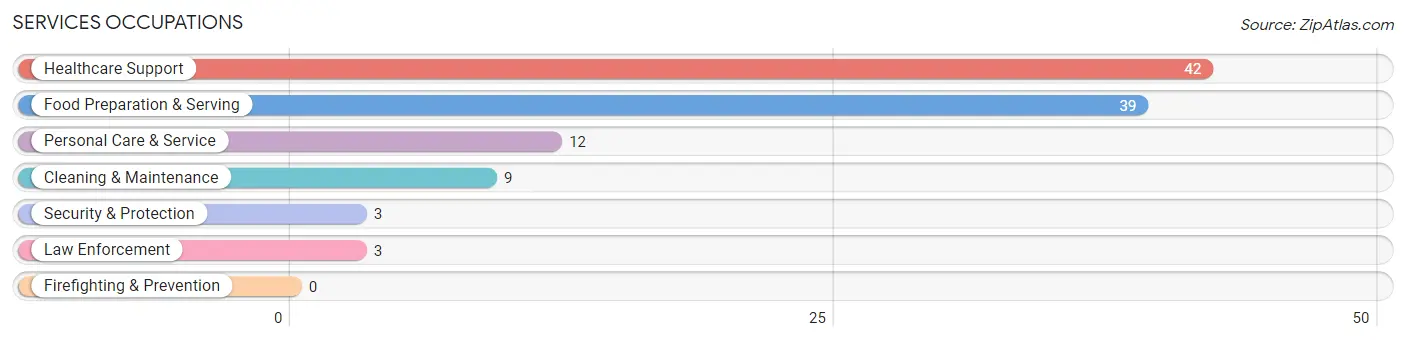
Services Occupations
The most common Services occupations in Augusta are Healthcare Support (42 | 8.5%), Food Preparation & Serving (39 | 7.9%), Personal Care & Service (12 | 2.4%), Cleaning & Maintenance (9 | 1.8%), and Security & Protection (3 | 0.6%).
Services Occupations by Sex
Within the Services occupations in Augusta, the most male-oriented occupations are Security & Protection (100.0%), Law Enforcement (100.0%), and Cleaning & Maintenance (55.6%), while the most female-oriented occupations are Healthcare Support (76.2%), Personal Care & Service (75.0%), and Food Preparation & Serving (64.1%).
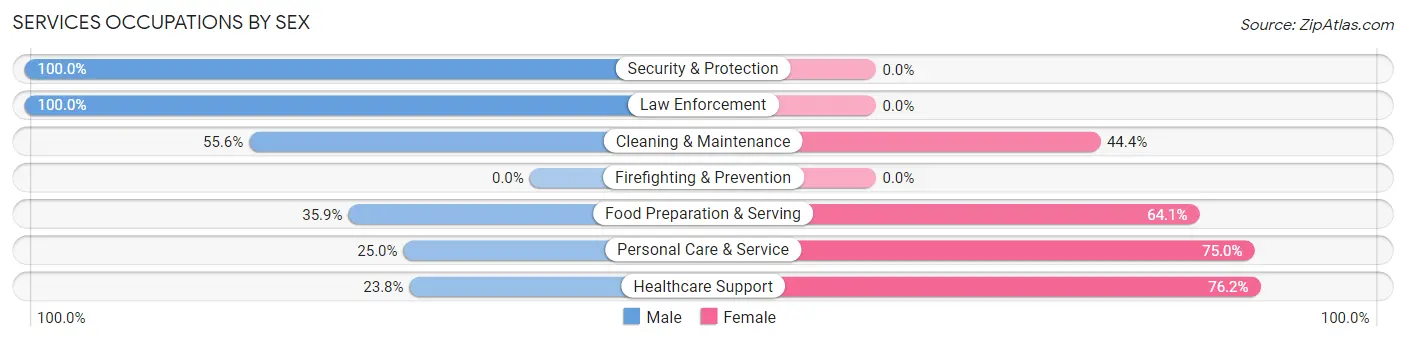
| Occupation | Male | Female |
| Healthcare Support | 10 (23.8%) | 32 (76.2%) |
| Security & Protection | 3 (100.0%) | 0 (0.0%) |
| Firefighting & Prevention | 0 (0.0%) | 0 (0.0%) |
| Law Enforcement | 3 (100.0%) | 0 (0.0%) |
| Food Preparation & Serving | 14 (35.9%) | 25 (64.1%) |
| Cleaning & Maintenance | 5 (55.6%) | 4 (44.4%) |
| Personal Care & Service | 3 (25.0%) | 9 (75.0%) |
| Total (Category) | 35 (33.3%) | 70 (66.7%) |
| Total (Overall) | 259 (52.2%) | 237 (47.8%) |
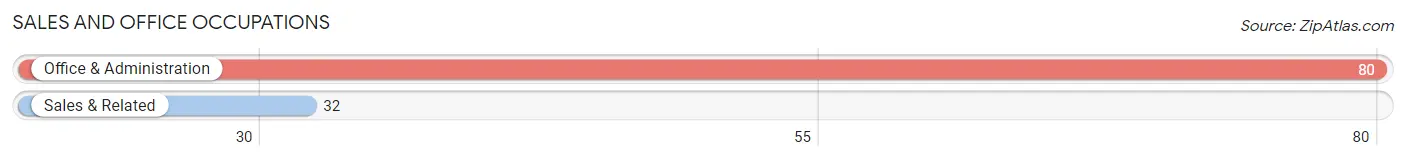
Sales and Office Occupations
The most common Sales and Office occupations in Augusta are Office & Administration (80 | 16.1%), and Sales & Related (32 | 6.5%).
Sales and Office Occupations by Sex
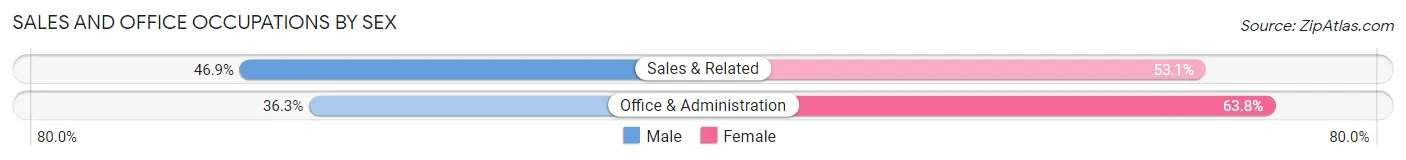
| Occupation | Male | Female |
| Sales & Related | 15 (46.9%) | 17 (53.1%) |
| Office & Administration | 29 (36.2%) | 51 (63.7%) |
| Total (Category) | 44 (39.3%) | 68 (60.7%) |
| Total (Overall) | 259 (52.2%) | 237 (47.8%) |
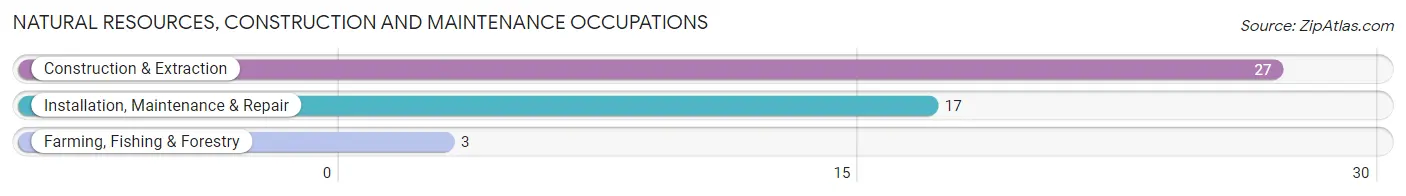
Natural Resources, Construction and Maintenance Occupations
The most common Natural Resources, Construction and Maintenance occupations in Augusta are Construction & Extraction (27 | 5.4%), Installation, Maintenance & Repair (17 | 3.4%), and Farming, Fishing & Forestry (3 | 0.6%).
Natural Resources, Construction and Maintenance Occupations by Sex
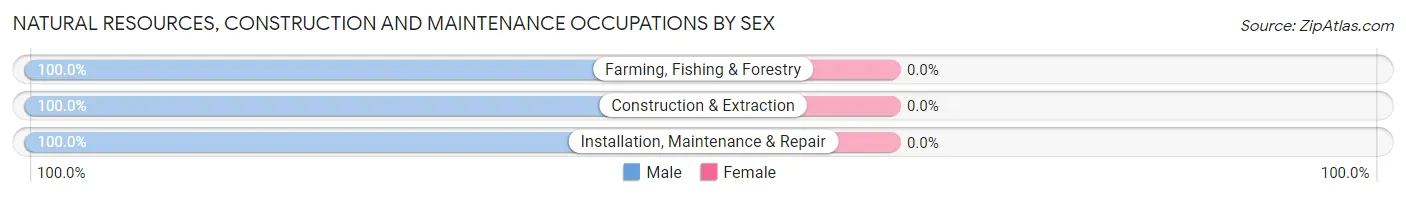
| Occupation | Male | Female |
| Farming, Fishing & Forestry | 3 (100.0%) | 0 (0.0%) |
| Construction & Extraction | 27 (100.0%) | 0 (0.0%) |
| Installation, Maintenance & Repair | 17 (100.0%) | 0 (0.0%) |
| Total (Category) | 47 (100.0%) | 0 (0.0%) |
| Total (Overall) | 259 (52.2%) | 237 (47.8%) |
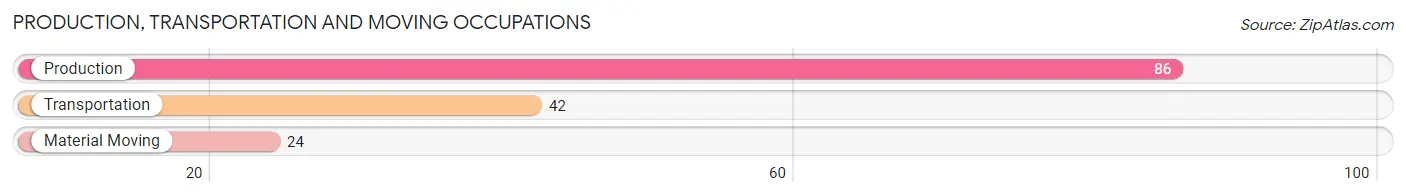
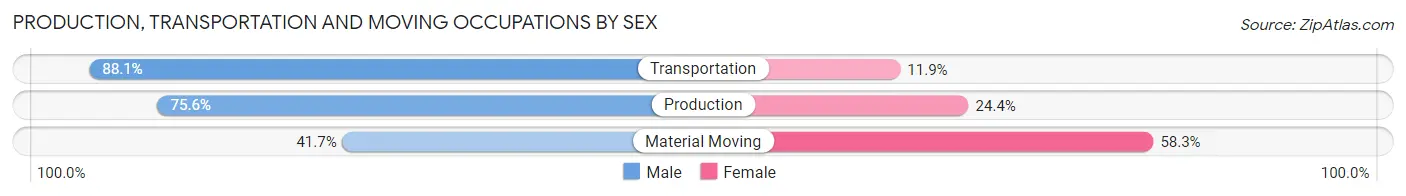
Production, Transportation and Moving Occupations
The most common Production, Transportation and Moving occupations in Augusta are Production (86 | 17.3%), Transportation (42 | 8.5%), and Material Moving (24 | 4.8%).
Production, Transportation and Moving Occupations by Sex
| Occupation | Male | Female |
| Production | 65 (75.6%) | 21 (24.4%) |
| Transportation | 37 (88.1%) | 5 (11.9%) |
| Material Moving | 10 (41.7%) | 14 (58.3%) |
| Total (Category) | 112 (73.7%) | 40 (26.3%) |
| Total (Overall) | 259 (52.2%) | 237 (47.8%) |
Employment Industries by Sex in Augusta
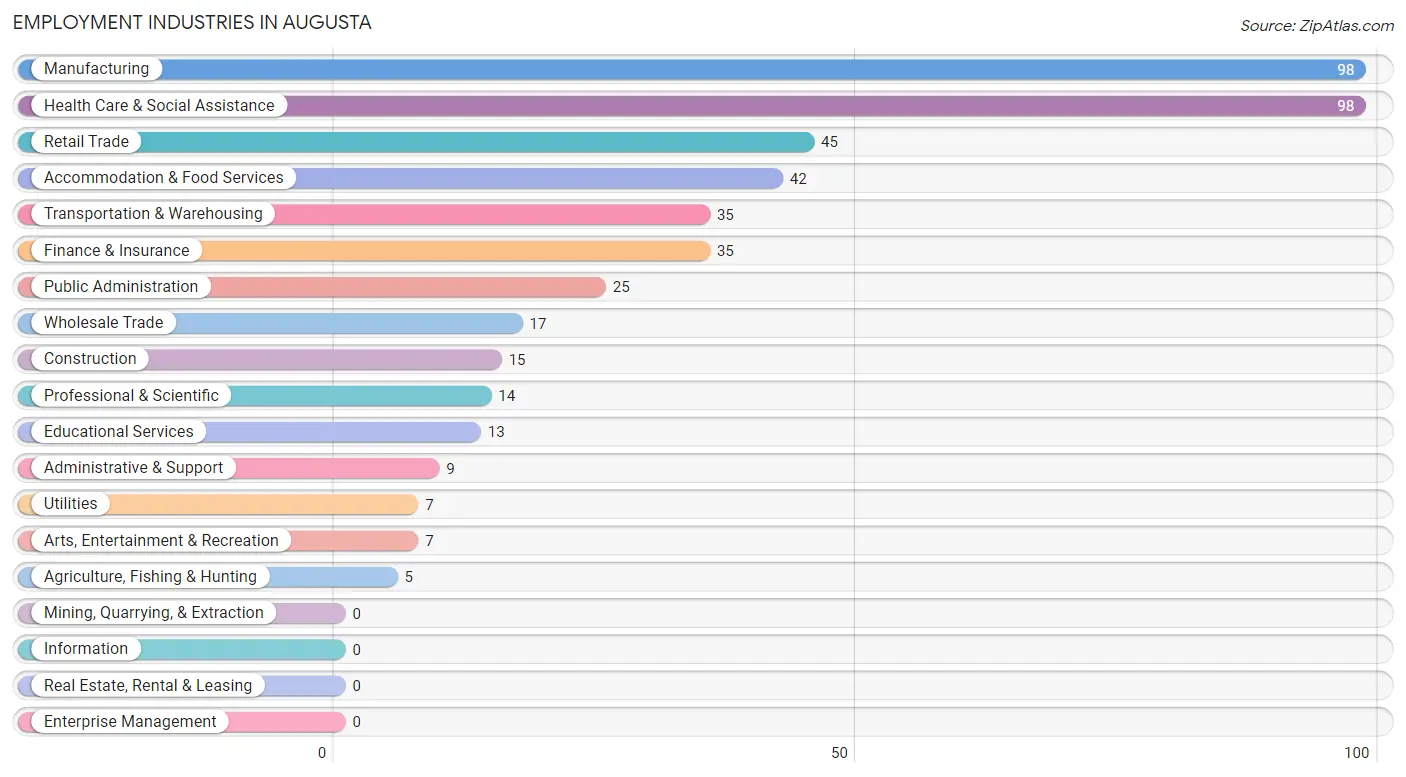
Employment Industries in Augusta
The major employment industries in Augusta include Manufacturing (98 | 19.8%), Health Care & Social Assistance (98 | 19.8%), Retail Trade (45 | 9.1%), Accommodation & Food Services (42 | 8.5%), and Transportation & Warehousing (35 | 7.1%).
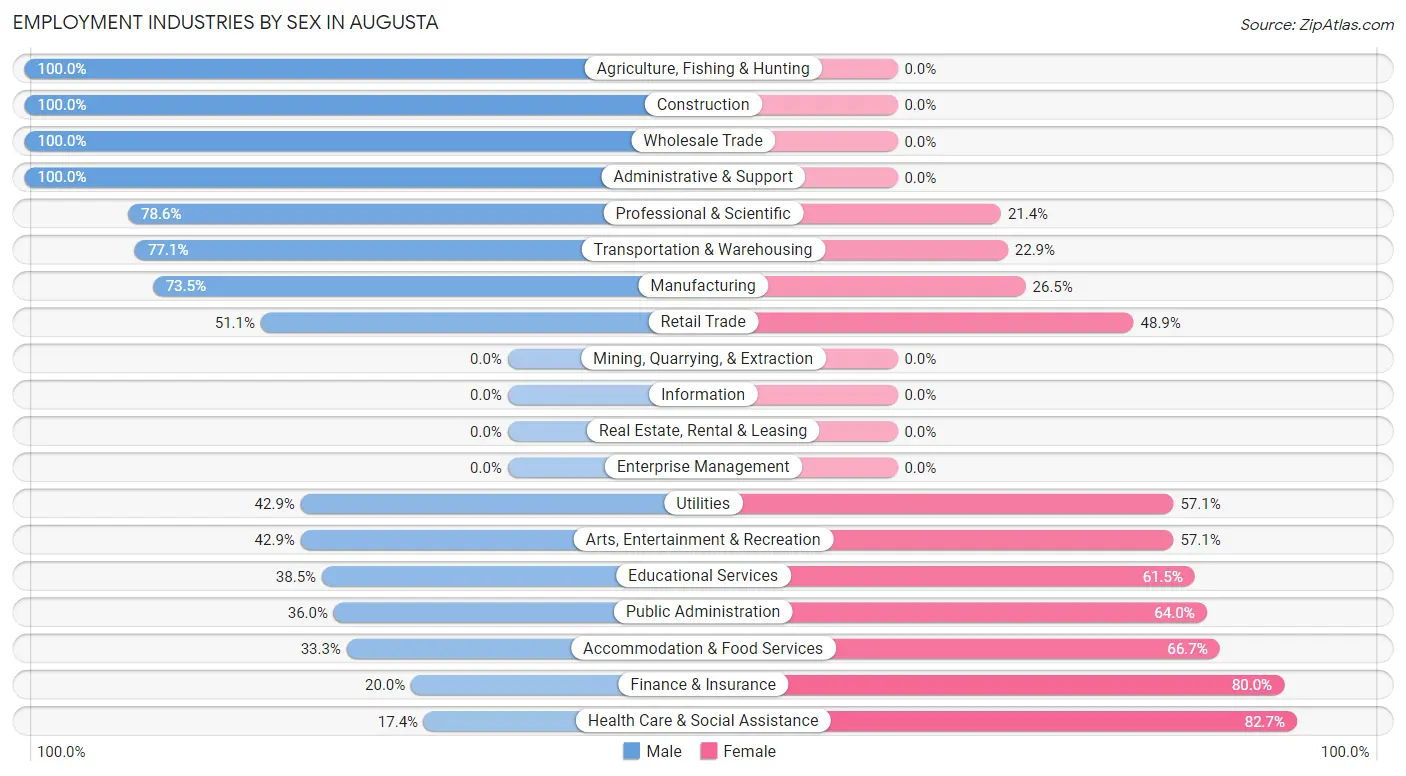
Employment Industries by Sex in Augusta
The Augusta industries that see more men than women are Agriculture, Fishing & Hunting (100.0%), Construction (100.0%), and Wholesale Trade (100.0%), whereas the industries that tend to have a higher number of women are Health Care & Social Assistance (82.7%), Finance & Insurance (80.0%), and Accommodation & Food Services (66.7%).
| Industry | Male | Female |
| Agriculture, Fishing & Hunting | 5 (100.0%) | 0 (0.0%) |
| Mining, Quarrying, & Extraction | 0 (0.0%) | 0 (0.0%) |
| Construction | 15 (100.0%) | 0 (0.0%) |
| Manufacturing | 72 (73.5%) | 26 (26.5%) |
| Wholesale Trade | 17 (100.0%) | 0 (0.0%) |
| Retail Trade | 23 (51.1%) | 22 (48.9%) |
| Transportation & Warehousing | 27 (77.1%) | 8 (22.9%) |
| Utilities | 3 (42.9%) | 4 (57.1%) |
| Information | 0 (0.0%) | 0 (0.0%) |
| Finance & Insurance | 7 (20.0%) | 28 (80.0%) |
| Real Estate, Rental & Leasing | 0 (0.0%) | 0 (0.0%) |
| Professional & Scientific | 11 (78.6%) | 3 (21.4%) |
| Enterprise Management | 0 (0.0%) | 0 (0.0%) |
| Administrative & Support | 9 (100.0%) | 0 (0.0%) |
| Educational Services | 5 (38.5%) | 8 (61.5%) |
| Health Care & Social Assistance | 17 (17.3%) | 81 (82.7%) |
| Arts, Entertainment & Recreation | 3 (42.9%) | 4 (57.1%) |
| Accommodation & Food Services | 14 (33.3%) | 28 (66.7%) |
| Public Administration | 9 (36.0%) | 16 (64.0%) |
| Total | 259 (52.2%) | 237 (47.8%) |
Education in Augusta
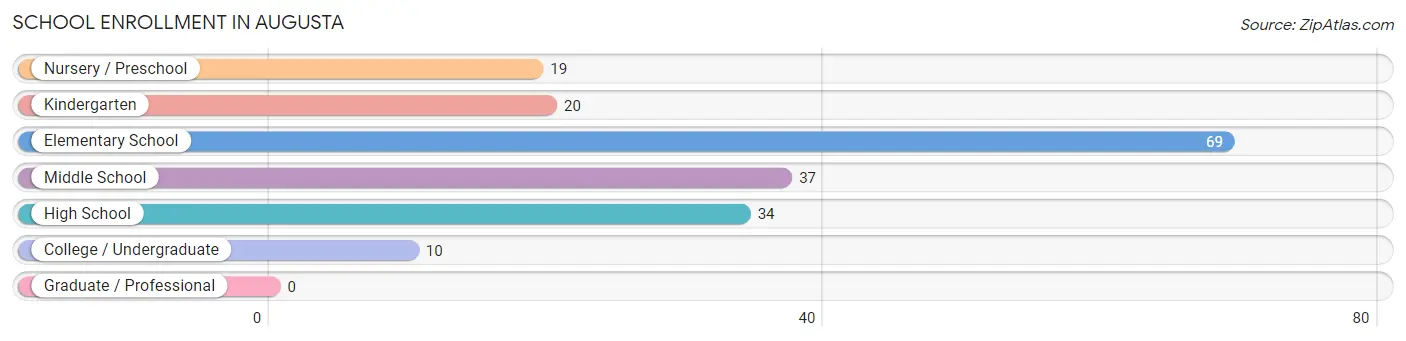
School Enrollment in Augusta
The most common levels of schooling among the 189 students in Augusta are elementary school (69 | 36.5%), middle school (37 | 19.6%), and high school (34 | 18.0%).
| School Level | # Students | % Students |
| Nursery / Preschool | 19 | 10.1% |
| Kindergarten | 20 | 10.6% |
| Elementary School | 69 | 36.5% |
| Middle School | 37 | 19.6% |
| High School | 34 | 18.0% |
| College / Undergraduate | 10 | 5.3% |
| Graduate / Professional | 0 | 0.0% |
| Total | 189 | 100.0% |
School Enrollment by Age by Funding Source in Augusta
Out of a total of 189 students who are enrolled in schools in Augusta, 40 (21.2%) attend a private institution, while the remaining 149 (78.8%) are enrolled in public schools. The age group of 5 to 9 year old has the highest likelihood of being enrolled in private schools, with 31 (36.0% in the age bracket) enrolled. Conversely, the age group of 3 to 4 year olds has the lowest likelihood of being enrolled in a private school, with 14 (100.0% in the age bracket) attending a public institution.
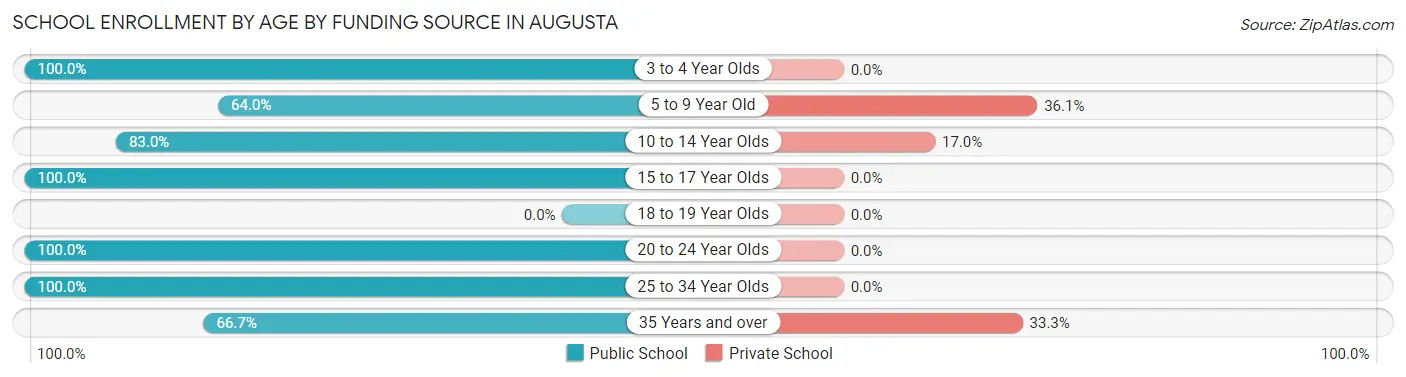
| Age Bracket | Public School | Private School |
| 3 to 4 Year Olds | 14 (100.0%) | 0 (0.0%) |
| 5 to 9 Year Old | 55 (63.9%) | 31 (36.0%) |
| 10 to 14 Year Olds | 39 (83.0%) | 8 (17.0%) |
| 15 to 17 Year Olds | 30 (100.0%) | 0 (0.0%) |
| 18 to 19 Year Olds | 0 (0.0%) | 0 (0.0%) |
| 20 to 24 Year Olds | 6 (100.0%) | 0 (0.0%) |
| 25 to 34 Year Olds | 3 (100.0%) | 0 (0.0%) |
| 35 Years and over | 2 (66.7%) | 1 (33.3%) |
| Total | 149 (78.8%) | 40 (21.2%) |
Educational Attainment by Field of Study in Augusta
Education (20 | 16.8%), arts & humanities (19 | 16.0%), engineering (17 | 14.3%), business (13 | 10.9%), and bio, nature & agricultural (11 | 9.2%) are the most common fields of study among 119 individuals in Augusta who have obtained a bachelor's degree or higher.
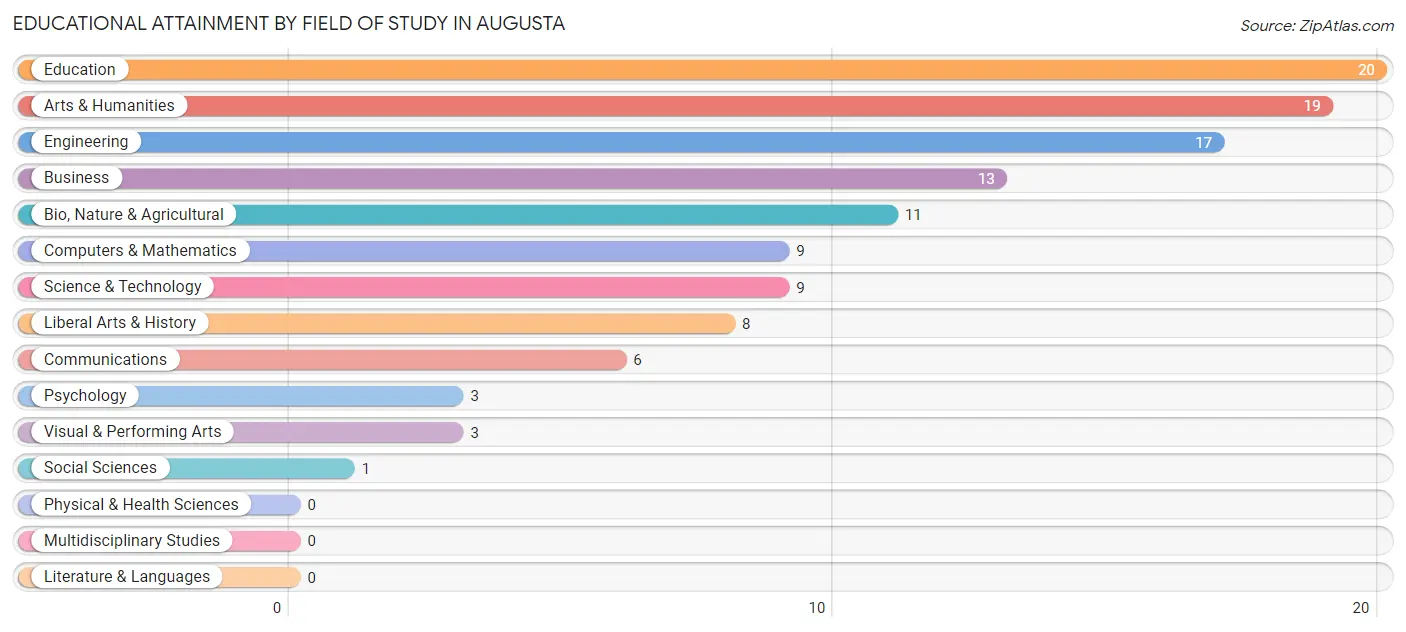
| Field of Study | # Graduates | % Graduates |
| Computers & Mathematics | 9 | 7.6% |
| Bio, Nature & Agricultural | 11 | 9.2% |
| Physical & Health Sciences | 0 | 0.0% |
| Psychology | 3 | 2.5% |
| Social Sciences | 1 | 0.8% |
| Engineering | 17 | 14.3% |
| Multidisciplinary Studies | 0 | 0.0% |
| Science & Technology | 9 | 7.6% |
| Business | 13 | 10.9% |
| Education | 20 | 16.8% |
| Literature & Languages | 0 | 0.0% |
| Liberal Arts & History | 8 | 6.7% |
| Visual & Performing Arts | 3 | 2.5% |
| Communications | 6 | 5.0% |
| Arts & Humanities | 19 | 16.0% |
| Total | 119 | 100.0% |
Transportation & Commute in Augusta
Vehicle Availability by Sex in Augusta
The most prevalent vehicle ownership categories in Augusta are males with 2 vehicles (78, accounting for 30.3%) and females with 2 vehicles (53, making up 33.1%).
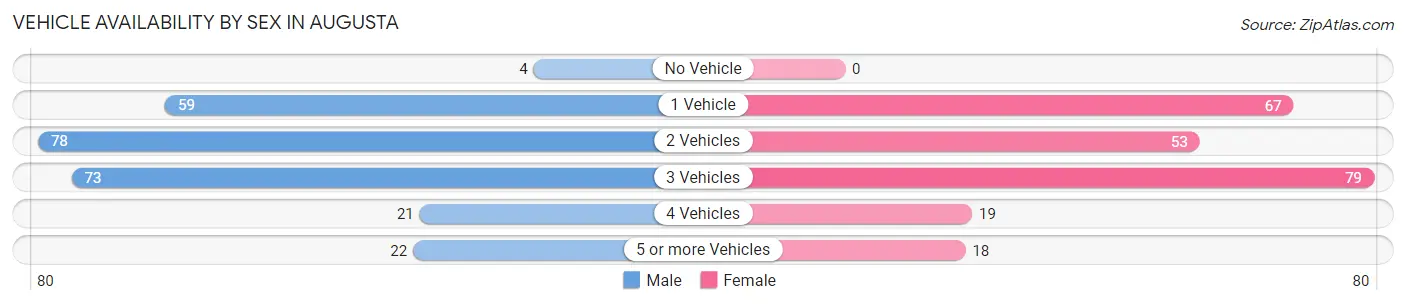
| Vehicles Available | Male | Female |
| No Vehicle | 4 (1.6%) | 0 (0.0%) |
| 1 Vehicle | 59 (23.0%) | 67 (28.4%) |
| 2 Vehicles | 78 (30.3%) | 53 (22.5%) |
| 3 Vehicles | 73 (28.4%) | 79 (33.5%) |
| 4 Vehicles | 21 (8.2%) | 19 (8.1%) |
| 5 or more Vehicles | 22 (8.6%) | 18 (7.6%) |
| Total | 257 (100.0%) | 236 (100.0%) |
Commute Time in Augusta
The most frequently occuring commute durations in Augusta are 5 to 9 minutes (87 commuters, 19.4%), 15 to 19 minutes (62 commuters, 13.8%), and 30 to 34 minutes (55 commuters, 12.3%).
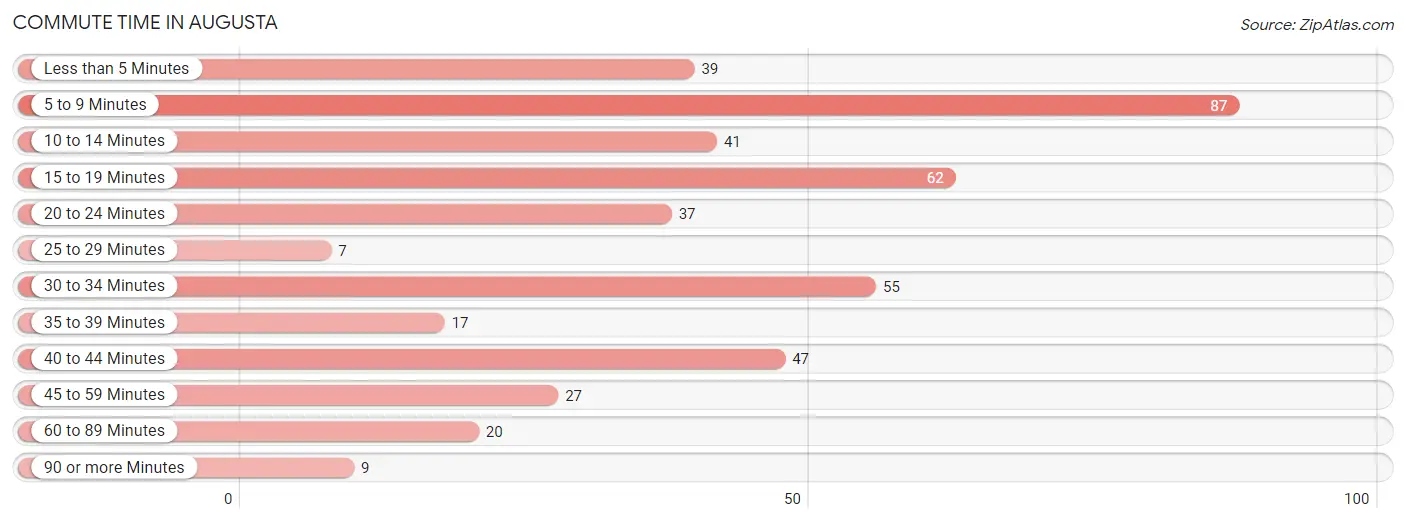
| Commute Time | # Commuters | % Commuters |
| Less than 5 Minutes | 39 | 8.7% |
| 5 to 9 Minutes | 87 | 19.4% |
| 10 to 14 Minutes | 41 | 9.1% |
| 15 to 19 Minutes | 62 | 13.8% |
| 20 to 24 Minutes | 37 | 8.3% |
| 25 to 29 Minutes | 7 | 1.6% |
| 30 to 34 Minutes | 55 | 12.3% |
| 35 to 39 Minutes | 17 | 3.8% |
| 40 to 44 Minutes | 47 | 10.5% |
| 45 to 59 Minutes | 27 | 6.0% |
| 60 to 89 Minutes | 20 | 4.5% |
| 90 or more Minutes | 9 | 2.0% |
Commute Time by Sex in Augusta
The most common commute times in Augusta are 30 to 34 minutes (41 commuters, 17.7%) for males and 5 to 9 minutes (56 commuters, 25.8%) for females.
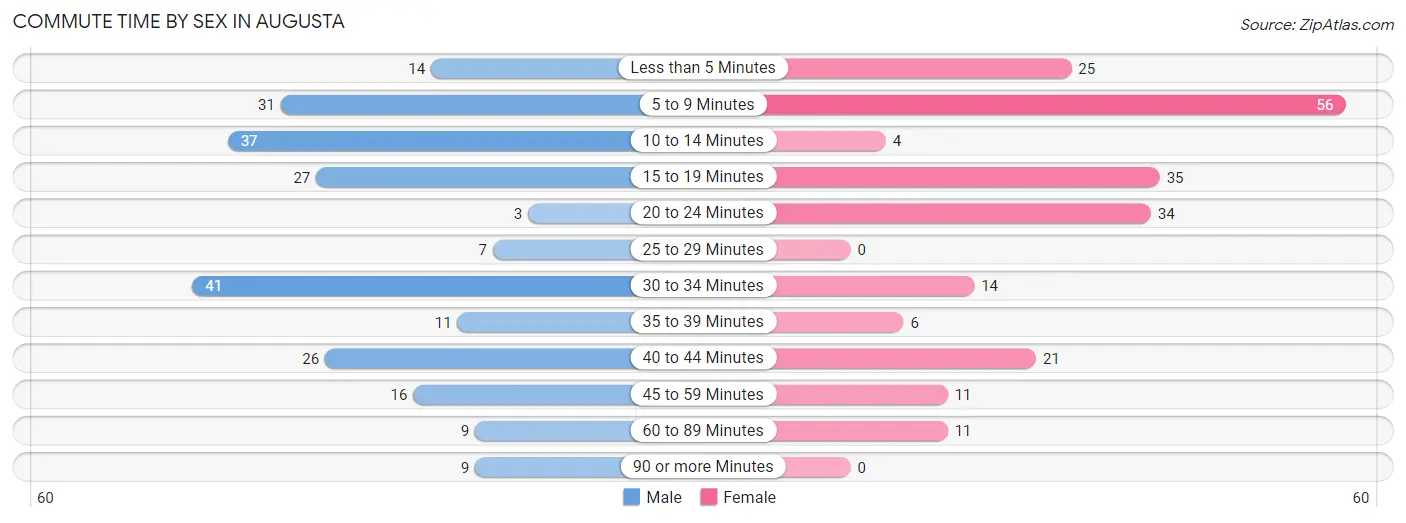
| Commute Time | Male | Female |
| Less than 5 Minutes | 14 (6.1%) | 25 (11.5%) |
| 5 to 9 Minutes | 31 (13.4%) | 56 (25.8%) |
| 10 to 14 Minutes | 37 (16.0%) | 4 (1.8%) |
| 15 to 19 Minutes | 27 (11.7%) | 35 (16.1%) |
| 20 to 24 Minutes | 3 (1.3%) | 34 (15.7%) |
| 25 to 29 Minutes | 7 (3.0%) | 0 (0.0%) |
| 30 to 34 Minutes | 41 (17.7%) | 14 (6.5%) |
| 35 to 39 Minutes | 11 (4.8%) | 6 (2.8%) |
| 40 to 44 Minutes | 26 (11.3%) | 21 (9.7%) |
| 45 to 59 Minutes | 16 (6.9%) | 11 (5.1%) |
| 60 to 89 Minutes | 9 (3.9%) | 11 (5.1%) |
| 90 or more Minutes | 9 (3.9%) | 0 (0.0%) |
Time of Departure to Work by Sex in Augusta
The most frequent times of departure to work in Augusta are 12:00 AM to 4:59 AM (39, 16.9%) for males and 7:30 AM to 7:59 AM (49, 22.6%) for females.
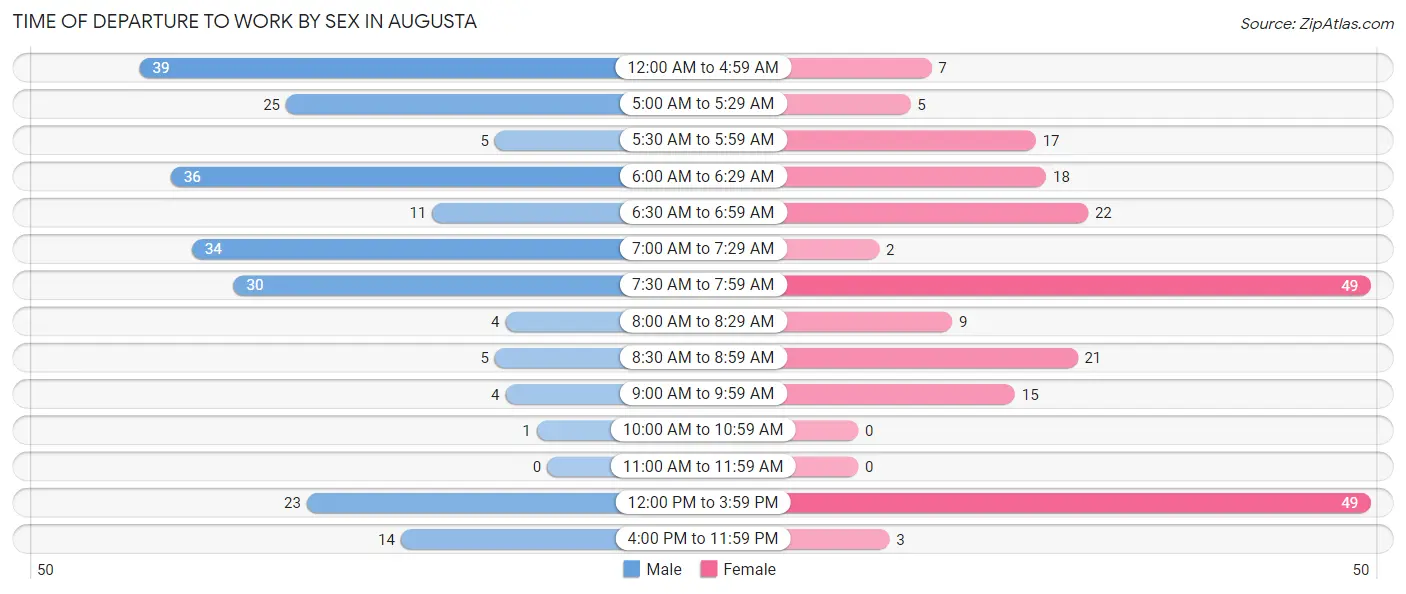
| Time of Departure | Male | Female |
| 12:00 AM to 4:59 AM | 39 (16.9%) | 7 (3.2%) |
| 5:00 AM to 5:29 AM | 25 (10.8%) | 5 (2.3%) |
| 5:30 AM to 5:59 AM | 5 (2.2%) | 17 (7.8%) |
| 6:00 AM to 6:29 AM | 36 (15.6%) | 18 (8.3%) |
| 6:30 AM to 6:59 AM | 11 (4.8%) | 22 (10.1%) |
| 7:00 AM to 7:29 AM | 34 (14.7%) | 2 (0.9%) |
| 7:30 AM to 7:59 AM | 30 (13.0%) | 49 (22.6%) |
| 8:00 AM to 8:29 AM | 4 (1.7%) | 9 (4.2%) |
| 8:30 AM to 8:59 AM | 5 (2.2%) | 21 (9.7%) |
| 9:00 AM to 9:59 AM | 4 (1.7%) | 15 (6.9%) |
| 10:00 AM to 10:59 AM | 1 (0.4%) | 0 (0.0%) |
| 11:00 AM to 11:59 AM | 0 (0.0%) | 0 (0.0%) |
| 12:00 PM to 3:59 PM | 23 (10.0%) | 49 (22.6%) |
| 4:00 PM to 11:59 PM | 14 (6.1%) | 3 (1.4%) |
| Total | 231 (100.0%) | 217 (100.0%) |
Housing Occupancy in Augusta
Occupancy by Ownership in Augusta
Of the total 511 dwellings in Augusta, owner-occupied units account for 348 (68.1%), while renter-occupied units make up 163 (31.9%).
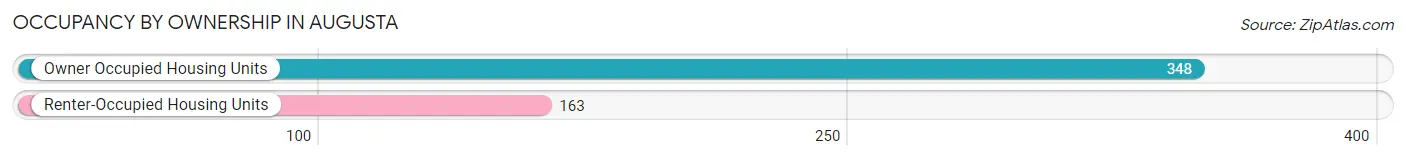
| Occupancy | # Housing Units | % Housing Units |
| Owner Occupied Housing Units | 348 | 68.1% |
| Renter-Occupied Housing Units | 163 | 31.9% |
| Total Occupied Housing Units | 511 | 100.0% |
Occupancy by Household Size in Augusta
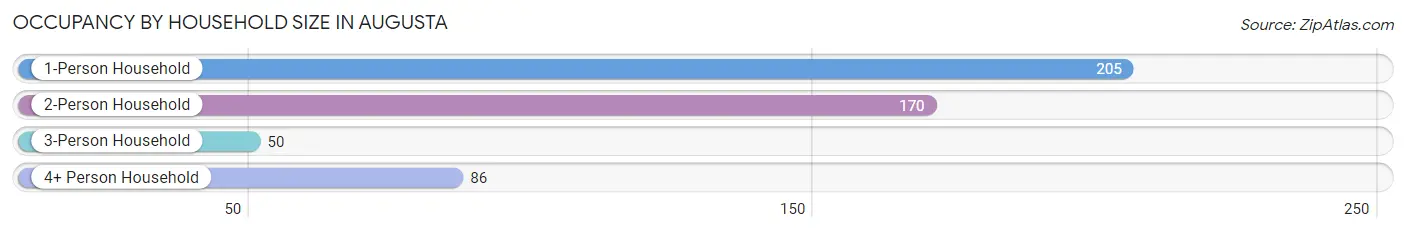
| Household Size | # Housing Units | % Housing Units |
| 1-Person Household | 205 | 40.1% |
| 2-Person Household | 170 | 33.3% |
| 3-Person Household | 50 | 9.8% |
| 4+ Person Household | 86 | 16.8% |
| Total Housing Units | 511 | 100.0% |
Occupancy by Ownership by Household Size in Augusta
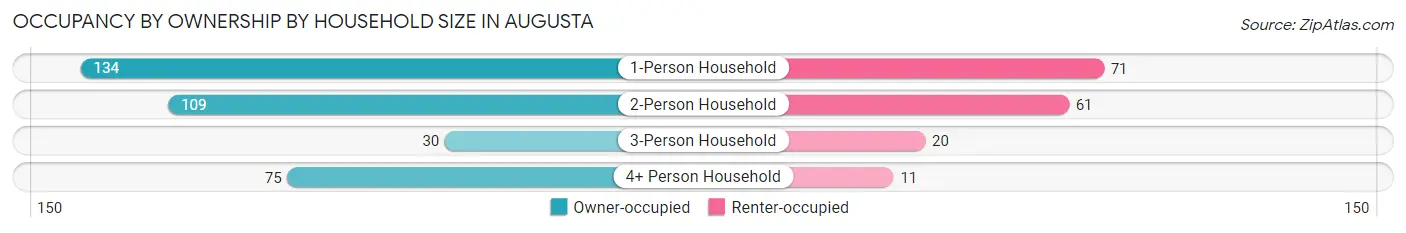
| Household Size | Owner-occupied | Renter-occupied |
| 1-Person Household | 134 (65.4%) | 71 (34.6%) |
| 2-Person Household | 109 (64.1%) | 61 (35.9%) |
| 3-Person Household | 30 (60.0%) | 20 (40.0%) |
| 4+ Person Household | 75 (87.2%) | 11 (12.8%) |
| Total Housing Units | 348 (68.1%) | 163 (31.9%) |
Occupancy by Educational Attainment in Augusta
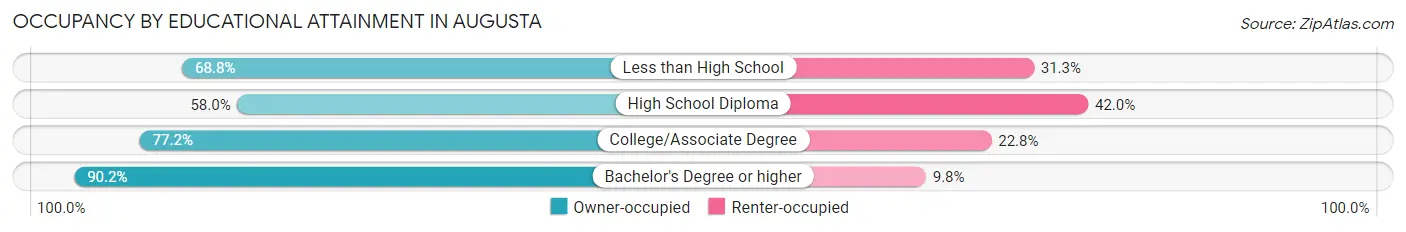
| Household Size | Owner-occupied | Renter-occupied |
| Less than High School | 22 (68.8%) | 10 (31.2%) |
| High School Diploma | 156 (58.0%) | 113 (42.0%) |
| College/Associate Degree | 115 (77.2%) | 34 (22.8%) |
| Bachelor's Degree or higher | 55 (90.2%) | 6 (9.8%) |
Occupancy by Age of Householder in Augusta
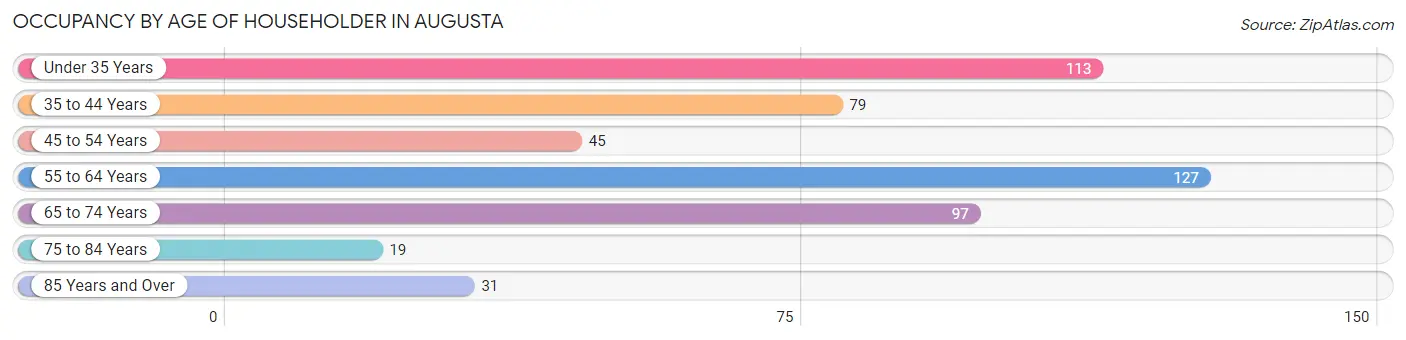
| Age Bracket | # Households | % Households |
| Under 35 Years | 113 | 22.1% |
| 35 to 44 Years | 79 | 15.5% |
| 45 to 54 Years | 45 | 8.8% |
| 55 to 64 Years | 127 | 24.8% |
| 65 to 74 Years | 97 | 19.0% |
| 75 to 84 Years | 19 | 3.7% |
| 85 Years and Over | 31 | 6.1% |
| Total | 511 | 100.0% |
Housing Finances in Augusta
Median Income by Occupancy in Augusta
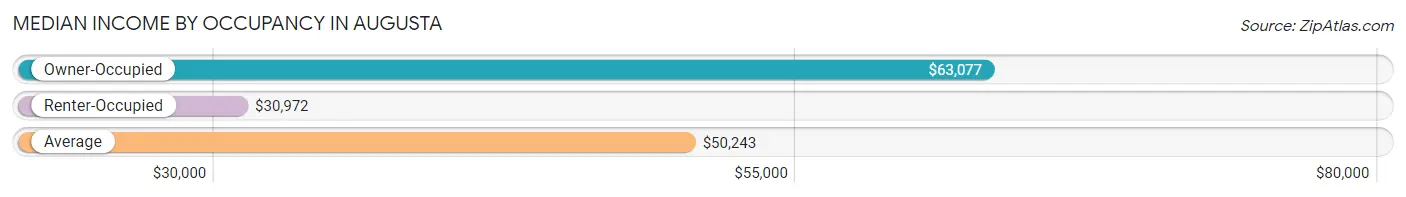
| Occupancy Type | # Households | Median Income |
| Owner-Occupied | 348 (68.1%) | $63,077 |
| Renter-Occupied | 163 (31.9%) | $30,972 |
| Average | 511 (100.0%) | $50,243 |
Occupancy by Householder Income Bracket in Augusta
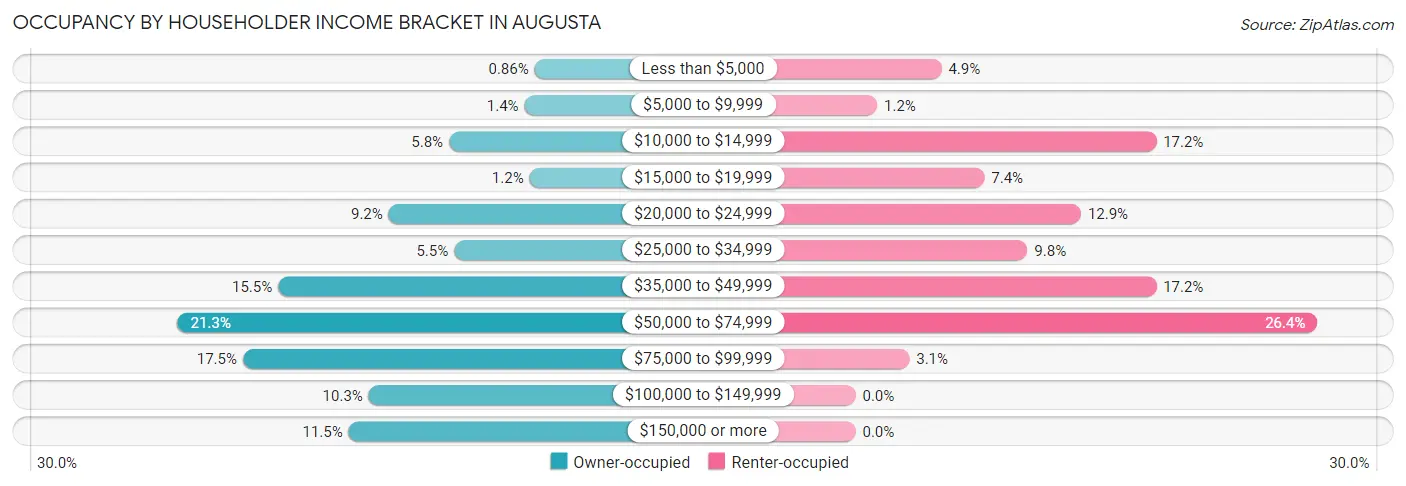
| Income Bracket | Owner-occupied | Renter-occupied |
| Less than $5,000 | 3 (0.9%) | 8 (4.9%) |
| $5,000 to $9,999 | 5 (1.4%) | 2 (1.2%) |
| $10,000 to $14,999 | 20 (5.8%) | 28 (17.2%) |
| $15,000 to $19,999 | 4 (1.1%) | 12 (7.4%) |
| $20,000 to $24,999 | 32 (9.2%) | 21 (12.9%) |
| $25,000 to $34,999 | 19 (5.5%) | 16 (9.8%) |
| $35,000 to $49,999 | 54 (15.5%) | 28 (17.2%) |
| $50,000 to $74,999 | 74 (21.3%) | 43 (26.4%) |
| $75,000 to $99,999 | 61 (17.5%) | 5 (3.1%) |
| $100,000 to $149,999 | 36 (10.3%) | 0 (0.0%) |
| $150,000 or more | 40 (11.5%) | 0 (0.0%) |
| Total | 348 (100.0%) | 163 (100.0%) |
Monthly Housing Cost Tiers in Augusta
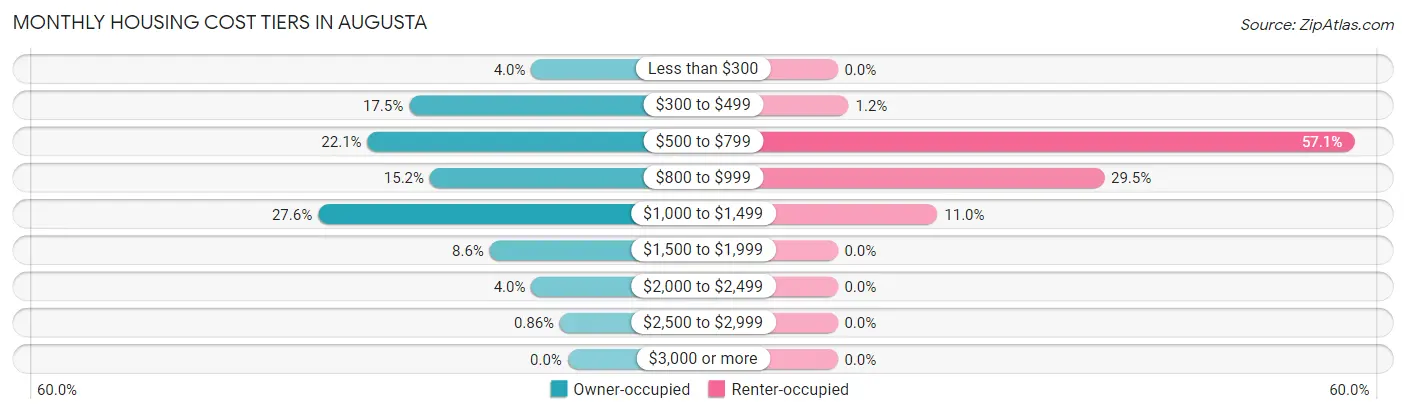
| Monthly Cost | Owner-occupied | Renter-occupied |
| Less than $300 | 14 (4.0%) | 0 (0.0%) |
| $300 to $499 | 61 (17.5%) | 2 (1.2%) |
| $500 to $799 | 77 (22.1%) | 93 (57.1%) |
| $800 to $999 | 53 (15.2%) | 48 (29.4%) |
| $1,000 to $1,499 | 96 (27.6%) | 18 (11.0%) |
| $1,500 to $1,999 | 30 (8.6%) | 0 (0.0%) |
| $2,000 to $2,499 | 14 (4.0%) | 0 (0.0%) |
| $2,500 to $2,999 | 3 (0.9%) | 0 (0.0%) |
| $3,000 or more | 0 (0.0%) | 0 (0.0%) |
| Total | 348 (100.0%) | 163 (100.0%) |
Physical Housing Characteristics in Augusta
Housing Structures in Augusta
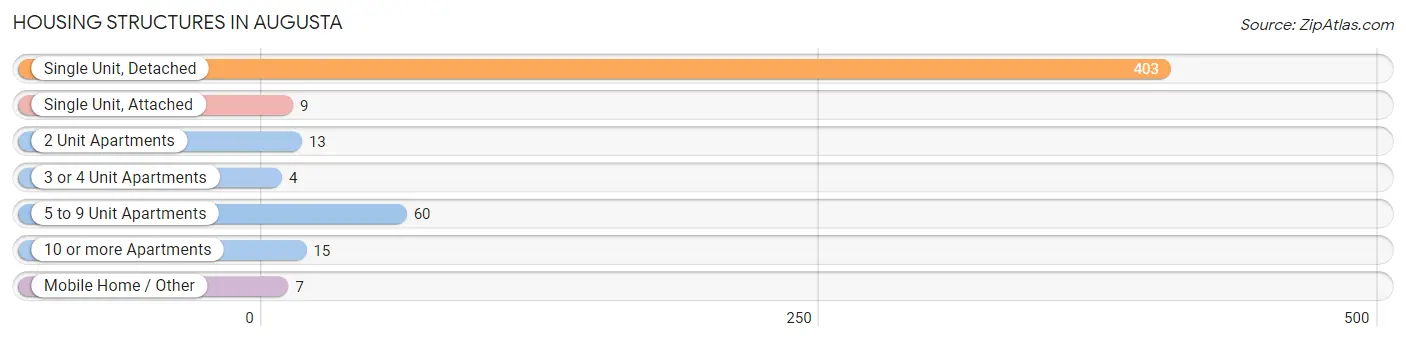
| Structure Type | # Housing Units | % Housing Units |
| Single Unit, Detached | 403 | 78.9% |
| Single Unit, Attached | 9 | 1.8% |
| 2 Unit Apartments | 13 | 2.5% |
| 3 or 4 Unit Apartments | 4 | 0.8% |
| 5 to 9 Unit Apartments | 60 | 11.7% |
| 10 or more Apartments | 15 | 2.9% |
| Mobile Home / Other | 7 | 1.4% |
| Total | 511 | 100.0% |
Housing Structures by Occupancy in Augusta
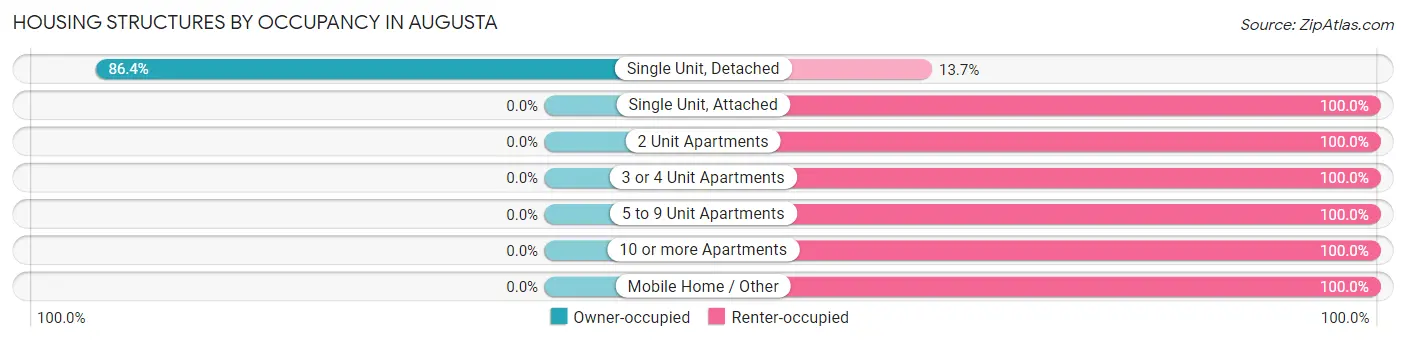
| Structure Type | Owner-occupied | Renter-occupied |
| Single Unit, Detached | 348 (86.4%) | 55 (13.7%) |
| Single Unit, Attached | 0 (0.0%) | 9 (100.0%) |
| 2 Unit Apartments | 0 (0.0%) | 13 (100.0%) |
| 3 or 4 Unit Apartments | 0 (0.0%) | 4 (100.0%) |
| 5 to 9 Unit Apartments | 0 (0.0%) | 60 (100.0%) |
| 10 or more Apartments | 0 (0.0%) | 15 (100.0%) |
| Mobile Home / Other | 0 (0.0%) | 7 (100.0%) |
| Total | 348 (68.1%) | 163 (31.9%) |
Housing Structures by Number of Rooms in Augusta
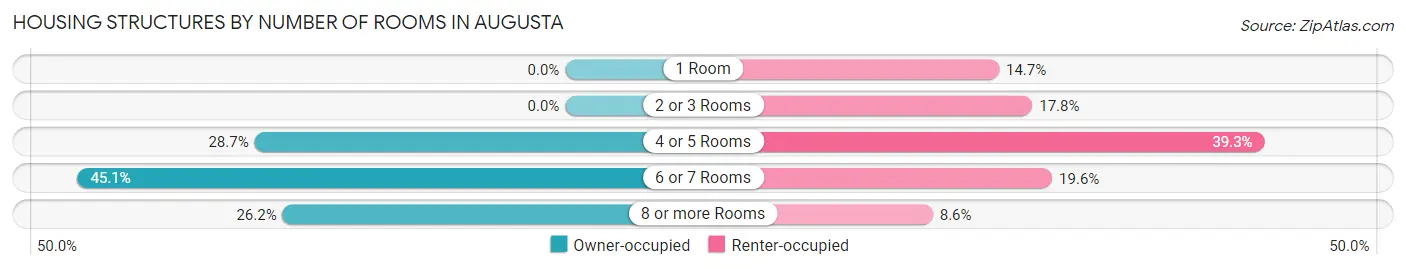
| Number of Rooms | Owner-occupied | Renter-occupied |
| 1 Room | 0 (0.0%) | 24 (14.7%) |
| 2 or 3 Rooms | 0 (0.0%) | 29 (17.8%) |
| 4 or 5 Rooms | 100 (28.7%) | 64 (39.3%) |
| 6 or 7 Rooms | 157 (45.1%) | 32 (19.6%) |
| 8 or more Rooms | 91 (26.2%) | 14 (8.6%) |
| Total | 348 (100.0%) | 163 (100.0%) |
Housing Structure by Heating Type in Augusta
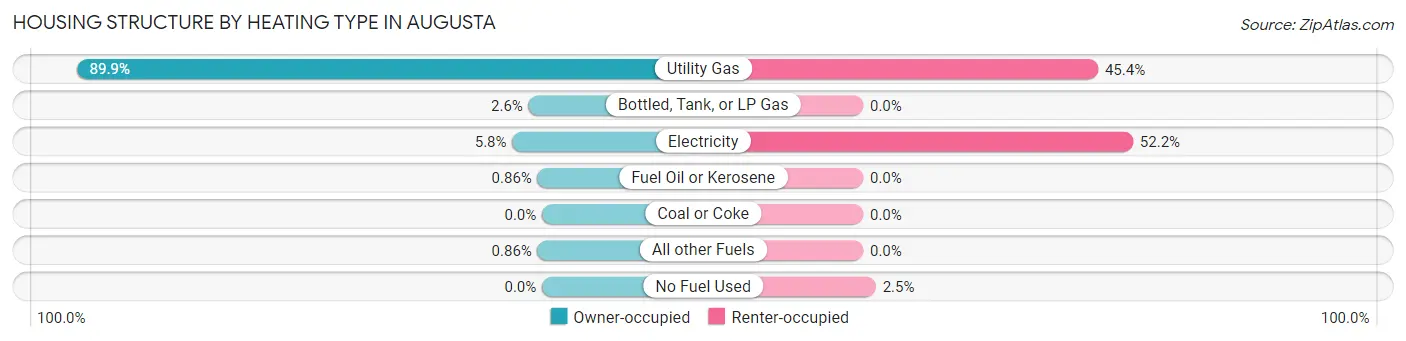
| Heating Type | Owner-occupied | Renter-occupied |
| Utility Gas | 313 (89.9%) | 74 (45.4%) |
| Bottled, Tank, or LP Gas | 9 (2.6%) | 0 (0.0%) |
| Electricity | 20 (5.8%) | 85 (52.1%) |
| Fuel Oil or Kerosene | 3 (0.9%) | 0 (0.0%) |
| Coal or Coke | 0 (0.0%) | 0 (0.0%) |
| All other Fuels | 3 (0.9%) | 0 (0.0%) |
| No Fuel Used | 0 (0.0%) | 4 (2.5%) |
| Total | 348 (100.0%) | 163 (100.0%) |
Household Vehicle Usage in Augusta
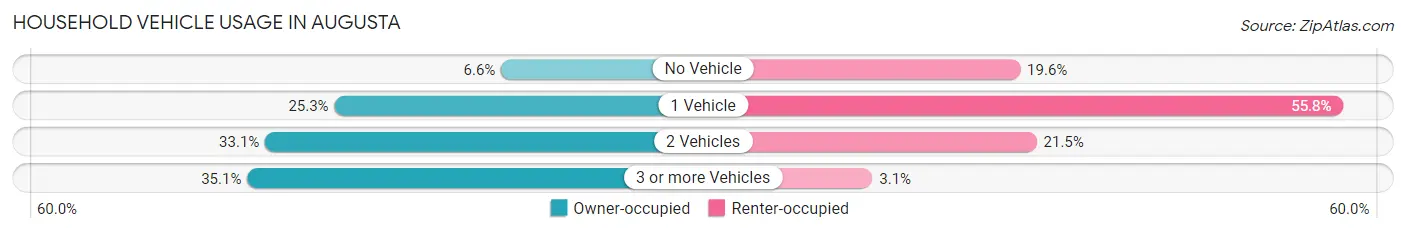
| Vehicles per Household | Owner-occupied | Renter-occupied |
| No Vehicle | 23 (6.6%) | 32 (19.6%) |
| 1 Vehicle | 88 (25.3%) | 91 (55.8%) |
| 2 Vehicles | 115 (33.1%) | 35 (21.5%) |
| 3 or more Vehicles | 122 (35.1%) | 5 (3.1%) |
| Total | 348 (100.0%) | 163 (100.0%) |
Real Estate & Mortgages in Augusta
Real Estate and Mortgage Overview in Augusta
| Characteristic | Without Mortgage | With Mortgage |
| Housing Units | 110 | 238 |
| Median Property Value | $138,800 | $132,200 |
| Median Household Income | $44,167 | $35 |
| Monthly Housing Costs | $464 | $0 |
| Real Estate Taxes | $2,117 | $0 |
Property Value by Mortgage Status in Augusta
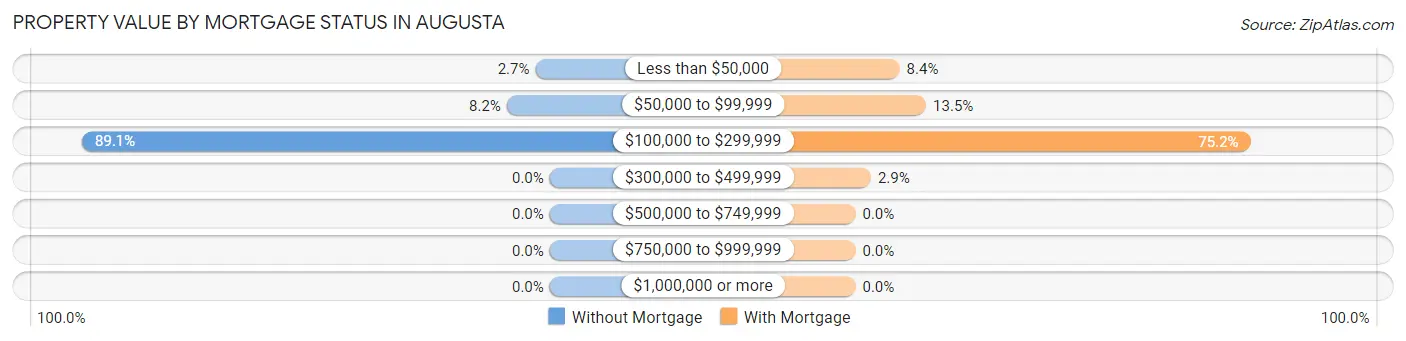
| Property Value | Without Mortgage | With Mortgage |
| Less than $50,000 | 3 (2.7%) | 20 (8.4%) |
| $50,000 to $99,999 | 9 (8.2%) | 32 (13.5%) |
| $100,000 to $299,999 | 98 (89.1%) | 179 (75.2%) |
| $300,000 to $499,999 | 0 (0.0%) | 7 (2.9%) |
| $500,000 to $749,999 | 0 (0.0%) | 0 (0.0%) |
| $750,000 to $999,999 | 0 (0.0%) | 0 (0.0%) |
| $1,000,000 or more | 0 (0.0%) | 0 (0.0%) |
| Total | 110 (100.0%) | 238 (100.0%) |
Household Income by Mortgage Status in Augusta
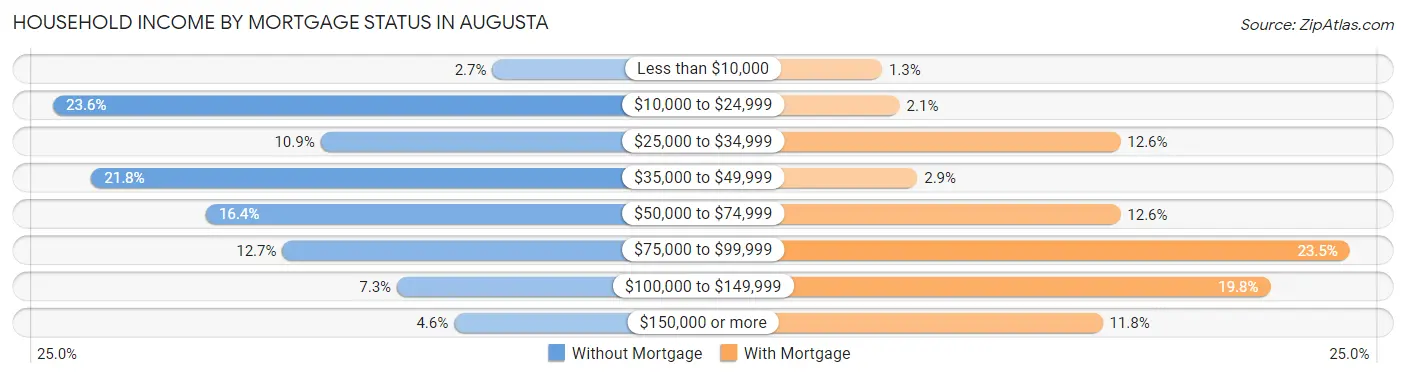
| Household Income | Without Mortgage | With Mortgage |
| Less than $10,000 | 3 (2.7%) | 3 (1.3%) |
| $10,000 to $24,999 | 26 (23.6%) | 5 (2.1%) |
| $25,000 to $34,999 | 12 (10.9%) | 30 (12.6%) |
| $35,000 to $49,999 | 24 (21.8%) | 7 (2.9%) |
| $50,000 to $74,999 | 18 (16.4%) | 30 (12.6%) |
| $75,000 to $99,999 | 14 (12.7%) | 56 (23.5%) |
| $100,000 to $149,999 | 8 (7.3%) | 47 (19.8%) |
| $150,000 or more | 5 (4.5%) | 28 (11.8%) |
| Total | 110 (100.0%) | 238 (100.0%) |
Property Value to Household Income Ratio in Augusta
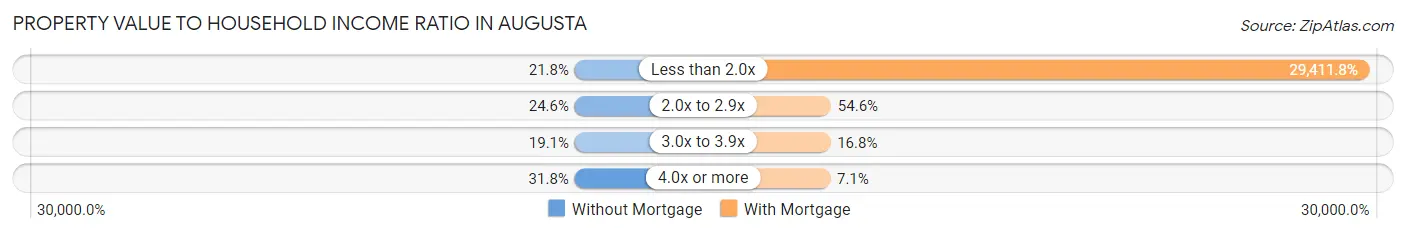
| Value-to-Income Ratio | Without Mortgage | With Mortgage |
| Less than 2.0x | 24 (21.8%) | 70,000 (29,411.8%) |
| 2.0x to 2.9x | 27 (24.5%) | 130 (54.6%) |
| 3.0x to 3.9x | 21 (19.1%) | 40 (16.8%) |
| 4.0x or more | 35 (31.8%) | 17 (7.1%) |
| Total | 110 (100.0%) | 238 (100.0%) |
Real Estate Taxes by Mortgage Status in Augusta
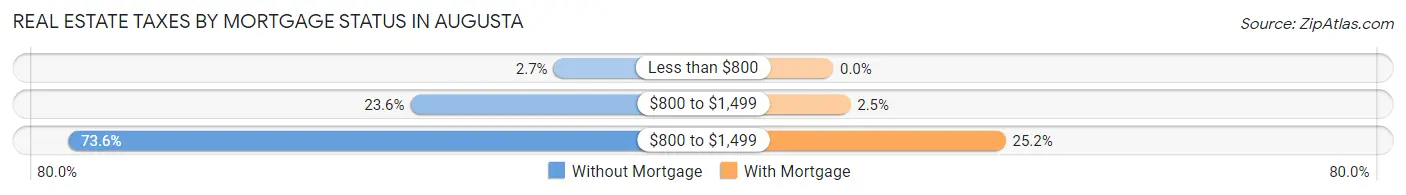
| Property Taxes | Without Mortgage | With Mortgage |
| Less than $800 | 3 (2.7%) | 0 (0.0%) |
| $800 to $1,499 | 26 (23.6%) | 6 (2.5%) |
| $800 to $1,499 | 81 (73.6%) | 60 (25.2%) |
| Total | 110 (100.0%) | 238 (100.0%) |
Health & Disability in Augusta
Health Insurance Coverage by Age in Augusta
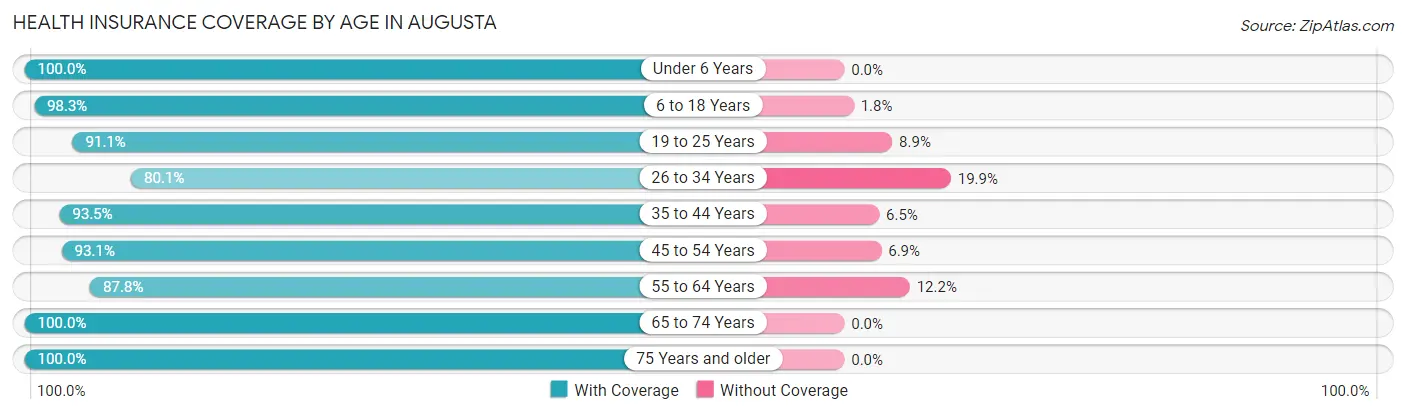
| Age Bracket | With Coverage | Without Coverage |
| Under 6 Years | 123 (100.0%) | 0 (0.0%) |
| 6 to 18 Years | 168 (98.3%) | 3 (1.8%) |
| 19 to 25 Years | 102 (91.1%) | 10 (8.9%) |
| 26 to 34 Years | 113 (80.1%) | 28 (19.9%) |
| 35 to 44 Years | 144 (93.5%) | 10 (6.5%) |
| 45 to 54 Years | 81 (93.1%) | 6 (6.9%) |
| 55 to 64 Years | 180 (87.8%) | 25 (12.2%) |
| 65 to 74 Years | 127 (100.0%) | 0 (0.0%) |
| 75 Years and older | 79 (100.0%) | 0 (0.0%) |
| Total | 1,117 (93.2%) | 82 (6.8%) |
Health Insurance Coverage by Citizenship Status in Augusta
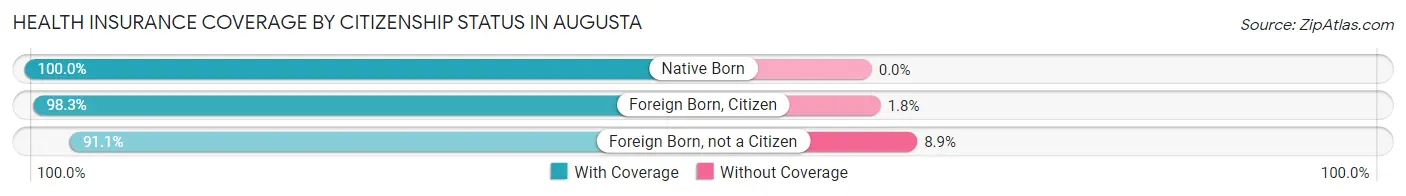
| Citizenship Status | With Coverage | Without Coverage |
| Native Born | 123 (100.0%) | 0 (0.0%) |
| Foreign Born, Citizen | 168 (98.3%) | 3 (1.8%) |
| Foreign Born, not a Citizen | 102 (91.1%) | 10 (8.9%) |
Health Insurance Coverage by Household Income in Augusta
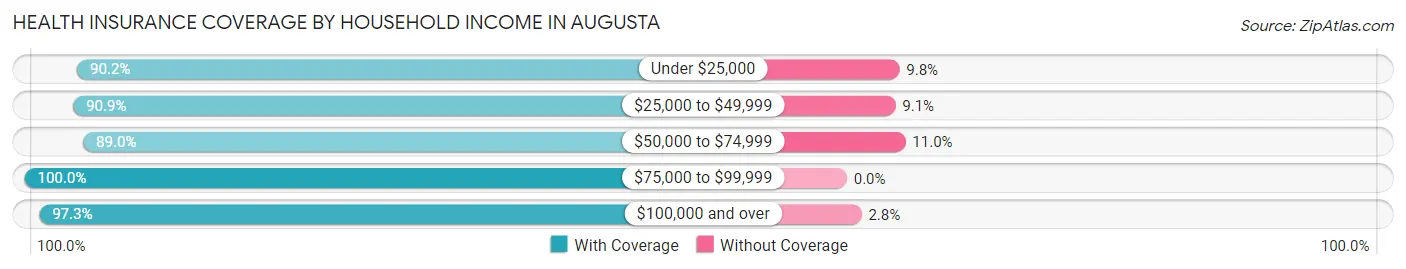
| Household Income | With Coverage | Without Coverage |
| Under $25,000 | 165 (90.2%) | 18 (9.8%) |
| $25,000 to $49,999 | 280 (90.9%) | 28 (9.1%) |
| $50,000 to $74,999 | 227 (89.0%) | 28 (11.0%) |
| $75,000 to $99,999 | 154 (100.0%) | 0 (0.0%) |
| $100,000 and over | 283 (97.3%) | 8 (2.8%) |
Public vs Private Health Insurance Coverage by Age in Augusta
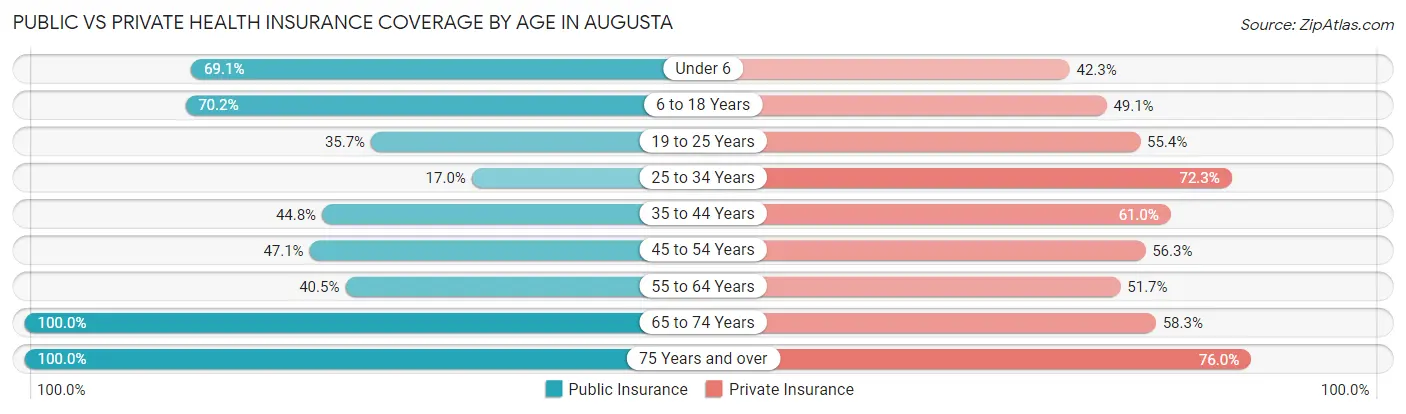
| Age Bracket | Public Insurance | Private Insurance |
| Under 6 | 85 (69.1%) | 52 (42.3%) |
| 6 to 18 Years | 120 (70.2%) | 84 (49.1%) |
| 19 to 25 Years | 40 (35.7%) | 62 (55.4%) |
| 25 to 34 Years | 24 (17.0%) | 102 (72.3%) |
| 35 to 44 Years | 69 (44.8%) | 94 (61.0%) |
| 45 to 54 Years | 41 (47.1%) | 49 (56.3%) |
| 55 to 64 Years | 83 (40.5%) | 106 (51.7%) |
| 65 to 74 Years | 127 (100.0%) | 74 (58.3%) |
| 75 Years and over | 79 (100.0%) | 60 (75.9%) |
| Total | 668 (55.7%) | 683 (57.0%) |
Disability Status by Sex by Age in Augusta
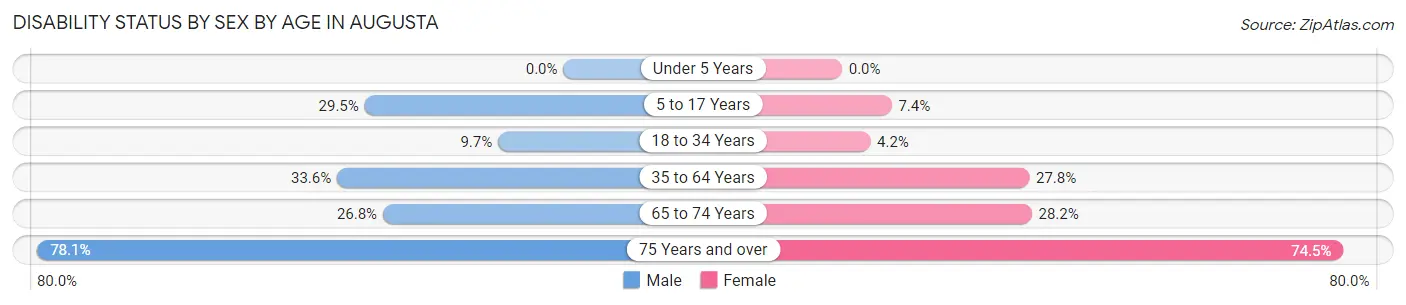
| Age Bracket | Male | Female |
| Under 5 Years | 0 (0.0%) | 0 (0.0%) |
| 5 to 17 Years | 18 (29.5%) | 9 (7.4%) |
| 18 to 34 Years | 13 (9.7%) | 5 (4.2%) |
| 35 to 64 Years | 81 (33.6%) | 57 (27.8%) |
| 65 to 74 Years | 15 (26.8%) | 20 (28.2%) |
| 75 Years and over | 25 (78.1%) | 35 (74.5%) |
Disability Class by Sex by Age in Augusta
Disability Class: Hearing Difficulty
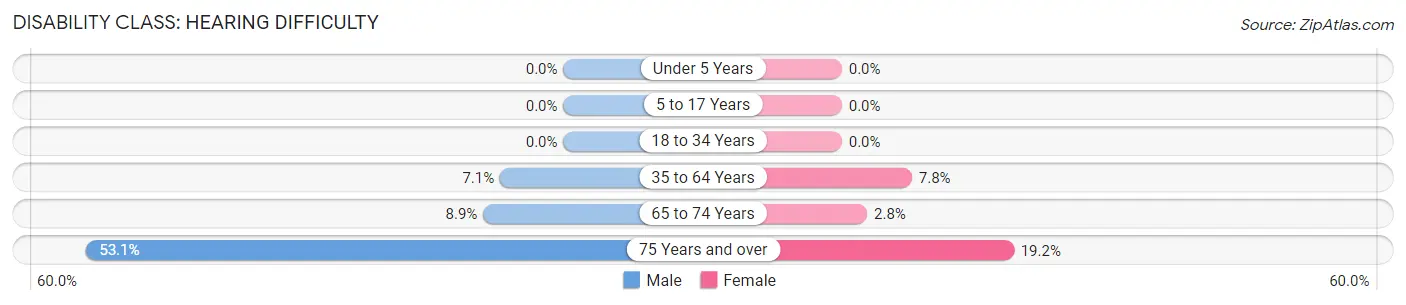
| Age Bracket | Male | Female |
| Under 5 Years | 0 (0.0%) | 0 (0.0%) |
| 5 to 17 Years | 0 (0.0%) | 0 (0.0%) |
| 18 to 34 Years | 0 (0.0%) | 0 (0.0%) |
| 35 to 64 Years | 17 (7.0%) | 16 (7.8%) |
| 65 to 74 Years | 5 (8.9%) | 2 (2.8%) |
| 75 Years and over | 17 (53.1%) | 9 (19.2%) |
Disability Class: Vision Difficulty
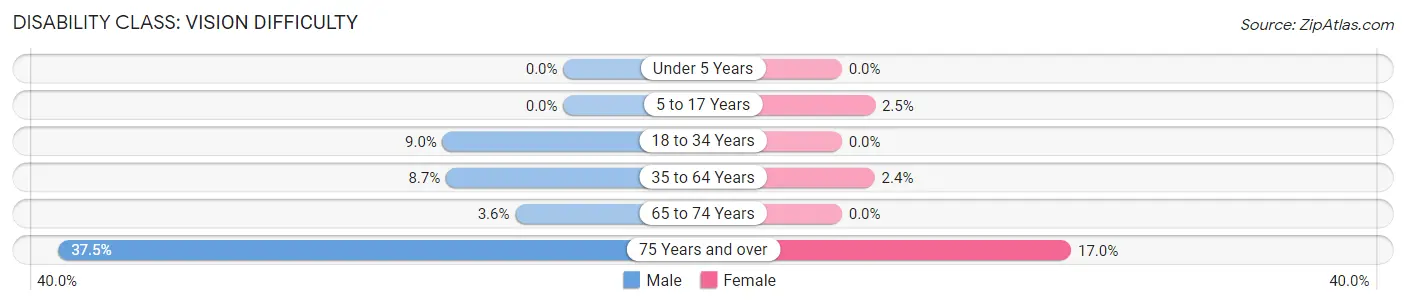
| Age Bracket | Male | Female |
| Under 5 Years | 0 (0.0%) | 0 (0.0%) |
| 5 to 17 Years | 0 (0.0%) | 3 (2.5%) |
| 18 to 34 Years | 12 (9.0%) | 0 (0.0%) |
| 35 to 64 Years | 21 (8.7%) | 5 (2.4%) |
| 65 to 74 Years | 2 (3.6%) | 0 (0.0%) |
| 75 Years and over | 12 (37.5%) | 8 (17.0%) |
Disability Class: Cognitive Difficulty
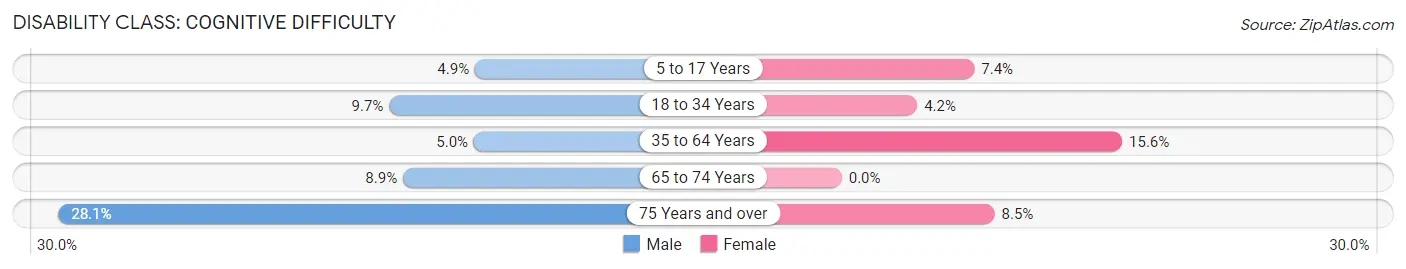
| Age Bracket | Male | Female |
| 5 to 17 Years | 3 (4.9%) | 9 (7.4%) |
| 18 to 34 Years | 13 (9.7%) | 5 (4.2%) |
| 35 to 64 Years | 12 (5.0%) | 32 (15.6%) |
| 65 to 74 Years | 5 (8.9%) | 0 (0.0%) |
| 75 Years and over | 9 (28.1%) | 4 (8.5%) |
Disability Class: Ambulatory Difficulty
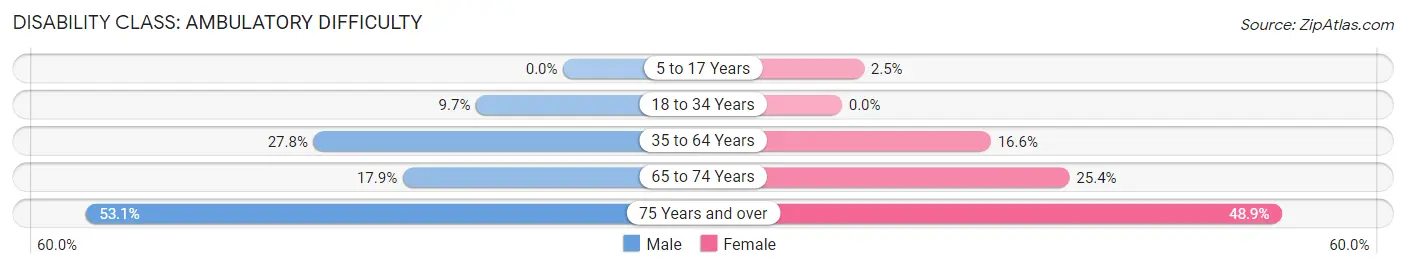
| Age Bracket | Male | Female |
| 5 to 17 Years | 0 (0.0%) | 3 (2.5%) |
| 18 to 34 Years | 13 (9.7%) | 0 (0.0%) |
| 35 to 64 Years | 67 (27.8%) | 34 (16.6%) |
| 65 to 74 Years | 10 (17.9%) | 18 (25.4%) |
| 75 Years and over | 17 (53.1%) | 23 (48.9%) |
Disability Class: Self-Care Difficulty
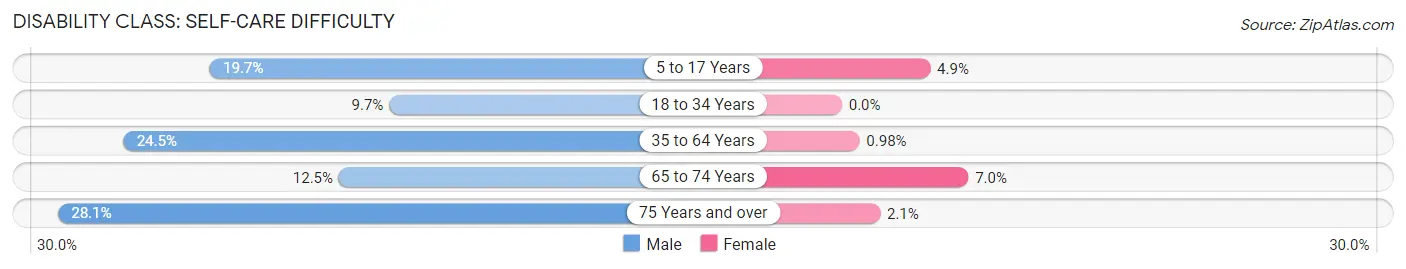
| Age Bracket | Male | Female |
| 5 to 17 Years | 12 (19.7%) | 6 (4.9%) |
| 18 to 34 Years | 13 (9.7%) | 0 (0.0%) |
| 35 to 64 Years | 59 (24.5%) | 2 (1.0%) |
| 65 to 74 Years | 7 (12.5%) | 5 (7.0%) |
| 75 Years and over | 9 (28.1%) | 1 (2.1%) |
Technology Access in Augusta
Computing Device Access in Augusta
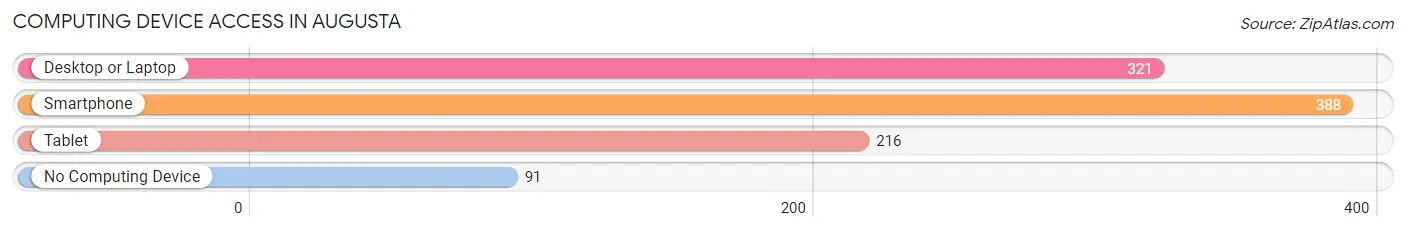
| Device Type | # Households | % Households |
| Desktop or Laptop | 321 | 62.8% |
| Smartphone | 388 | 75.9% |
| Tablet | 216 | 42.3% |
| No Computing Device | 91 | 17.8% |
| Total | 511 | 100.0% |
Internet Access in Augusta
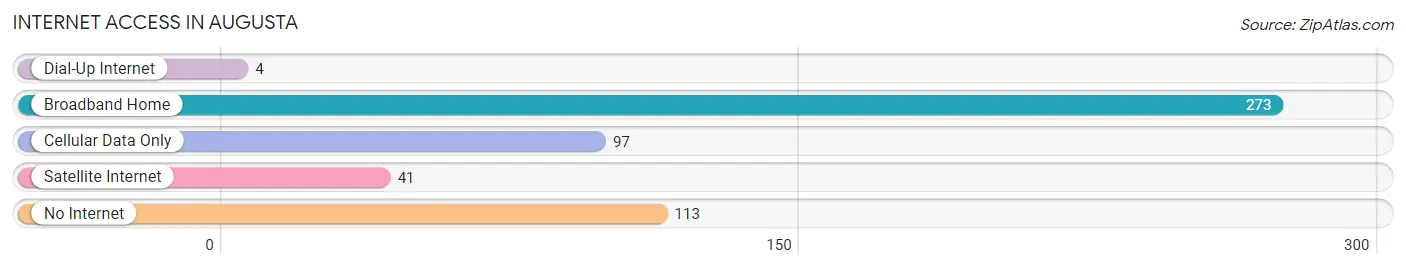
| Internet Type | # Households | % Households |
| Dial-Up Internet | 4 | 0.8% |
| Broadband Home | 273 | 53.4% |
| Cellular Data Only | 97 | 19.0% |
| Satellite Internet | 41 | 8.0% |
| No Internet | 113 | 22.1% |
| Total | 511 | 100.0% |
Augusta Summary
Augusta, Wisconsin is a small city located in Eau Claire County, in the western part of the state. It is situated on the banks of the Chippewa River, and is part of the Eau Claire metropolitan area. The city has a population of approximately 2,500 people, and is the county seat of Eau Claire County.
History
Augusta was first settled in 1854 by a group of settlers from New York. The city was named after Augusta, Maine, and was incorporated in 1872. The city was originally a lumber town, and the lumber industry was the main source of income for the city. In the late 19th century, the city was also home to a number of factories, including a paper mill, a flour mill, and a sawmill.
In the early 20th century, the city began to diversify its economy, and the lumber industry began to decline. The city began to attract new businesses, such as a canning factory, a creamery, and a cheese factory. The city also became a popular tourist destination, and the city's downtown area was revitalized in the 1950s.
Geography
Augusta is located in western Wisconsin, in Eau Claire County. The city is situated on the banks of the Chippewa River, and is part of the Eau Claire metropolitan area. The city is located approximately 30 miles east of the Minnesota border, and is about 90 miles east of Minneapolis. The city is located in a hilly region, and is surrounded by forests and lakes.
Economy
Augusta's economy is largely based on agriculture and tourism. The city is home to a number of farms, and the surrounding area is known for its dairy production. The city is also home to a number of small businesses, including restaurants, retail stores, and service providers. The city is also home to a number of manufacturing companies, including a paper mill, a flour mill, and a sawmill.
The city is also a popular tourist destination, and the downtown area is home to a number of shops, restaurants, and other attractions. The city is also home to a number of parks and recreational areas, including a golf course, a swimming pool, and a skate park.
Demographics
As of the 2010 census, the population of Augusta was 2,500. The city has a median age of 39.7 years, and the median household income is $45,000. The city is predominantly white, with a small Hispanic population. The city is also home to a small Native American population. The city is served by the Eau Claire County School District, and the city is home to a number of public and private schools.
Common Questions
What is Per Capita Income in Augusta?
Per Capita income in Augusta is $27,388.
What is the Median Family Income in Augusta?
Median Family Income in Augusta is $65,750.
What is the Median Household income in Augusta?
Median Household Income in Augusta is $50,243.
What is Income or Wage Gap in Augusta?
Income or Wage Gap in Augusta is 19.8%.
Women in Augusta earn 80.2 cents for every dollar earned by a man.
What is Inequality or Gini Index in Augusta?
Inequality or Gini Index in Augusta is 0.44.
What is the Total Population of Augusta?
Total Population of Augusta is 1,254.
What is the Total Male Population of Augusta?
Total Male Population of Augusta is 595.
What is the Total Female Population of Augusta?
Total Female Population of Augusta is 659.
What is the Ratio of Males per 100 Females in Augusta?
There are 90.29 Males per 100 Females in Augusta.
What is the Ratio of Females per 100 Males in Augusta?
There are 110.76 Females per 100 Males in Augusta.
What is the Median Population Age in Augusta?
Median Population Age in Augusta is 40.1 Years.
What is the Average Family Size in Augusta
Average Family Size in Augusta is 3.2 People.
What is the Average Household Size in Augusta
Average Household Size in Augusta is 2.3 People.
How Large is the Labor Force in Augusta?
There are 518 People in the Labor Forcein in Augusta.
What is the Percentage of People in the Labor Force in Augusta?
52.6% of People are in the Labor Force in Augusta.
What is the Unemployment Rate in Augusta?
Unemployment Rate in Augusta is 4.2%.