Athens, WI Map & Demographics
Athens Map
Athens Overview
$33,091
PER CAPITA INCOME
$87,727
AVG FAMILY INCOME
$58,828
AVG HOUSEHOLD INCOME
21.5%
WAGE / INCOME GAP [ % ]
78.5¢/ $1
WAGE / INCOME GAP [ $ ]
0.41
INEQUALITY / GINI INDEX
1,015
TOTAL POPULATION
530
MALE POPULATION
485
FEMALE POPULATION
109.28
MALES / 100 FEMALES
91.51
FEMALES / 100 MALES
42.7
MEDIAN AGE
2.9
AVG FAMILY SIZE
2.2
AVG HOUSEHOLD SIZE
494
LABOR FORCE [ PEOPLE ]
59.8%
PERCENT IN LABOR FORCE
0.8%
UNEMPLOYMENT RATE
Athens Zip Codes
Athens Area Codes
Income in Athens
Income Overview in Athens
Per Capita Income in Athens is $33,091, while median incomes of families and households are $87,727 and $58,828 respectively.
| Characteristic | Number | Measure |
| Per Capita Income | 1,015 | $33,091 |
| Median Family Income | 274 | $87,727 |
| Mean Family Income | 274 | $93,818 |
| Median Household Income | 451 | $58,828 |
| Mean Household Income | 451 | $73,783 |
| Income Deficit | 274 | $0 |
| Wage / Income Gap (%) | 1,015 | 21.50% |
| Wage / Income Gap ($) | 1,015 | 78.50¢ per $1 |
| Gini / Inequality Index | 1,015 | 0.41 |
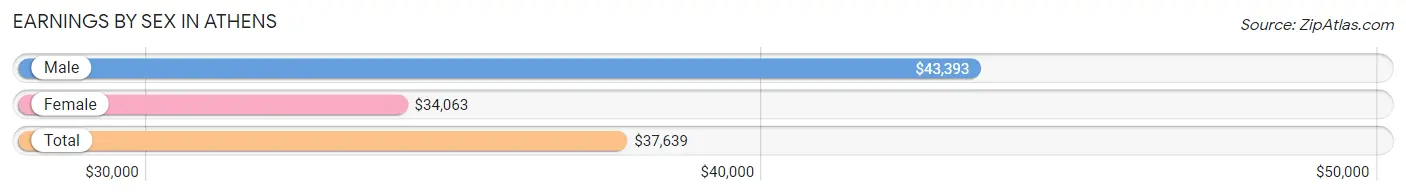
Earnings by Sex in Athens
Average Earnings in Athens are $37,639, $43,393 for men and $34,063 for women, a difference of 21.5%.
| Sex | Number | Average Earnings |
| Male | 318 (57.2%) | $43,393 |
| Female | 238 (42.8%) | $34,063 |
| Total | 556 (100.0%) | $37,639 |
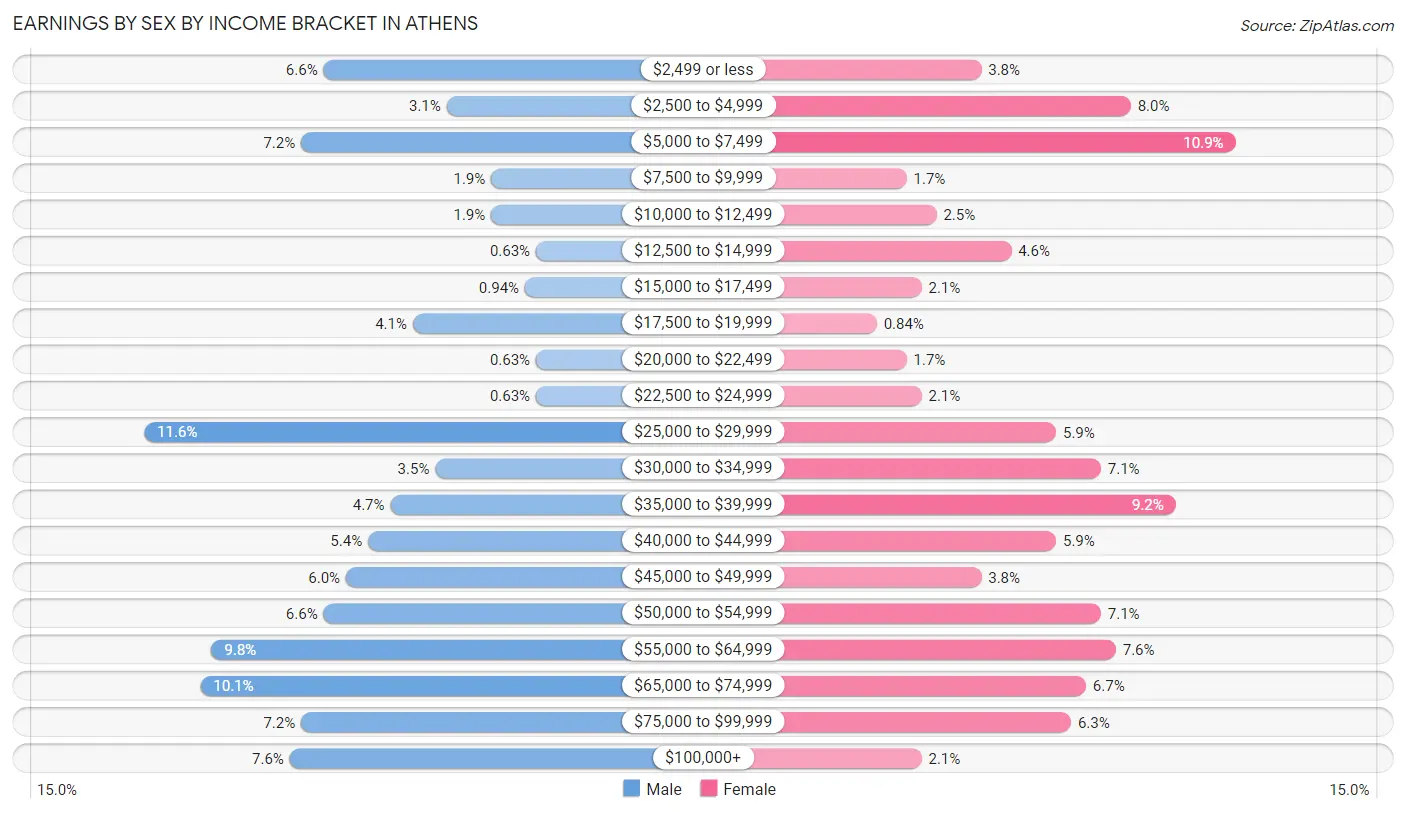
Earnings by Sex by Income Bracket in Athens
The most common earnings brackets in Athens are $25,000 to $29,999 for men (37 | 11.6%) and $5,000 to $7,499 for women (26 | 10.9%).
| Income | Male | Female |
| $2,499 or less | 21 (6.6%) | 9 (3.8%) |
| $2,500 to $4,999 | 10 (3.1%) | 19 (8.0%) |
| $5,000 to $7,499 | 23 (7.2%) | 26 (10.9%) |
| $7,500 to $9,999 | 6 (1.9%) | 4 (1.7%) |
| $10,000 to $12,499 | 6 (1.9%) | 6 (2.5%) |
| $12,500 to $14,999 | 2 (0.6%) | 11 (4.6%) |
| $15,000 to $17,499 | 3 (0.9%) | 5 (2.1%) |
| $17,500 to $19,999 | 13 (4.1%) | 2 (0.8%) |
| $20,000 to $22,499 | 2 (0.6%) | 4 (1.7%) |
| $22,500 to $24,999 | 2 (0.6%) | 5 (2.1%) |
| $25,000 to $29,999 | 37 (11.6%) | 14 (5.9%) |
| $30,000 to $34,999 | 11 (3.5%) | 17 (7.1%) |
| $35,000 to $39,999 | 15 (4.7%) | 22 (9.2%) |
| $40,000 to $44,999 | 17 (5.3%) | 14 (5.9%) |
| $45,000 to $49,999 | 19 (6.0%) | 9 (3.8%) |
| $50,000 to $54,999 | 21 (6.6%) | 17 (7.1%) |
| $55,000 to $64,999 | 31 (9.8%) | 18 (7.6%) |
| $65,000 to $74,999 | 32 (10.1%) | 16 (6.7%) |
| $75,000 to $99,999 | 23 (7.2%) | 15 (6.3%) |
| $100,000+ | 24 (7.5%) | 5 (2.1%) |
| Total | 318 (100.0%) | 238 (100.0%) |
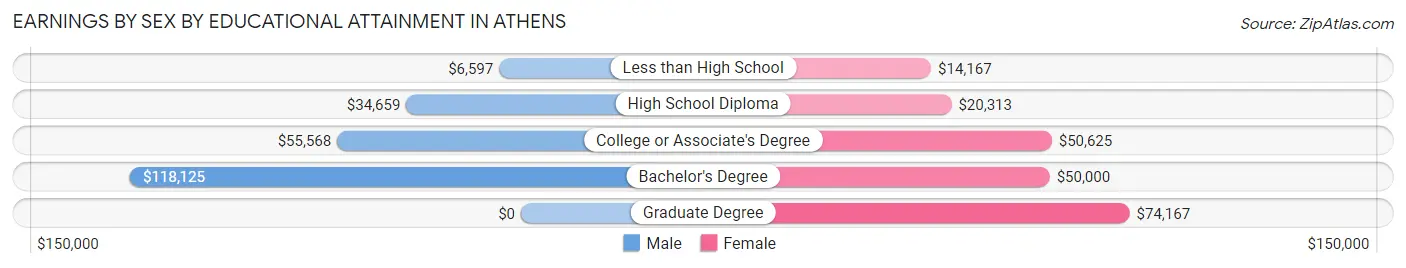
Earnings by Sex by Educational Attainment in Athens
Average earnings in Athens are $46,875 for men and $38,750 for women, a difference of 17.3%. Men with an educational attainment of bachelor's degree enjoy the highest average annual earnings of $118,125, while those with less than high school education earn the least with $6,597. Women with an educational attainment of graduate degree earn the most with the average annual earnings of $74,167, while those with less than high school education have the smallest earnings of $14,167.
| Educational Attainment | Male Income | Female Income |
| Less than High School | $6,597 | $14,167 |
| High School Diploma | $34,659 | $20,313 |
| College or Associate's Degree | $55,568 | $50,625 |
| Bachelor's Degree | $118,125 | $50,000 |
| Graduate Degree | - | - |
| Total | $46,875 | $38,750 |
Family Income in Athens
Family Income Brackets in Athens
According to the Athens family income data, there are 69 families falling into the $100,000 to $149,999 income range, which is the most common income bracket and makes up 25.2% of all families. Conversely, the $15,000 to $24,999 income bracket is the least frequent group with only 2 families (0.7%) belonging to this category.
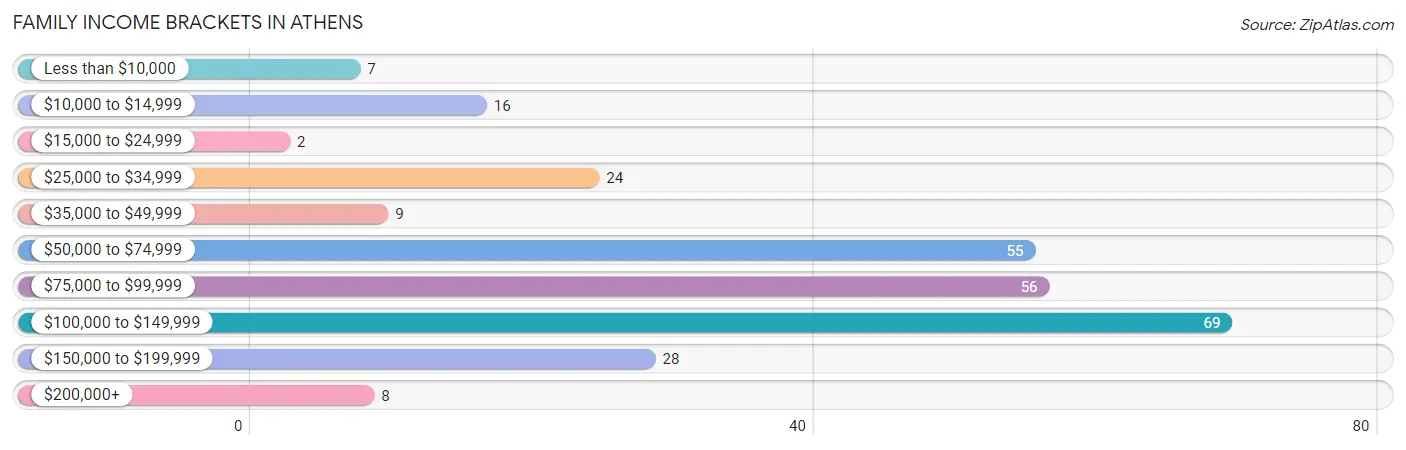
| Income Bracket | # Families | % Families |
| Less than $10,000 | 7 | 2.6% |
| $10,000 to $14,999 | 16 | 5.8% |
| $15,000 to $24,999 | 2 | 0.7% |
| $25,000 to $34,999 | 24 | 8.8% |
| $35,000 to $49,999 | 9 | 3.3% |
| $50,000 to $74,999 | 55 | 20.1% |
| $75,000 to $99,999 | 56 | 20.4% |
| $100,000 to $149,999 | 69 | 25.2% |
| $150,000 to $199,999 | 28 | 10.2% |
| $200,000+ | 8 | 2.9% |
Family Income by Famaliy Size in Athens
4-person families (52 | 19.0%) account for the highest median family income in Athens with $103,750 per family, while 2-person families (144 | 52.5%) have the highest median income of $41,250 per family member.
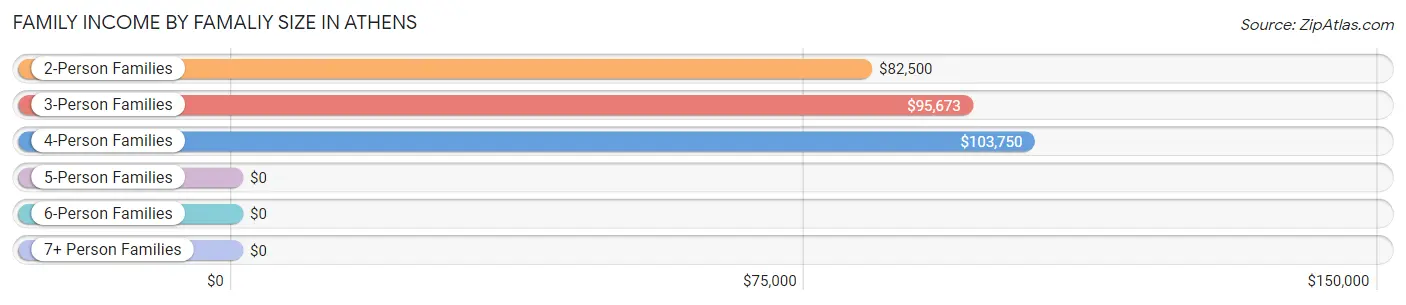
| Income Bracket | # Families | Median Income |
| 2-Person Families | 144 (52.5%) | $82,500 |
| 3-Person Families | 51 (18.6%) | $95,673 |
| 4-Person Families | 52 (19.0%) | $103,750 |
| 5-Person Families | 23 (8.4%) | $0 |
| 6-Person Families | 4 (1.5%) | $0 |
| 7+ Person Families | 0 (0.0%) | $0 |
| Total | 274 (100.0%) | $87,727 |
Family Income by Number of Earners in Athens
The median family income in Athens is $87,727, with families comprising 3+ earners (29) having the highest median family income of $133,295, while families with no earners (48) have the lowest median family income of $45,833, accounting for 10.6% and 17.5% of families, respectively.
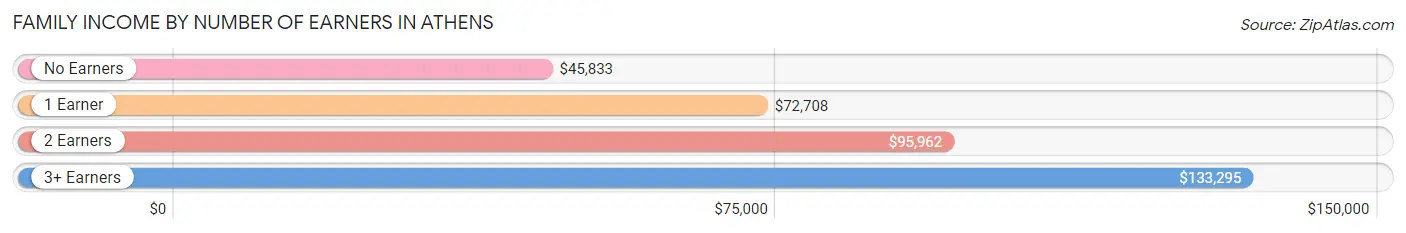
| Number of Earners | # Families | Median Income |
| No Earners | 48 (17.5%) | $45,833 |
| 1 Earner | 59 (21.5%) | $72,708 |
| 2 Earners | 138 (50.4%) | $95,962 |
| 3+ Earners | 29 (10.6%) | $133,295 |
| Total | 274 (100.0%) | $87,727 |
Household Income in Athens
Household Income Brackets in Athens
With 86 households falling in the category, the $50,000 to $74,999 income range is the most frequent in Athens, accounting for 19.1% of all households. In contrast, only 8 households (1.8%) fall into the $200,000+ income bracket, making it the least populous group.
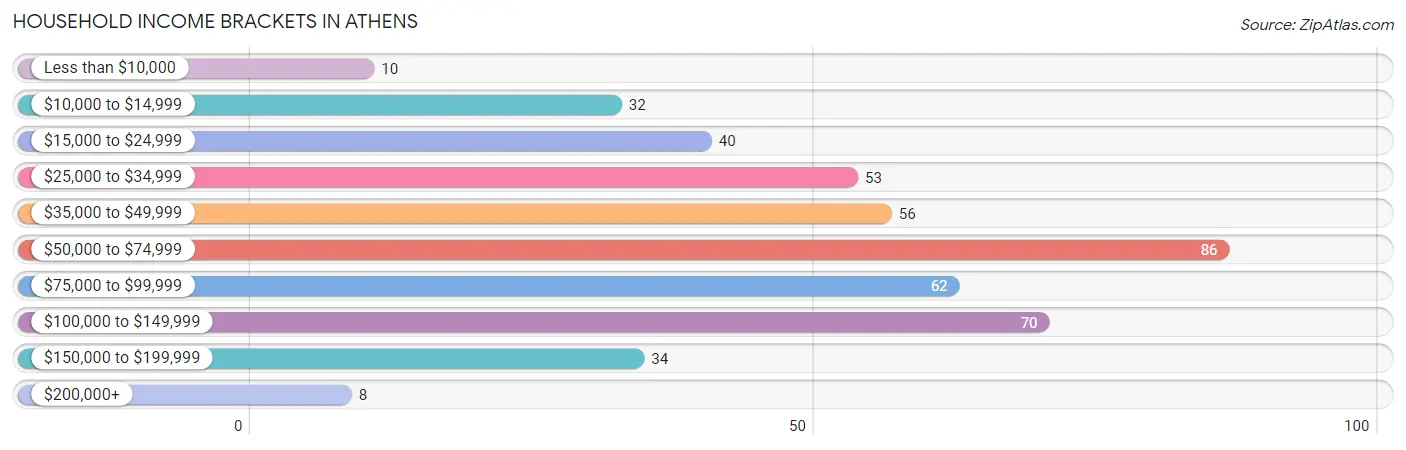
| Income Bracket | # Households | % Households |
| Less than $10,000 | 10 | 2.2% |
| $10,000 to $14,999 | 32 | 7.1% |
| $15,000 to $24,999 | 40 | 8.9% |
| $25,000 to $34,999 | 53 | 11.8% |
| $35,000 to $49,999 | 56 | 12.4% |
| $50,000 to $74,999 | 86 | 19.1% |
| $75,000 to $99,999 | 62 | 13.7% |
| $100,000 to $149,999 | 70 | 15.5% |
| $150,000 to $199,999 | 34 | 7.5% |
| $200,000+ | 8 | 1.8% |
Household Income by Householder Age in Athens
The median household income in Athens is $58,828, with the highest median household income of $85,417 found in the 45 to 64 years age bracket for the primary householder. A total of 165 households (36.6%) fall into this category. Meanwhile, the 65+ years age bracket for the primary householder has the lowest median household income of $30,000, with 130 households (28.8%) in this group.
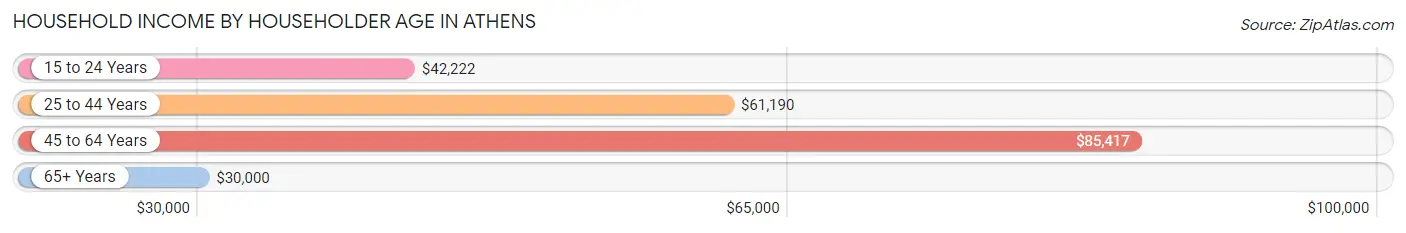
| Income Bracket | # Households | Median Income |
| 15 to 24 Years | 16 (3.5%) | $42,222 |
| 25 to 44 Years | 140 (31.0%) | $61,190 |
| 45 to 64 Years | 165 (36.6%) | $85,417 |
| 65+ Years | 130 (28.8%) | $30,000 |
| Total | 451 (100.0%) | $58,828 |
Poverty in Athens
Income Below Poverty by Sex and Age in Athens
With 8.2% poverty level for males and 20.8% for females among the residents of Athens, 35 to 44 year old males and 15 year old females are the most vulnerable to poverty, with 22 males (19.1%) and 26 females (86.7%) in their respective age groups living below the poverty level.
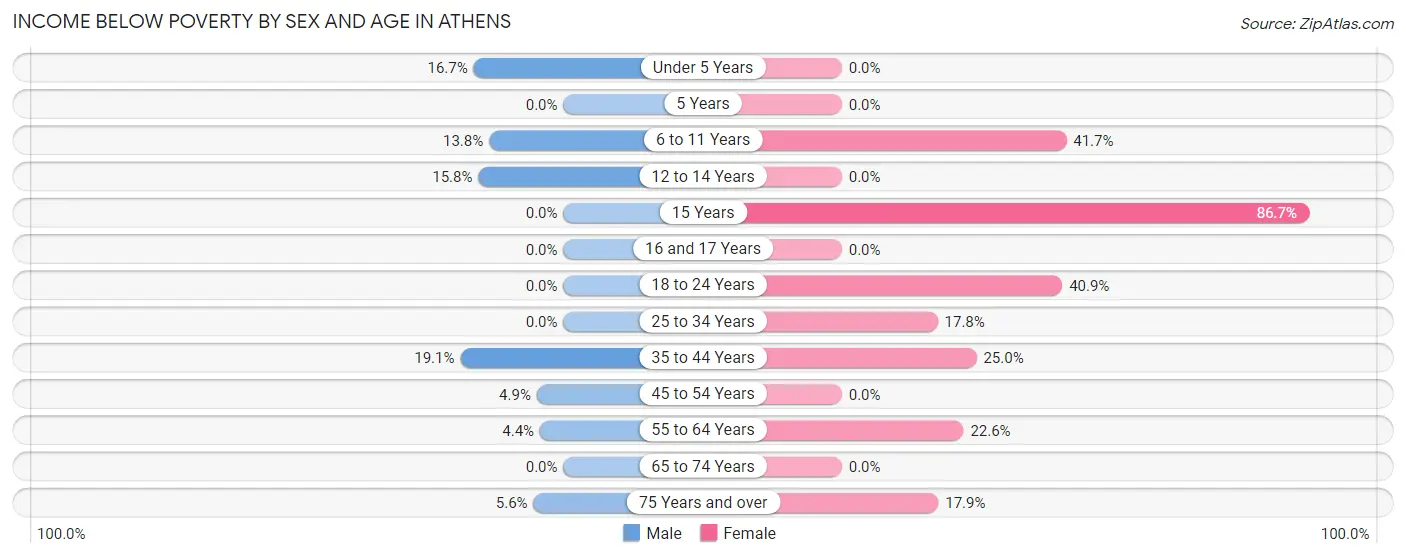
| Age Bracket | Male | Female |
| Under 5 Years | 4 (16.7%) | 0 (0.0%) |
| 5 Years | 0 (0.0%) | 0 (0.0%) |
| 6 to 11 Years | 4 (13.8%) | 15 (41.7%) |
| 12 to 14 Years | 3 (15.8%) | 0 (0.0%) |
| 15 Years | 0 (0.0%) | 26 (86.7%) |
| 16 and 17 Years | 0 (0.0%) | 0 (0.0%) |
| 18 to 24 Years | 0 (0.0%) | 9 (40.9%) |
| 25 to 34 Years | 0 (0.0%) | 8 (17.8%) |
| 35 to 44 Years | 22 (19.1%) | 17 (25.0%) |
| 45 to 54 Years | 4 (4.9%) | 0 (0.0%) |
| 55 to 64 Years | 3 (4.3%) | 14 (22.6%) |
| 65 to 74 Years | 0 (0.0%) | 0 (0.0%) |
| 75 Years and over | 3 (5.6%) | 12 (17.9%) |
| Total | 43 (8.2%) | 101 (20.8%) |
Income Above Poverty by Sex and Age in Athens
According to the poverty statistics in Athens, males aged 5 years and females aged under 5 years are the age groups that are most secure financially, with 100.0% of males and 100.0% of females in these age groups living above the poverty line.
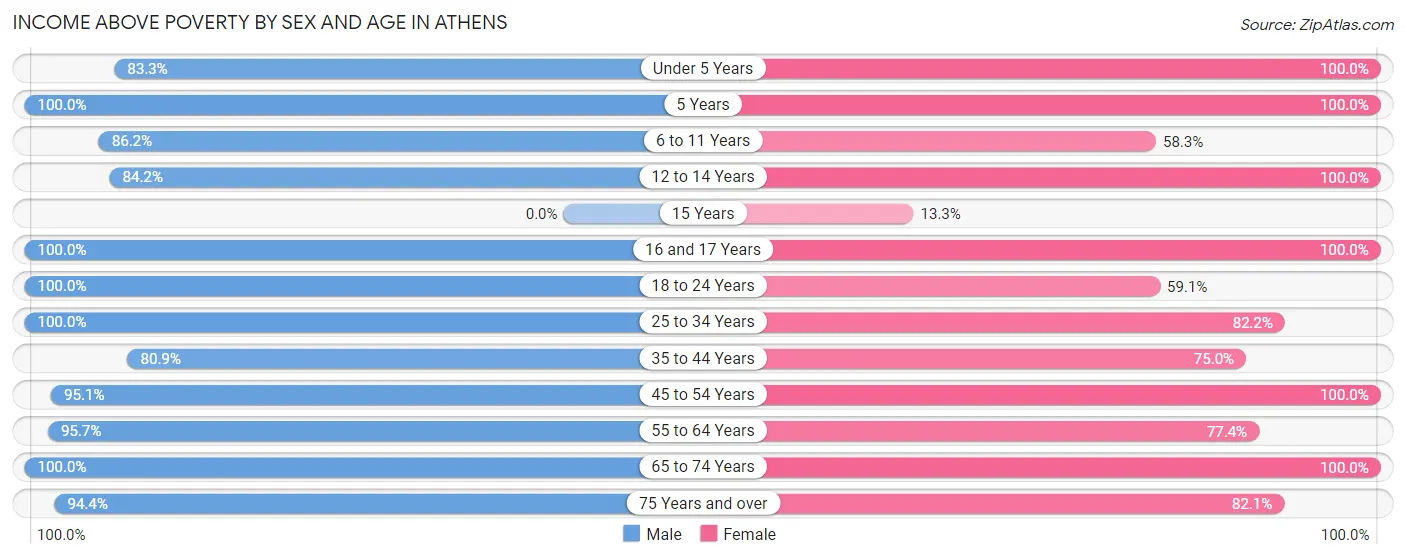
| Age Bracket | Male | Female |
| Under 5 Years | 20 (83.3%) | 13 (100.0%) |
| 5 Years | 4 (100.0%) | 7 (100.0%) |
| 6 to 11 Years | 25 (86.2%) | 21 (58.3%) |
| 12 to 14 Years | 16 (84.2%) | 24 (100.0%) |
| 15 Years | 0 (0.0%) | 4 (13.3%) |
| 16 and 17 Years | 20 (100.0%) | 12 (100.0%) |
| 18 to 24 Years | 38 (100.0%) | 13 (59.1%) |
| 25 to 34 Years | 41 (100.0%) | 37 (82.2%) |
| 35 to 44 Years | 93 (80.9%) | 51 (75.0%) |
| 45 to 54 Years | 77 (95.1%) | 69 (100.0%) |
| 55 to 64 Years | 66 (95.7%) | 48 (77.4%) |
| 65 to 74 Years | 33 (100.0%) | 30 (100.0%) |
| 75 Years and over | 51 (94.4%) | 55 (82.1%) |
| Total | 484 (91.8%) | 384 (79.2%) |
Income Below Poverty Among Married-Couple Families in Athens
The poverty statistics for married-couple families in Athens show that 9.8% or 23 of the total 234 families live below the poverty line. Families with 3 or 4 children have the highest poverty rate of 17.4%, comprising of 4 families. On the other hand, families with no children have the lowest poverty rate of 4.9%, which includes 6 families.
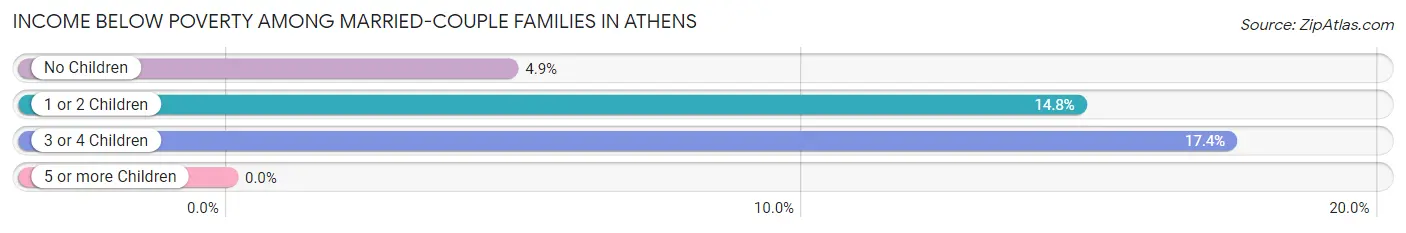
| Children | Above Poverty | Below Poverty |
| No Children | 117 (95.1%) | 6 (4.9%) |
| 1 or 2 Children | 75 (85.2%) | 13 (14.8%) |
| 3 or 4 Children | 19 (82.6%) | 4 (17.4%) |
| 5 or more Children | 0 (0.0%) | 0 (0.0%) |
| Total | 211 (90.2%) | 23 (9.8%) |
Income Below Poverty Among Single-Parent Households in Athens
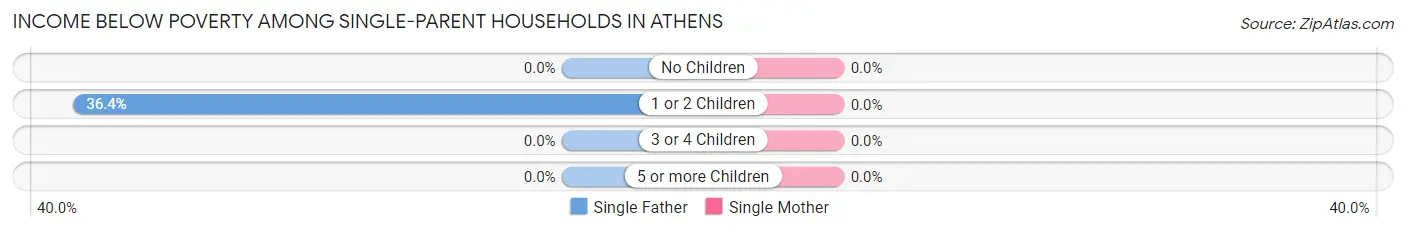
| Children | Single Father | Single Mother |
| No Children | 0 (0.0%) | 0 (0.0%) |
| 1 or 2 Children | 4 (36.4%) | 0 (0.0%) |
| 3 or 4 Children | 0 (0.0%) | 0 (0.0%) |
| 5 or more Children | 0 (0.0%) | 0 (0.0%) |
| Total | 4 (16.7%) | 0 (0.0%) |
Income Below Poverty Among Married-Couple vs Single-Parent Households in Athens
The poverty data for Athens shows that 23 of the married-couple family households (9.8%) and 4 of the single-parent households (10.0%) are living below the poverty level. Within the married-couple family households, those with 3 or 4 children have the highest poverty rate, with 4 households (17.4%) falling below the poverty line. Among the single-parent households, those with 1 or 2 children have the highest poverty rate, with 4 household (17.4%) living below poverty.
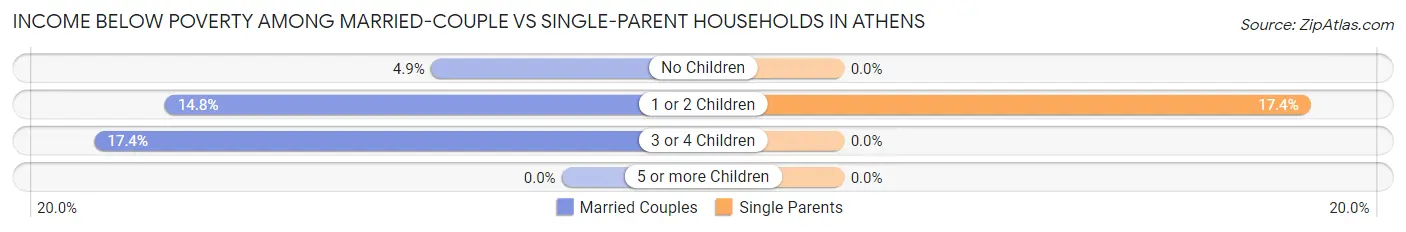
| Children | Married-Couple Families | Single-Parent Households |
| No Children | 6 (4.9%) | 0 (0.0%) |
| 1 or 2 Children | 13 (14.8%) | 4 (17.4%) |
| 3 or 4 Children | 4 (17.4%) | 0 (0.0%) |
| 5 or more Children | 0 (0.0%) | 0 (0.0%) |
| Total | 23 (9.8%) | 4 (10.0%) |
Race in Athens
The most populous races in Athens are White / Caucasian (896 | 88.3%), Hispanic or Latino (66 | 6.5%), and Some other Race (55 | 5.4%).
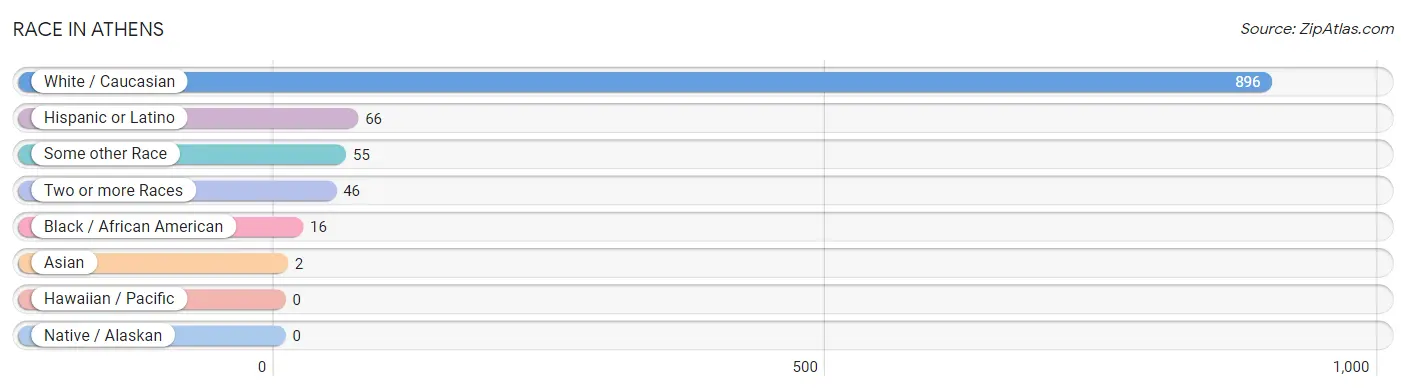
| Race | # Population | % Population |
| Asian | 2 | 0.2% |
| Black / African American | 16 | 1.6% |
| Hawaiian / Pacific | 0 | 0.0% |
| Hispanic or Latino | 66 | 6.5% |
| Native / Alaskan | 0 | 0.0% |
| White / Caucasian | 896 | 88.3% |
| Two or more Races | 46 | 4.5% |
| Some other Race | 55 | 5.4% |
| Total | 1,015 | 100.0% |
Ancestry in Athens
The most populous ancestries reported in Athens are German (510 | 50.2%), Polish (140 | 13.8%), Mexican (62 | 6.1%), Irish (27 | 2.7%), and Swedish (27 | 2.7%), together accounting for 75.5% of all Athens residents.
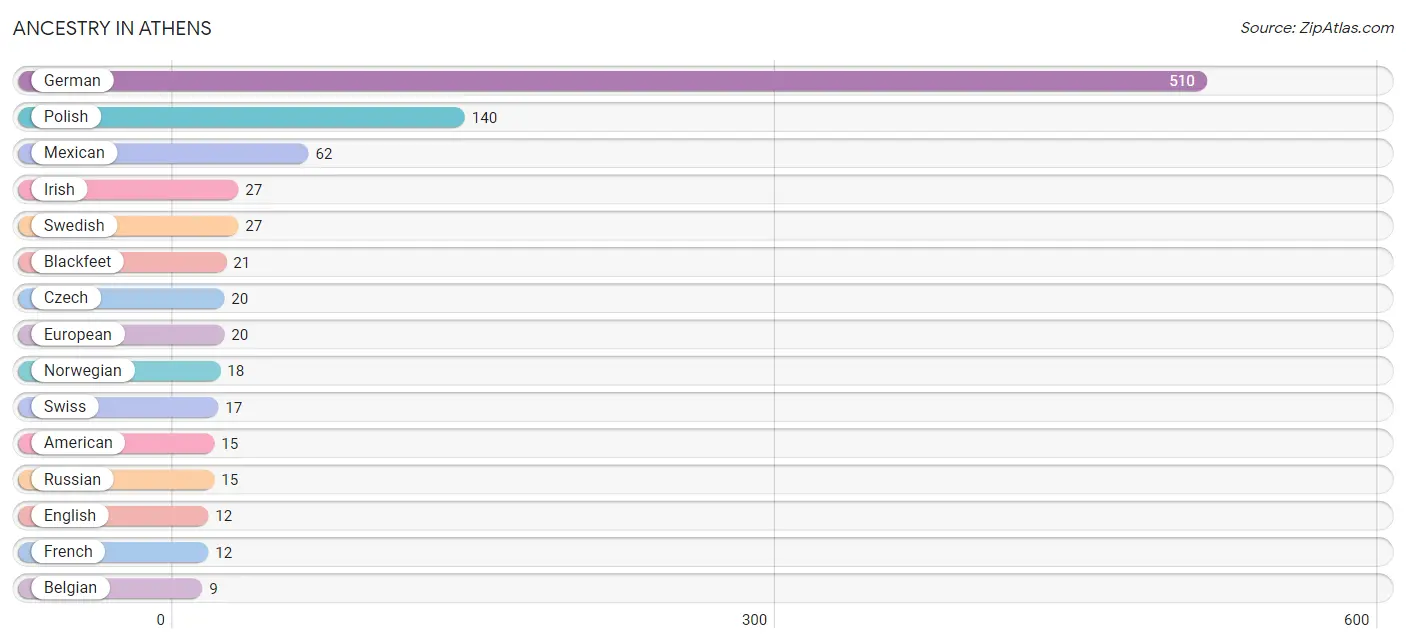
| Ancestry | # Population | % Population |
| American | 15 | 1.5% |
| Austrian | 5 | 0.5% |
| Belgian | 9 | 0.9% |
| Blackfeet | 21 | 2.1% |
| Canadian | 4 | 0.4% |
| Czech | 20 | 2.0% |
| Czechoslovakian | 3 | 0.3% |
| Danish | 7 | 0.7% |
| Dutch | 2 | 0.2% |
| English | 12 | 1.2% |
| European | 20 | 2.0% |
| Finnish | 5 | 0.5% |
| French | 12 | 1.2% |
| French Canadian | 8 | 0.8% |
| German | 510 | 50.2% |
| Hungarian | 3 | 0.3% |
| Irish | 27 | 2.7% |
| Italian | 9 | 0.9% |
| Mexican | 62 | 6.1% |
| Norwegian | 18 | 1.8% |
| Polish | 140 | 13.8% |
| Russian | 15 | 1.5% |
| Scotch-Irish | 3 | 0.3% |
| Scottish | 3 | 0.3% |
| Slovene | 3 | 0.3% |
| Sri Lankan | 3 | 0.3% |
| Swedish | 27 | 2.7% |
| Swiss | 17 | 1.7% | View All 28 Rows |
Immigrants in Athens
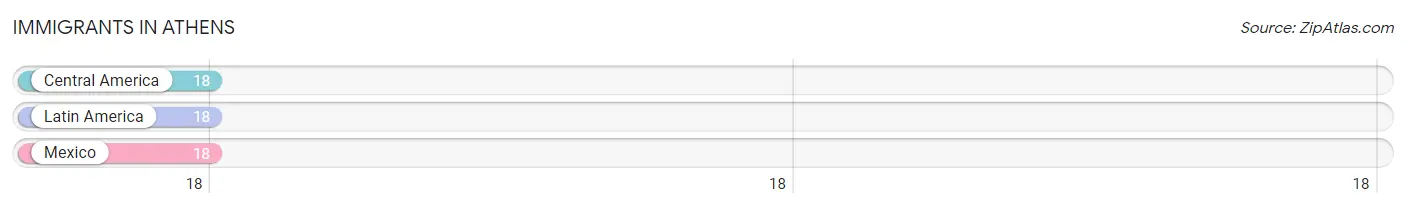
The most numerous immigrant groups reported in Athens came from Central America (18 | 1.8%), Latin America (18 | 1.8%), and Mexico (18 | 1.8%), together accounting for 5.3% of all Athens residents.
| Immigration Origin | # Population | % Population |
| Central America | 18 | 1.8% |
| Latin America | 18 | 1.8% |
| Mexico | 18 | 1.8% | View All 3 Rows |
Sex and Age in Athens
Sex and Age in Athens
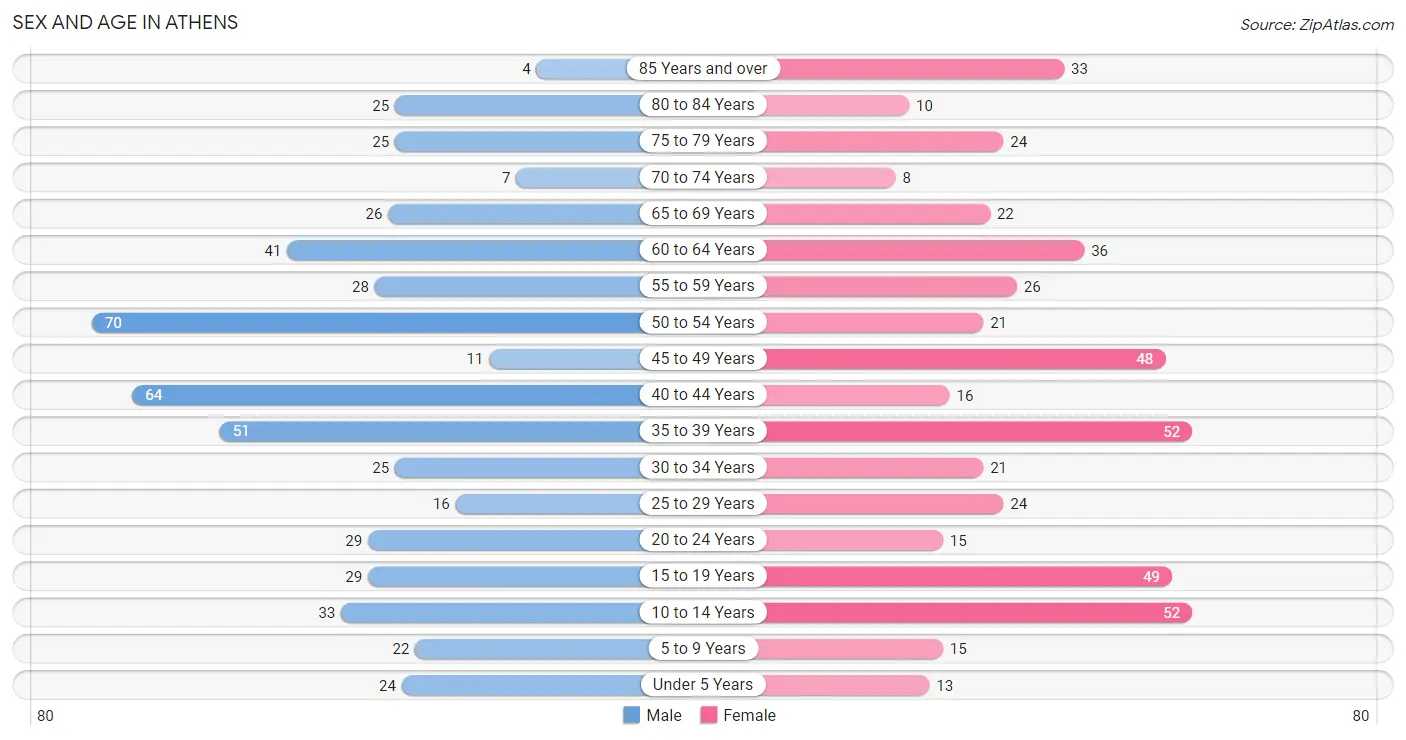
The most populous age groups in Athens are 50 to 54 Years (70 | 13.2%) for men and 10 to 14 Years (52 | 10.7%) for women.
| Age Bracket | Male | Female |
| Under 5 Years | 24 (4.5%) | 13 (2.7%) |
| 5 to 9 Years | 22 (4.2%) | 15 (3.1%) |
| 10 to 14 Years | 33 (6.2%) | 52 (10.7%) |
| 15 to 19 Years | 29 (5.5%) | 49 (10.1%) |
| 20 to 24 Years | 29 (5.5%) | 15 (3.1%) |
| 25 to 29 Years | 16 (3.0%) | 24 (5.0%) |
| 30 to 34 Years | 25 (4.7%) | 21 (4.3%) |
| 35 to 39 Years | 51 (9.6%) | 52 (10.7%) |
| 40 to 44 Years | 64 (12.1%) | 16 (3.3%) |
| 45 to 49 Years | 11 (2.1%) | 48 (9.9%) |
| 50 to 54 Years | 70 (13.2%) | 21 (4.3%) |
| 55 to 59 Years | 28 (5.3%) | 26 (5.4%) |
| 60 to 64 Years | 41 (7.7%) | 36 (7.4%) |
| 65 to 69 Years | 26 (4.9%) | 22 (4.5%) |
| 70 to 74 Years | 7 (1.3%) | 8 (1.7%) |
| 75 to 79 Years | 25 (4.7%) | 24 (5.0%) |
| 80 to 84 Years | 25 (4.7%) | 10 (2.1%) |
| 85 Years and over | 4 (0.7%) | 33 (6.8%) |
| Total | 530 (100.0%) | 485 (100.0%) |
Families and Households in Athens
Median Family Size in Athens
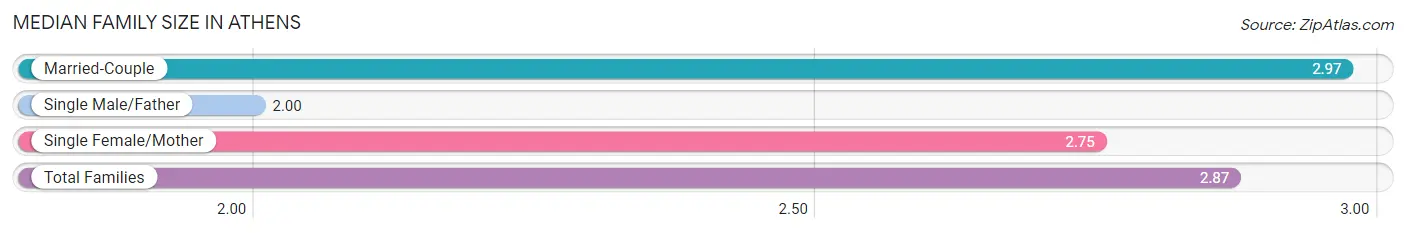
The median family size in Athens is 2.87 persons per family, with married-couple families (234 | 85.4%) accounting for the largest median family size of 2.97 persons per family. On the other hand, single male/father families (24 | 8.8%) represent the smallest median family size with 2.00 persons per family.
| Family Type | # Families | Family Size |
| Married-Couple | 234 (85.4%) | 2.97 |
| Single Male/Father | 24 (8.8%) | 2.00 |
| Single Female/Mother | 16 (5.8%) | 2.75 |
| Total Families | 274 (100.0%) | 2.87 |
Median Household Size in Athens
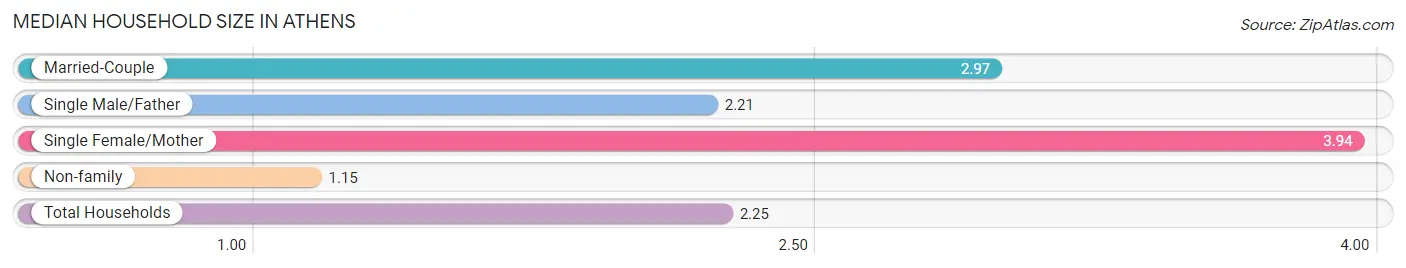
The median household size in Athens is 2.25 persons per household, with single female/mother households (16 | 3.5%) accounting for the largest median household size of 3.94 persons per household. non-family households (177 | 39.3%) represent the smallest median household size with 1.15 persons per household.
| Household Type | # Households | Household Size |
| Married-Couple | 234 (51.9%) | 2.97 |
| Single Male/Father | 24 (5.3%) | 2.21 |
| Single Female/Mother | 16 (3.5%) | 3.94 |
| Non-family | 177 (39.3%) | 1.15 |
| Total Households | 451 (100.0%) | 2.25 |
Household Size by Marriage Status in Athens
Out of a total of 451 households in Athens, 274 (60.8%) are family households, while 177 (39.3%) are nonfamily households. The most numerous type of family households are 2-person households, comprising 133, and the most common type of nonfamily households are 1-person households, comprising 151.
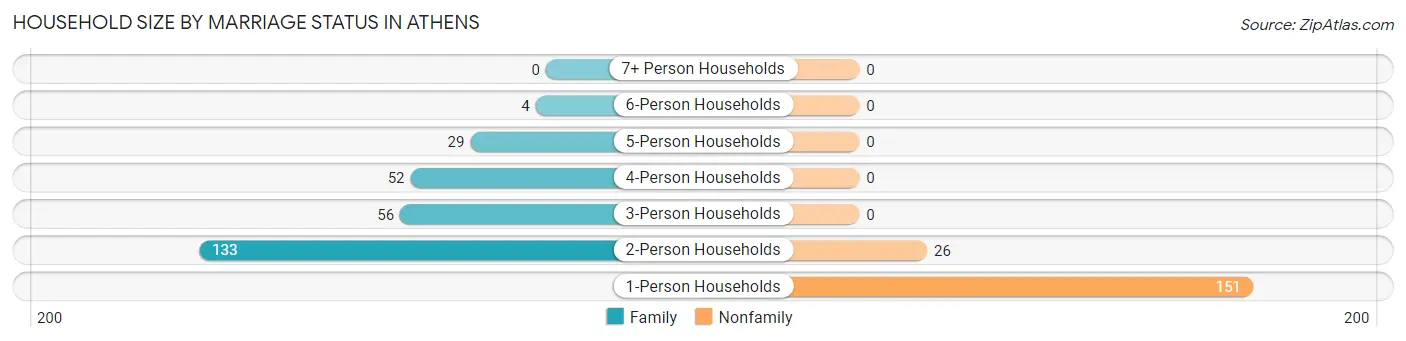
| Household Size | Family Households | Nonfamily Households |
| 1-Person Households | - | 151 (33.5%) |
| 2-Person Households | 133 (29.5%) | 26 (5.8%) |
| 3-Person Households | 56 (12.4%) | 0 (0.0%) |
| 4-Person Households | 52 (11.5%) | 0 (0.0%) |
| 5-Person Households | 29 (6.4%) | 0 (0.0%) |
| 6-Person Households | 4 (0.9%) | 0 (0.0%) |
| 7+ Person Households | 0 (0.0%) | 0 (0.0%) |
| Total | 274 (60.8%) | 177 (39.3%) |
Female Fertility in Athens
Fertility by Age in Athens
Average fertility rate in Athens is 89.0 births per 1,000 women. Women in the age bracket of 20 to 34 years have the highest fertility rate with 250.0 births per 1,000 women. Women in the age bracket of 20 to 34 years acount for 75.0% of all women with births.
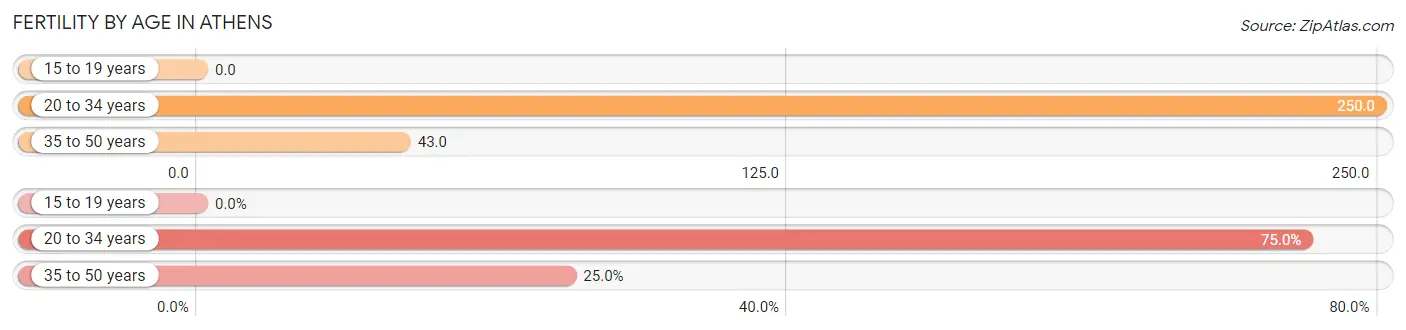
| Age Bracket | Women with Births | Births / 1,000 Women |
| 15 to 19 years | 0 (0.0%) | 0.0 |
| 20 to 34 years | 15 (75.0%) | 250.0 |
| 35 to 50 years | 5 (25.0%) | 43.0 |
| Total | 20 (100.0%) | 89.0 |
Fertility by Age by Marriage Status in Athens
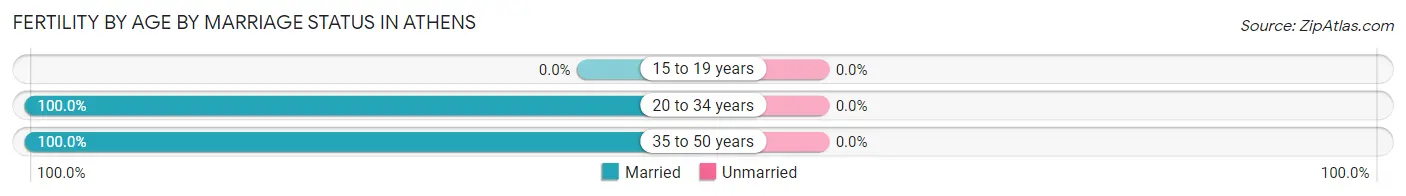
| Age Bracket | Married | Unmarried |
| 15 to 19 years | 0 (0.0%) | 0 (0.0%) |
| 20 to 34 years | 15 (100.0%) | 0 (0.0%) |
| 35 to 50 years | 5 (100.0%) | 0 (0.0%) |
| Total | 20 (100.0%) | 0 (0.0%) |
Fertility by Education in Athens
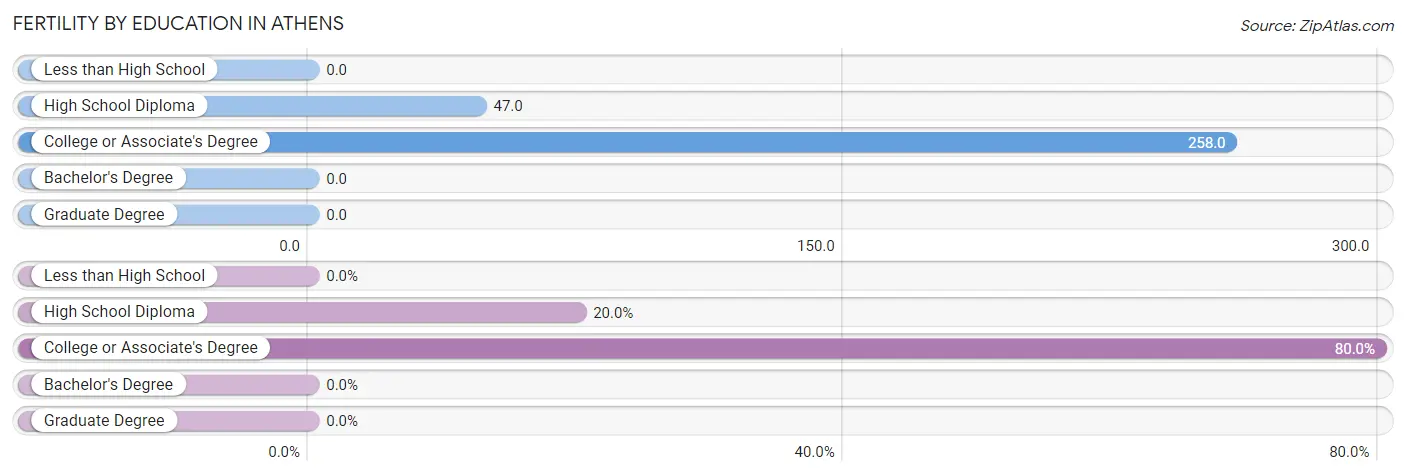
| Educational Attainment | Women with Births | Births / 1,000 Women |
| Less than High School | 0 (0.0%) | 0.0 |
| High School Diploma | 4 (20.0%) | 47.0 |
| College or Associate's Degree | 16 (80.0%) | 258.0 |
| Bachelor's Degree | 0 (0.0%) | 0.0 |
| Graduate Degree | 0 (0.0%) | 0.0 |
| Total | 20 (100.0%) | 89.0 |
Fertility by Education by Marriage Status in Athens
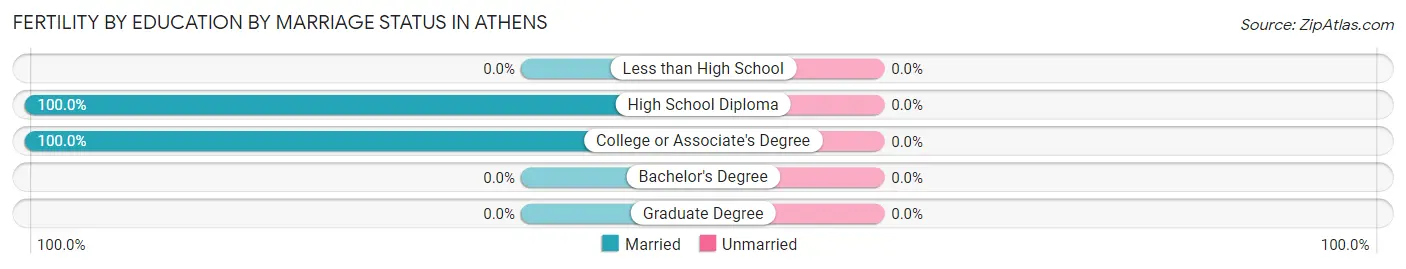
| Educational Attainment | Married | Unmarried |
| Less than High School | 0 (0.0%) | 0 (0.0%) |
| High School Diploma | 4 (100.0%) | 0 (0.0%) |
| College or Associate's Degree | 16 (100.0%) | 0 (0.0%) |
| Bachelor's Degree | 0 (0.0%) | 0 (0.0%) |
| Graduate Degree | 0 (0.0%) | 0 (0.0%) |
| Total | 20 (100.0%) | 0 (0.0%) |
Employment Characteristics in Athens
Employment by Class of Employer in Athens
Among the 484 employed individuals in Athens, private company employees (337 | 69.6%), self-employed (not incorporated) (56 | 11.6%), and self-employed (incorporated) (29 | 6.0%) make up the most common classes of employment.
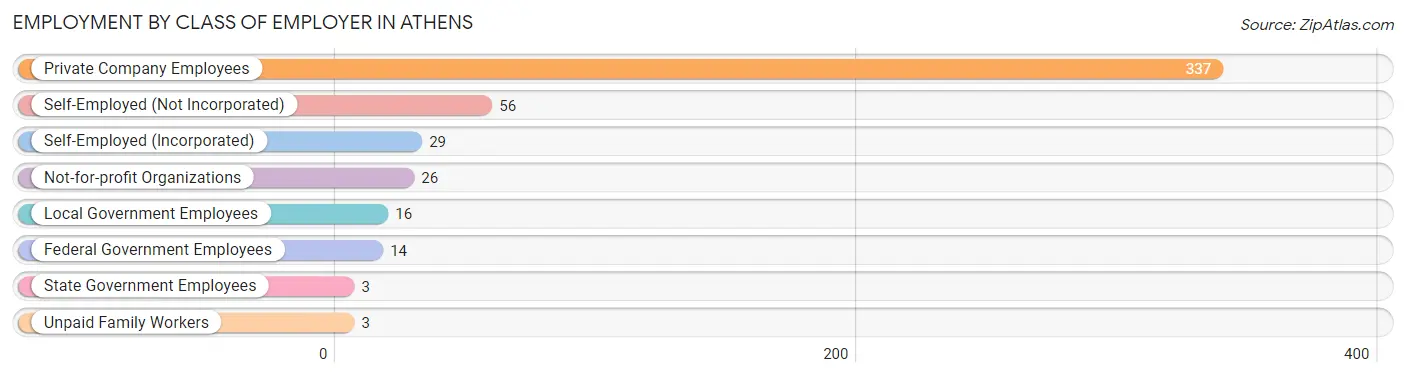
| Employer Class | # Employees | % Employees |
| Private Company Employees | 337 | 69.6% |
| Self-Employed (Incorporated) | 29 | 6.0% |
| Self-Employed (Not Incorporated) | 56 | 11.6% |
| Not-for-profit Organizations | 26 | 5.4% |
| Local Government Employees | 16 | 3.3% |
| State Government Employees | 3 | 0.6% |
| Federal Government Employees | 14 | 2.9% |
| Unpaid Family Workers | 3 | 0.6% |
| Total | 484 | 100.0% |
Employment Status by Age in Athens
According to the labor force statistics for Athens, out of the total population over 16 years of age (826), 59.8% or 494 individuals are in the labor force, with 0.8% or 4 of them unemployed. The age group with the highest labor force participation rate is 30 to 34 years, with 100.0% or 46 individuals in the labor force. Within the labor force, the 20 to 24 years age range has the highest percentage of unemployed individuals, with 7.4% or 2 of them being unemployed.
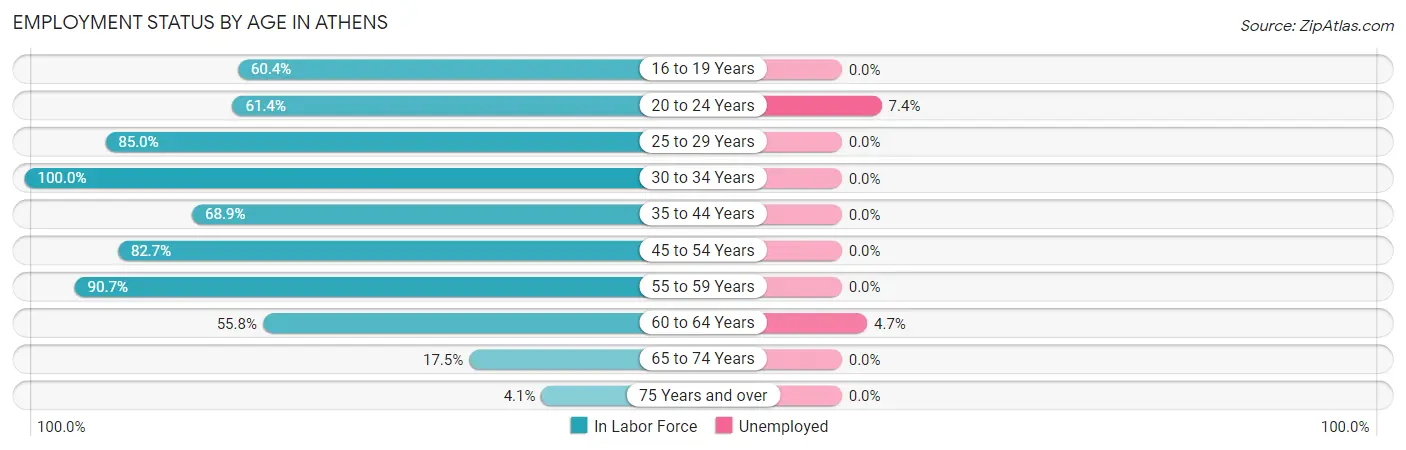
| Age Bracket | In Labor Force | Unemployed |
| 16 to 19 Years | 29 (60.4%) | 0 (0.0%) |
| 20 to 24 Years | 27 (61.4%) | 2 (7.4%) |
| 25 to 29 Years | 34 (85.0%) | 0 (0.0%) |
| 30 to 34 Years | 46 (100.0%) | 0 (0.0%) |
| 35 to 44 Years | 126 (68.9%) | 0 (0.0%) |
| 45 to 54 Years | 124 (82.7%) | 0 (0.0%) |
| 55 to 59 Years | 49 (90.7%) | 0 (0.0%) |
| 60 to 64 Years | 43 (55.8%) | 2 (4.7%) |
| 65 to 74 Years | 11 (17.5%) | 0 (0.0%) |
| 75 Years and over | 5 (4.1%) | 0 (0.0%) |
| Total | 494 (59.8%) | 4 (0.8%) |
Employment Status by Educational Attainment in Athens
According to labor force statistics for Athens, 76.7% of individuals (422) out of the total population between 25 and 64 years of age (550) are in the labor force, with 0.5% or 2 of them being unemployed. The group with the highest labor force participation rate are those with the educational attainment of less than high school, with 100.0% or 29 individuals in the labor force. Within the labor force, individuals with high school diploma education have the highest percentage of unemployment, with 1.1% or 2 of them being unemployed.
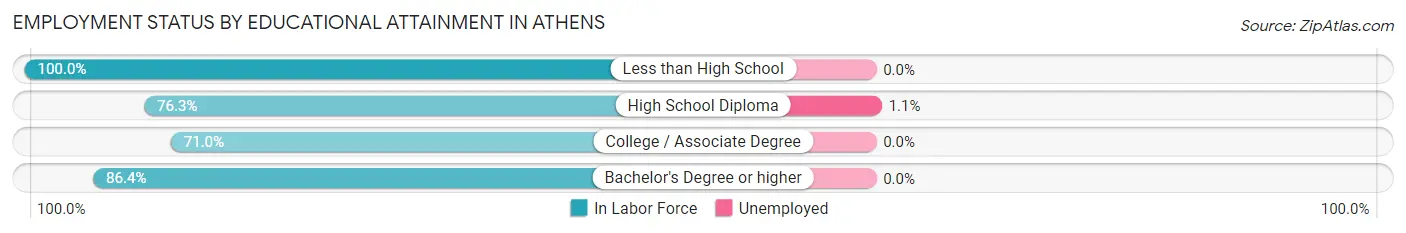
| Educational Attainment | In Labor Force | Unemployed |
| Less than High School | 29 (100.0%) | 0 (0.0%) |
| High School Diploma | 184 (76.3%) | 3 (1.1%) |
| College / Associate Degree | 152 (71.0%) | 0 (0.0%) |
| Bachelor's Degree or higher | 57 (86.4%) | 0 (0.0%) |
| Total | 422 (76.7%) | 3 (0.5%) |
Employment Occupations by Sex in Athens
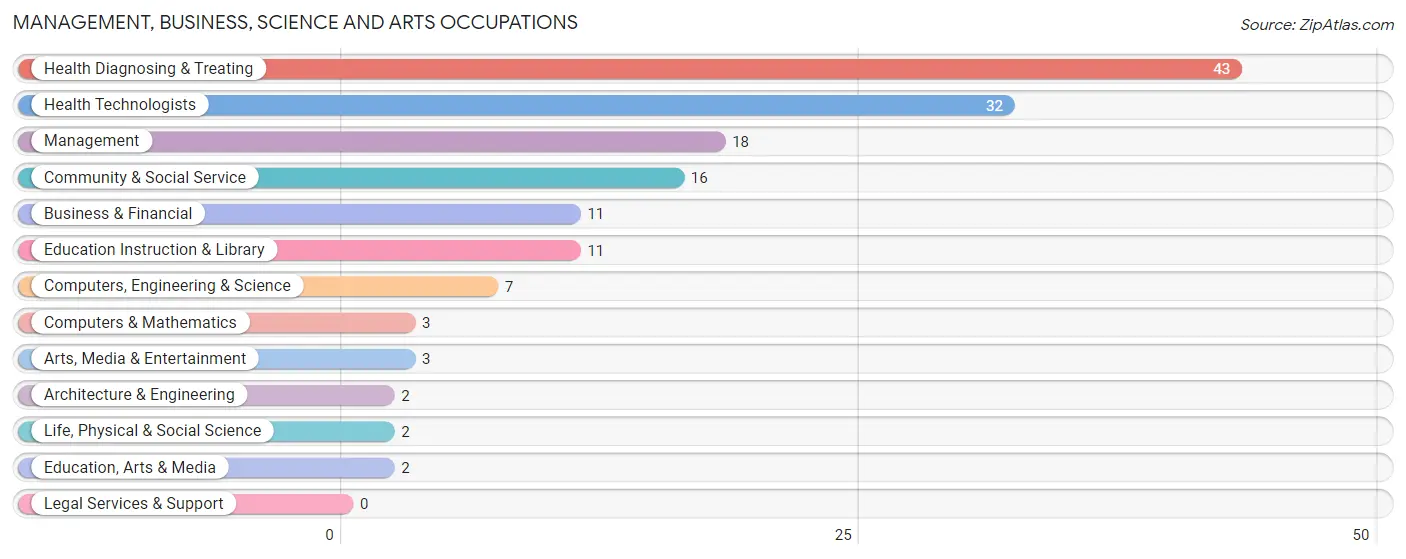
Management, Business, Science and Arts Occupations
The most common Management, Business, Science and Arts occupations in Athens are Health Diagnosing & Treating (43 | 8.8%), Health Technologists (32 | 6.5%), Management (18 | 3.7%), Community & Social Service (16 | 3.3%), and Business & Financial (11 | 2.2%).
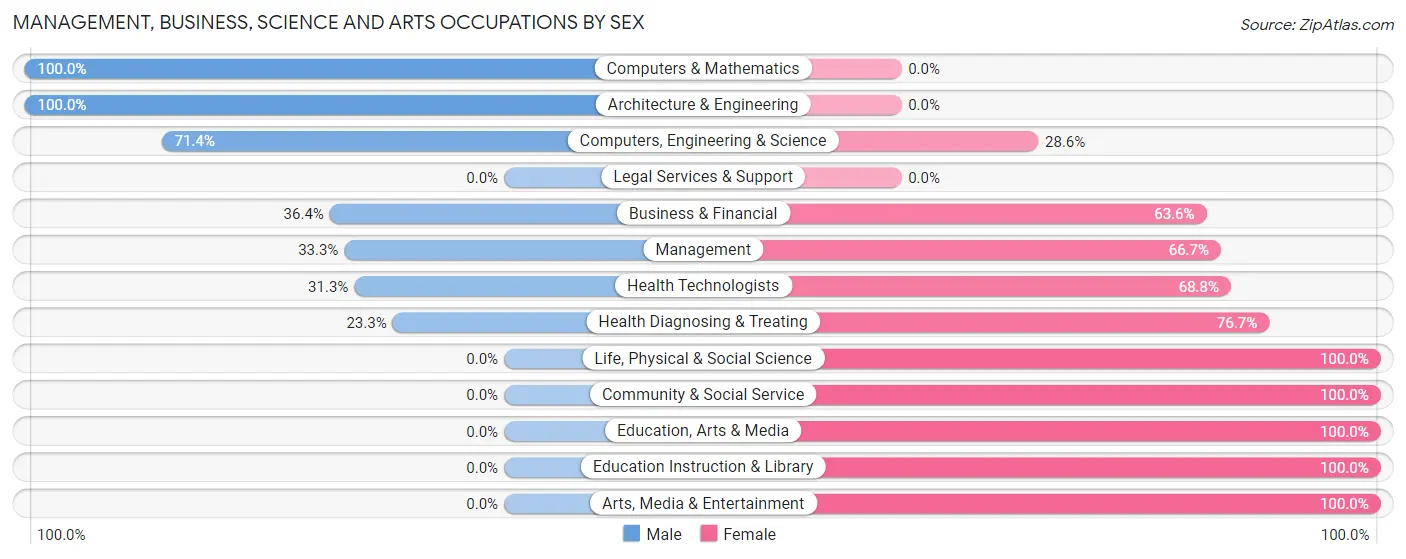
Management, Business, Science and Arts Occupations by Sex
Within the Management, Business, Science and Arts occupations in Athens, the most male-oriented occupations are Computers & Mathematics (100.0%), Architecture & Engineering (100.0%), and Computers, Engineering & Science (71.4%), while the most female-oriented occupations are Life, Physical & Social Science (100.0%), Community & Social Service (100.0%), and Education, Arts & Media (100.0%).
| Occupation | Male | Female |
| Management | 6 (33.3%) | 12 (66.7%) |
| Business & Financial | 4 (36.4%) | 7 (63.6%) |
| Computers, Engineering & Science | 5 (71.4%) | 2 (28.6%) |
| Computers & Mathematics | 3 (100.0%) | 0 (0.0%) |
| Architecture & Engineering | 2 (100.0%) | 0 (0.0%) |
| Life, Physical & Social Science | 0 (0.0%) | 2 (100.0%) |
| Community & Social Service | 0 (0.0%) | 16 (100.0%) |
| Education, Arts & Media | 0 (0.0%) | 2 (100.0%) |
| Legal Services & Support | 0 (0.0%) | 0 (0.0%) |
| Education Instruction & Library | 0 (0.0%) | 11 (100.0%) |
| Arts, Media & Entertainment | 0 (0.0%) | 3 (100.0%) |
| Health Diagnosing & Treating | 10 (23.3%) | 33 (76.7%) |
| Health Technologists | 10 (31.2%) | 22 (68.8%) |
| Total (Category) | 25 (26.3%) | 70 (73.7%) |
| Total (Overall) | 266 (54.3%) | 224 (45.7%) |
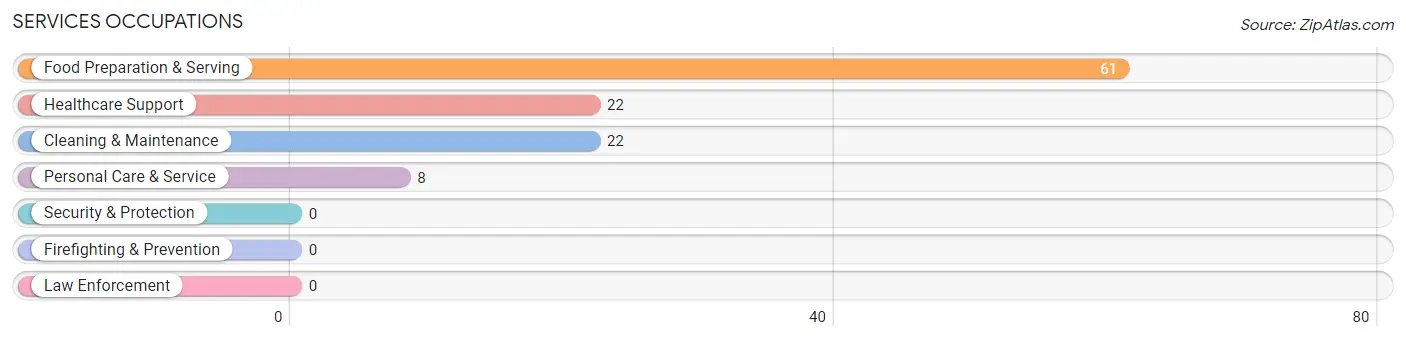
Services Occupations
The most common Services occupations in Athens are Food Preparation & Serving (61 | 12.4%), Healthcare Support (22 | 4.5%), Cleaning & Maintenance (22 | 4.5%), and Personal Care & Service (8 | 1.6%).
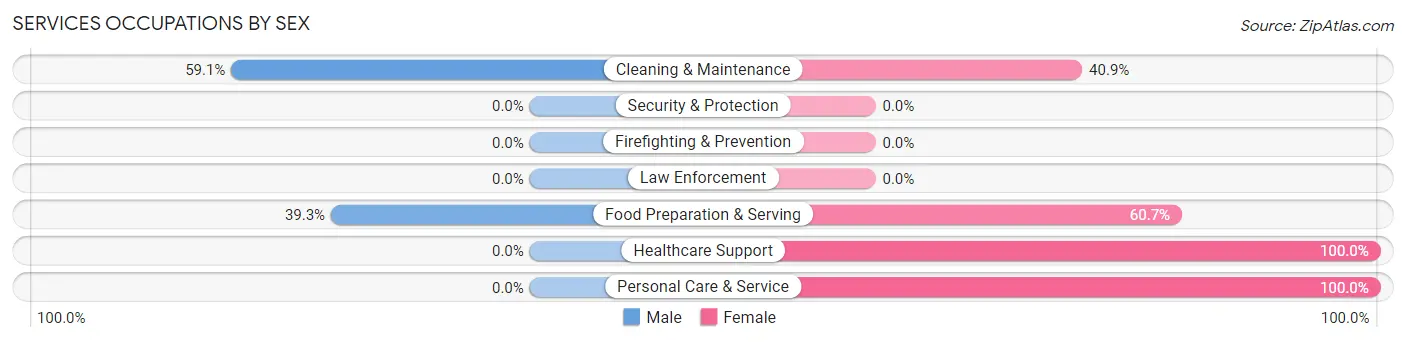
Services Occupations by Sex
Within the Services occupations in Athens, the most male-oriented occupations are Cleaning & Maintenance (59.1%), and Food Preparation & Serving (39.3%), while the most female-oriented occupations are Healthcare Support (100.0%), Personal Care & Service (100.0%), and Food Preparation & Serving (60.7%).
| Occupation | Male | Female |
| Healthcare Support | 0 (0.0%) | 22 (100.0%) |
| Security & Protection | 0 (0.0%) | 0 (0.0%) |
| Firefighting & Prevention | 0 (0.0%) | 0 (0.0%) |
| Law Enforcement | 0 (0.0%) | 0 (0.0%) |
| Food Preparation & Serving | 24 (39.3%) | 37 (60.7%) |
| Cleaning & Maintenance | 13 (59.1%) | 9 (40.9%) |
| Personal Care & Service | 0 (0.0%) | 8 (100.0%) |
| Total (Category) | 37 (32.7%) | 76 (67.3%) |
| Total (Overall) | 266 (54.3%) | 224 (45.7%) |
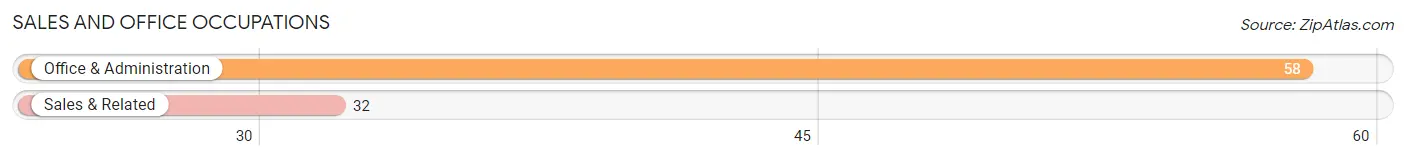
Sales and Office Occupations
The most common Sales and Office occupations in Athens are Office & Administration (58 | 11.8%), and Sales & Related (32 | 6.5%).
Sales and Office Occupations by Sex
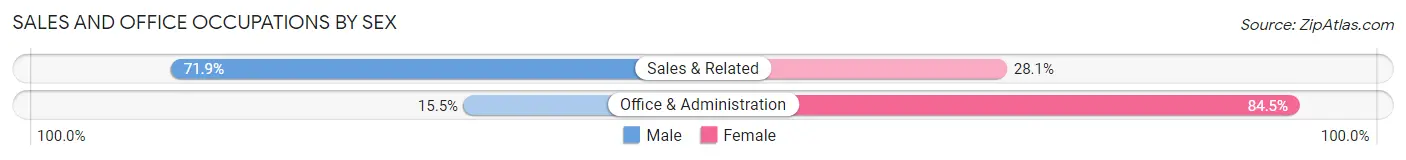
| Occupation | Male | Female |
| Sales & Related | 23 (71.9%) | 9 (28.1%) |
| Office & Administration | 9 (15.5%) | 49 (84.5%) |
| Total (Category) | 32 (35.6%) | 58 (64.4%) |
| Total (Overall) | 266 (54.3%) | 224 (45.7%) |
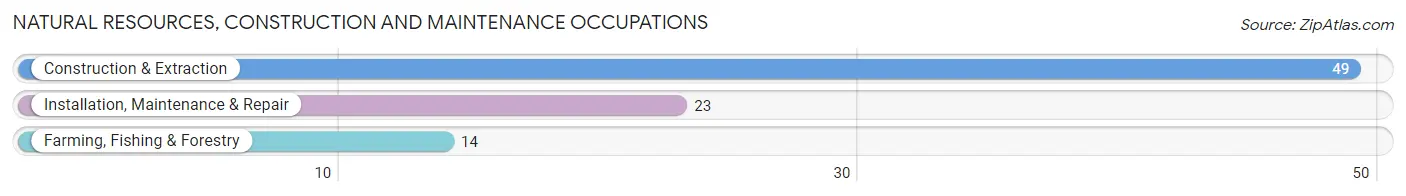
Natural Resources, Construction and Maintenance Occupations
The most common Natural Resources, Construction and Maintenance occupations in Athens are Construction & Extraction (49 | 10.0%), Installation, Maintenance & Repair (23 | 4.7%), and Farming, Fishing & Forestry (14 | 2.9%).
Natural Resources, Construction and Maintenance Occupations by Sex
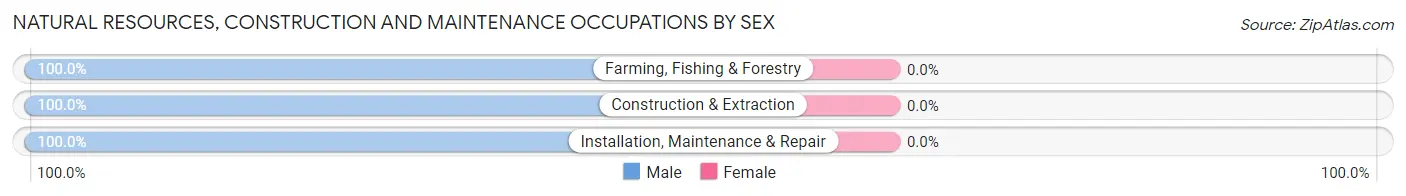
| Occupation | Male | Female |
| Farming, Fishing & Forestry | 14 (100.0%) | 0 (0.0%) |
| Construction & Extraction | 49 (100.0%) | 0 (0.0%) |
| Installation, Maintenance & Repair | 23 (100.0%) | 0 (0.0%) |
| Total (Category) | 86 (100.0%) | 0 (0.0%) |
| Total (Overall) | 266 (54.3%) | 224 (45.7%) |
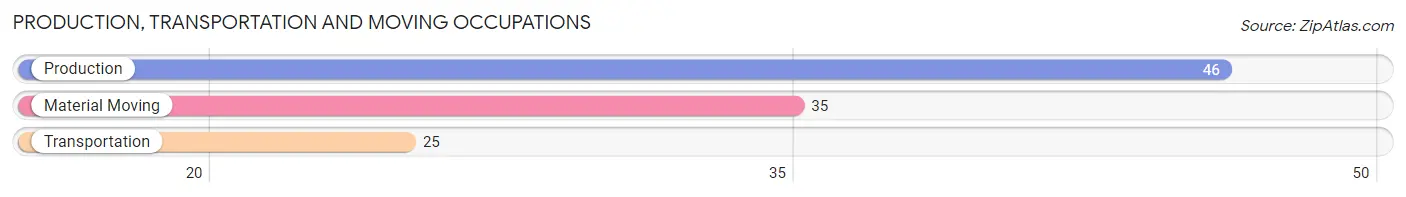
Production, Transportation and Moving Occupations
The most common Production, Transportation and Moving occupations in Athens are Production (46 | 9.4%), Material Moving (35 | 7.1%), and Transportation (25 | 5.1%).
Production, Transportation and Moving Occupations by Sex
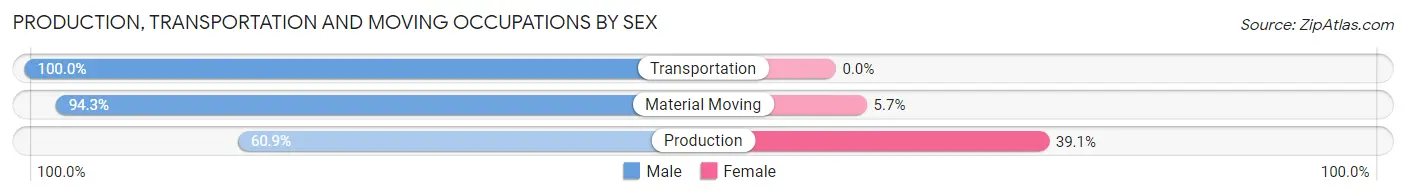
| Occupation | Male | Female |
| Production | 28 (60.9%) | 18 (39.1%) |
| Transportation | 25 (100.0%) | 0 (0.0%) |
| Material Moving | 33 (94.3%) | 2 (5.7%) |
| Total (Category) | 86 (81.1%) | 20 (18.9%) |
| Total (Overall) | 266 (54.3%) | 224 (45.7%) |
Employment Industries by Sex in Athens
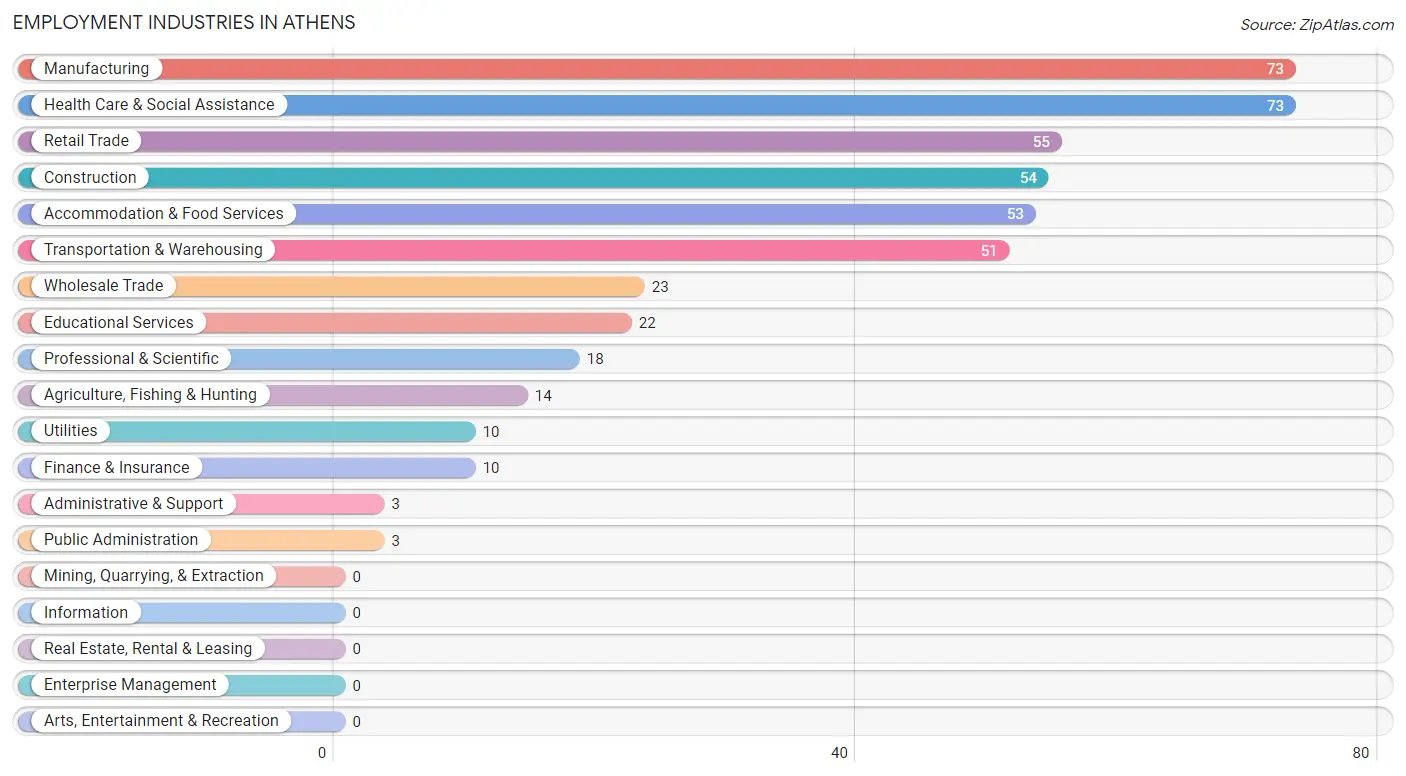
Employment Industries in Athens
The major employment industries in Athens include Manufacturing (73 | 14.9%), Health Care & Social Assistance (73 | 14.9%), Retail Trade (55 | 11.2%), Construction (54 | 11.0%), and Accommodation & Food Services (53 | 10.8%).
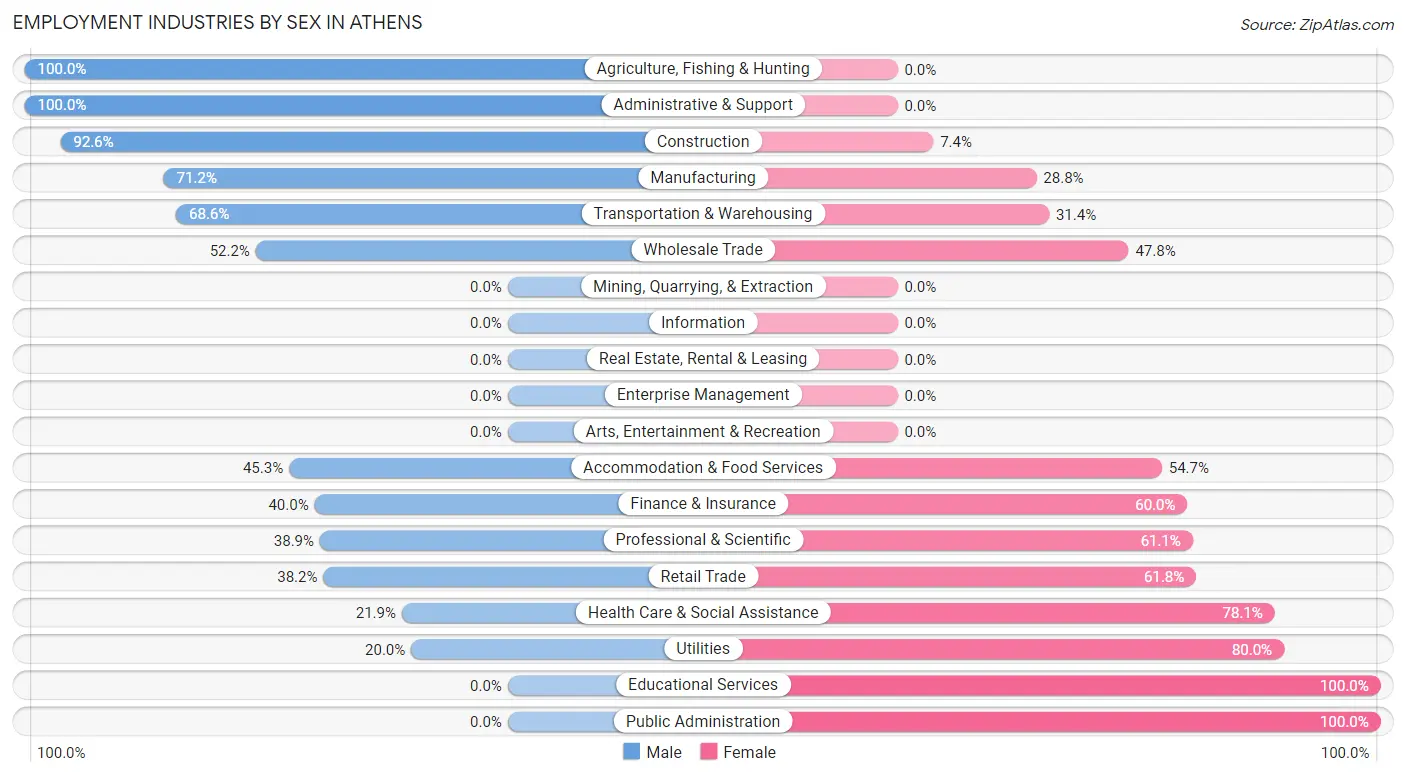
Employment Industries by Sex in Athens
The Athens industries that see more men than women are Agriculture, Fishing & Hunting (100.0%), Administrative & Support (100.0%), and Construction (92.6%), whereas the industries that tend to have a higher number of women are Educational Services (100.0%), Public Administration (100.0%), and Utilities (80.0%).
| Industry | Male | Female |
| Agriculture, Fishing & Hunting | 14 (100.0%) | 0 (0.0%) |
| Mining, Quarrying, & Extraction | 0 (0.0%) | 0 (0.0%) |
| Construction | 50 (92.6%) | 4 (7.4%) |
| Manufacturing | 52 (71.2%) | 21 (28.8%) |
| Wholesale Trade | 12 (52.2%) | 11 (47.8%) |
| Retail Trade | 21 (38.2%) | 34 (61.8%) |
| Transportation & Warehousing | 35 (68.6%) | 16 (31.4%) |
| Utilities | 2 (20.0%) | 8 (80.0%) |
| Information | 0 (0.0%) | 0 (0.0%) |
| Finance & Insurance | 4 (40.0%) | 6 (60.0%) |
| Real Estate, Rental & Leasing | 0 (0.0%) | 0 (0.0%) |
| Professional & Scientific | 7 (38.9%) | 11 (61.1%) |
| Enterprise Management | 0 (0.0%) | 0 (0.0%) |
| Administrative & Support | 3 (100.0%) | 0 (0.0%) |
| Educational Services | 0 (0.0%) | 22 (100.0%) |
| Health Care & Social Assistance | 16 (21.9%) | 57 (78.1%) |
| Arts, Entertainment & Recreation | 0 (0.0%) | 0 (0.0%) |
| Accommodation & Food Services | 24 (45.3%) | 29 (54.7%) |
| Public Administration | 0 (0.0%) | 3 (100.0%) |
| Total | 266 (54.3%) | 224 (45.7%) |
Education in Athens
School Enrollment in Athens
The most common levels of schooling among the 197 students in Athens are high school (69 | 35.0%), middle school (65 | 33.0%), and elementary school (39 | 19.8%).
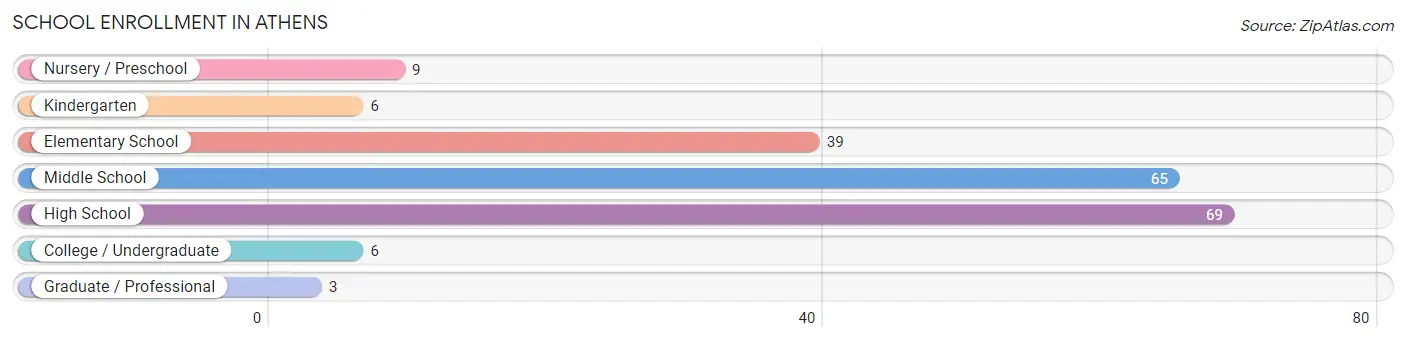
| School Level | # Students | % Students |
| Nursery / Preschool | 9 | 4.6% |
| Kindergarten | 6 | 3.0% |
| Elementary School | 39 | 19.8% |
| Middle School | 65 | 33.0% |
| High School | 69 | 35.0% |
| College / Undergraduate | 6 | 3.0% |
| Graduate / Professional | 3 | 1.5% |
| Total | 197 | 100.0% |
School Enrollment by Age by Funding Source in Athens
Out of a total of 197 students who are enrolled in schools in Athens, 26 (13.2%) attend a private institution, while the remaining 171 (86.8%) are enrolled in public schools. The age group of 3 to 4 year olds has the highest likelihood of being enrolled in private schools, with 4 (100.0% in the age bracket) enrolled. Conversely, the age group of 15 to 17 year olds has the lowest likelihood of being enrolled in a private school, with 58 (100.0% in the age bracket) attending a public institution.
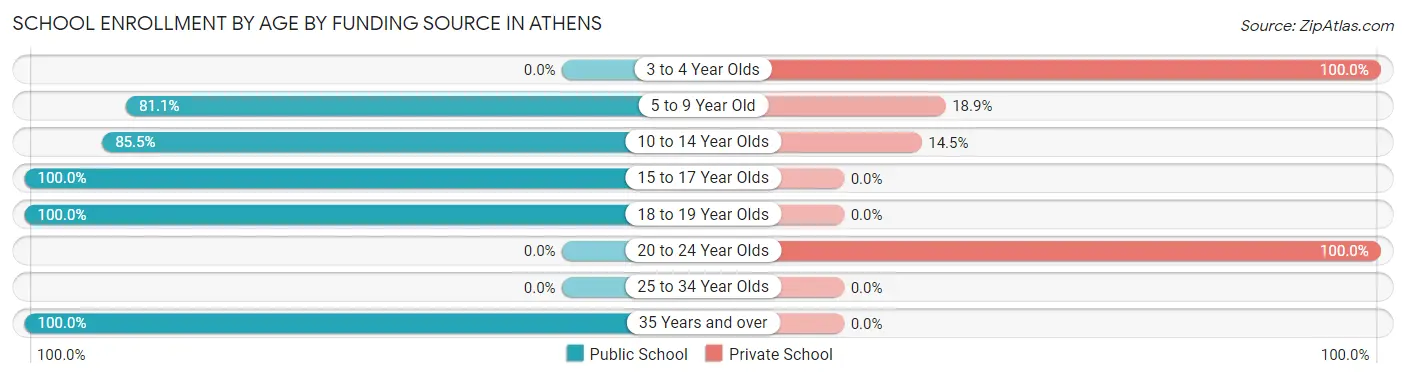
| Age Bracket | Public School | Private School |
| 3 to 4 Year Olds | 0 (0.0%) | 4 (100.0%) |
| 5 to 9 Year Old | 30 (81.1%) | 7 (18.9%) |
| 10 to 14 Year Olds | 71 (85.5%) | 12 (14.5%) |
| 15 to 17 Year Olds | 58 (100.0%) | 0 (0.0%) |
| 18 to 19 Year Olds | 9 (100.0%) | 0 (0.0%) |
| 20 to 24 Year Olds | 0 (0.0%) | 3 (100.0%) |
| 25 to 34 Year Olds | 0 (0.0%) | 0 (0.0%) |
| 35 Years and over | 3 (100.0%) | 0 (0.0%) |
| Total | 171 (86.8%) | 26 (13.2%) |
Educational Attainment by Field of Study in Athens
Education (47 | 44.8%), business (27 | 25.7%), science & technology (8 | 7.6%), liberal arts & history (6 | 5.7%), and visual & performing arts (6 | 5.7%) are the most common fields of study among 105 individuals in Athens who have obtained a bachelor's degree or higher.
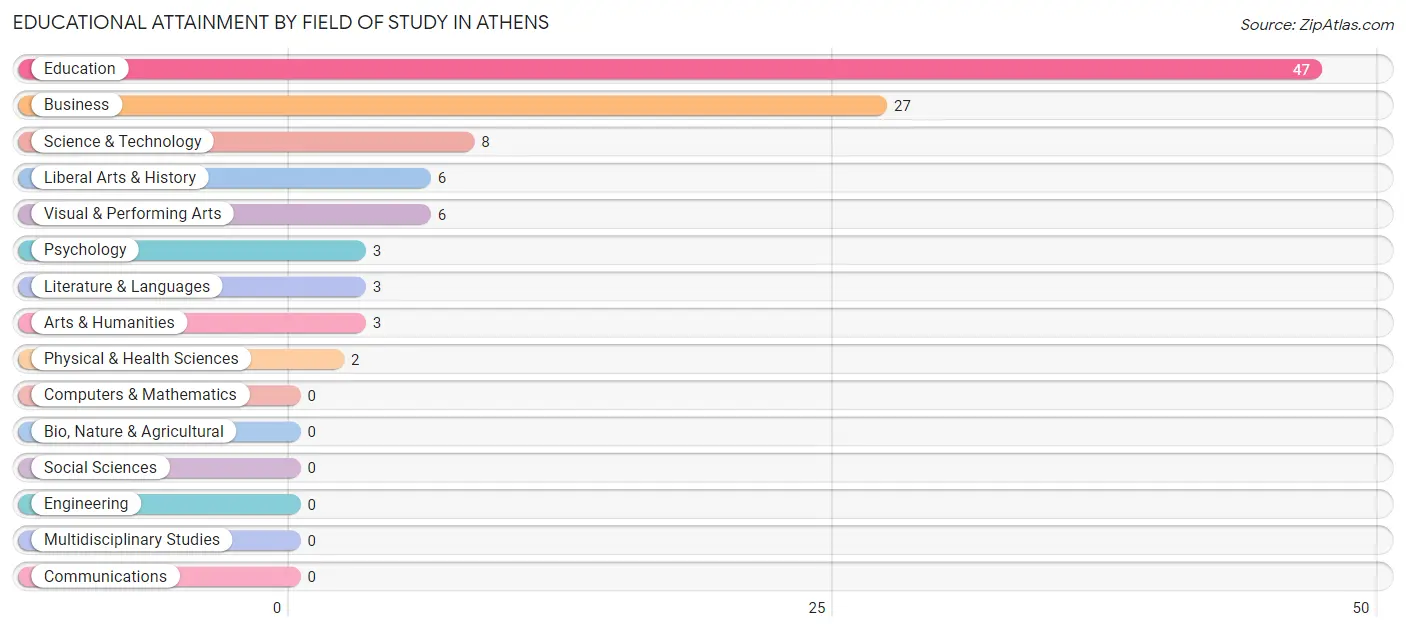
| Field of Study | # Graduates | % Graduates |
| Computers & Mathematics | 0 | 0.0% |
| Bio, Nature & Agricultural | 0 | 0.0% |
| Physical & Health Sciences | 2 | 1.9% |
| Psychology | 3 | 2.9% |
| Social Sciences | 0 | 0.0% |
| Engineering | 0 | 0.0% |
| Multidisciplinary Studies | 0 | 0.0% |
| Science & Technology | 8 | 7.6% |
| Business | 27 | 25.7% |
| Education | 47 | 44.8% |
| Literature & Languages | 3 | 2.9% |
| Liberal Arts & History | 6 | 5.7% |
| Visual & Performing Arts | 6 | 5.7% |
| Communications | 0 | 0.0% |
| Arts & Humanities | 3 | 2.9% |
| Total | 105 | 100.0% |
Transportation & Commute in Athens
Vehicle Availability by Sex in Athens
The most prevalent vehicle ownership categories in Athens are males with 2 vehicles (121, accounting for 46.0%) and females with 2 vehicles (94, making up 54.7%).
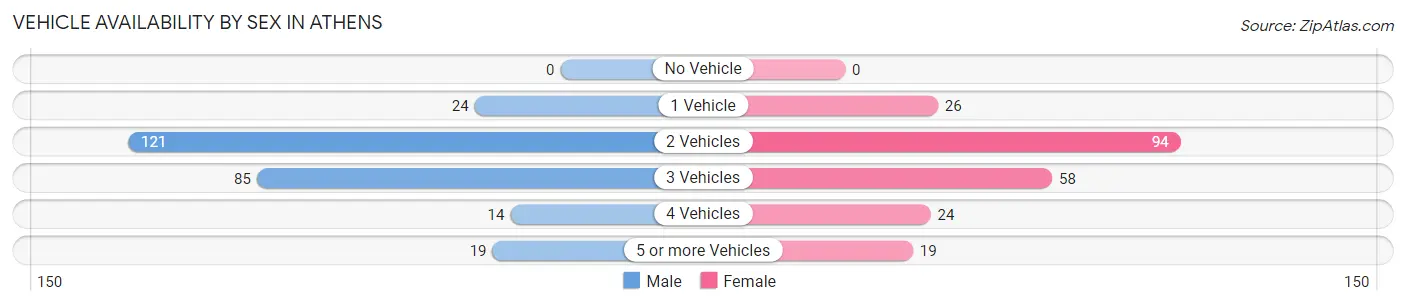
| Vehicles Available | Male | Female |
| No Vehicle | 0 (0.0%) | 0 (0.0%) |
| 1 Vehicle | 24 (9.1%) | 26 (11.8%) |
| 2 Vehicles | 121 (46.0%) | 94 (42.5%) |
| 3 Vehicles | 85 (32.3%) | 58 (26.2%) |
| 4 Vehicles | 14 (5.3%) | 24 (10.9%) |
| 5 or more Vehicles | 19 (7.2%) | 19 (8.6%) |
| Total | 263 (100.0%) | 221 (100.0%) |
Commute Time in Athens
The most frequently occuring commute durations in Athens are 5 to 9 minutes (104 commuters, 22.8%), 30 to 34 minutes (75 commuters, 16.5%), and 20 to 24 minutes (55 commuters, 12.1%).
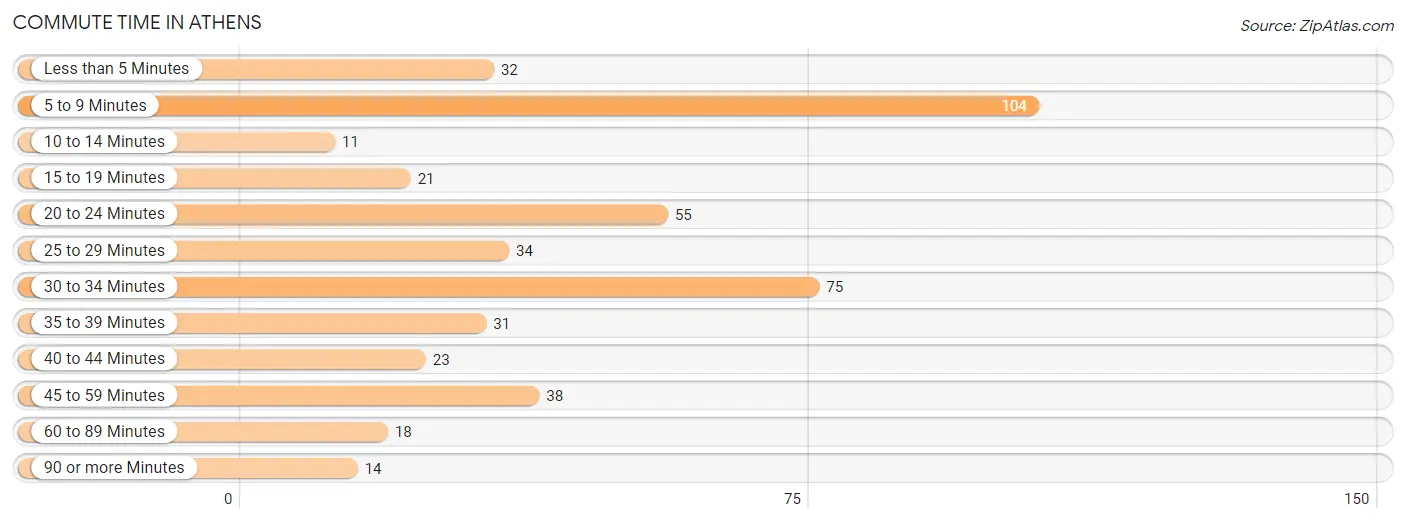
| Commute Time | # Commuters | % Commuters |
| Less than 5 Minutes | 32 | 7.0% |
| 5 to 9 Minutes | 104 | 22.8% |
| 10 to 14 Minutes | 11 | 2.4% |
| 15 to 19 Minutes | 21 | 4.6% |
| 20 to 24 Minutes | 55 | 12.1% |
| 25 to 29 Minutes | 34 | 7.5% |
| 30 to 34 Minutes | 75 | 16.5% |
| 35 to 39 Minutes | 31 | 6.8% |
| 40 to 44 Minutes | 23 | 5.0% |
| 45 to 59 Minutes | 38 | 8.3% |
| 60 to 89 Minutes | 18 | 4.0% |
| 90 or more Minutes | 14 | 3.1% |
Commute Time by Sex in Athens
The most common commute times in Athens are 5 to 9 minutes (59 commuters, 23.0%) for males and 5 to 9 minutes (45 commuters, 22.6%) for females.
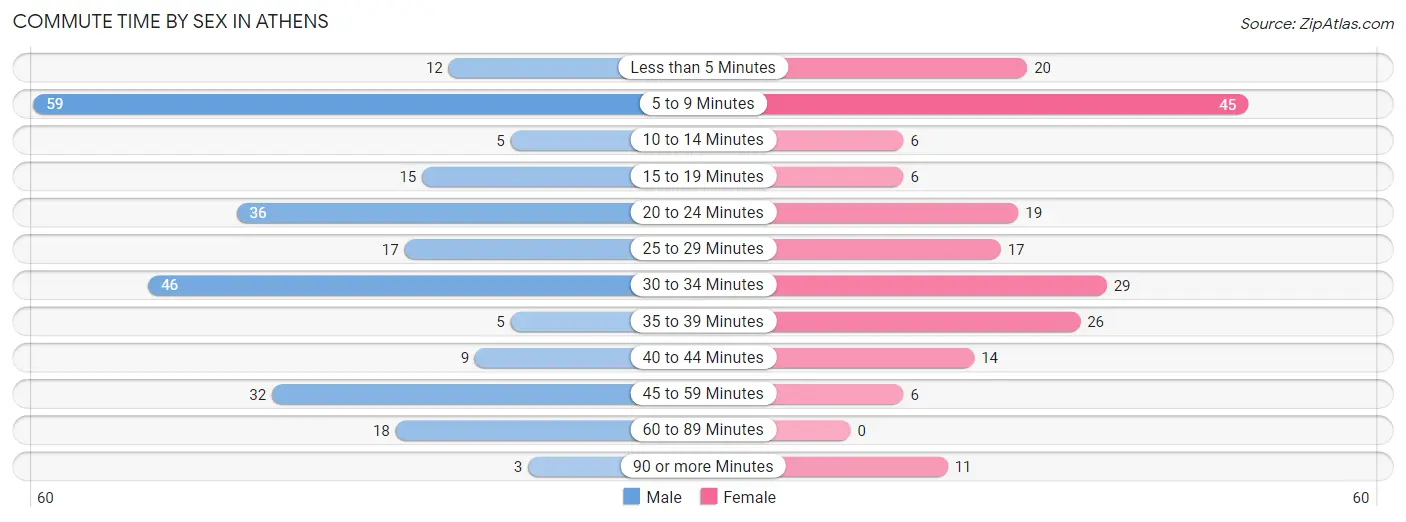
| Commute Time | Male | Female |
| Less than 5 Minutes | 12 (4.7%) | 20 (10.1%) |
| 5 to 9 Minutes | 59 (23.0%) | 45 (22.6%) |
| 10 to 14 Minutes | 5 (1.9%) | 6 (3.0%) |
| 15 to 19 Minutes | 15 (5.8%) | 6 (3.0%) |
| 20 to 24 Minutes | 36 (14.0%) | 19 (9.6%) |
| 25 to 29 Minutes | 17 (6.6%) | 17 (8.5%) |
| 30 to 34 Minutes | 46 (17.9%) | 29 (14.6%) |
| 35 to 39 Minutes | 5 (1.9%) | 26 (13.1%) |
| 40 to 44 Minutes | 9 (3.5%) | 14 (7.0%) |
| 45 to 59 Minutes | 32 (12.4%) | 6 (3.0%) |
| 60 to 89 Minutes | 18 (7.0%) | 0 (0.0%) |
| 90 or more Minutes | 3 (1.2%) | 11 (5.5%) |
Time of Departure to Work by Sex in Athens
The most frequent times of departure to work in Athens are 12:00 AM to 4:59 AM (45, 17.5%) for males and 7:00 AM to 7:29 AM (56, 28.1%) for females.
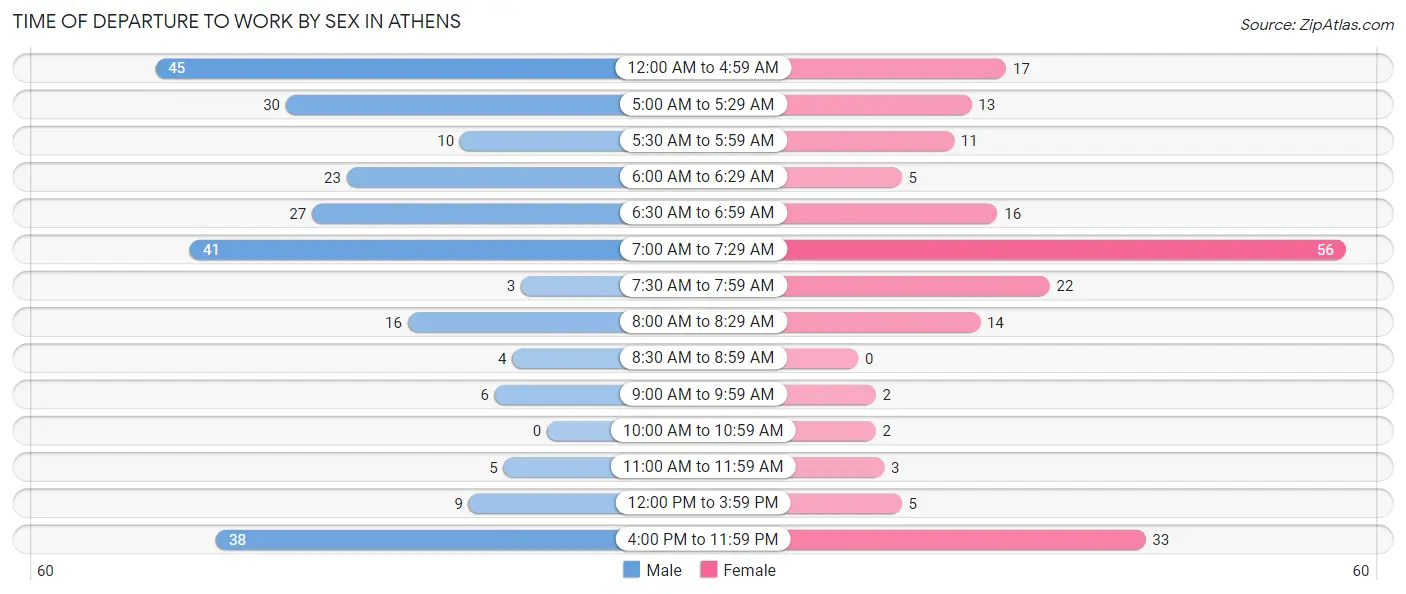
| Time of Departure | Male | Female |
| 12:00 AM to 4:59 AM | 45 (17.5%) | 17 (8.5%) |
| 5:00 AM to 5:29 AM | 30 (11.7%) | 13 (6.5%) |
| 5:30 AM to 5:59 AM | 10 (3.9%) | 11 (5.5%) |
| 6:00 AM to 6:29 AM | 23 (8.9%) | 5 (2.5%) |
| 6:30 AM to 6:59 AM | 27 (10.5%) | 16 (8.0%) |
| 7:00 AM to 7:29 AM | 41 (16.0%) | 56 (28.1%) |
| 7:30 AM to 7:59 AM | 3 (1.2%) | 22 (11.1%) |
| 8:00 AM to 8:29 AM | 16 (6.2%) | 14 (7.0%) |
| 8:30 AM to 8:59 AM | 4 (1.6%) | 0 (0.0%) |
| 9:00 AM to 9:59 AM | 6 (2.3%) | 2 (1.0%) |
| 10:00 AM to 10:59 AM | 0 (0.0%) | 2 (1.0%) |
| 11:00 AM to 11:59 AM | 5 (1.9%) | 3 (1.5%) |
| 12:00 PM to 3:59 PM | 9 (3.5%) | 5 (2.5%) |
| 4:00 PM to 11:59 PM | 38 (14.8%) | 33 (16.6%) |
| Total | 257 (100.0%) | 199 (100.0%) |
Housing Occupancy in Athens
Occupancy by Ownership in Athens
Of the total 451 dwellings in Athens, owner-occupied units account for 304 (67.4%), while renter-occupied units make up 147 (32.6%).
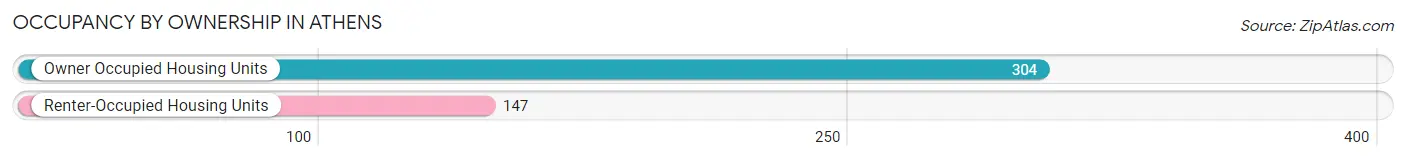
| Occupancy | # Housing Units | % Housing Units |
| Owner Occupied Housing Units | 304 | 67.4% |
| Renter-Occupied Housing Units | 147 | 32.6% |
| Total Occupied Housing Units | 451 | 100.0% |
Occupancy by Household Size in Athens
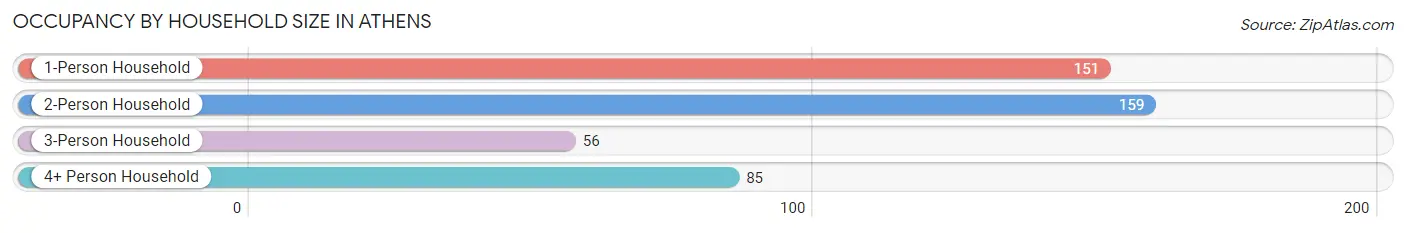
| Household Size | # Housing Units | % Housing Units |
| 1-Person Household | 151 | 33.5% |
| 2-Person Household | 159 | 35.2% |
| 3-Person Household | 56 | 12.4% |
| 4+ Person Household | 85 | 18.9% |
| Total Housing Units | 451 | 100.0% |
Occupancy by Ownership by Household Size in Athens
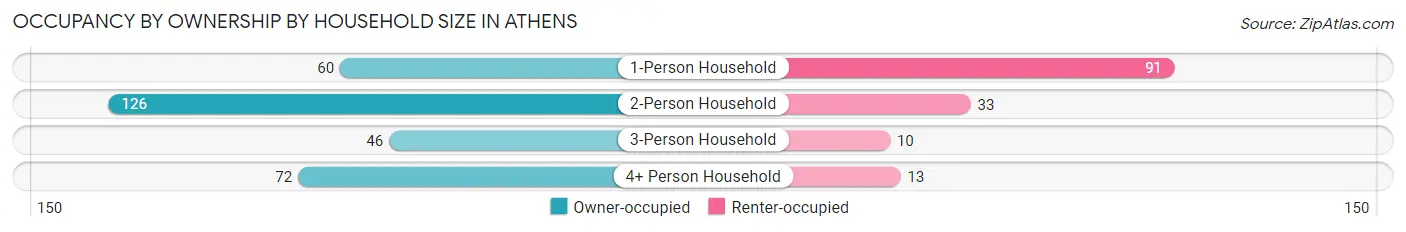
| Household Size | Owner-occupied | Renter-occupied |
| 1-Person Household | 60 (39.7%) | 91 (60.3%) |
| 2-Person Household | 126 (79.2%) | 33 (20.7%) |
| 3-Person Household | 46 (82.1%) | 10 (17.9%) |
| 4+ Person Household | 72 (84.7%) | 13 (15.3%) |
| Total Housing Units | 304 (67.4%) | 147 (32.6%) |
Occupancy by Educational Attainment in Athens
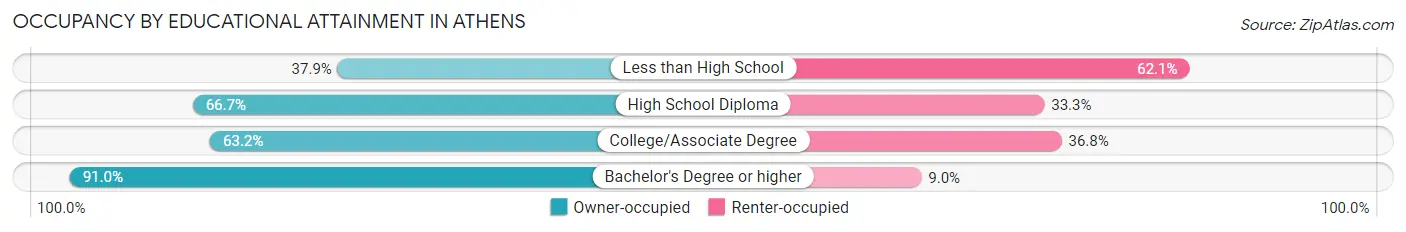
| Household Size | Owner-occupied | Renter-occupied |
| Less than High School | 11 (37.9%) | 18 (62.1%) |
| High School Diploma | 146 (66.7%) | 73 (33.3%) |
| College/Associate Degree | 86 (63.2%) | 50 (36.8%) |
| Bachelor's Degree or higher | 61 (91.0%) | 6 (9.0%) |
Occupancy by Age of Householder in Athens
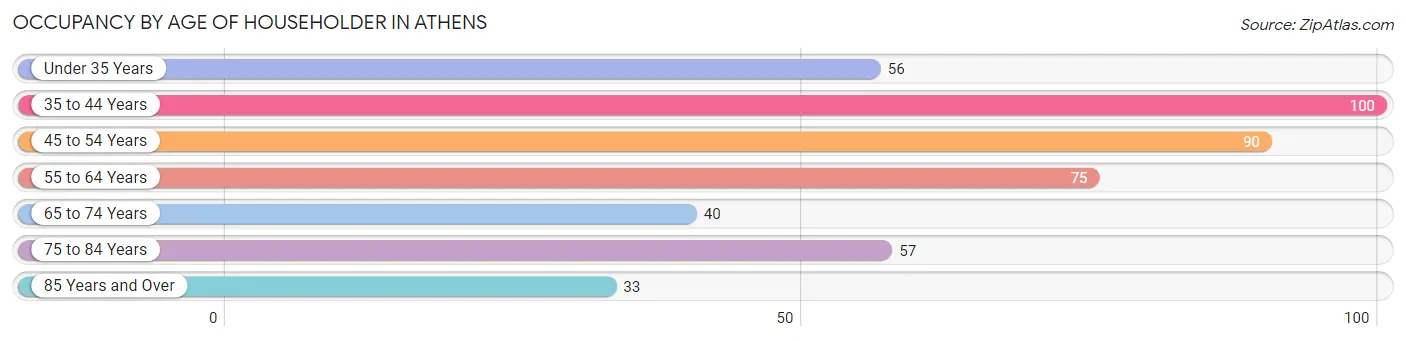
| Age Bracket | # Households | % Households |
| Under 35 Years | 56 | 12.4% |
| 35 to 44 Years | 100 | 22.2% |
| 45 to 54 Years | 90 | 20.0% |
| 55 to 64 Years | 75 | 16.6% |
| 65 to 74 Years | 40 | 8.9% |
| 75 to 84 Years | 57 | 12.6% |
| 85 Years and Over | 33 | 7.3% |
| Total | 451 | 100.0% |
Housing Finances in Athens
Median Income by Occupancy in Athens
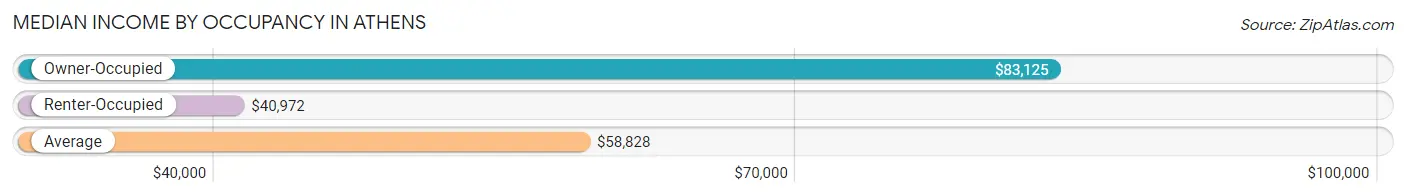
| Occupancy Type | # Households | Median Income |
| Owner-Occupied | 304 (67.4%) | $83,125 |
| Renter-Occupied | 147 (32.6%) | $40,972 |
| Average | 451 (100.0%) | $58,828 |
Occupancy by Householder Income Bracket in Athens
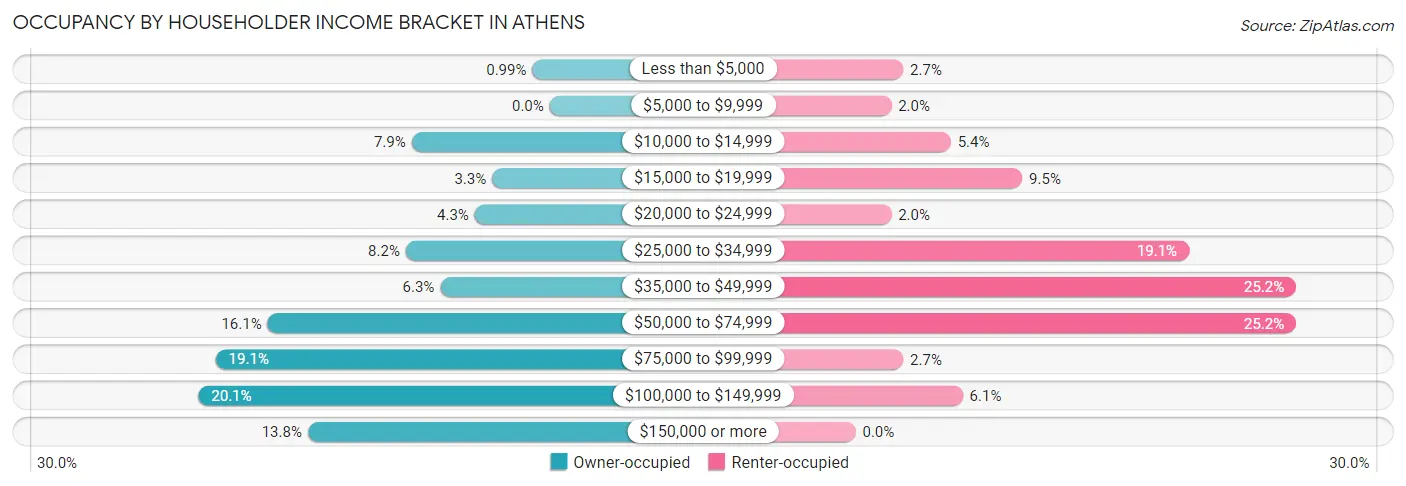
| Income Bracket | Owner-occupied | Renter-occupied |
| Less than $5,000 | 3 (1.0%) | 4 (2.7%) |
| $5,000 to $9,999 | 0 (0.0%) | 3 (2.0%) |
| $10,000 to $14,999 | 24 (7.9%) | 8 (5.4%) |
| $15,000 to $19,999 | 10 (3.3%) | 14 (9.5%) |
| $20,000 to $24,999 | 13 (4.3%) | 3 (2.0%) |
| $25,000 to $34,999 | 25 (8.2%) | 28 (19.1%) |
| $35,000 to $49,999 | 19 (6.2%) | 37 (25.2%) |
| $50,000 to $74,999 | 49 (16.1%) | 37 (25.2%) |
| $75,000 to $99,999 | 58 (19.1%) | 4 (2.7%) |
| $100,000 to $149,999 | 61 (20.1%) | 9 (6.1%) |
| $150,000 or more | 42 (13.8%) | 0 (0.0%) |
| Total | 304 (100.0%) | 147 (100.0%) |
Monthly Housing Cost Tiers in Athens
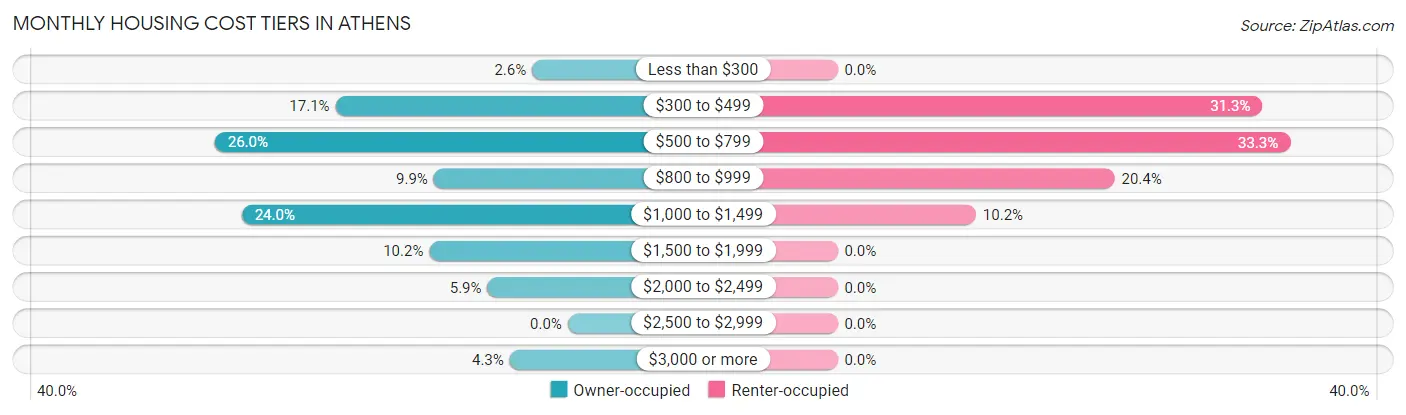
| Monthly Cost | Owner-occupied | Renter-occupied |
| Less than $300 | 8 (2.6%) | 0 (0.0%) |
| $300 to $499 | 52 (17.1%) | 46 (31.3%) |
| $500 to $799 | 79 (26.0%) | 49 (33.3%) |
| $800 to $999 | 30 (9.9%) | 30 (20.4%) |
| $1,000 to $1,499 | 73 (24.0%) | 15 (10.2%) |
| $1,500 to $1,999 | 31 (10.2%) | 0 (0.0%) |
| $2,000 to $2,499 | 18 (5.9%) | 0 (0.0%) |
| $2,500 to $2,999 | 0 (0.0%) | 0 (0.0%) |
| $3,000 or more | 13 (4.3%) | 0 (0.0%) |
| Total | 304 (100.0%) | 147 (100.0%) |
Physical Housing Characteristics in Athens
Housing Structures in Athens
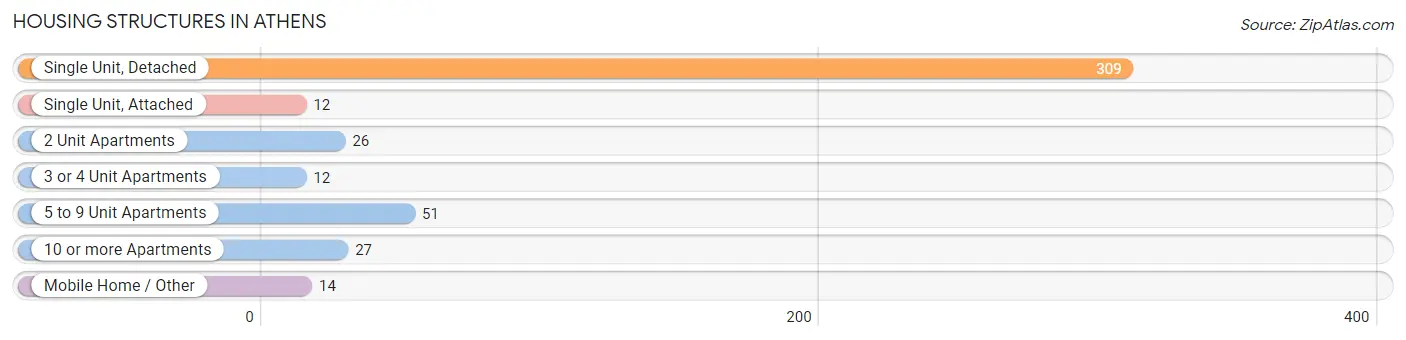
| Structure Type | # Housing Units | % Housing Units |
| Single Unit, Detached | 309 | 68.5% |
| Single Unit, Attached | 12 | 2.7% |
| 2 Unit Apartments | 26 | 5.8% |
| 3 or 4 Unit Apartments | 12 | 2.7% |
| 5 to 9 Unit Apartments | 51 | 11.3% |
| 10 or more Apartments | 27 | 6.0% |
| Mobile Home / Other | 14 | 3.1% |
| Total | 451 | 100.0% |
Housing Structures by Occupancy in Athens
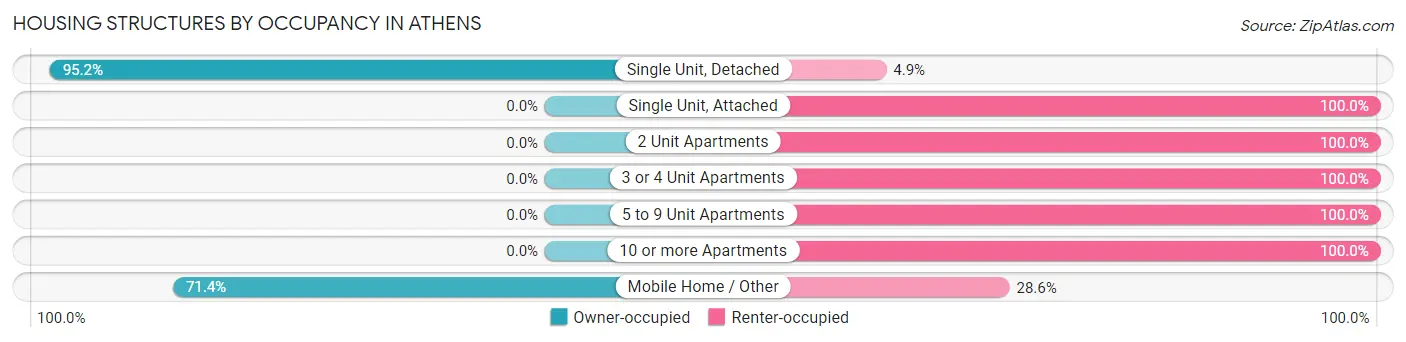
| Structure Type | Owner-occupied | Renter-occupied |
| Single Unit, Detached | 294 (95.2%) | 15 (4.9%) |
| Single Unit, Attached | 0 (0.0%) | 12 (100.0%) |
| 2 Unit Apartments | 0 (0.0%) | 26 (100.0%) |
| 3 or 4 Unit Apartments | 0 (0.0%) | 12 (100.0%) |
| 5 to 9 Unit Apartments | 0 (0.0%) | 51 (100.0%) |
| 10 or more Apartments | 0 (0.0%) | 27 (100.0%) |
| Mobile Home / Other | 10 (71.4%) | 4 (28.6%) |
| Total | 304 (67.4%) | 147 (32.6%) |
Housing Structures by Number of Rooms in Athens
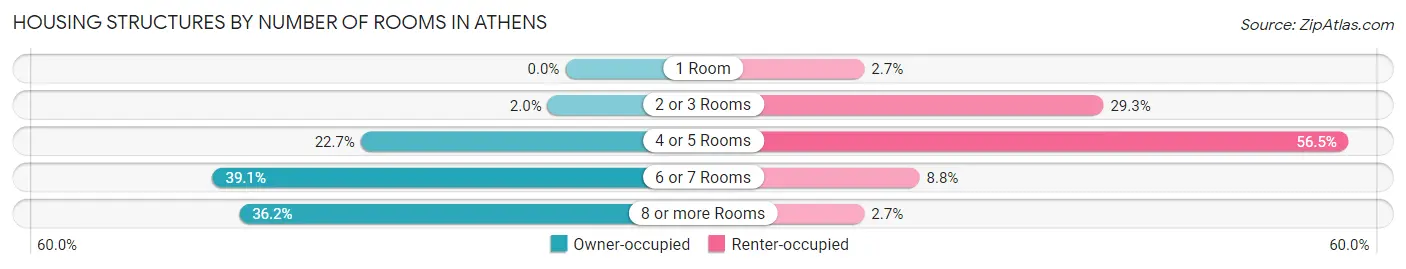
| Number of Rooms | Owner-occupied | Renter-occupied |
| 1 Room | 0 (0.0%) | 4 (2.7%) |
| 2 or 3 Rooms | 6 (2.0%) | 43 (29.2%) |
| 4 or 5 Rooms | 69 (22.7%) | 83 (56.5%) |
| 6 or 7 Rooms | 119 (39.1%) | 13 (8.8%) |
| 8 or more Rooms | 110 (36.2%) | 4 (2.7%) |
| Total | 304 (100.0%) | 147 (100.0%) |
Housing Structure by Heating Type in Athens
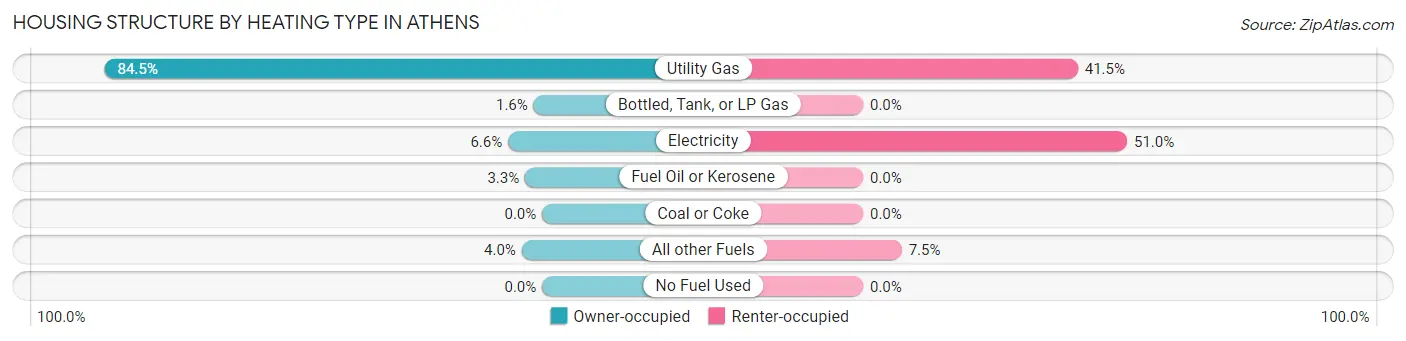
| Heating Type | Owner-occupied | Renter-occupied |
| Utility Gas | 257 (84.5%) | 61 (41.5%) |
| Bottled, Tank, or LP Gas | 5 (1.6%) | 0 (0.0%) |
| Electricity | 20 (6.6%) | 75 (51.0%) |
| Fuel Oil or Kerosene | 10 (3.3%) | 0 (0.0%) |
| Coal or Coke | 0 (0.0%) | 0 (0.0%) |
| All other Fuels | 12 (4.0%) | 11 (7.5%) |
| No Fuel Used | 0 (0.0%) | 0 (0.0%) |
| Total | 304 (100.0%) | 147 (100.0%) |
Household Vehicle Usage in Athens
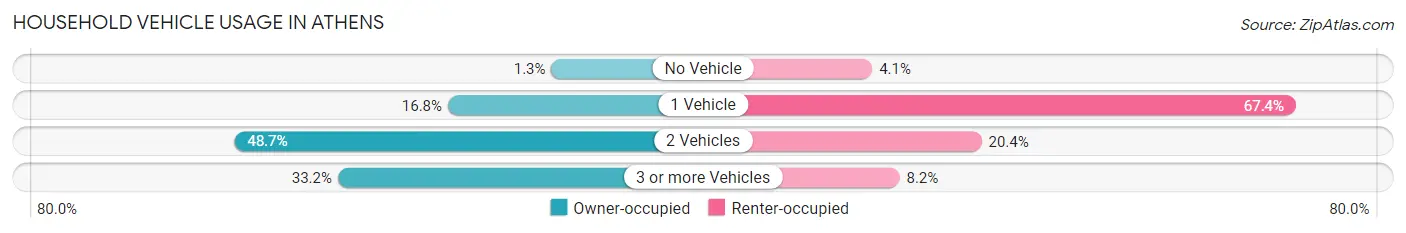
| Vehicles per Household | Owner-occupied | Renter-occupied |
| No Vehicle | 4 (1.3%) | 6 (4.1%) |
| 1 Vehicle | 51 (16.8%) | 99 (67.3%) |
| 2 Vehicles | 148 (48.7%) | 30 (20.4%) |
| 3 or more Vehicles | 101 (33.2%) | 12 (8.2%) |
| Total | 304 (100.0%) | 147 (100.0%) |
Real Estate & Mortgages in Athens
Real Estate and Mortgage Overview in Athens
| Characteristic | Without Mortgage | With Mortgage |
| Housing Units | 136 | 168 |
| Median Property Value | $152,400 | $180,800 |
| Median Household Income | $48,333 | $33 |
| Monthly Housing Costs | $523 | $13 |
| Real Estate Taxes | $2,325 | $0 |
Property Value by Mortgage Status in Athens
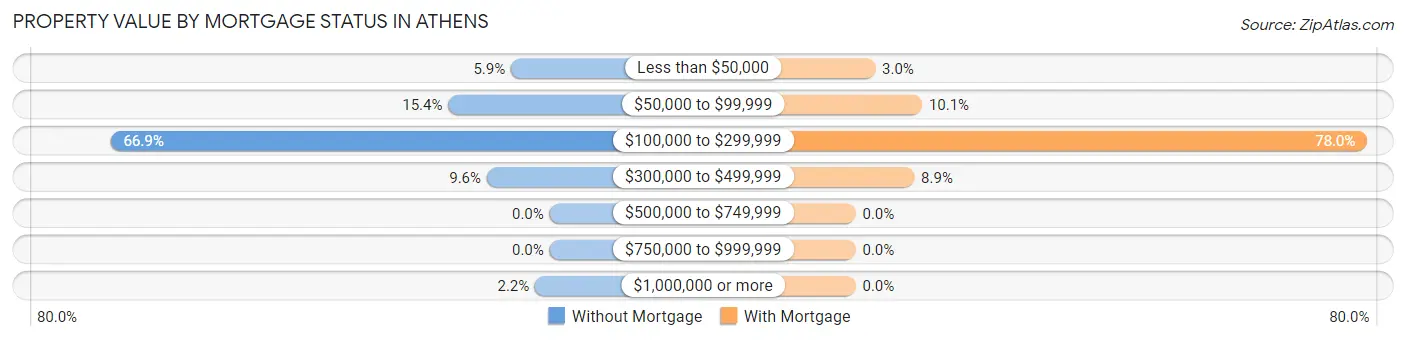
| Property Value | Without Mortgage | With Mortgage |
| Less than $50,000 | 8 (5.9%) | 5 (3.0%) |
| $50,000 to $99,999 | 21 (15.4%) | 17 (10.1%) |
| $100,000 to $299,999 | 91 (66.9%) | 131 (78.0%) |
| $300,000 to $499,999 | 13 (9.6%) | 15 (8.9%) |
| $500,000 to $749,999 | 0 (0.0%) | 0 (0.0%) |
| $750,000 to $999,999 | 0 (0.0%) | 0 (0.0%) |
| $1,000,000 or more | 3 (2.2%) | 0 (0.0%) |
| Total | 136 (100.0%) | 168 (100.0%) |
Household Income by Mortgage Status in Athens
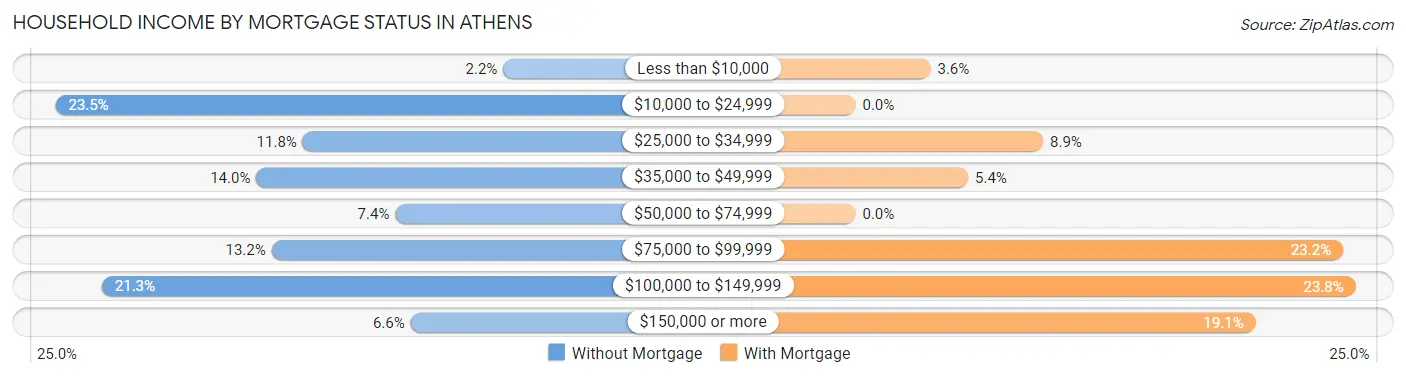
| Household Income | Without Mortgage | With Mortgage |
| Less than $10,000 | 3 (2.2%) | 6 (3.6%) |
| $10,000 to $24,999 | 32 (23.5%) | 0 (0.0%) |
| $25,000 to $34,999 | 16 (11.8%) | 15 (8.9%) |
| $35,000 to $49,999 | 19 (14.0%) | 9 (5.4%) |
| $50,000 to $74,999 | 10 (7.3%) | 0 (0.0%) |
| $75,000 to $99,999 | 18 (13.2%) | 39 (23.2%) |
| $100,000 to $149,999 | 29 (21.3%) | 40 (23.8%) |
| $150,000 or more | 9 (6.6%) | 32 (19.1%) |
| Total | 136 (100.0%) | 168 (100.0%) |
Property Value to Household Income Ratio in Athens
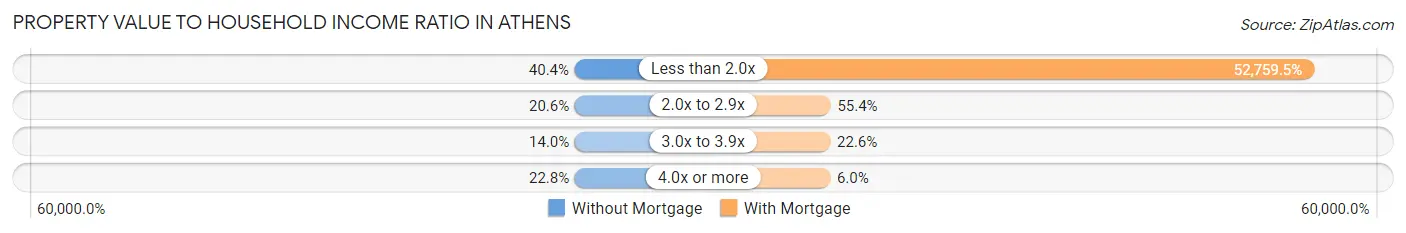
| Value-to-Income Ratio | Without Mortgage | With Mortgage |
| Less than 2.0x | 55 (40.4%) | 88,636 (52,759.5%) |
| 2.0x to 2.9x | 28 (20.6%) | 93 (55.4%) |
| 3.0x to 3.9x | 19 (14.0%) | 38 (22.6%) |
| 4.0x or more | 31 (22.8%) | 10 (5.9%) |
| Total | 136 (100.0%) | 168 (100.0%) |
Real Estate Taxes by Mortgage Status in Athens
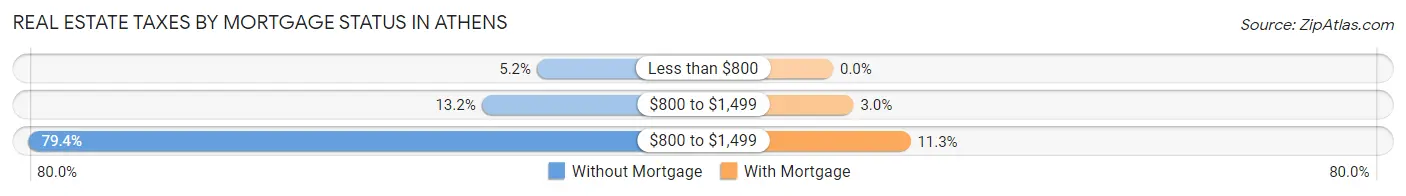
| Property Taxes | Without Mortgage | With Mortgage |
| Less than $800 | 7 (5.1%) | 0 (0.0%) |
| $800 to $1,499 | 18 (13.2%) | 5 (3.0%) |
| $800 to $1,499 | 108 (79.4%) | 19 (11.3%) |
| Total | 136 (100.0%) | 168 (100.0%) |
Health & Disability in Athens
Health Insurance Coverage by Age in Athens
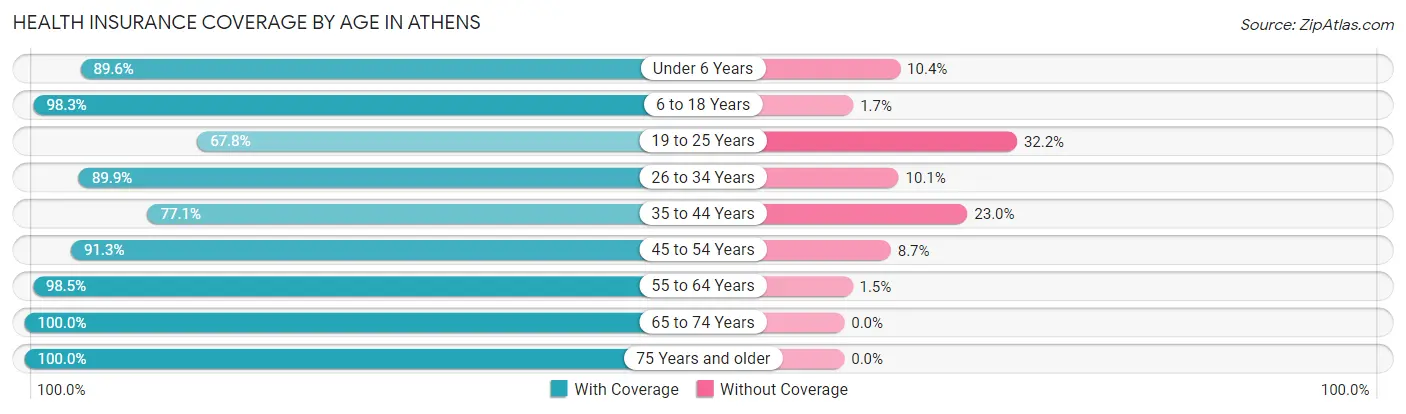
| Age Bracket | With Coverage | Without Coverage |
| Under 6 Years | 43 (89.6%) | 5 (10.4%) |
| 6 to 18 Years | 178 (98.3%) | 3 (1.7%) |
| 19 to 25 Years | 40 (67.8%) | 19 (32.2%) |
| 26 to 34 Years | 71 (89.9%) | 8 (10.1%) |
| 35 to 44 Years | 141 (77.0%) | 42 (23.0%) |
| 45 to 54 Years | 137 (91.3%) | 13 (8.7%) |
| 55 to 64 Years | 129 (98.5%) | 2 (1.5%) |
| 65 to 74 Years | 63 (100.0%) | 0 (0.0%) |
| 75 Years and older | 121 (100.0%) | 0 (0.0%) |
| Total | 923 (90.9%) | 92 (9.1%) |
Health Insurance Coverage by Citizenship Status in Athens
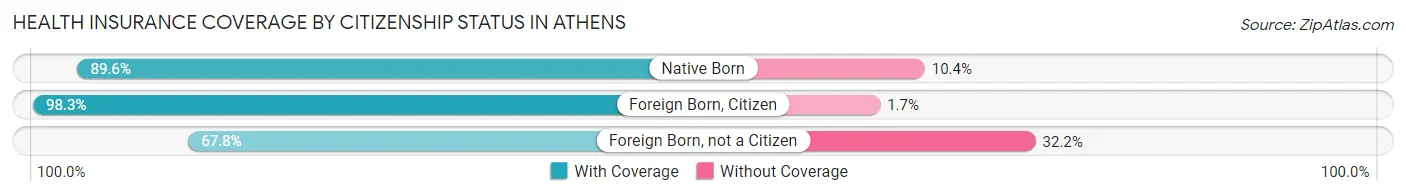
| Citizenship Status | With Coverage | Without Coverage |
| Native Born | 43 (89.6%) | 5 (10.4%) |
| Foreign Born, Citizen | 178 (98.3%) | 3 (1.7%) |
| Foreign Born, not a Citizen | 40 (67.8%) | 19 (32.2%) |
Health Insurance Coverage by Household Income in Athens
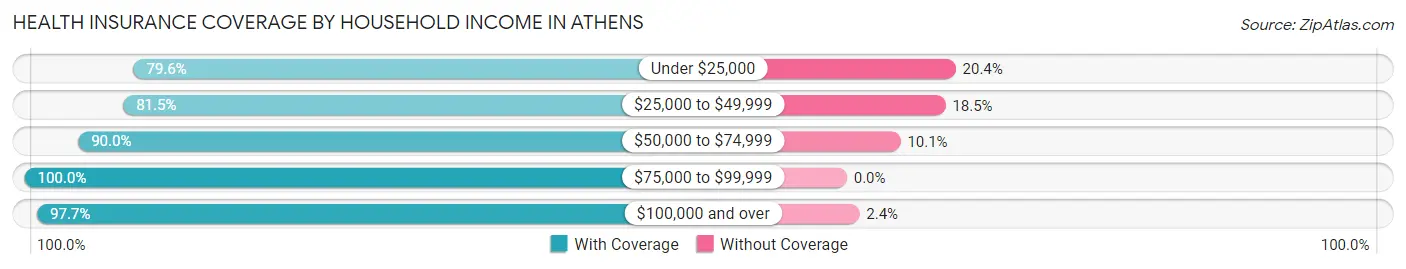
| Household Income | With Coverage | Without Coverage |
| Under $25,000 | 121 (79.6%) | 31 (20.4%) |
| $25,000 to $49,999 | 150 (81.5%) | 34 (18.5%) |
| $50,000 to $74,999 | 170 (89.9%) | 19 (10.1%) |
| $75,000 to $99,999 | 149 (100.0%) | 0 (0.0%) |
| $100,000 and over | 333 (97.7%) | 8 (2.4%) |
Public vs Private Health Insurance Coverage by Age in Athens
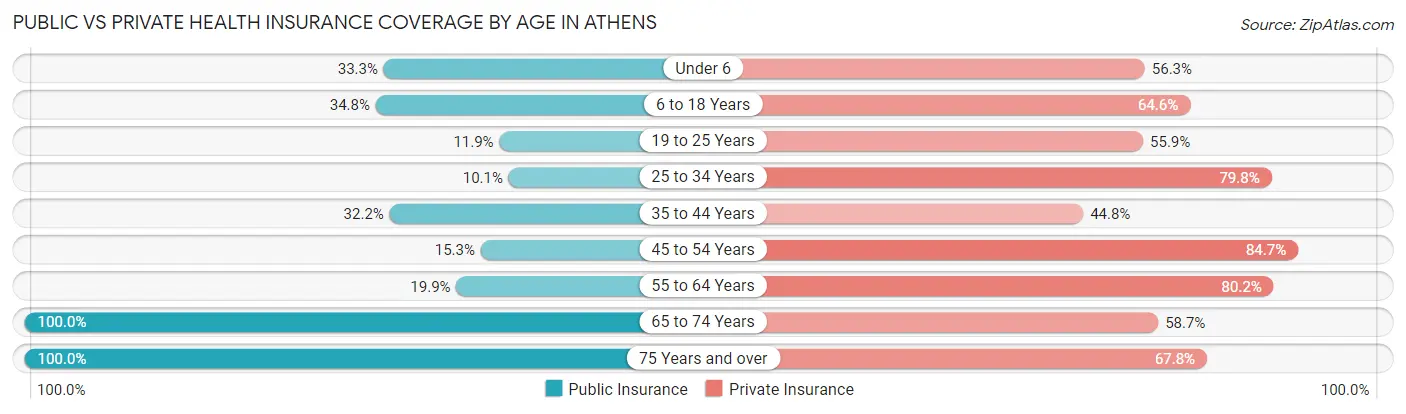
| Age Bracket | Public Insurance | Private Insurance |
| Under 6 | 16 (33.3%) | 27 (56.2%) |
| 6 to 18 Years | 63 (34.8%) | 117 (64.6%) |
| 19 to 25 Years | 7 (11.9%) | 33 (55.9%) |
| 25 to 34 Years | 8 (10.1%) | 63 (79.7%) |
| 35 to 44 Years | 59 (32.2%) | 82 (44.8%) |
| 45 to 54 Years | 23 (15.3%) | 127 (84.7%) |
| 55 to 64 Years | 26 (19.9%) | 105 (80.1%) |
| 65 to 74 Years | 63 (100.0%) | 37 (58.7%) |
| 75 Years and over | 121 (100.0%) | 82 (67.8%) |
| Total | 386 (38.0%) | 673 (66.3%) |
Disability Status by Sex by Age in Athens
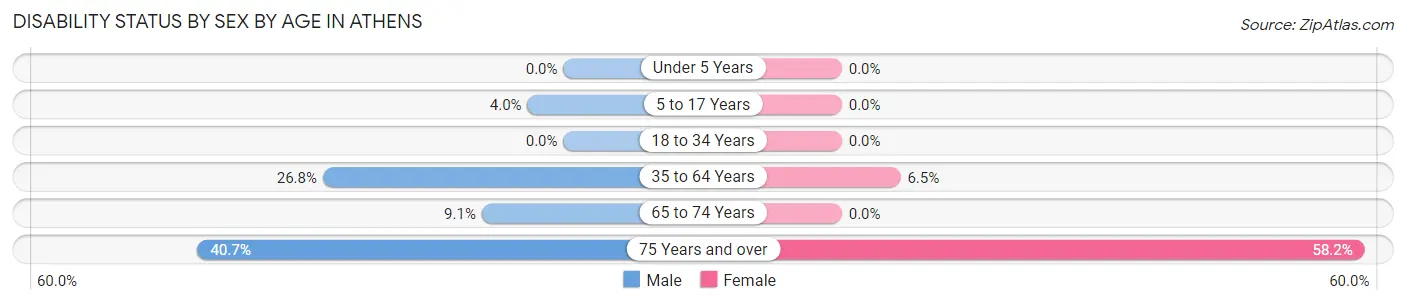
| Age Bracket | Male | Female |
| Under 5 Years | 0 (0.0%) | 0 (0.0%) |
| 5 to 17 Years | 3 (4.0%) | 0 (0.0%) |
| 18 to 34 Years | 0 (0.0%) | 0 (0.0%) |
| 35 to 64 Years | 71 (26.8%) | 13 (6.5%) |
| 65 to 74 Years | 3 (9.1%) | 0 (0.0%) |
| 75 Years and over | 22 (40.7%) | 39 (58.2%) |
Disability Class by Sex by Age in Athens
Disability Class: Hearing Difficulty
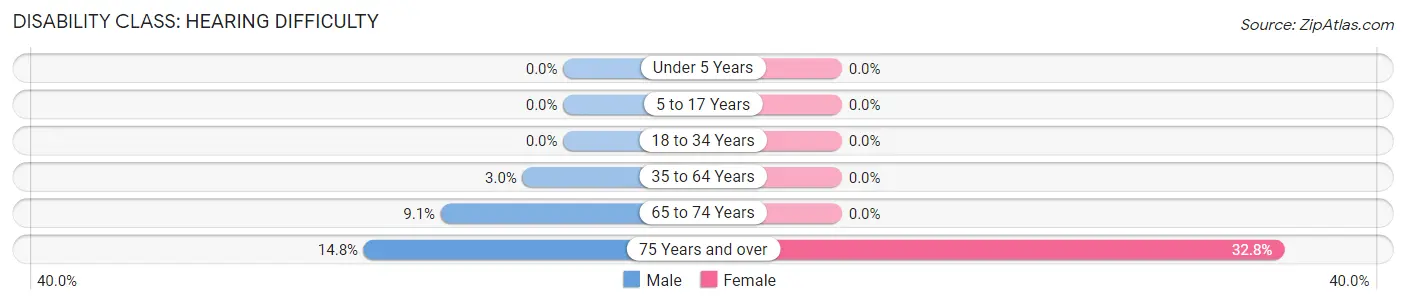
| Age Bracket | Male | Female |
| Under 5 Years | 0 (0.0%) | 0 (0.0%) |
| 5 to 17 Years | 0 (0.0%) | 0 (0.0%) |
| 18 to 34 Years | 0 (0.0%) | 0 (0.0%) |
| 35 to 64 Years | 8 (3.0%) | 0 (0.0%) |
| 65 to 74 Years | 3 (9.1%) | 0 (0.0%) |
| 75 Years and over | 8 (14.8%) | 22 (32.8%) |
Disability Class: Vision Difficulty
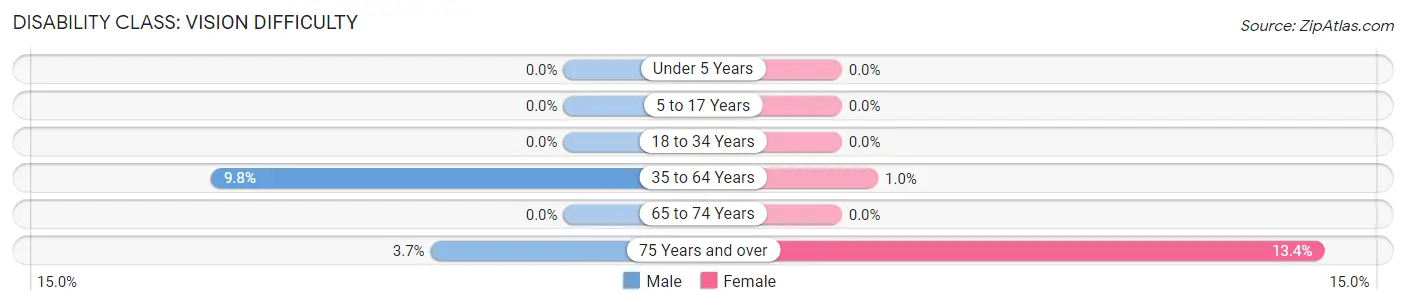
| Age Bracket | Male | Female |
| Under 5 Years | 0 (0.0%) | 0 (0.0%) |
| 5 to 17 Years | 0 (0.0%) | 0 (0.0%) |
| 18 to 34 Years | 0 (0.0%) | 0 (0.0%) |
| 35 to 64 Years | 26 (9.8%) | 2 (1.0%) |
| 65 to 74 Years | 0 (0.0%) | 0 (0.0%) |
| 75 Years and over | 2 (3.7%) | 9 (13.4%) |
Disability Class: Cognitive Difficulty
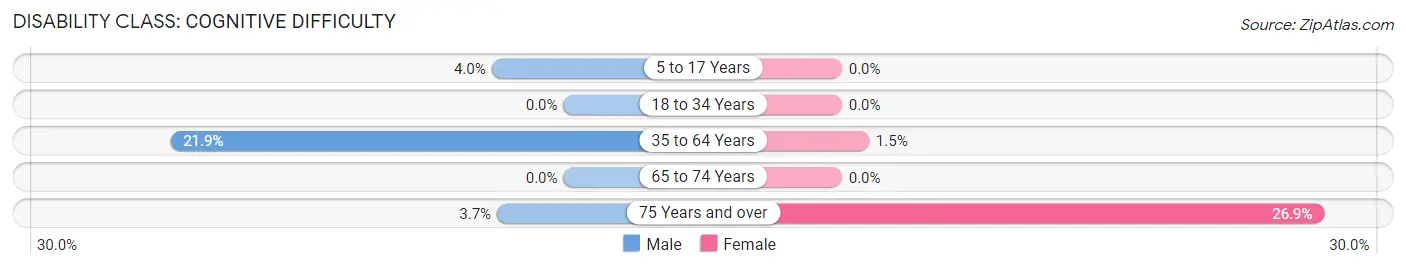
| Age Bracket | Male | Female |
| 5 to 17 Years | 3 (4.0%) | 0 (0.0%) |
| 18 to 34 Years | 0 (0.0%) | 0 (0.0%) |
| 35 to 64 Years | 58 (21.9%) | 3 (1.5%) |
| 65 to 74 Years | 0 (0.0%) | 0 (0.0%) |
| 75 Years and over | 2 (3.7%) | 18 (26.9%) |
Disability Class: Ambulatory Difficulty
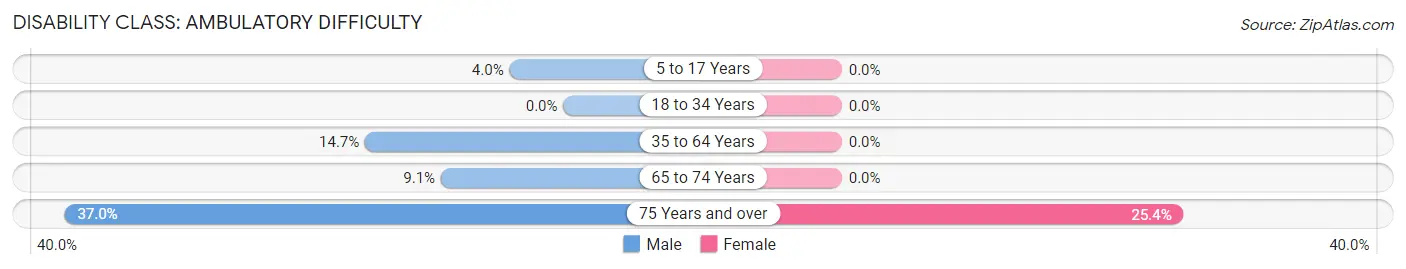
| Age Bracket | Male | Female |
| 5 to 17 Years | 3 (4.0%) | 0 (0.0%) |
| 18 to 34 Years | 0 (0.0%) | 0 (0.0%) |
| 35 to 64 Years | 39 (14.7%) | 0 (0.0%) |
| 65 to 74 Years | 3 (9.1%) | 0 (0.0%) |
| 75 Years and over | 20 (37.0%) | 17 (25.4%) |
Disability Class: Self-Care Difficulty
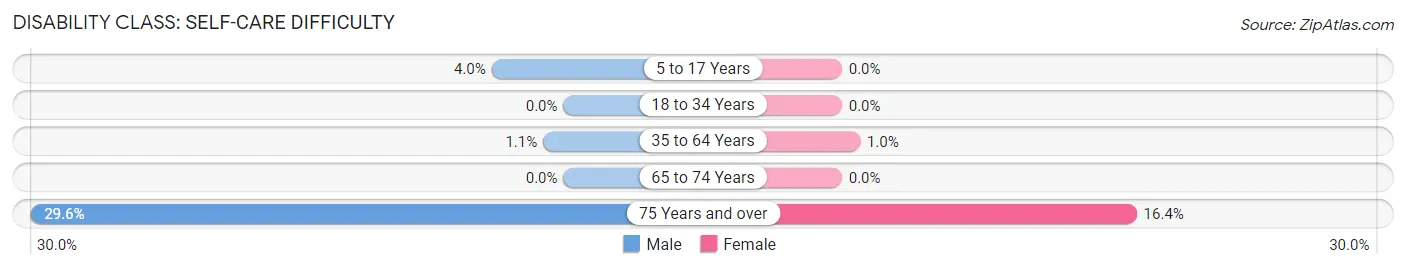
| Age Bracket | Male | Female |
| 5 to 17 Years | 3 (4.0%) | 0 (0.0%) |
| 18 to 34 Years | 0 (0.0%) | 0 (0.0%) |
| 35 to 64 Years | 3 (1.1%) | 2 (1.0%) |
| 65 to 74 Years | 0 (0.0%) | 0 (0.0%) |
| 75 Years and over | 16 (29.6%) | 11 (16.4%) |
Technology Access in Athens
Computing Device Access in Athens
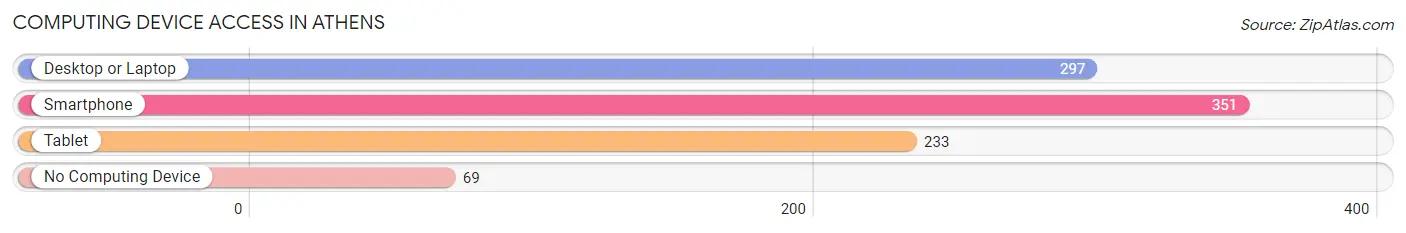
| Device Type | # Households | % Households |
| Desktop or Laptop | 297 | 65.8% |
| Smartphone | 351 | 77.8% |
| Tablet | 233 | 51.7% |
| No Computing Device | 69 | 15.3% |
| Total | 451 | 100.0% |
Internet Access in Athens
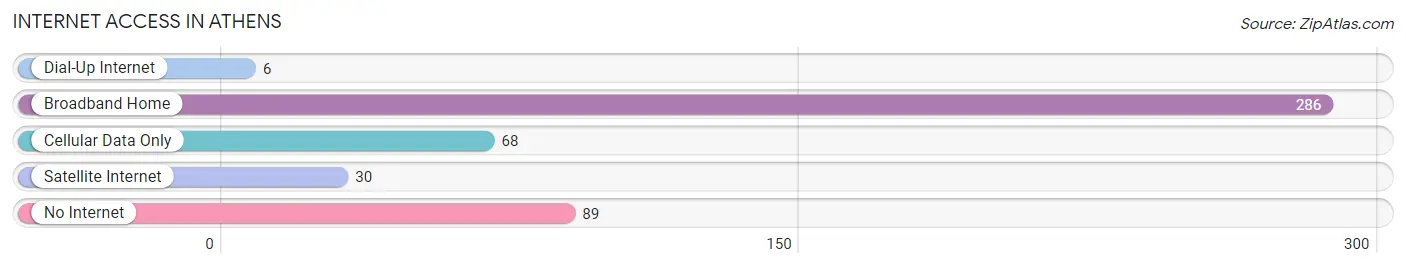
| Internet Type | # Households | % Households |
| Dial-Up Internet | 6 | 1.3% |
| Broadband Home | 286 | 63.4% |
| Cellular Data Only | 68 | 15.1% |
| Satellite Internet | 30 | 6.7% |
| No Internet | 89 | 19.7% |
| Total | 451 | 100.0% |
Athens Summary
Athens, Wisconsin is a small village located in Marathon County, Wisconsin. It is situated on the banks of the Eau Claire River, and is part of the Wausau, Wisconsin Metropolitan Statistical Area. The village has a population of 1,845 people, according to the 2010 census.
History
Athens was first settled in 1854 by a group of German immigrants. The village was originally named “New Berlin”, but was later changed to Athens in 1856. The name was chosen to honor the ancient Greek city of Athens. The village was officially incorporated in 1876.
Athens was an important stop on the Wisconsin Central Railroad, which ran through the village from 1871 to 1883. The railroad was a major factor in the growth of the village, as it allowed for the transportation of goods and people.
Athens was also home to a number of industries, including a sawmill, a flour mill, a cheese factory, and a brickyard. These industries provided employment for many of the village’s residents.
Geography
Athens is located in Marathon County, Wisconsin, at the intersection of State Highway 29 and County Highway N. The village is situated on the banks of the Eau Claire River, and is part of the Wausau, Wisconsin Metropolitan Statistical Area.
The village has a total area of 1.2 square miles, all of which is land. The terrain is mostly flat, with some rolling hills. The climate is humid continental, with cold winters and warm summers.
Economy
Athens is a small, rural village, and the economy is largely based on agriculture. The village is home to several farms, which produce a variety of crops, including corn, soybeans, and hay.
The village also has a number of small businesses, including a grocery store, a hardware store, and a few restaurants. The village is also home to a number of manufacturing companies, including a plastics manufacturer and a metal fabrication company.
Demographics
Athens has a population of 1,845 people, according to the 2010 census. The population is largely white (94.3%), with a small percentage of African Americans (2.2%) and Hispanics (2.2%). The median household income is $45,938, and the median age is 43.
The village is served by the Athens School District, which includes an elementary school, a middle school, and a high school. The village also has a public library, a post office, and a number of churches.
Conclusion
Athens, Wisconsin is a small village located in Marathon County, Wisconsin. It is situated on the banks of the Eau Claire River, and is part of the Wausau, Wisconsin Metropolitan Statistical Area. The village has a population of 1,845 people, according to the 2010 census. The economy is largely based on agriculture, and the village is home to several small businesses. The village is served by the Athens School District, and has a public library, a post office, and a number of churches.
Common Questions
What is Per Capita Income in Athens?
Per Capita income in Athens is $33,091.
What is the Median Family Income in Athens?
Median Family Income in Athens is $87,727.
What is the Median Household income in Athens?
Median Household Income in Athens is $58,828.
What is Income or Wage Gap in Athens?
Income or Wage Gap in Athens is 21.5%.
Women in Athens earn 78.5 cents for every dollar earned by a man.
What is Inequality or Gini Index in Athens?
Inequality or Gini Index in Athens is 0.41.
What is the Total Population of Athens?
Total Population of Athens is 1,015.
What is the Total Male Population of Athens?
Total Male Population of Athens is 530.
What is the Total Female Population of Athens?
Total Female Population of Athens is 485.
What is the Ratio of Males per 100 Females in Athens?
There are 109.28 Males per 100 Females in Athens.
What is the Ratio of Females per 100 Males in Athens?
There are 91.51 Females per 100 Males in Athens.
What is the Median Population Age in Athens?
Median Population Age in Athens is 42.7 Years.
What is the Average Family Size in Athens
Average Family Size in Athens is 2.9 People.
What is the Average Household Size in Athens
Average Household Size in Athens is 2.2 People.
How Large is the Labor Force in Athens?
There are 494 People in the Labor Forcein in Athens.
What is the Percentage of People in the Labor Force in Athens?
59.8% of People are in the Labor Force in Athens.
What is the Unemployment Rate in Athens?
Unemployment Rate in Athens is 0.8%.