Altoona, WI Map & Demographics
Altoona Map
Altoona Overview
$37,625
PER CAPITA INCOME
$91,396
AVG FAMILY INCOME
$77,002
AVG HOUSEHOLD INCOME
44.9%
WAGE / INCOME GAP [ % ]
55.1¢/ $1
WAGE / INCOME GAP [ $ ]
$11,382
FAMILY INCOME DEFICIT
0.41
INEQUALITY / GINI INDEX
8,506
TOTAL POPULATION
4,794
MALE POPULATION
3,712
FEMALE POPULATION
129.15
MALES / 100 FEMALES
77.43
FEMALES / 100 MALES
36.7
MEDIAN AGE
3.1
AVG FAMILY SIZE
2.4
AVG HOUSEHOLD SIZE
4,608
LABOR FORCE [ PEOPLE ]
68.1%
PERCENT IN LABOR FORCE
3.4%
UNEMPLOYMENT RATE
Altoona Zip Codes
Income in Altoona
Income Overview in Altoona
Per Capita Income in Altoona is $37,625, while median incomes of families and households are $91,396 and $77,002 respectively.
| Characteristic | Number | Measure |
| Per Capita Income | 8,506 | $37,625 |
| Median Family Income | 1,978 | $91,396 |
| Mean Family Income | 1,978 | $105,084 |
| Median Household Income | 3,543 | $77,002 |
| Mean Household Income | 3,543 | $87,438 |
| Income Deficit | 1,978 | $11,382 |
| Wage / Income Gap (%) | 8,506 | 44.90% |
| Wage / Income Gap ($) | 8,506 | 55.10¢ per $1 |
| Gini / Inequality Index | 8,506 | 0.41 |
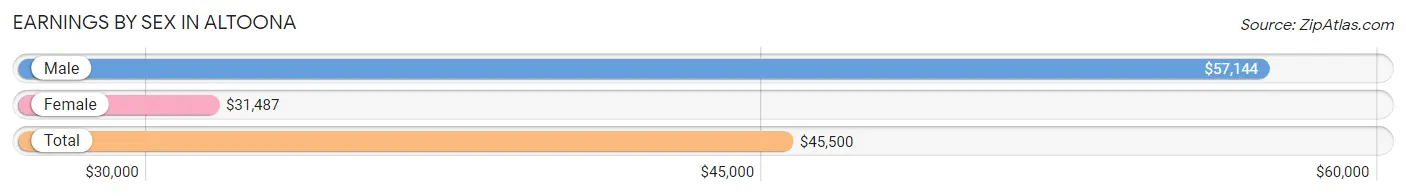
Earnings by Sex in Altoona
Average Earnings in Altoona are $45,500, $57,144 for men and $31,487 for women, a difference of 44.9%.
| Sex | Number | Average Earnings |
| Male | 2,599 (55.8%) | $57,144 |
| Female | 2,055 (44.2%) | $31,487 |
| Total | 4,654 (100.0%) | $45,500 |
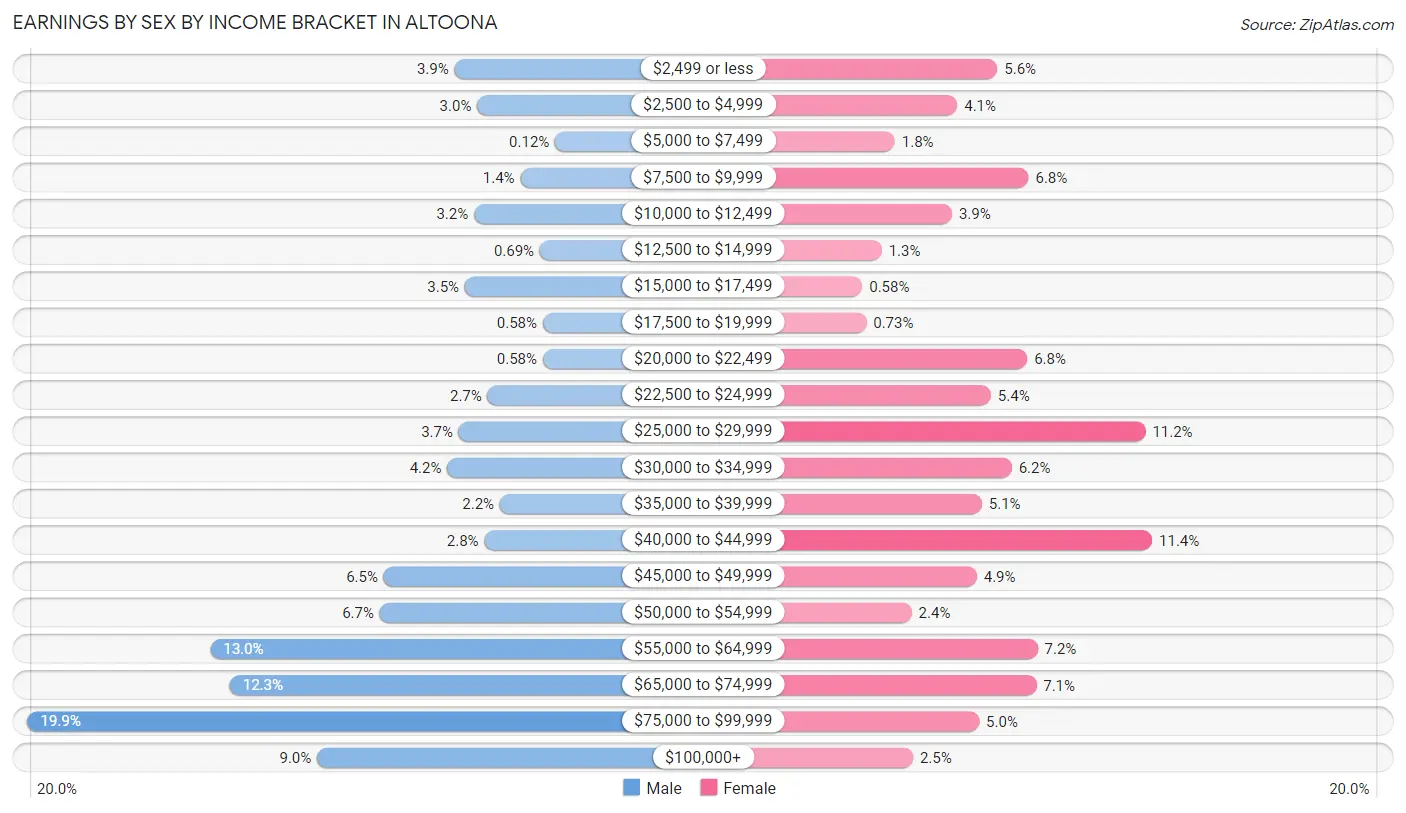
Earnings by Sex by Income Bracket in Altoona
The most common earnings brackets in Altoona are $75,000 to $99,999 for men (517 | 19.9%) and $40,000 to $44,999 for women (235 | 11.4%).
| Income | Male | Female |
| $2,499 or less | 101 (3.9%) | 116 (5.6%) |
| $2,500 to $4,999 | 79 (3.0%) | 85 (4.1%) |
| $5,000 to $7,499 | 3 (0.1%) | 37 (1.8%) |
| $7,500 to $9,999 | 37 (1.4%) | 140 (6.8%) |
| $10,000 to $12,499 | 82 (3.2%) | 81 (3.9%) |
| $12,500 to $14,999 | 18 (0.7%) | 27 (1.3%) |
| $15,000 to $17,499 | 91 (3.5%) | 12 (0.6%) |
| $17,500 to $19,999 | 15 (0.6%) | 15 (0.7%) |
| $20,000 to $22,499 | 15 (0.6%) | 139 (6.8%) |
| $22,500 to $24,999 | 69 (2.6%) | 111 (5.4%) |
| $25,000 to $29,999 | 97 (3.7%) | 230 (11.2%) |
| $30,000 to $34,999 | 108 (4.2%) | 127 (6.2%) |
| $35,000 to $39,999 | 57 (2.2%) | 104 (5.1%) |
| $40,000 to $44,999 | 72 (2.8%) | 235 (11.4%) |
| $45,000 to $49,999 | 170 (6.5%) | 100 (4.9%) |
| $50,000 to $54,999 | 174 (6.7%) | 50 (2.4%) |
| $55,000 to $64,999 | 339 (13.0%) | 147 (7.1%) |
| $65,000 to $74,999 | 320 (12.3%) | 146 (7.1%) |
| $75,000 to $99,999 | 517 (19.9%) | 102 (5.0%) |
| $100,000+ | 235 (9.0%) | 51 (2.5%) |
| Total | 2,599 (100.0%) | 2,055 (100.0%) |
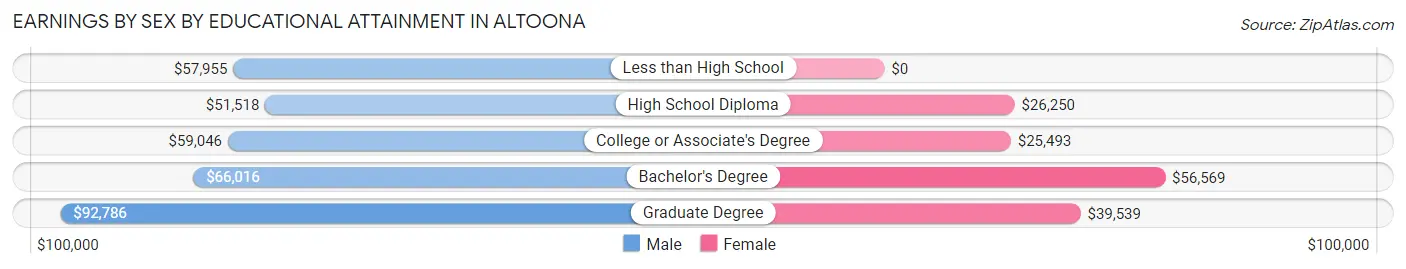
Earnings by Sex by Educational Attainment in Altoona
Average earnings in Altoona are $61,633 for men and $34,167 for women, a difference of 44.6%. Men with an educational attainment of graduate degree enjoy the highest average annual earnings of $92,786, while those with high school diploma education earn the least with $51,518. Women with an educational attainment of bachelor's degree earn the most with the average annual earnings of $56,569, while those with college or associate's degree education have the smallest earnings of $25,493.
| Educational Attainment | Male Income | Female Income |
| Less than High School | $57,955 | $0 |
| High School Diploma | $51,518 | $26,250 |
| College or Associate's Degree | $59,046 | $25,493 |
| Bachelor's Degree | $66,016 | $56,569 |
| Graduate Degree | $92,786 | $39,539 |
| Total | $61,633 | $34,167 |
Family Income in Altoona
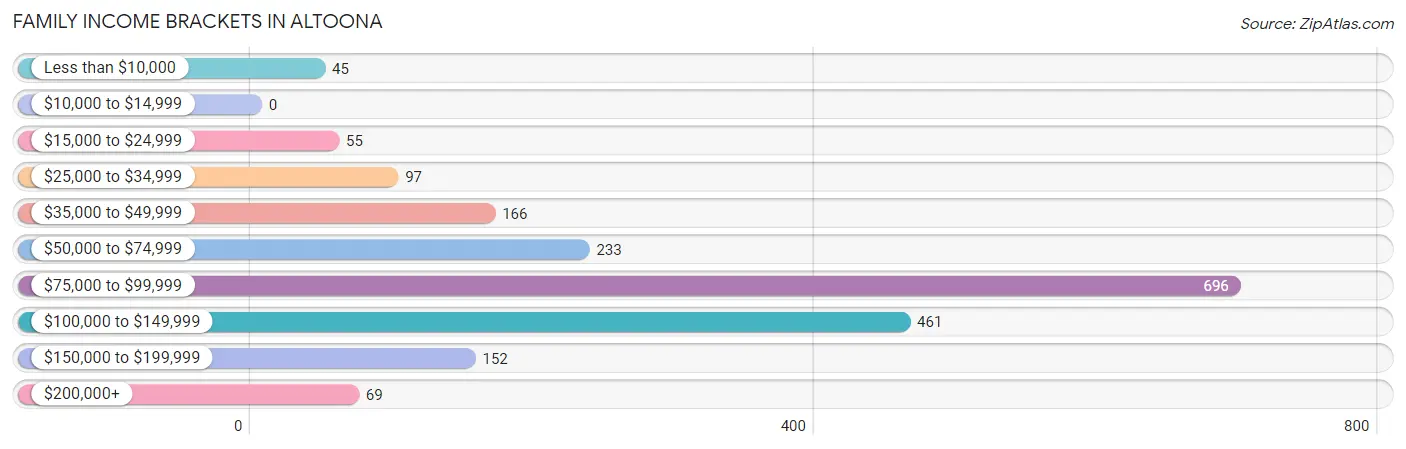
Family Income Brackets in Altoona
According to the Altoona family income data, there are 696 families falling into the $75,000 to $99,999 income range, which is the most common income bracket and makes up 35.2% of all families.
| Income Bracket | # Families | % Families |
| Less than $10,000 | 45 | 2.3% |
| $10,000 to $14,999 | 0 | 0.0% |
| $15,000 to $24,999 | 55 | 2.8% |
| $25,000 to $34,999 | 97 | 4.9% |
| $35,000 to $49,999 | 166 | 8.4% |
| $50,000 to $74,999 | 233 | 11.8% |
| $75,000 to $99,999 | 696 | 35.2% |
| $100,000 to $149,999 | 461 | 23.3% |
| $150,000 to $199,999 | 152 | 7.7% |
| $200,000+ | 69 | 3.5% |
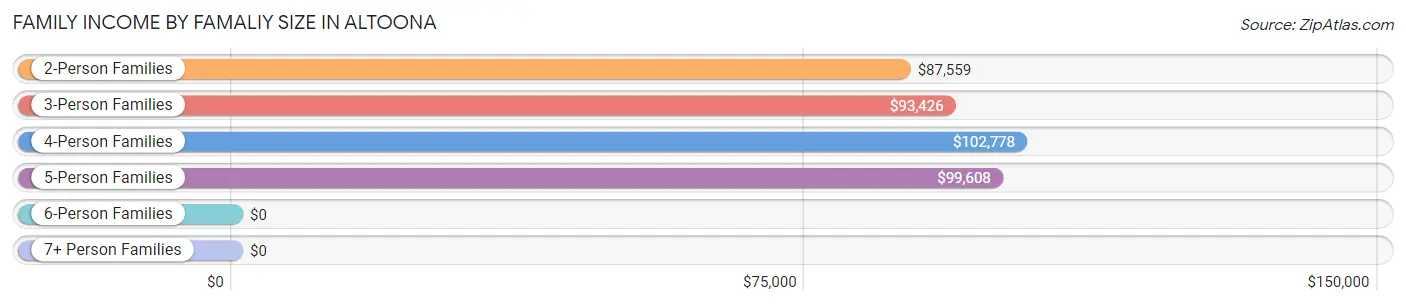
Family Income by Famaliy Size in Altoona
4-person families (234 | 11.8%) account for the highest median family income in Altoona with $102,778 per family, while 2-person families (933 | 47.2%) have the highest median income of $43,780 per family member.
| Income Bracket | # Families | Median Income |
| 2-Person Families | 933 (47.2%) | $87,559 |
| 3-Person Families | 431 (21.8%) | $93,426 |
| 4-Person Families | 234 (11.8%) | $102,778 |
| 5-Person Families | 348 (17.6%) | $99,608 |
| 6-Person Families | 13 (0.7%) | $0 |
| 7+ Person Families | 19 (1.0%) | $0 |
| Total | 1,978 (100.0%) | $91,396 |
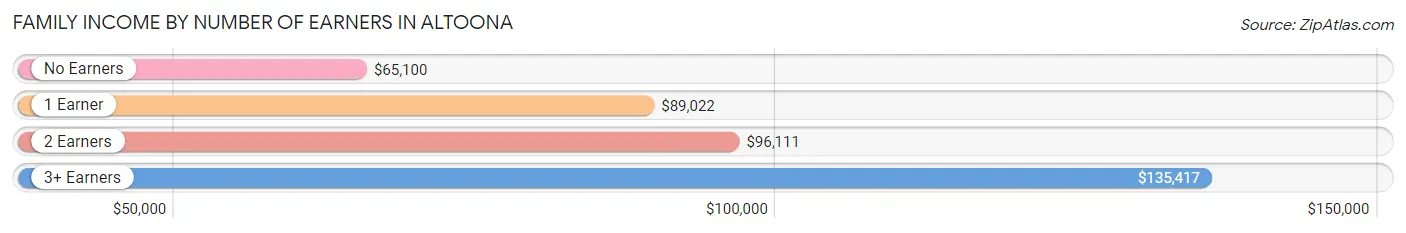
Family Income by Number of Earners in Altoona
The median family income in Altoona is $91,396, with families comprising 3+ earners (236) having the highest median family income of $135,417, while families with no earners (264) have the lowest median family income of $65,100, accounting for 11.9% and 13.4% of families, respectively.
| Number of Earners | # Families | Median Income |
| No Earners | 264 (13.4%) | $65,100 |
| 1 Earner | 666 (33.7%) | $89,022 |
| 2 Earners | 812 (41.0%) | $96,111 |
| 3+ Earners | 236 (11.9%) | $135,417 |
| Total | 1,978 (100.0%) | $91,396 |
Household Income in Altoona
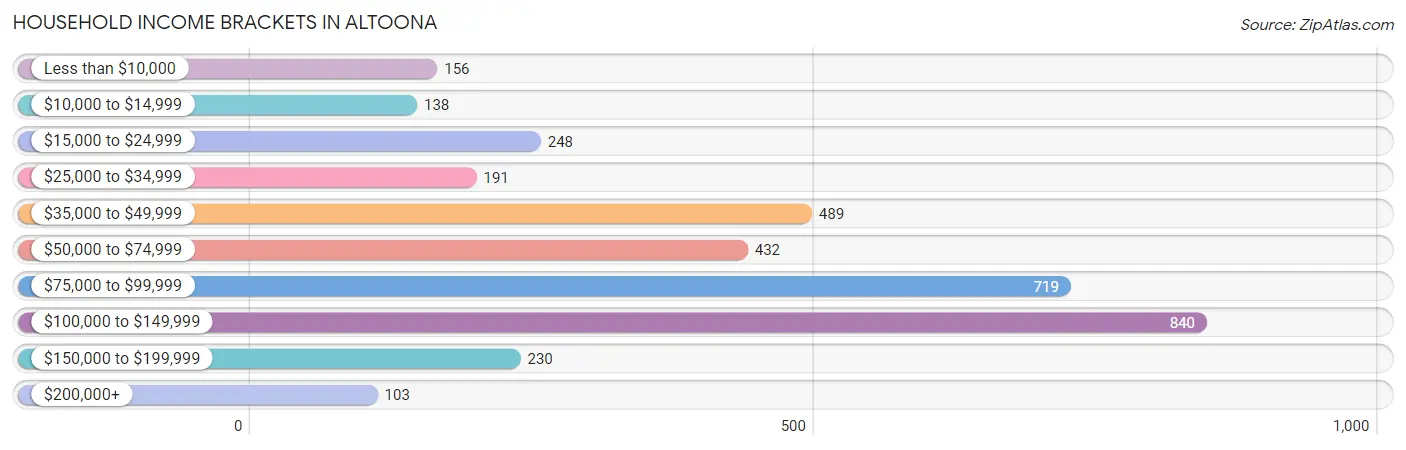
Household Income Brackets in Altoona
With 840 households falling in the category, the $100,000 to $149,999 income range is the most frequent in Altoona, accounting for 23.7% of all households. In contrast, only 103 households (2.9%) fall into the $200,000+ income bracket, making it the least populous group.
| Income Bracket | # Households | % Households |
| Less than $10,000 | 156 | 4.4% |
| $10,000 to $14,999 | 138 | 3.9% |
| $15,000 to $24,999 | 248 | 7.0% |
| $25,000 to $34,999 | 191 | 5.4% |
| $35,000 to $49,999 | 489 | 13.8% |
| $50,000 to $74,999 | 432 | 12.2% |
| $75,000 to $99,999 | 719 | 20.3% |
| $100,000 to $149,999 | 840 | 23.7% |
| $150,000 to $199,999 | 230 | 6.5% |
| $200,000+ | 103 | 2.9% |
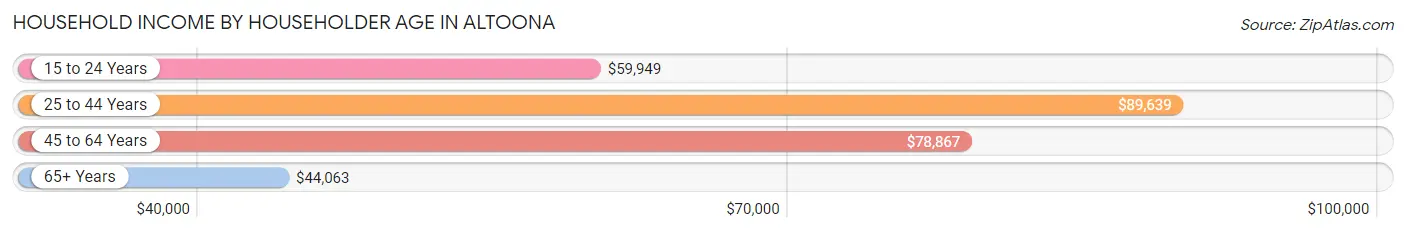
Household Income by Householder Age in Altoona
The median household income in Altoona is $77,002, with the highest median household income of $89,639 found in the 25 to 44 years age bracket for the primary householder. A total of 1,311 households (37.0%) fall into this category. Meanwhile, the 65+ years age bracket for the primary householder has the lowest median household income of $44,063, with 765 households (21.6%) in this group.
| Income Bracket | # Households | Median Income |
| 15 to 24 Years | 240 (6.8%) | $59,949 |
| 25 to 44 Years | 1,311 (37.0%) | $89,639 |
| 45 to 64 Years | 1,227 (34.6%) | $78,867 |
| 65+ Years | 765 (21.6%) | $44,063 |
| Total | 3,543 (100.0%) | $77,002 |
Poverty in Altoona
Income Below Poverty by Sex and Age in Altoona
With 9.6% poverty level for males and 11.4% for females among the residents of Altoona, 15 year old males and 18 to 24 year old females are the most vulnerable to poverty, with 21 males (46.7%) and 95 females (40.1%) in their respective age groups living below the poverty level.
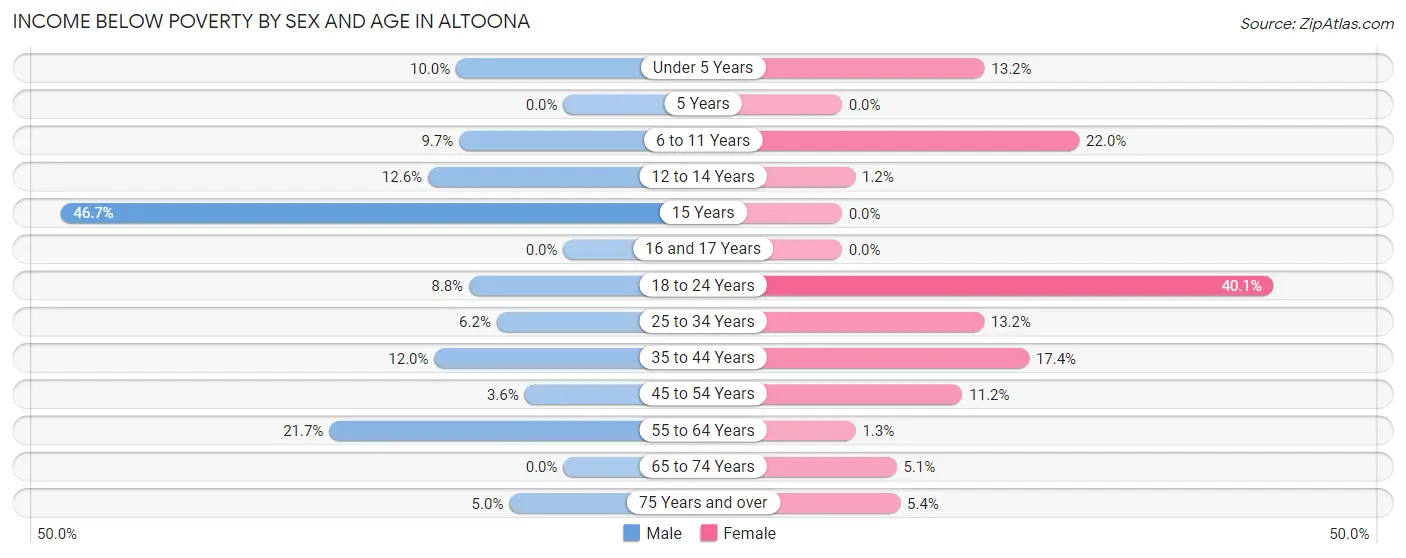
| Age Bracket | Male | Female |
| Under 5 Years | 27 (10.0%) | 25 (13.2%) |
| 5 Years | 0 (0.0%) | 0 (0.0%) |
| 6 to 11 Years | 51 (9.7%) | 52 (22.0%) |
| 12 to 14 Years | 24 (12.6%) | 2 (1.2%) |
| 15 Years | 21 (46.7%) | 0 (0.0%) |
| 16 and 17 Years | 0 (0.0%) | 0 (0.0%) |
| 18 to 24 Years | 43 (8.8%) | 95 (40.1%) |
| 25 to 34 Years | 49 (6.2%) | 80 (13.2%) |
| 35 to 44 Years | 68 (12.0%) | 91 (17.4%) |
| 45 to 54 Years | 13 (3.6%) | 30 (11.2%) |
| 55 to 64 Years | 141 (21.7%) | 9 (1.3%) |
| 65 to 74 Years | 0 (0.0%) | 17 (5.1%) |
| 75 Years and over | 12 (5.0%) | 19 (5.4%) |
| Total | 449 (9.6%) | 420 (11.4%) |
Income Above Poverty by Sex and Age in Altoona
According to the poverty statistics in Altoona, males aged 16 and 17 years and females aged 5 years are the age groups that are most secure financially, with 100.0% of males and 100.0% of females in these age groups living above the poverty line.
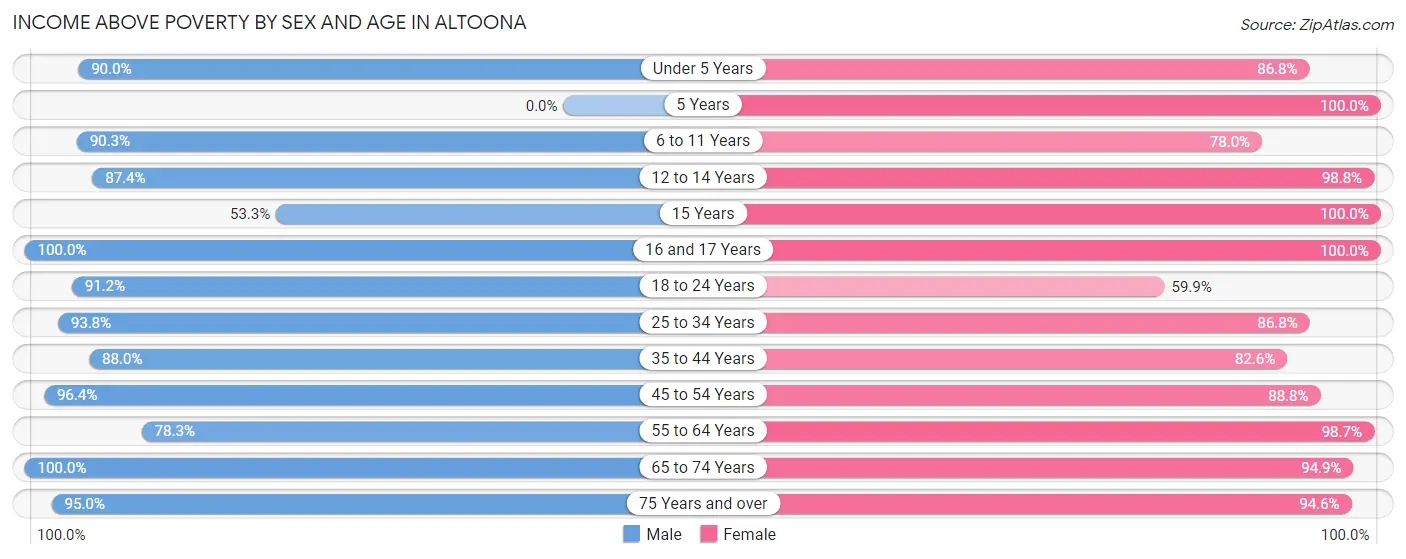
| Age Bracket | Male | Female |
| Under 5 Years | 244 (90.0%) | 164 (86.8%) |
| 5 Years | 0 (0.0%) | 24 (100.0%) |
| 6 to 11 Years | 476 (90.3%) | 184 (78.0%) |
| 12 to 14 Years | 167 (87.4%) | 160 (98.8%) |
| 15 Years | 24 (53.3%) | 7 (100.0%) |
| 16 and 17 Years | 228 (100.0%) | 29 (100.0%) |
| 18 to 24 Years | 448 (91.2%) | 142 (59.9%) |
| 25 to 34 Years | 744 (93.8%) | 527 (86.8%) |
| 35 to 44 Years | 500 (88.0%) | 433 (82.6%) |
| 45 to 54 Years | 348 (96.4%) | 238 (88.8%) |
| 55 to 64 Years | 508 (78.3%) | 702 (98.7%) |
| 65 to 74 Years | 327 (100.0%) | 318 (94.9%) |
| 75 Years and over | 227 (95.0%) | 332 (94.6%) |
| Total | 4,241 (90.4%) | 3,260 (88.6%) |
Income Below Poverty Among Married-Couple Families in Altoona
The poverty statistics for married-couple families in Altoona show that 4.4% or 65 of the total 1,491 families live below the poverty line. Families with 3 or 4 children have the highest poverty rate of 12.4%, comprising of 23 families. On the other hand, families with 5 or more children have the lowest poverty rate of 0.0%, which includes 0 families.
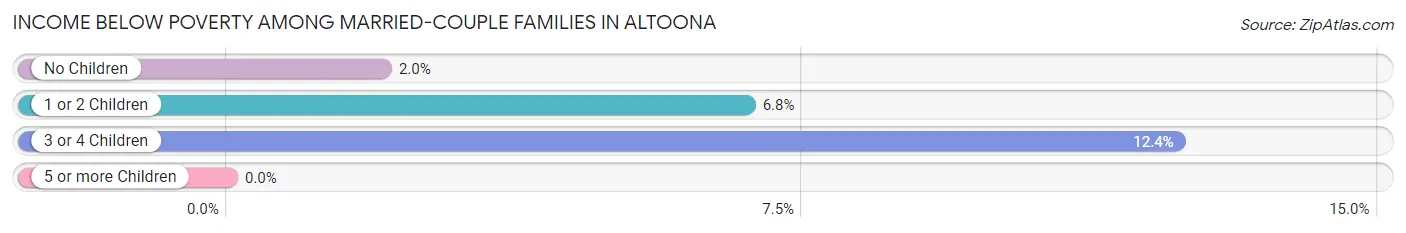
| Children | Above Poverty | Below Poverty |
| No Children | 927 (98.0%) | 19 (2.0%) |
| 1 or 2 Children | 317 (93.2%) | 23 (6.8%) |
| 3 or 4 Children | 163 (87.6%) | 23 (12.4%) |
| 5 or more Children | 19 (100.0%) | 0 (0.0%) |
| Total | 1,426 (95.6%) | 65 (4.4%) |
Income Below Poverty Among Single-Parent Households in Altoona
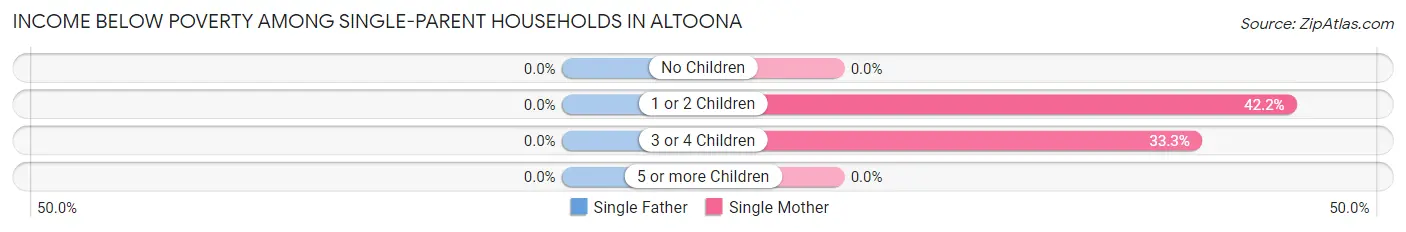
| Children | Single Father | Single Mother |
| No Children | 0 (0.0%) | 0 (0.0%) |
| 1 or 2 Children | 0 (0.0%) | 43 (42.2%) |
| 3 or 4 Children | 0 (0.0%) | 24 (33.3%) |
| 5 or more Children | 0 (0.0%) | 0 (0.0%) |
| Total | 0 (0.0%) | 67 (29.4%) |
Income Below Poverty Among Married-Couple vs Single-Parent Households in Altoona
The poverty data for Altoona shows that 65 of the married-couple family households (4.4%) and 67 of the single-parent households (13.8%) are living below the poverty level. Within the married-couple family households, those with 3 or 4 children have the highest poverty rate, with 23 households (12.4%) falling below the poverty line. Among the single-parent households, those with 3 or 4 children have the highest poverty rate, with 24 household (33.3%) living below poverty.
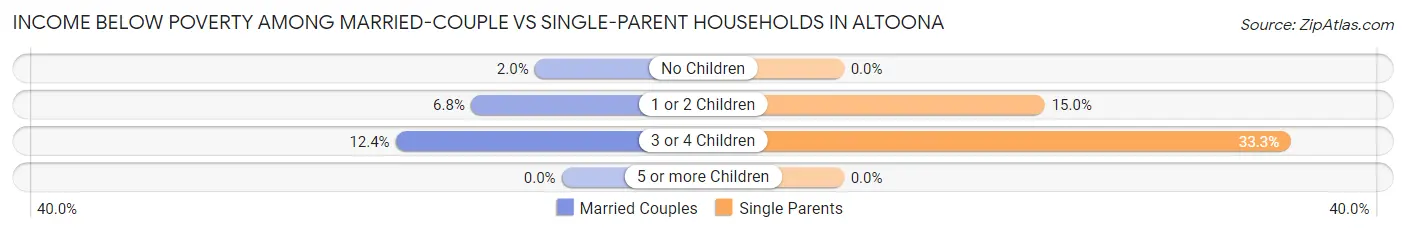
| Children | Married-Couple Families | Single-Parent Households |
| No Children | 19 (2.0%) | 0 (0.0%) |
| 1 or 2 Children | 23 (6.8%) | 43 (15.0%) |
| 3 or 4 Children | 23 (12.4%) | 24 (33.3%) |
| 5 or more Children | 0 (0.0%) | 0 (0.0%) |
| Total | 65 (4.4%) | 67 (13.8%) |
Race in Altoona
The most populous races in Altoona are White / Caucasian (7,438 | 87.4%), Two or more Races (631 | 7.4%), and Hispanic or Latino (261 | 3.1%).
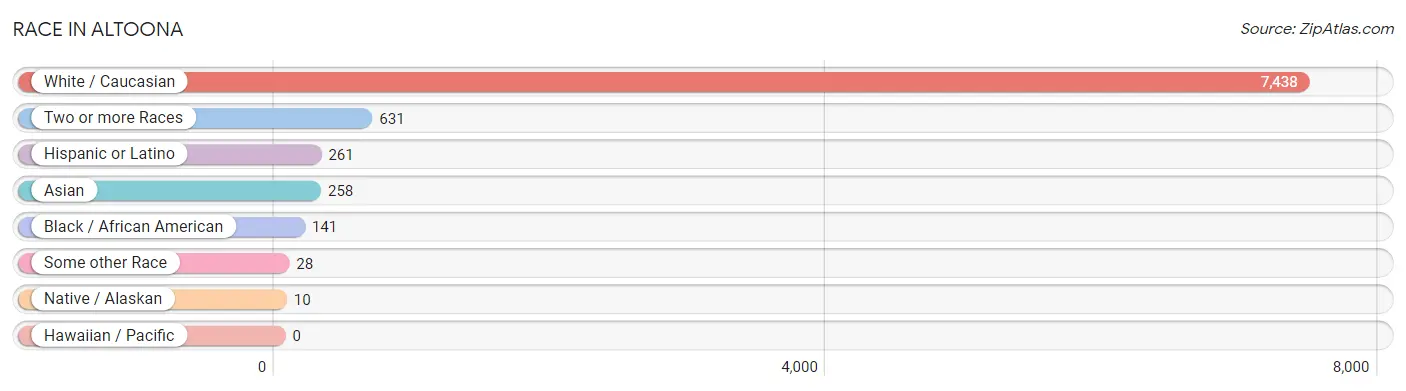
| Race | # Population | % Population |
| Asian | 258 | 3.0% |
| Black / African American | 141 | 1.7% |
| Hawaiian / Pacific | 0 | 0.0% |
| Hispanic or Latino | 261 | 3.1% |
| Native / Alaskan | 10 | 0.1% |
| White / Caucasian | 7,438 | 87.4% |
| Two or more Races | 631 | 7.4% |
| Some other Race | 28 | 0.3% |
| Total | 8,506 | 100.0% |
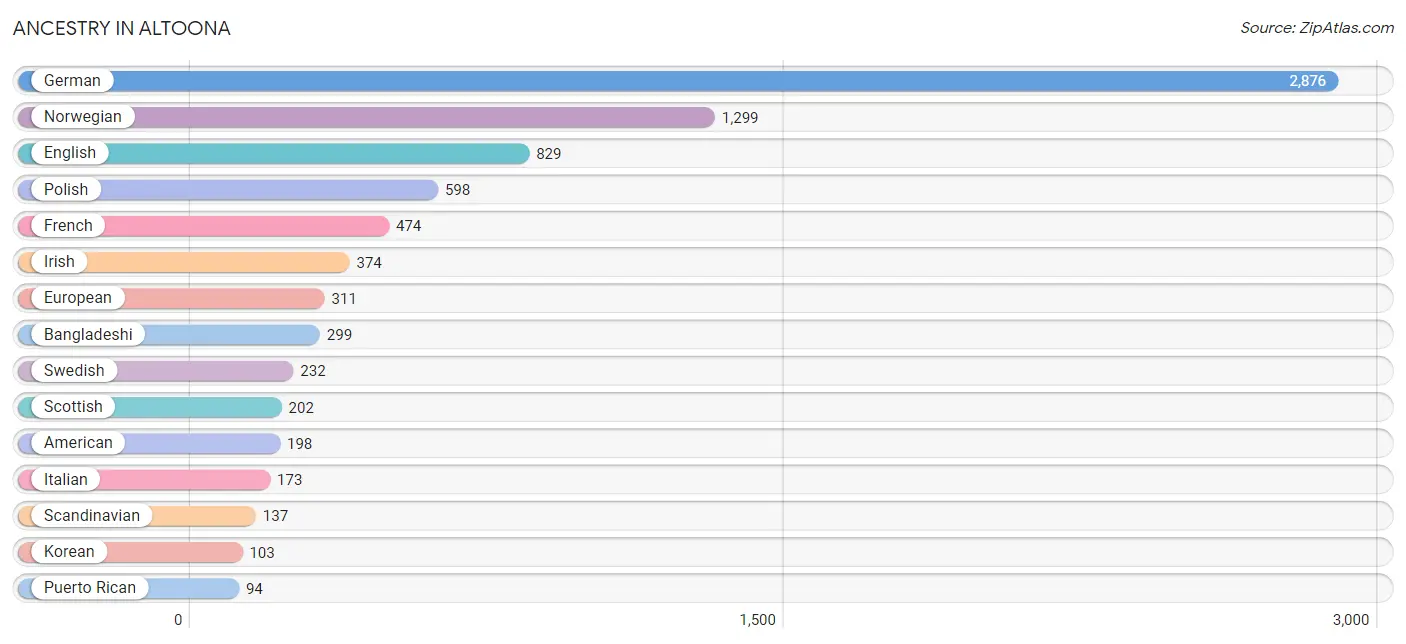
Ancestry in Altoona
The most populous ancestries reported in Altoona are German (2,876 | 33.8%), Norwegian (1,299 | 15.3%), English (829 | 9.8%), Polish (598 | 7.0%), and French (474 | 5.6%), together accounting for 71.4% of all Altoona residents.
| Ancestry | # Population | % Population |
| American | 198 | 2.3% |
| Austrian | 65 | 0.8% |
| Bangladeshi | 299 | 3.5% |
| Belgian | 12 | 0.1% |
| British | 16 | 0.2% |
| Canadian | 64 | 0.7% |
| Chippewa | 24 | 0.3% |
| Croatian | 9 | 0.1% |
| Cuban | 57 | 0.7% |
| Czech | 85 | 1.0% |
| Czechoslovakian | 13 | 0.2% |
| Danish | 70 | 0.8% |
| Dutch | 46 | 0.5% |
| English | 829 | 9.8% |
| European | 311 | 3.7% |
| Finnish | 34 | 0.4% |
| French | 474 | 5.6% |
| French Canadian | 26 | 0.3% |
| German | 2,876 | 33.8% |
| Greek | 29 | 0.3% |
| Hungarian | 13 | 0.2% |
| Indian (Asian) | 28 | 0.3% |
| Irish | 374 | 4.4% |
| Italian | 173 | 2.0% |
| Korean | 103 | 1.2% |
| Lithuanian | 12 | 0.1% |
| Maltese | 30 | 0.4% |
| Mexican | 87 | 1.0% |
| Nigerian | 13 | 0.2% |
| Northern European | 51 | 0.6% |
| Norwegian | 1,299 | 15.3% |
| Polish | 598 | 7.0% |
| Portuguese | 43 | 0.5% |
| Puerto Rican | 94 | 1.1% |
| Russian | 14 | 0.2% |
| Scandinavian | 137 | 1.6% |
| Scotch-Irish | 78 | 0.9% |
| Scottish | 202 | 2.4% |
| Slovak | 15 | 0.2% |
| Spanish | 23 | 0.3% |
| Subsaharan African | 13 | 0.2% |
| Swedish | 232 | 2.7% |
| Swiss | 26 | 0.3% |
| Welsh | 41 | 0.5% | View All 44 Rows |
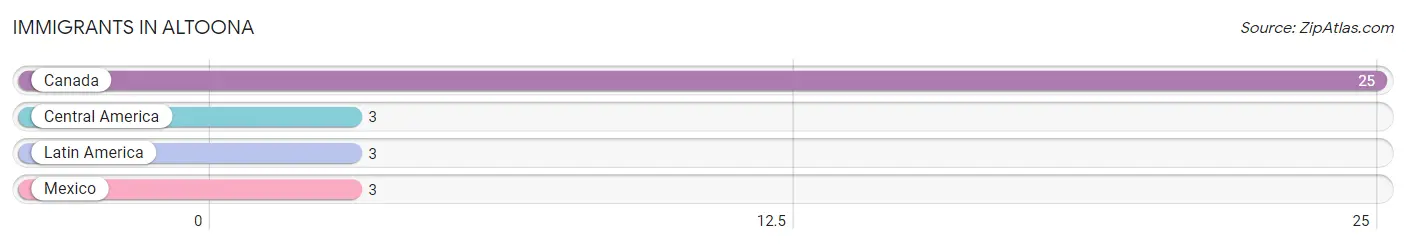
Immigrants in Altoona
The most numerous immigrant groups reported in Altoona came from Canada (25 | 0.3%), Central America (3 | 0.0%), Latin America (3 | 0.0%), and Mexico (3 | 0.0%), together accounting for 0.4% of all Altoona residents.
| Immigration Origin | # Population | % Population |
| Canada | 25 | 0.3% |
| Central America | 3 | 0.0% |
| Latin America | 3 | 0.0% |
| Mexico | 3 | 0.0% | View All 4 Rows |
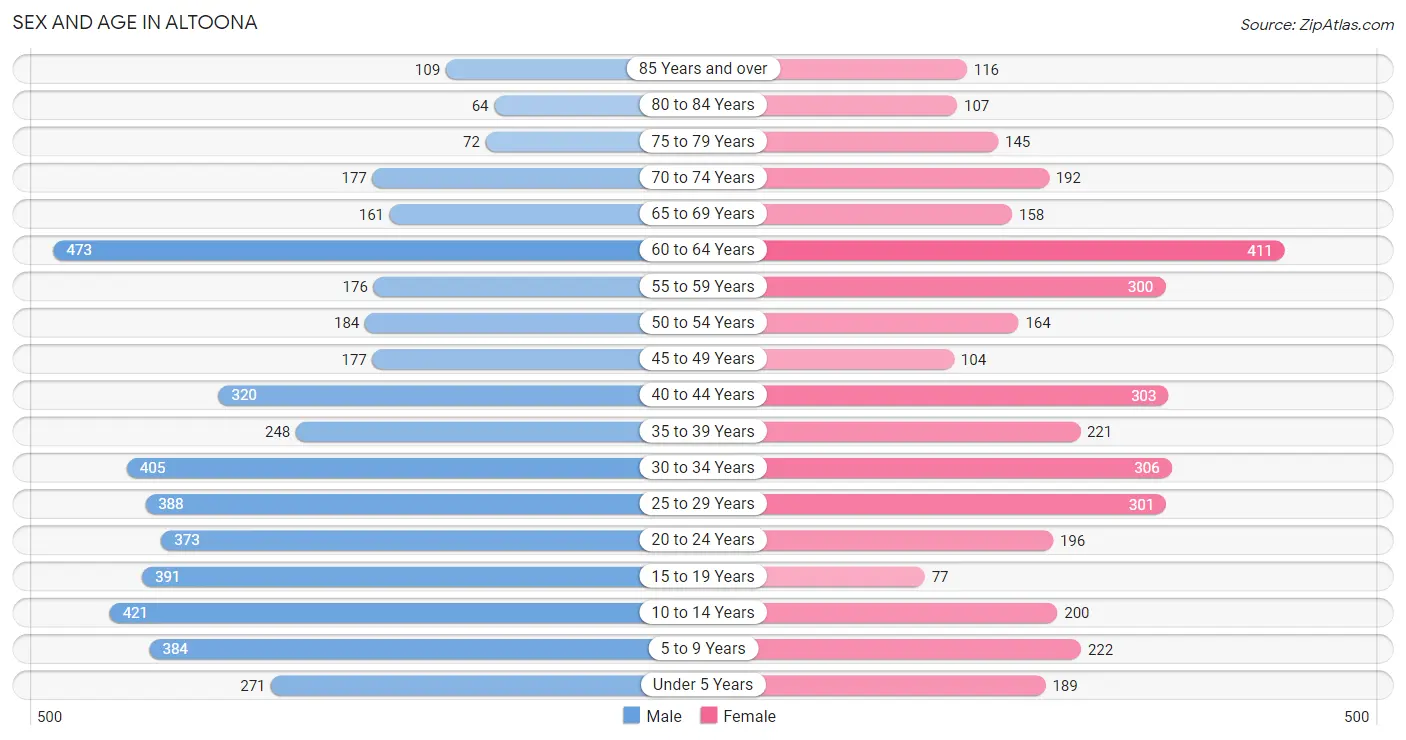
Sex and Age in Altoona
Sex and Age in Altoona
The most populous age groups in Altoona are 60 to 64 Years (473 | 9.9%) for men and 60 to 64 Years (411 | 11.1%) for women.
| Age Bracket | Male | Female |
| Under 5 Years | 271 (5.7%) | 189 (5.1%) |
| 5 to 9 Years | 384 (8.0%) | 222 (6.0%) |
| 10 to 14 Years | 421 (8.8%) | 200 (5.4%) |
| 15 to 19 Years | 391 (8.2%) | 77 (2.1%) |
| 20 to 24 Years | 373 (7.8%) | 196 (5.3%) |
| 25 to 29 Years | 388 (8.1%) | 301 (8.1%) |
| 30 to 34 Years | 405 (8.5%) | 306 (8.2%) |
| 35 to 39 Years | 248 (5.2%) | 221 (5.9%) |
| 40 to 44 Years | 320 (6.7%) | 303 (8.2%) |
| 45 to 49 Years | 177 (3.7%) | 104 (2.8%) |
| 50 to 54 Years | 184 (3.8%) | 164 (4.4%) |
| 55 to 59 Years | 176 (3.7%) | 300 (8.1%) |
| 60 to 64 Years | 473 (9.9%) | 411 (11.1%) |
| 65 to 69 Years | 161 (3.4%) | 158 (4.3%) |
| 70 to 74 Years | 177 (3.7%) | 192 (5.2%) |
| 75 to 79 Years | 72 (1.5%) | 145 (3.9%) |
| 80 to 84 Years | 64 (1.3%) | 107 (2.9%) |
| 85 Years and over | 109 (2.3%) | 116 (3.1%) |
| Total | 4,794 (100.0%) | 3,712 (100.0%) |
Families and Households in Altoona
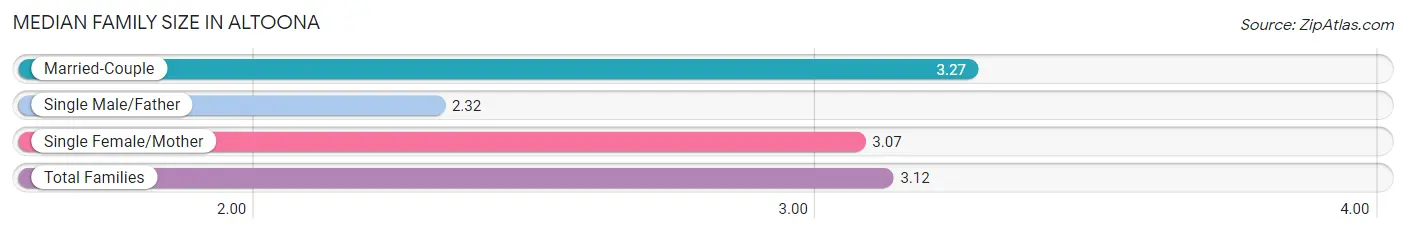
Median Family Size in Altoona
The median family size in Altoona is 3.12 persons per family, with married-couple families (1,491 | 75.4%) accounting for the largest median family size of 3.27 persons per family. On the other hand, single male/father families (259 | 13.1%) represent the smallest median family size with 2.32 persons per family.
| Family Type | # Families | Family Size |
| Married-Couple | 1,491 (75.4%) | 3.27 |
| Single Male/Father | 259 (13.1%) | 2.32 |
| Single Female/Mother | 228 (11.5%) | 3.07 |
| Total Families | 1,978 (100.0%) | 3.12 |
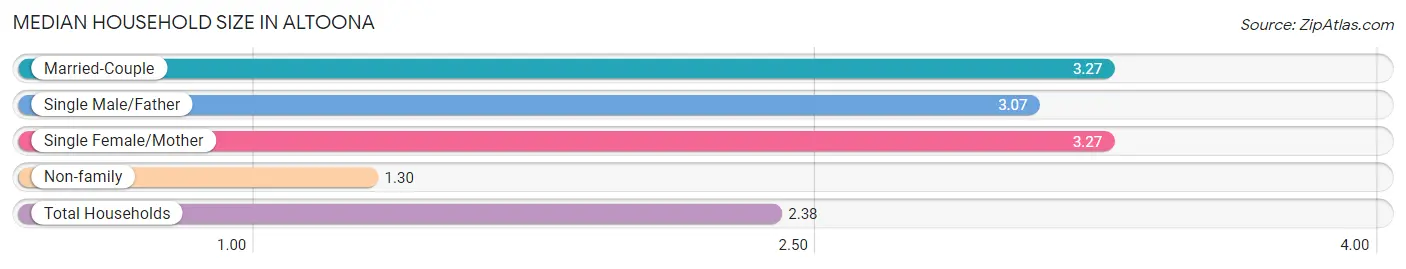
Median Household Size in Altoona
The median household size in Altoona is 2.38 persons per household, with married-couple households (1,491 | 42.1%) accounting for the largest median household size of 3.27 persons per household. non-family households (1,565 | 44.2%) represent the smallest median household size with 1.30 persons per household.
| Household Type | # Households | Household Size |
| Married-Couple | 1,491 (42.1%) | 3.27 |
| Single Male/Father | 259 (7.3%) | 3.07 |
| Single Female/Mother | 228 (6.4%) | 3.27 |
| Non-family | 1,565 (44.2%) | 1.30 |
| Total Households | 3,543 (100.0%) | 2.38 |
Household Size by Marriage Status in Altoona
Out of a total of 3,543 households in Altoona, 1,978 (55.8%) are family households, while 1,565 (44.2%) are nonfamily households. The most numerous type of family households are 2-person households, comprising 918, and the most common type of nonfamily households are 1-person households, comprising 1,153.
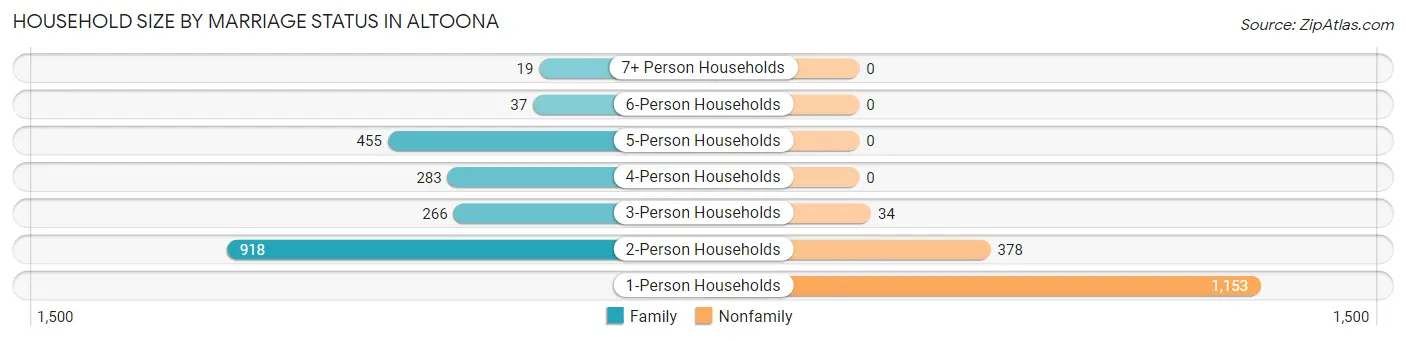
| Household Size | Family Households | Nonfamily Households |
| 1-Person Households | - | 1,153 (32.5%) |
| 2-Person Households | 918 (25.9%) | 378 (10.7%) |
| 3-Person Households | 266 (7.5%) | 34 (1.0%) |
| 4-Person Households | 283 (8.0%) | 0 (0.0%) |
| 5-Person Households | 455 (12.8%) | 0 (0.0%) |
| 6-Person Households | 37 (1.0%) | 0 (0.0%) |
| 7+ Person Households | 19 (0.5%) | 0 (0.0%) |
| Total | 1,978 (55.8%) | 1,565 (44.2%) |
Female Fertility in Altoona
Fertility by Age in Altoona
Average fertility rate in Altoona is 33.0 births per 1,000 women. Women in the age bracket of 20 to 34 years have the highest fertility rate with 65.0 births per 1,000 women. Women in the age bracket of 20 to 34 years acount for 100.0% of all women with births.
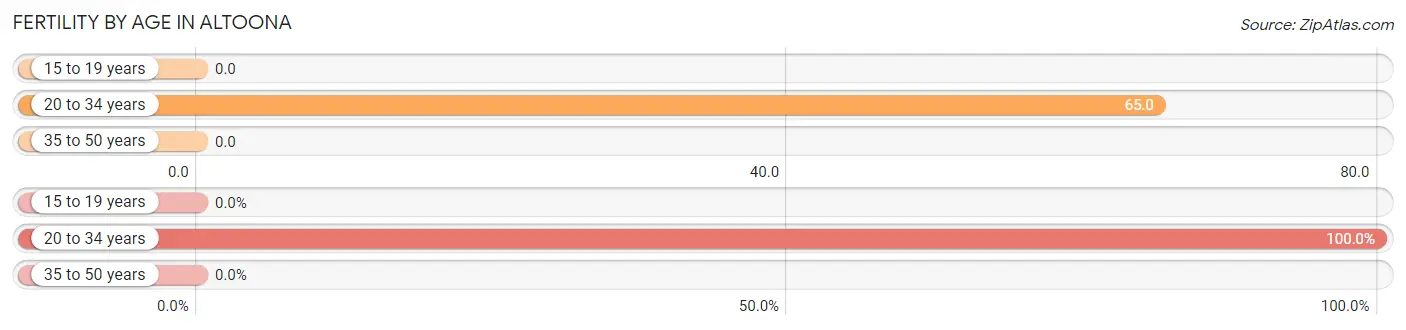
| Age Bracket | Women with Births | Births / 1,000 Women |
| 15 to 19 years | 0 (0.0%) | 0.0 |
| 20 to 34 years | 52 (100.0%) | 65.0 |
| 35 to 50 years | 0 (0.0%) | 0.0 |
| Total | 52 (100.0%) | 33.0 |
Fertility by Age by Marriage Status in Altoona
57.7% of women with births (52) in Altoona are married. The highest percentage of unmarried women with births falls into 20 to 34 years age bracket with 42.3% of them unmarried at the time of birth, while the lowest percentage of unmarried women with births belong to 20 to 34 years age bracket with 42.3% of them unmarried.
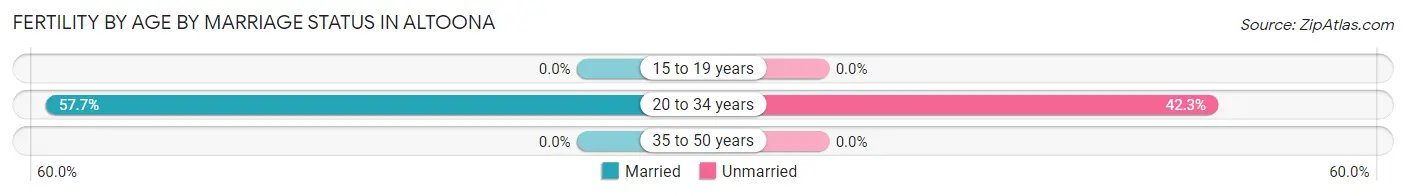
| Age Bracket | Married | Unmarried |
| 15 to 19 years | 0 (0.0%) | 0 (0.0%) |
| 20 to 34 years | 30 (57.7%) | 22 (42.3%) |
| 35 to 50 years | 0 (0.0%) | 0 (0.0%) |
| Total | 30 (57.7%) | 22 (42.3%) |
Fertility by Education in Altoona
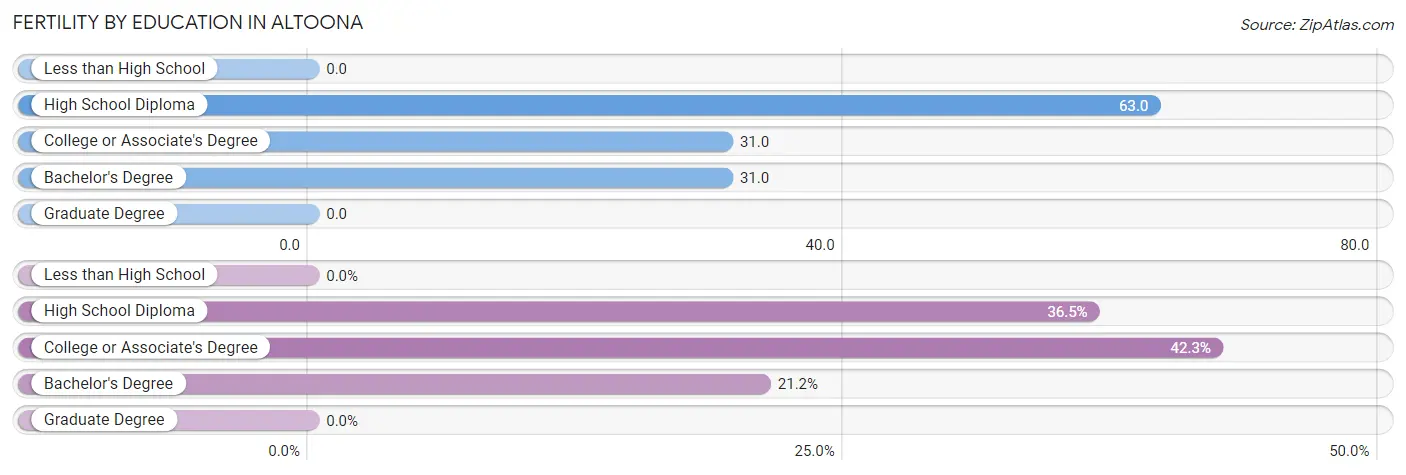
| Educational Attainment | Women with Births | Births / 1,000 Women |
| Less than High School | 0 (0.0%) | 0.0 |
| High School Diploma | 19 (36.5%) | 63.0 |
| College or Associate's Degree | 22 (42.3%) | 31.0 |
| Bachelor's Degree | 11 (21.1%) | 31.0 |
| Graduate Degree | 0 (0.0%) | 0.0 |
| Total | 52 (100.0%) | 33.0 |
Fertility by Education by Marriage Status in Altoona
42.3% of women with births in Altoona are unmarried. Women with the educational attainment of high school diploma are most likely to be married with 100.0% of them married at childbirth, while women with the educational attainment of college or associate's degree are least likely to be married with 100.0% of them unmarried at childbirth.
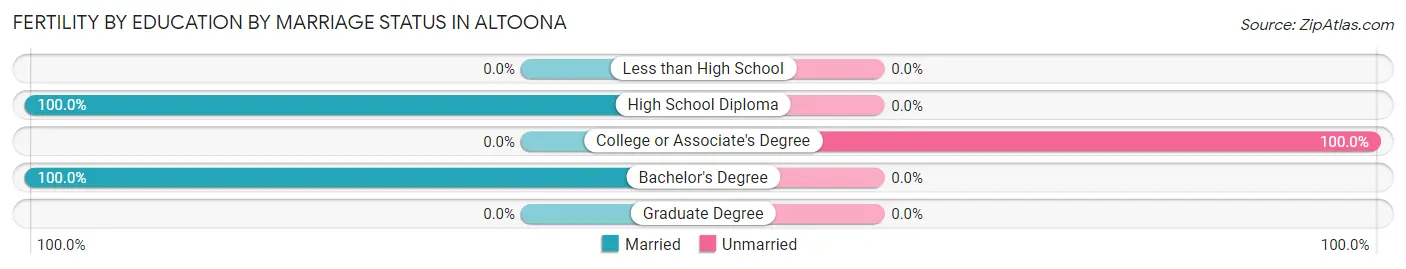
| Educational Attainment | Married | Unmarried |
| Less than High School | 0 (0.0%) | 0 (0.0%) |
| High School Diploma | 19 (100.0%) | 0 (0.0%) |
| College or Associate's Degree | 0 (0.0%) | 22 (100.0%) |
| Bachelor's Degree | 11 (100.0%) | 0 (0.0%) |
| Graduate Degree | 0 (0.0%) | 0 (0.0%) |
| Total | 30 (57.7%) | 22 (42.3%) |
Employment Characteristics in Altoona
Employment by Class of Employer in Altoona
Among the 4,366 employed individuals in Altoona, private company employees (3,289 | 75.3%), not-for-profit organizations (422 | 9.7%), and local government employees (225 | 5.1%) make up the most common classes of employment.
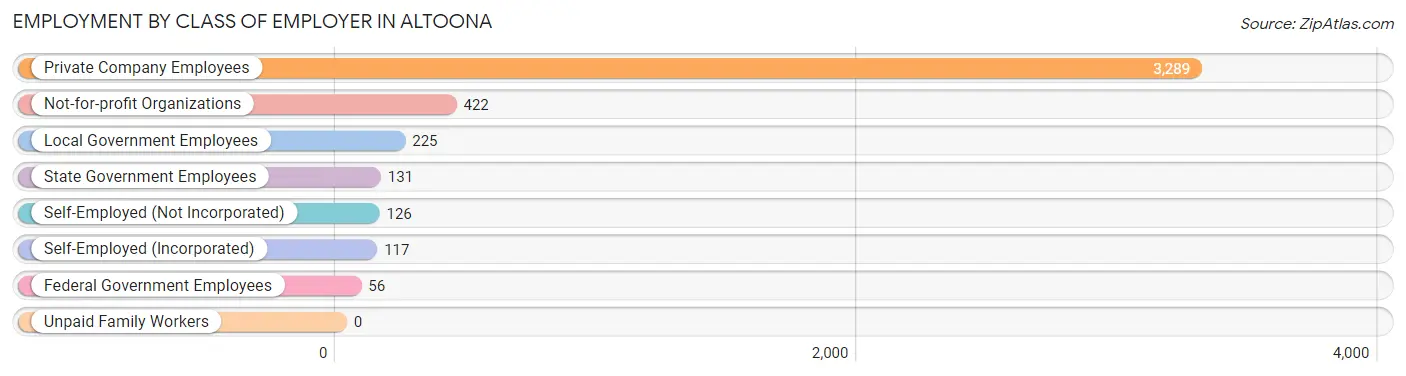
| Employer Class | # Employees | % Employees |
| Private Company Employees | 3,289 | 75.3% |
| Self-Employed (Incorporated) | 117 | 2.7% |
| Self-Employed (Not Incorporated) | 126 | 2.9% |
| Not-for-profit Organizations | 422 | 9.7% |
| Local Government Employees | 225 | 5.1% |
| State Government Employees | 131 | 3.0% |
| Federal Government Employees | 56 | 1.3% |
| Unpaid Family Workers | 0 | 0.0% |
| Total | 4,366 | 100.0% |
Employment Status by Age in Altoona
According to the labor force statistics for Altoona, out of the total population over 16 years of age (6,767), 68.1% or 4,608 individuals are in the labor force, with 3.4% or 157 of them unemployed. The age group with the highest labor force participation rate is 30 to 34 years, with 95.4% or 678 individuals in the labor force. Within the labor force, the 16 to 19 years age range has the highest percentage of unemployed individuals, with 15.1% or 25 of them being unemployed.
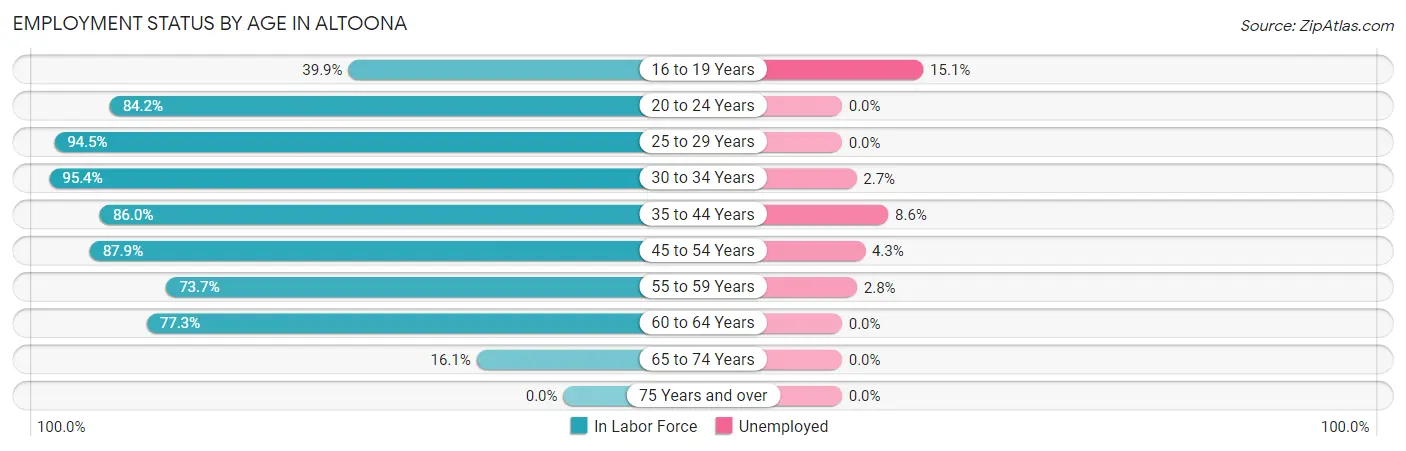
| Age Bracket | In Labor Force | Unemployed |
| 16 to 19 Years | 166 (39.9%) | 25 (15.1%) |
| 20 to 24 Years | 479 (84.2%) | 0 (0.0%) |
| 25 to 29 Years | 651 (94.5%) | 0 (0.0%) |
| 30 to 34 Years | 678 (95.4%) | 18 (2.7%) |
| 35 to 44 Years | 939 (86.0%) | 81 (8.6%) |
| 45 to 54 Years | 553 (87.9%) | 24 (4.3%) |
| 55 to 59 Years | 351 (73.7%) | 10 (2.8%) |
| 60 to 64 Years | 683 (77.3%) | 0 (0.0%) |
| 65 to 74 Years | 111 (16.1%) | 0 (0.0%) |
| 75 Years and over | 0 (0.0%) | 0 (0.0%) |
| Total | 4,608 (68.1%) | 157 (3.4%) |
Employment Status by Educational Attainment in Altoona
According to labor force statistics for Altoona, 86.0% of individuals (3,854) out of the total population between 25 and 64 years of age (4,481) are in the labor force, with 3.5% or 135 of them being unemployed. The group with the highest labor force participation rate are those with the educational attainment of bachelor's degree or higher, with 90.9% or 1,531 individuals in the labor force. Within the labor force, individuals with college / associate degree education have the highest percentage of unemployment, with 5.1% or 75 of them being unemployed.
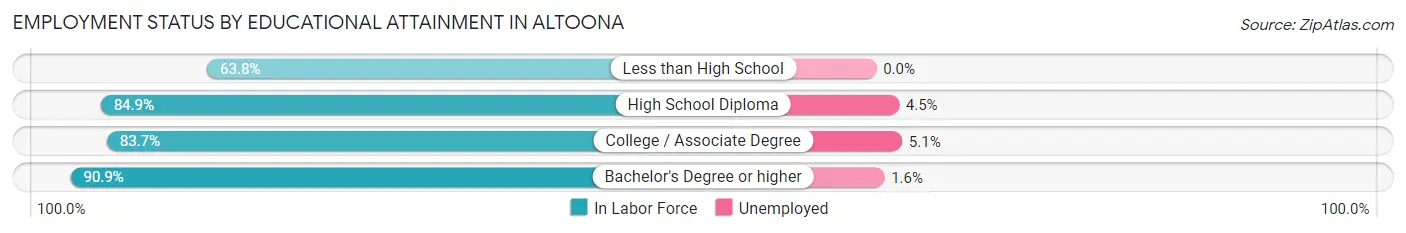
| Educational Attainment | In Labor Force | Unemployed |
| Less than High School | 88 (63.8%) | 0 (0.0%) |
| High School Diploma | 757 (84.9%) | 40 (4.5%) |
| College / Associate Degree | 1,479 (83.7%) | 90 (5.1%) |
| Bachelor's Degree or higher | 1,531 (90.9%) | 27 (1.6%) |
| Total | 3,854 (86.0%) | 157 (3.5%) |
Employment Occupations by Sex in Altoona
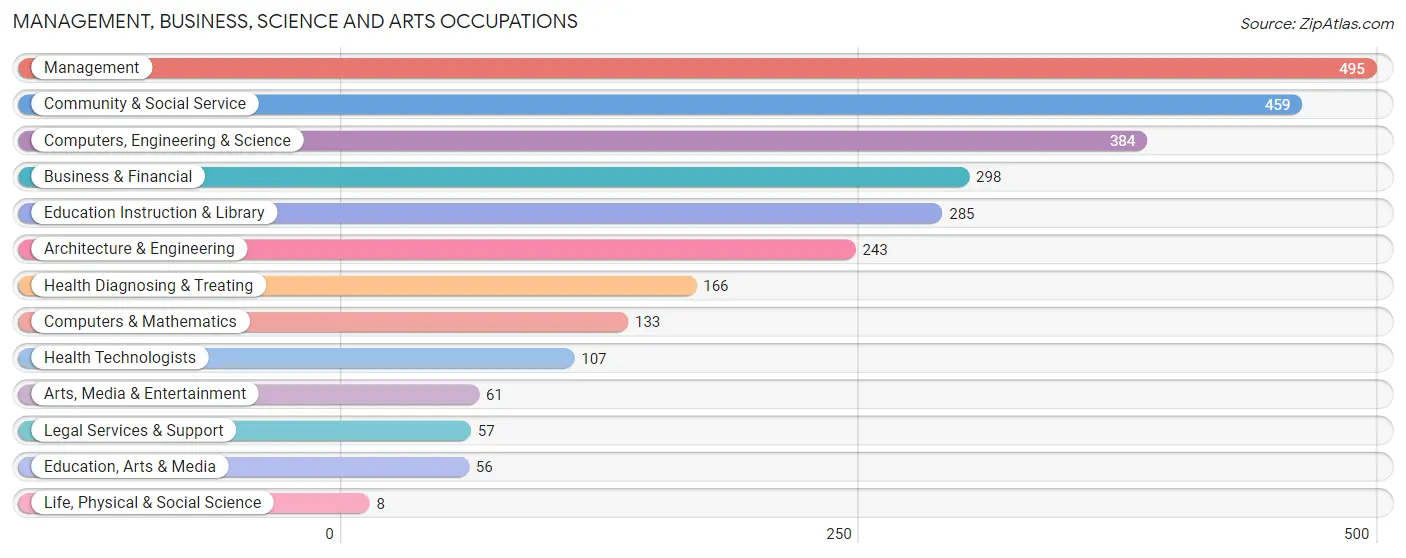
Management, Business, Science and Arts Occupations
The most common Management, Business, Science and Arts occupations in Altoona are Management (495 | 11.1%), Community & Social Service (459 | 10.3%), Computers, Engineering & Science (384 | 8.6%), Business & Financial (298 | 6.7%), and Education Instruction & Library (285 | 6.4%).
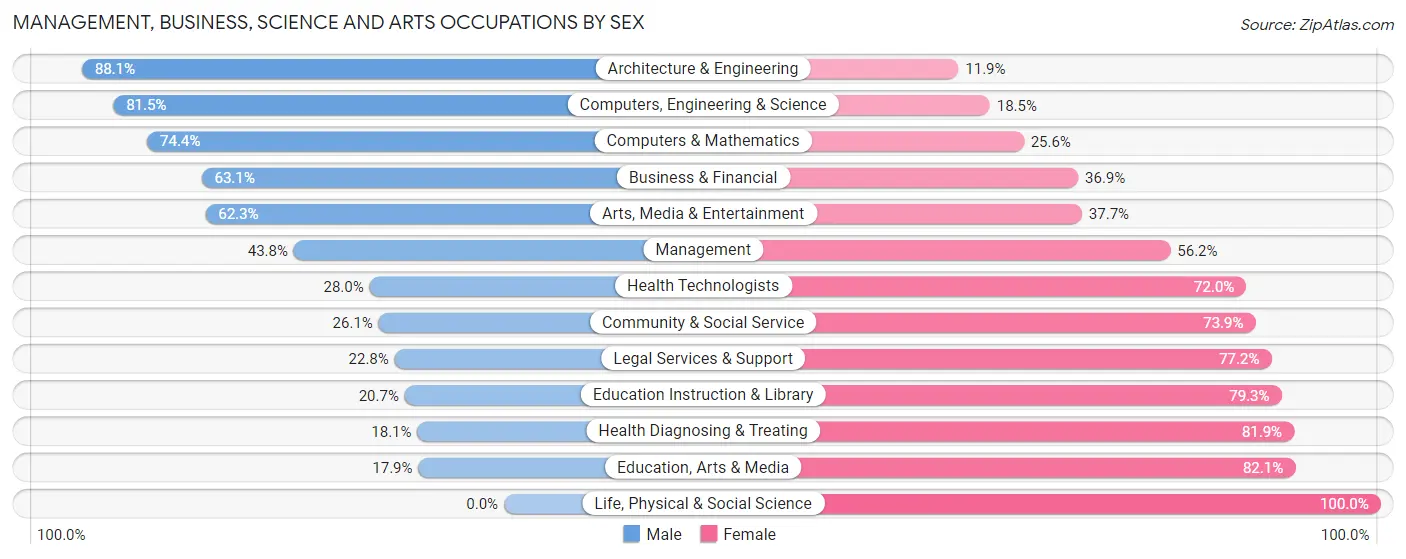
Management, Business, Science and Arts Occupations by Sex
Within the Management, Business, Science and Arts occupations in Altoona, the most male-oriented occupations are Architecture & Engineering (88.1%), Computers, Engineering & Science (81.5%), and Computers & Mathematics (74.4%), while the most female-oriented occupations are Life, Physical & Social Science (100.0%), Education, Arts & Media (82.1%), and Health Diagnosing & Treating (81.9%).
| Occupation | Male | Female |
| Management | 217 (43.8%) | 278 (56.2%) |
| Business & Financial | 188 (63.1%) | 110 (36.9%) |
| Computers, Engineering & Science | 313 (81.5%) | 71 (18.5%) |
| Computers & Mathematics | 99 (74.4%) | 34 (25.6%) |
| Architecture & Engineering | 214 (88.1%) | 29 (11.9%) |
| Life, Physical & Social Science | 0 (0.0%) | 8 (100.0%) |
| Community & Social Service | 120 (26.1%) | 339 (73.9%) |
| Education, Arts & Media | 10 (17.9%) | 46 (82.1%) |
| Legal Services & Support | 13 (22.8%) | 44 (77.2%) |
| Education Instruction & Library | 59 (20.7%) | 226 (79.3%) |
| Arts, Media & Entertainment | 38 (62.3%) | 23 (37.7%) |
| Health Diagnosing & Treating | 30 (18.1%) | 136 (81.9%) |
| Health Technologists | 30 (28.0%) | 77 (72.0%) |
| Total (Category) | 868 (48.2%) | 934 (51.8%) |
| Total (Overall) | 2,447 (54.9%) | 2,006 (45.1%) |
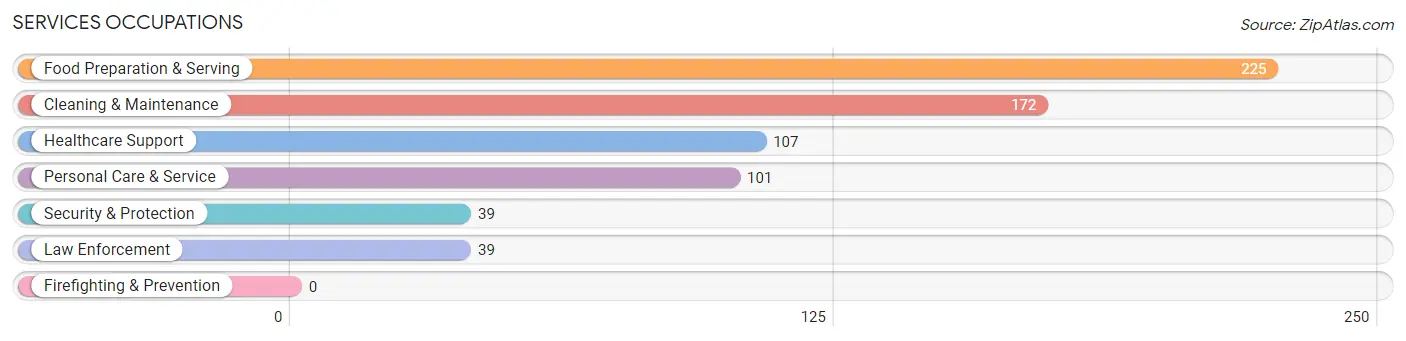
Services Occupations
The most common Services occupations in Altoona are Food Preparation & Serving (225 | 5.1%), Cleaning & Maintenance (172 | 3.9%), Healthcare Support (107 | 2.4%), Personal Care & Service (101 | 2.3%), and Security & Protection (39 | 0.9%).
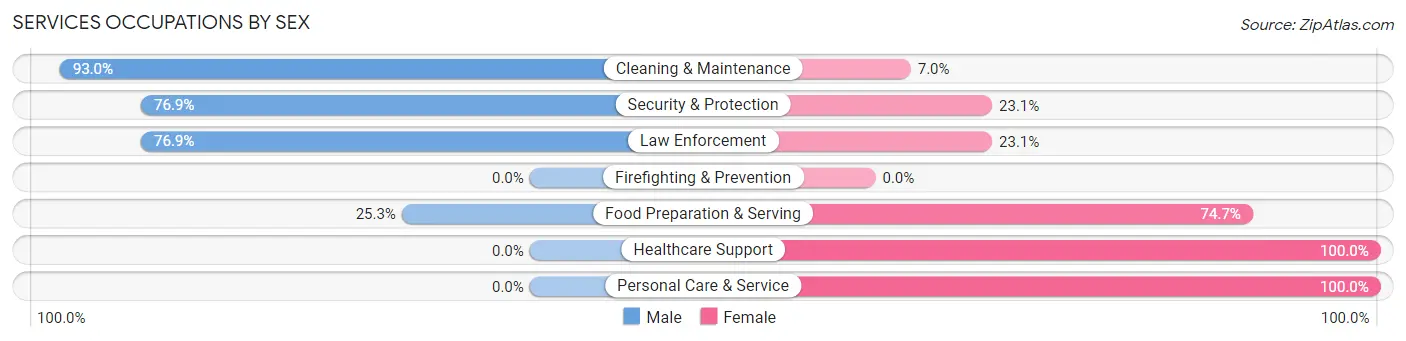
Services Occupations by Sex
Within the Services occupations in Altoona, the most male-oriented occupations are Cleaning & Maintenance (93.0%), Security & Protection (76.9%), and Law Enforcement (76.9%), while the most female-oriented occupations are Healthcare Support (100.0%), Personal Care & Service (100.0%), and Food Preparation & Serving (74.7%).
| Occupation | Male | Female |
| Healthcare Support | 0 (0.0%) | 107 (100.0%) |
| Security & Protection | 30 (76.9%) | 9 (23.1%) |
| Firefighting & Prevention | 0 (0.0%) | 0 (0.0%) |
| Law Enforcement | 30 (76.9%) | 9 (23.1%) |
| Food Preparation & Serving | 57 (25.3%) | 168 (74.7%) |
| Cleaning & Maintenance | 160 (93.0%) | 12 (7.0%) |
| Personal Care & Service | 0 (0.0%) | 101 (100.0%) |
| Total (Category) | 247 (38.4%) | 397 (61.7%) |
| Total (Overall) | 2,447 (54.9%) | 2,006 (45.1%) |
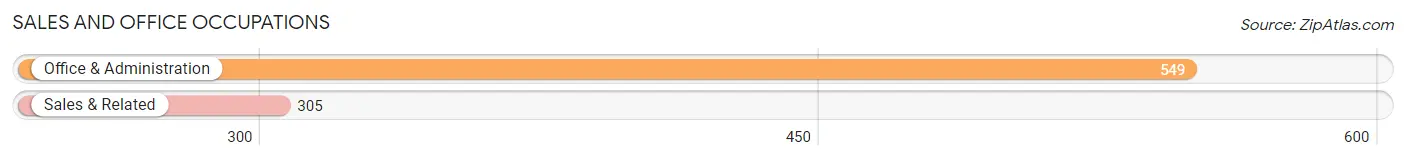
Sales and Office Occupations
The most common Sales and Office occupations in Altoona are Office & Administration (549 | 12.3%), and Sales & Related (305 | 6.9%).
Sales and Office Occupations by Sex
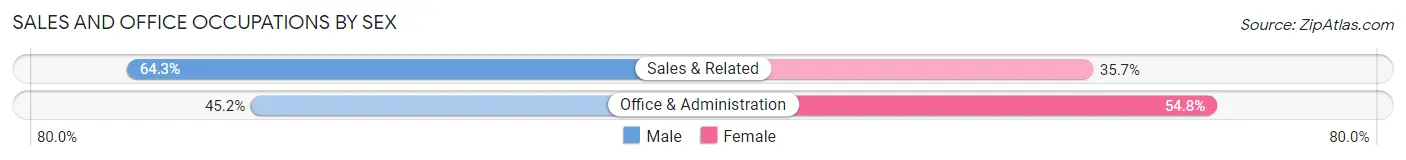
| Occupation | Male | Female |
| Sales & Related | 196 (64.3%) | 109 (35.7%) |
| Office & Administration | 248 (45.2%) | 301 (54.8%) |
| Total (Category) | 444 (52.0%) | 410 (48.0%) |
| Total (Overall) | 2,447 (54.9%) | 2,006 (45.1%) |
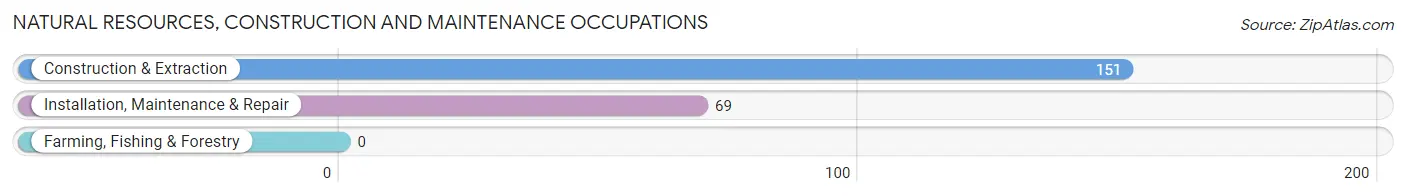
Natural Resources, Construction and Maintenance Occupations
The most common Natural Resources, Construction and Maintenance occupations in Altoona are Construction & Extraction (151 | 3.4%), and Installation, Maintenance & Repair (69 | 1.5%).
Natural Resources, Construction and Maintenance Occupations by Sex
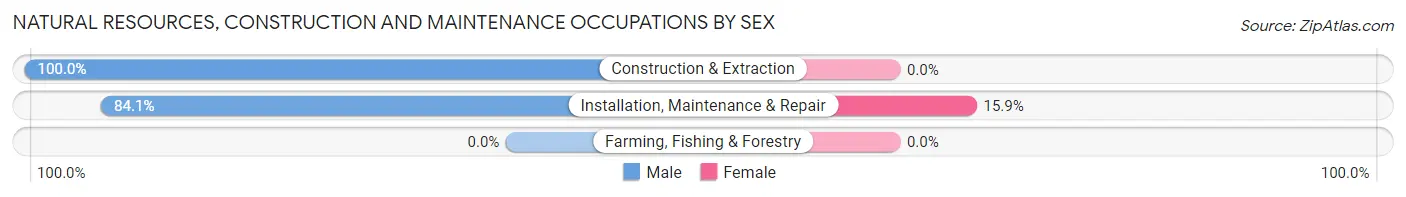
| Occupation | Male | Female |
| Farming, Fishing & Forestry | 0 (0.0%) | 0 (0.0%) |
| Construction & Extraction | 151 (100.0%) | 0 (0.0%) |
| Installation, Maintenance & Repair | 58 (84.1%) | 11 (15.9%) |
| Total (Category) | 209 (95.0%) | 11 (5.0%) |
| Total (Overall) | 2,447 (54.9%) | 2,006 (45.1%) |
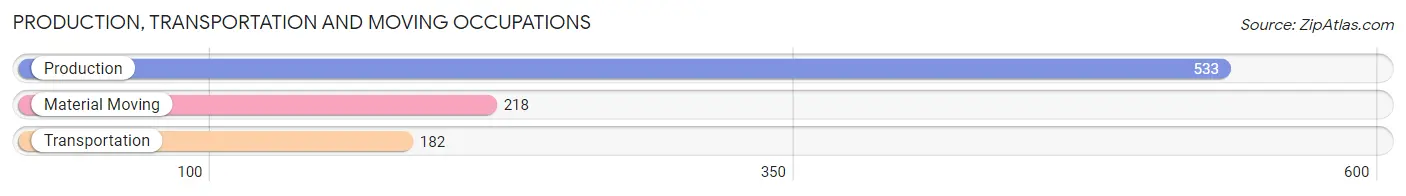
Production, Transportation and Moving Occupations
The most common Production, Transportation and Moving occupations in Altoona are Production (533 | 12.0%), Material Moving (218 | 4.9%), and Transportation (182 | 4.1%).
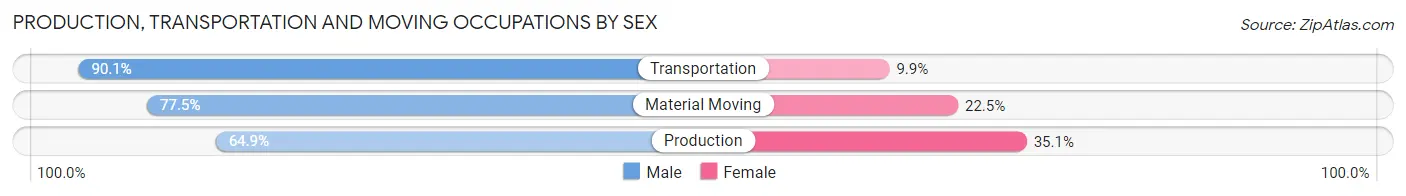
Production, Transportation and Moving Occupations by Sex
| Occupation | Male | Female |
| Production | 346 (64.9%) | 187 (35.1%) |
| Transportation | 164 (90.1%) | 18 (9.9%) |
| Material Moving | 169 (77.5%) | 49 (22.5%) |
| Total (Category) | 679 (72.8%) | 254 (27.2%) |
| Total (Overall) | 2,447 (54.9%) | 2,006 (45.1%) |
Employment Industries by Sex in Altoona
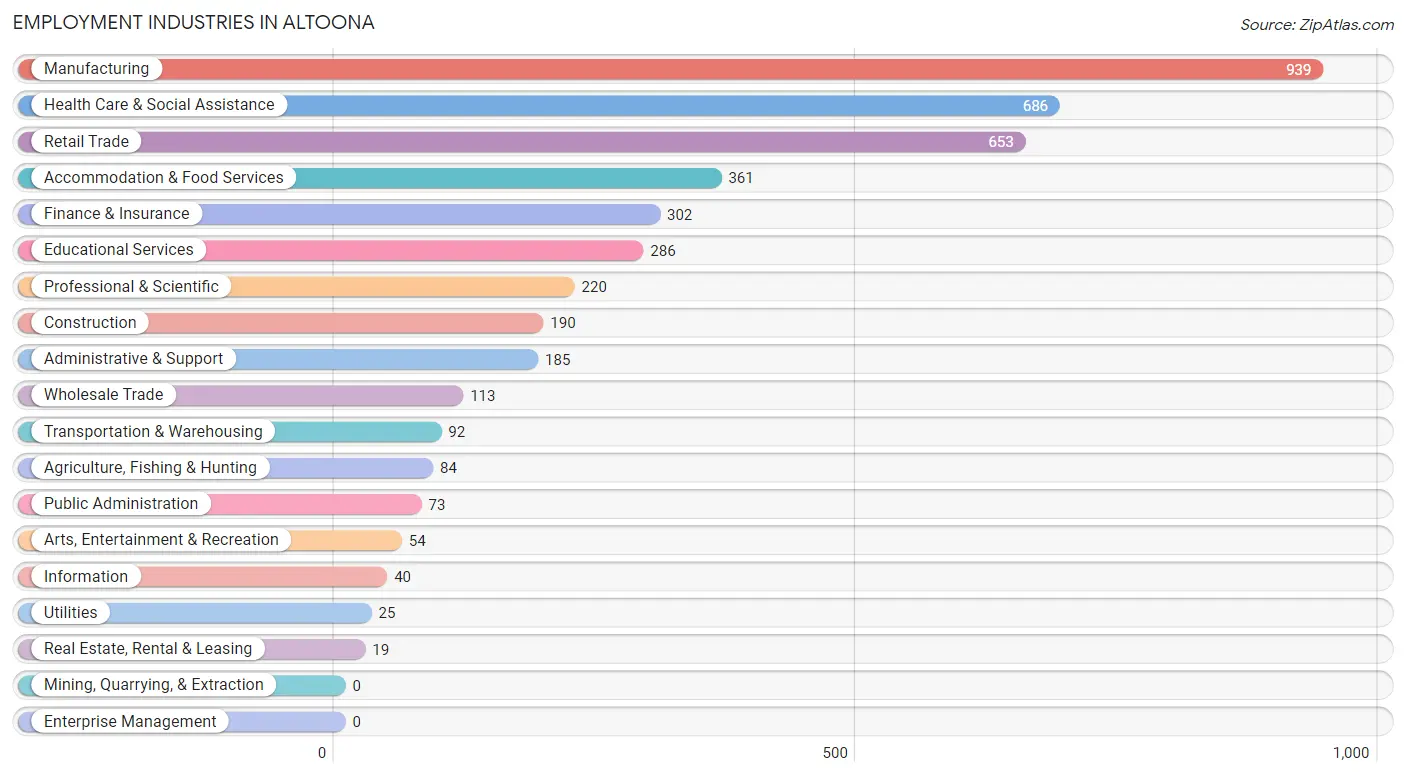
Employment Industries in Altoona
The major employment industries in Altoona include Manufacturing (939 | 21.1%), Health Care & Social Assistance (686 | 15.4%), Retail Trade (653 | 14.7%), Accommodation & Food Services (361 | 8.1%), and Finance & Insurance (302 | 6.8%).
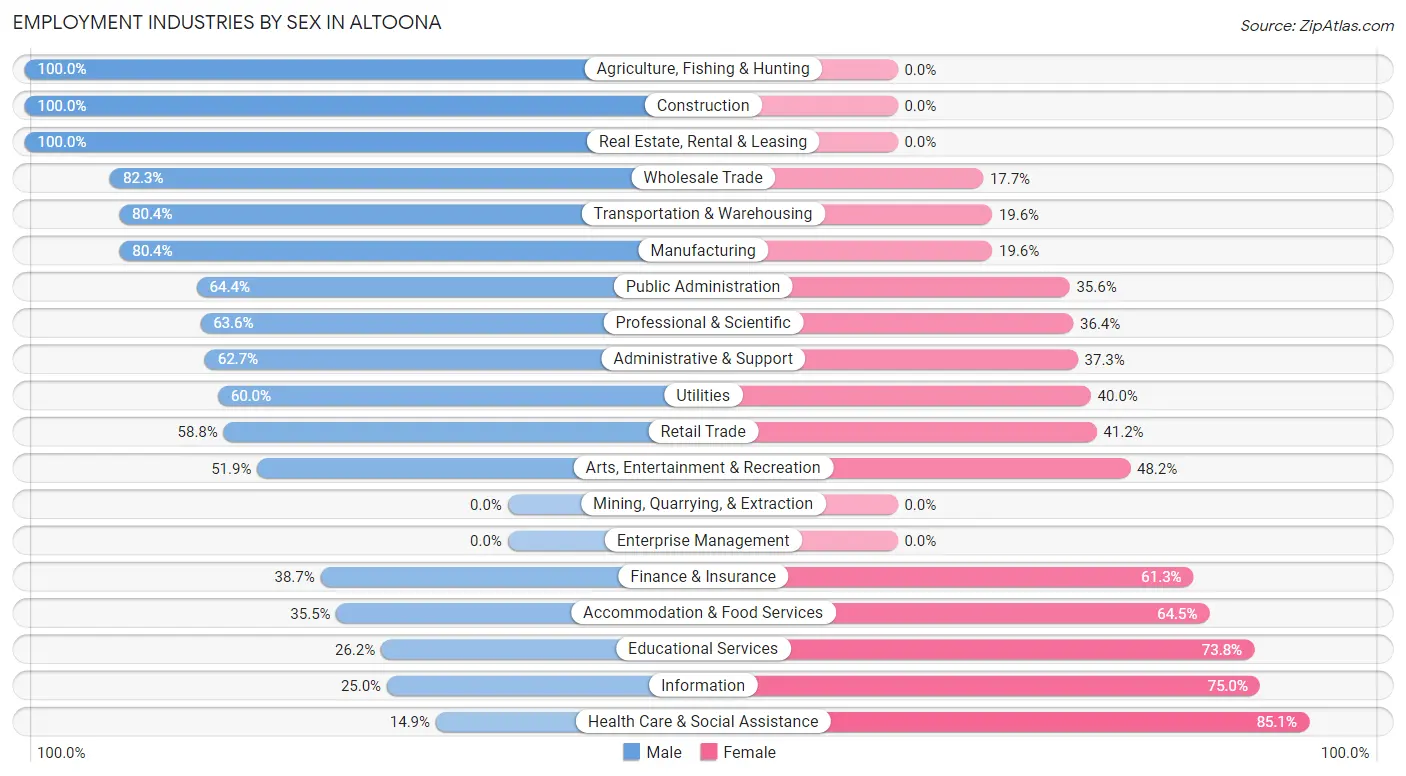
Employment Industries by Sex in Altoona
The Altoona industries that see more men than women are Agriculture, Fishing & Hunting (100.0%), Construction (100.0%), and Real Estate, Rental & Leasing (100.0%), whereas the industries that tend to have a higher number of women are Health Care & Social Assistance (85.1%), Information (75.0%), and Educational Services (73.8%).
| Industry | Male | Female |
| Agriculture, Fishing & Hunting | 84 (100.0%) | 0 (0.0%) |
| Mining, Quarrying, & Extraction | 0 (0.0%) | 0 (0.0%) |
| Construction | 190 (100.0%) | 0 (0.0%) |
| Manufacturing | 755 (80.4%) | 184 (19.6%) |
| Wholesale Trade | 93 (82.3%) | 20 (17.7%) |
| Retail Trade | 384 (58.8%) | 269 (41.2%) |
| Transportation & Warehousing | 74 (80.4%) | 18 (19.6%) |
| Utilities | 15 (60.0%) | 10 (40.0%) |
| Information | 10 (25.0%) | 30 (75.0%) |
| Finance & Insurance | 117 (38.7%) | 185 (61.3%) |
| Real Estate, Rental & Leasing | 19 (100.0%) | 0 (0.0%) |
| Professional & Scientific | 140 (63.6%) | 80 (36.4%) |
| Enterprise Management | 0 (0.0%) | 0 (0.0%) |
| Administrative & Support | 116 (62.7%) | 69 (37.3%) |
| Educational Services | 75 (26.2%) | 211 (73.8%) |
| Health Care & Social Assistance | 102 (14.9%) | 584 (85.1%) |
| Arts, Entertainment & Recreation | 28 (51.8%) | 26 (48.1%) |
| Accommodation & Food Services | 128 (35.5%) | 233 (64.5%) |
| Public Administration | 47 (64.4%) | 26 (35.6%) |
| Total | 2,447 (54.9%) | 2,006 (45.1%) |
Education in Altoona
School Enrollment in Altoona
The most common levels of schooling among the 2,206 students in Altoona are middle school (580 | 26.3%), college / undergraduate (529 | 24.0%), and elementary school (482 | 21.8%).
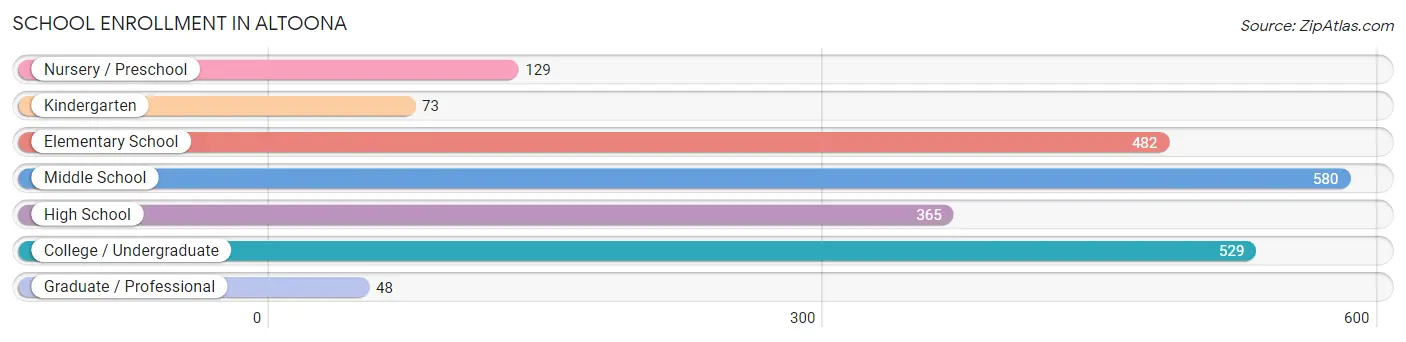
| School Level | # Students | % Students |
| Nursery / Preschool | 129 | 5.9% |
| Kindergarten | 73 | 3.3% |
| Elementary School | 482 | 21.8% |
| Middle School | 580 | 26.3% |
| High School | 365 | 16.6% |
| College / Undergraduate | 529 | 24.0% |
| Graduate / Professional | 48 | 2.2% |
| Total | 2,206 | 100.0% |
School Enrollment by Age by Funding Source in Altoona
Out of a total of 2,206 students who are enrolled in schools in Altoona, 183 (8.3%) attend a private institution, while the remaining 2,023 (91.7%) are enrolled in public schools. The age group of 35 years and over has the highest likelihood of being enrolled in private schools, with 15 (25.9% in the age bracket) enrolled. Conversely, the age group of 5 to 9 year old has the lowest likelihood of being enrolled in a private school, with 509 (98.1% in the age bracket) attending a public institution.
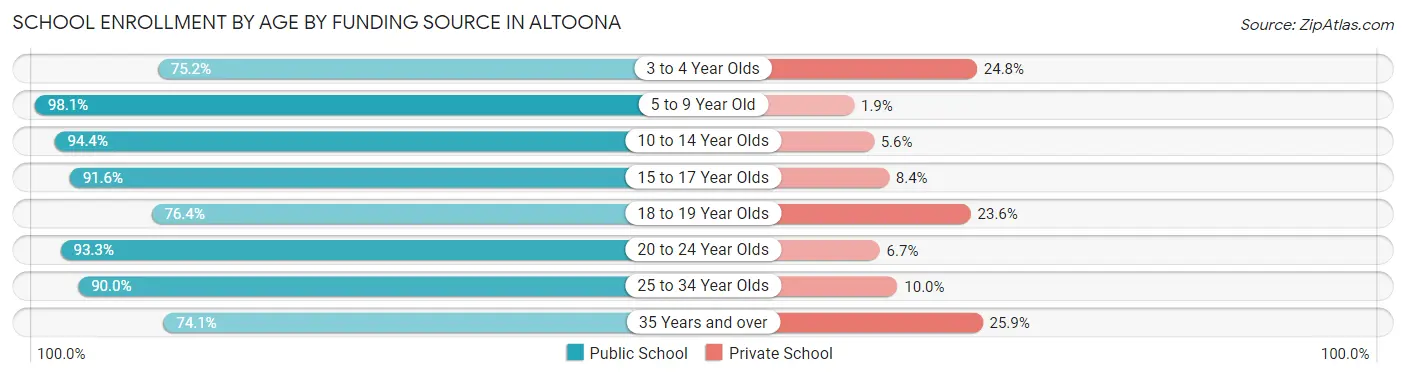
| Age Bracket | Public School | Private School |
| 3 to 4 Year Olds | 97 (75.2%) | 32 (24.8%) |
| 5 to 9 Year Old | 509 (98.1%) | 10 (1.9%) |
| 10 to 14 Year Olds | 573 (94.4%) | 34 (5.6%) |
| 15 to 17 Year Olds | 283 (91.6%) | 26 (8.4%) |
| 18 to 19 Year Olds | 84 (76.4%) | 26 (23.6%) |
| 20 to 24 Year Olds | 209 (93.3%) | 15 (6.7%) |
| 25 to 34 Year Olds | 225 (90.0%) | 25 (10.0%) |
| 35 Years and over | 43 (74.1%) | 15 (25.9%) |
| Total | 2,023 (91.7%) | 183 (8.3%) |
Educational Attainment by Field of Study in Altoona
Education (394 | 15.6%), business (368 | 14.5%), social sciences (296 | 11.7%), bio, nature & agricultural (236 | 9.3%), and psychology (211 | 8.3%) are the most common fields of study among 2,531 individuals in Altoona who have obtained a bachelor's degree or higher.
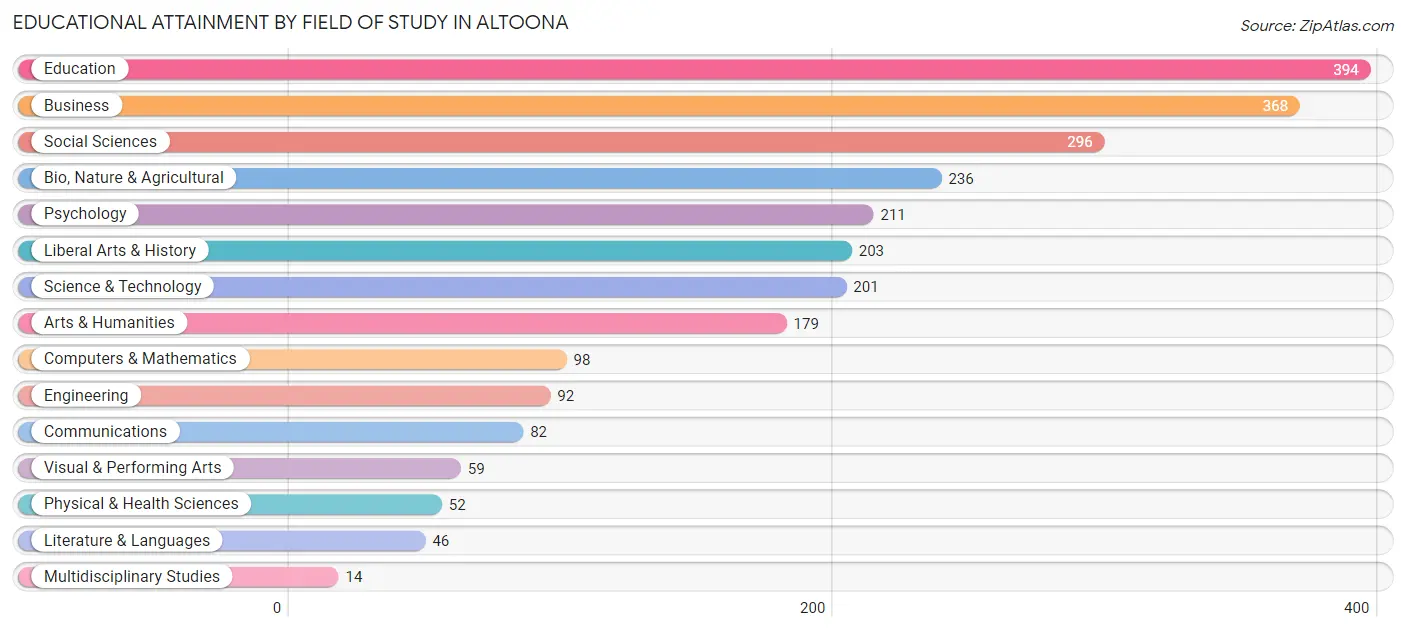
| Field of Study | # Graduates | % Graduates |
| Computers & Mathematics | 98 | 3.9% |
| Bio, Nature & Agricultural | 236 | 9.3% |
| Physical & Health Sciences | 52 | 2.1% |
| Psychology | 211 | 8.3% |
| Social Sciences | 296 | 11.7% |
| Engineering | 92 | 3.6% |
| Multidisciplinary Studies | 14 | 0.5% |
| Science & Technology | 201 | 7.9% |
| Business | 368 | 14.5% |
| Education | 394 | 15.6% |
| Literature & Languages | 46 | 1.8% |
| Liberal Arts & History | 203 | 8.0% |
| Visual & Performing Arts | 59 | 2.3% |
| Communications | 82 | 3.2% |
| Arts & Humanities | 179 | 7.1% |
| Total | 2,531 | 100.0% |
Transportation & Commute in Altoona
Vehicle Availability by Sex in Altoona
The most prevalent vehicle ownership categories in Altoona are males with 2 vehicles (1,277, accounting for 52.6%) and females with 2 vehicles (914, making up 66.2%).
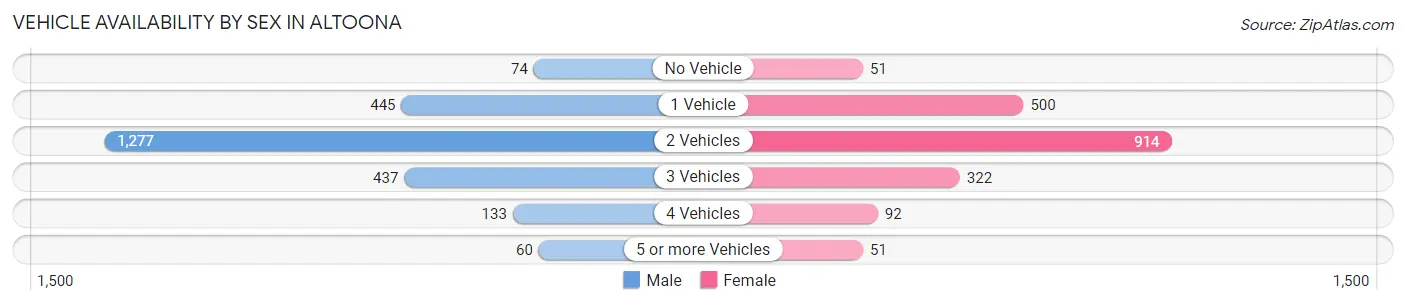
| Vehicles Available | Male | Female |
| No Vehicle | 74 (3.0%) | 51 (2.6%) |
| 1 Vehicle | 445 (18.3%) | 500 (25.9%) |
| 2 Vehicles | 1,277 (52.6%) | 914 (47.4%) |
| 3 Vehicles | 437 (18.0%) | 322 (16.7%) |
| 4 Vehicles | 133 (5.5%) | 92 (4.8%) |
| 5 or more Vehicles | 60 (2.5%) | 51 (2.6%) |
| Total | 2,426 (100.0%) | 1,930 (100.0%) |
Commute Time in Altoona
The most frequently occuring commute durations in Altoona are 15 to 19 minutes (1,277 commuters, 33.6%), 10 to 14 minutes (1,067 commuters, 28.1%), and 20 to 24 minutes (471 commuters, 12.4%).
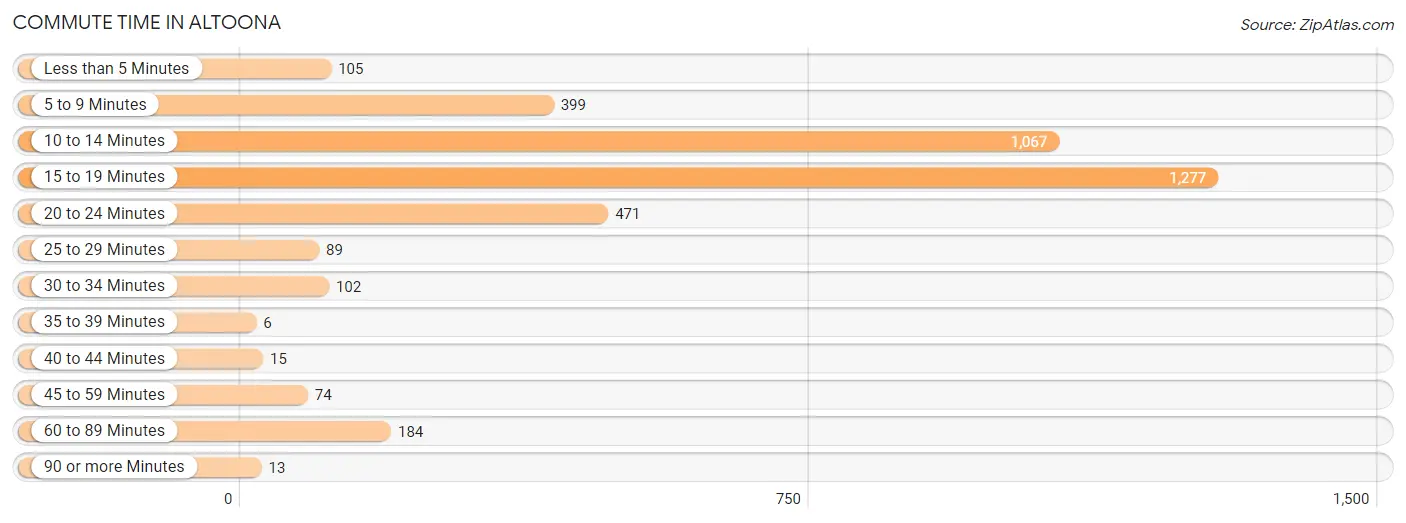
| Commute Time | # Commuters | % Commuters |
| Less than 5 Minutes | 105 | 2.8% |
| 5 to 9 Minutes | 399 | 10.5% |
| 10 to 14 Minutes | 1,067 | 28.1% |
| 15 to 19 Minutes | 1,277 | 33.6% |
| 20 to 24 Minutes | 471 | 12.4% |
| 25 to 29 Minutes | 89 | 2.3% |
| 30 to 34 Minutes | 102 | 2.7% |
| 35 to 39 Minutes | 6 | 0.2% |
| 40 to 44 Minutes | 15 | 0.4% |
| 45 to 59 Minutes | 74 | 1.9% |
| 60 to 89 Minutes | 184 | 4.8% |
| 90 or more Minutes | 13 | 0.3% |
Commute Time by Sex in Altoona
The most common commute times in Altoona are 15 to 19 minutes (718 commuters, 32.4%) for males and 15 to 19 minutes (559 commuters, 35.2%) for females.
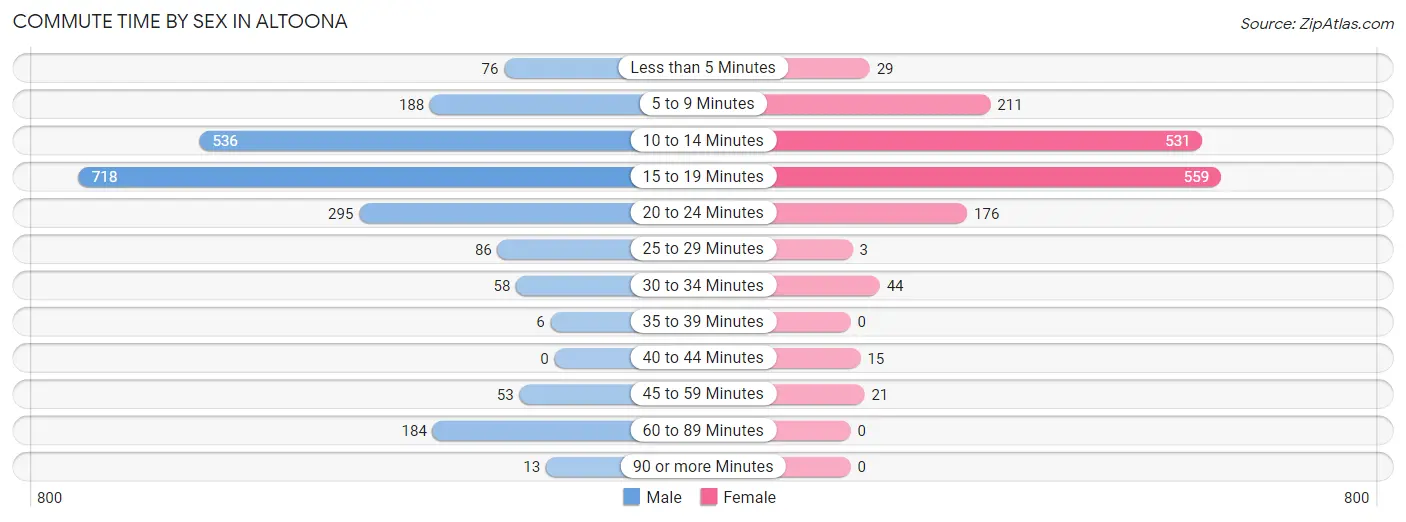
| Commute Time | Male | Female |
| Less than 5 Minutes | 76 (3.4%) | 29 (1.8%) |
| 5 to 9 Minutes | 188 (8.5%) | 211 (13.3%) |
| 10 to 14 Minutes | 536 (24.2%) | 531 (33.4%) |
| 15 to 19 Minutes | 718 (32.4%) | 559 (35.2%) |
| 20 to 24 Minutes | 295 (13.3%) | 176 (11.1%) |
| 25 to 29 Minutes | 86 (3.9%) | 3 (0.2%) |
| 30 to 34 Minutes | 58 (2.6%) | 44 (2.8%) |
| 35 to 39 Minutes | 6 (0.3%) | 0 (0.0%) |
| 40 to 44 Minutes | 0 (0.0%) | 15 (0.9%) |
| 45 to 59 Minutes | 53 (2.4%) | 21 (1.3%) |
| 60 to 89 Minutes | 184 (8.3%) | 0 (0.0%) |
| 90 or more Minutes | 13 (0.6%) | 0 (0.0%) |
Time of Departure to Work by Sex in Altoona
The most frequent times of departure to work in Altoona are 8:00 AM to 8:29 AM (330, 14.9%) for males and 7:30 AM to 7:59 AM (453, 28.5%) for females.
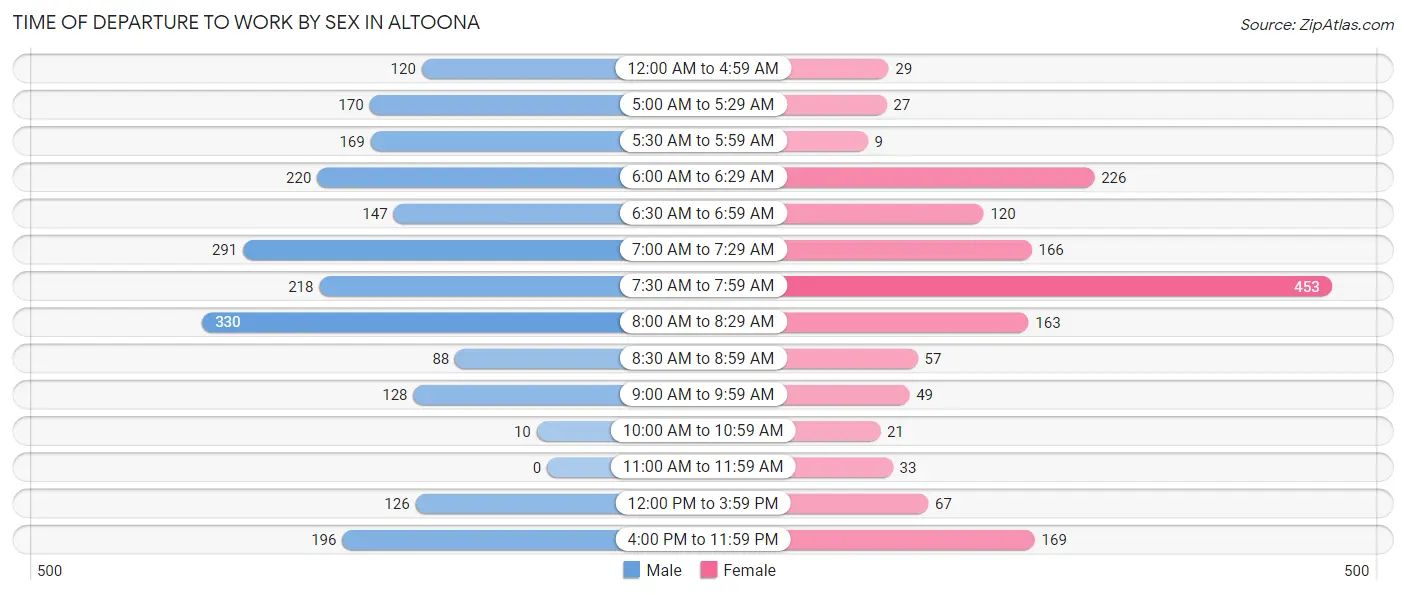
| Time of Departure | Male | Female |
| 12:00 AM to 4:59 AM | 120 (5.4%) | 29 (1.8%) |
| 5:00 AM to 5:29 AM | 170 (7.7%) | 27 (1.7%) |
| 5:30 AM to 5:59 AM | 169 (7.6%) | 9 (0.6%) |
| 6:00 AM to 6:29 AM | 220 (9.9%) | 226 (14.2%) |
| 6:30 AM to 6:59 AM | 147 (6.6%) | 120 (7.5%) |
| 7:00 AM to 7:29 AM | 291 (13.2%) | 166 (10.4%) |
| 7:30 AM to 7:59 AM | 218 (9.9%) | 453 (28.5%) |
| 8:00 AM to 8:29 AM | 330 (14.9%) | 163 (10.3%) |
| 8:30 AM to 8:59 AM | 88 (4.0%) | 57 (3.6%) |
| 9:00 AM to 9:59 AM | 128 (5.8%) | 49 (3.1%) |
| 10:00 AM to 10:59 AM | 10 (0.4%) | 21 (1.3%) |
| 11:00 AM to 11:59 AM | 0 (0.0%) | 33 (2.1%) |
| 12:00 PM to 3:59 PM | 126 (5.7%) | 67 (4.2%) |
| 4:00 PM to 11:59 PM | 196 (8.9%) | 169 (10.6%) |
| Total | 2,213 (100.0%) | 1,589 (100.0%) |
Housing Occupancy in Altoona
Occupancy by Ownership in Altoona
Of the total 3,543 dwellings in Altoona, owner-occupied units account for 2,034 (57.4%), while renter-occupied units make up 1,509 (42.6%).
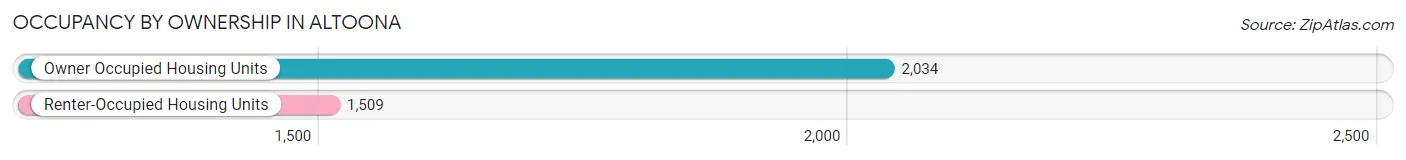
| Occupancy | # Housing Units | % Housing Units |
| Owner Occupied Housing Units | 2,034 | 57.4% |
| Renter-Occupied Housing Units | 1,509 | 42.6% |
| Total Occupied Housing Units | 3,543 | 100.0% |
Occupancy by Household Size in Altoona
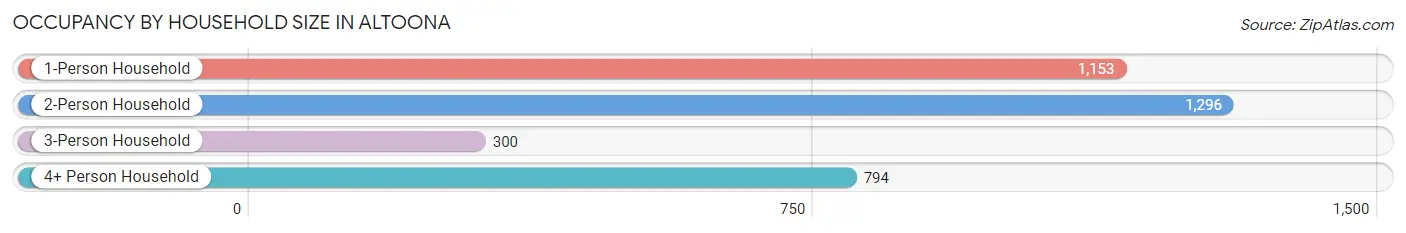
| Household Size | # Housing Units | % Housing Units |
| 1-Person Household | 1,153 | 32.5% |
| 2-Person Household | 1,296 | 36.6% |
| 3-Person Household | 300 | 8.5% |
| 4+ Person Household | 794 | 22.4% |
| Total Housing Units | 3,543 | 100.0% |
Occupancy by Ownership by Household Size in Altoona
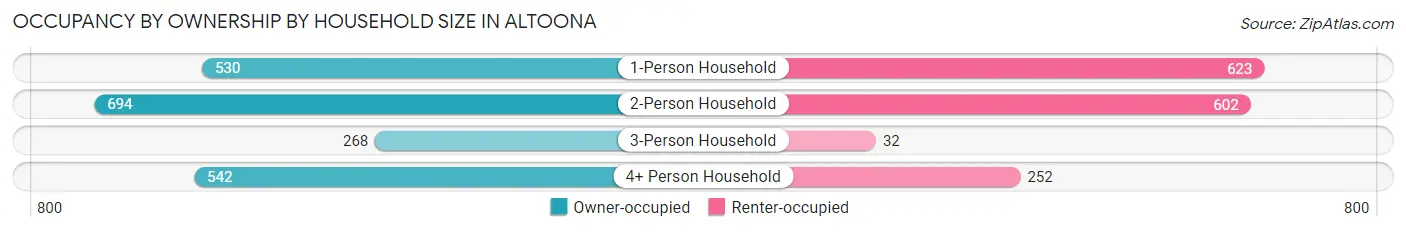
| Household Size | Owner-occupied | Renter-occupied |
| 1-Person Household | 530 (46.0%) | 623 (54.0%) |
| 2-Person Household | 694 (53.5%) | 602 (46.5%) |
| 3-Person Household | 268 (89.3%) | 32 (10.7%) |
| 4+ Person Household | 542 (68.3%) | 252 (31.7%) |
| Total Housing Units | 2,034 (57.4%) | 1,509 (42.6%) |
Occupancy by Educational Attainment in Altoona
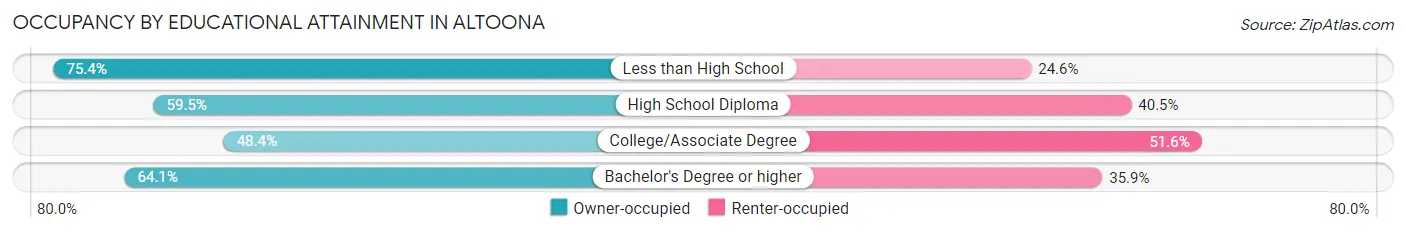
| Household Size | Owner-occupied | Renter-occupied |
| Less than High School | 95 (75.4%) | 31 (24.6%) |
| High School Diploma | 322 (59.5%) | 219 (40.5%) |
| College/Associate Degree | 700 (48.4%) | 746 (51.6%) |
| Bachelor's Degree or higher | 917 (64.1%) | 513 (35.9%) |
Occupancy by Age of Householder in Altoona
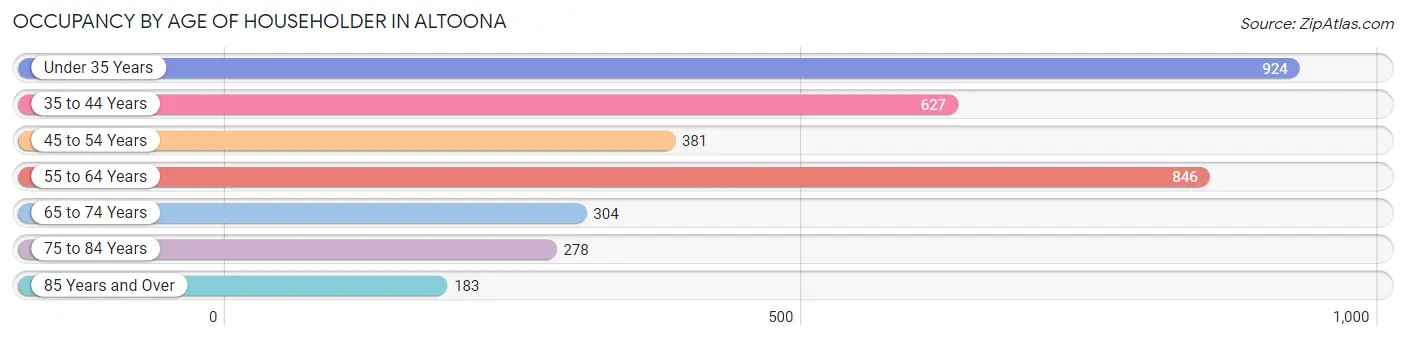
| Age Bracket | # Households | % Households |
| Under 35 Years | 924 | 26.1% |
| 35 to 44 Years | 627 | 17.7% |
| 45 to 54 Years | 381 | 10.7% |
| 55 to 64 Years | 846 | 23.9% |
| 65 to 74 Years | 304 | 8.6% |
| 75 to 84 Years | 278 | 7.9% |
| 85 Years and Over | 183 | 5.2% |
| Total | 3,543 | 100.0% |
Housing Finances in Altoona
Median Income by Occupancy in Altoona
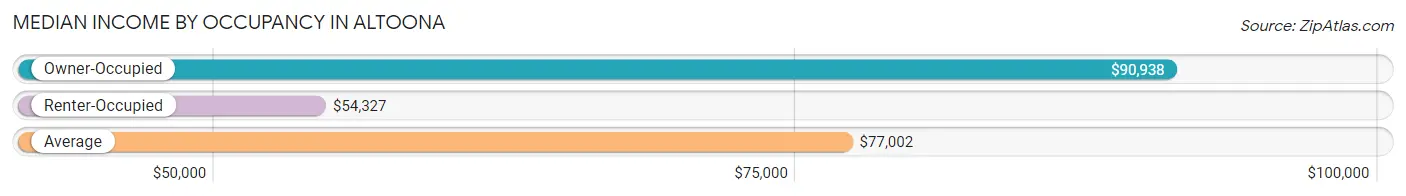
| Occupancy Type | # Households | Median Income |
| Owner-Occupied | 2,034 (57.4%) | $90,938 |
| Renter-Occupied | 1,509 (42.6%) | $54,327 |
| Average | 3,543 (100.0%) | $77,002 |
Occupancy by Householder Income Bracket in Altoona
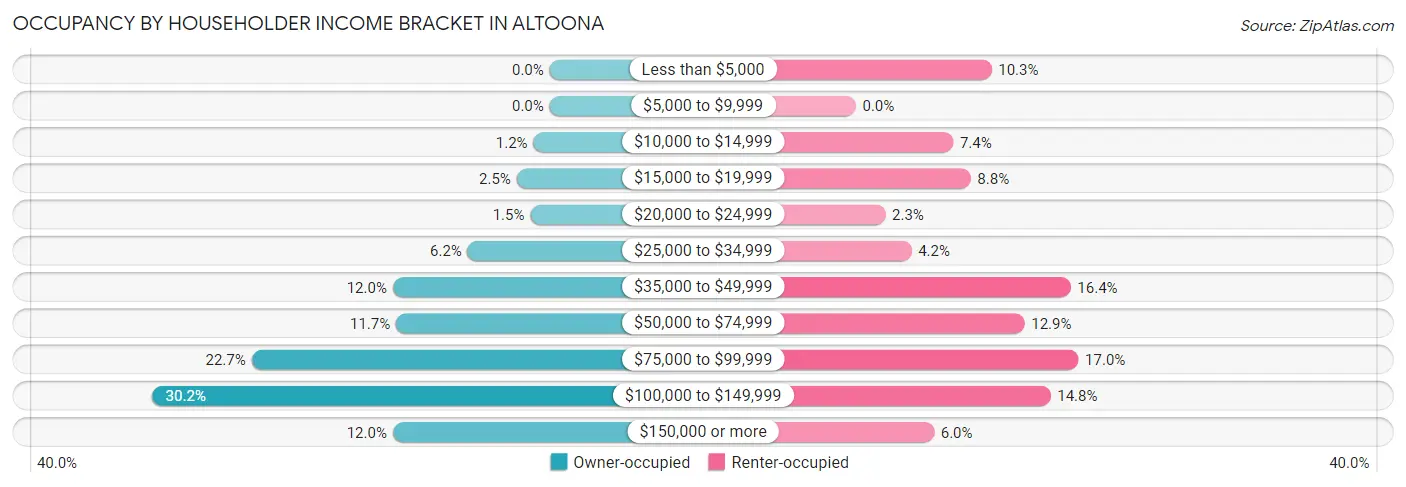
| Income Bracket | Owner-occupied | Renter-occupied |
| Less than $5,000 | 0 (0.0%) | 156 (10.3%) |
| $5,000 to $9,999 | 0 (0.0%) | 0 (0.0%) |
| $10,000 to $14,999 | 25 (1.2%) | 112 (7.4%) |
| $15,000 to $19,999 | 51 (2.5%) | 132 (8.7%) |
| $20,000 to $24,999 | 30 (1.5%) | 34 (2.2%) |
| $25,000 to $34,999 | 127 (6.2%) | 64 (4.2%) |
| $35,000 to $49,999 | 243 (11.9%) | 247 (16.4%) |
| $50,000 to $74,999 | 238 (11.7%) | 194 (12.9%) |
| $75,000 to $99,999 | 462 (22.7%) | 256 (17.0%) |
| $100,000 to $149,999 | 615 (30.2%) | 224 (14.8%) |
| $150,000 or more | 243 (11.9%) | 90 (6.0%) |
| Total | 2,034 (100.0%) | 1,509 (100.0%) |
Monthly Housing Cost Tiers in Altoona
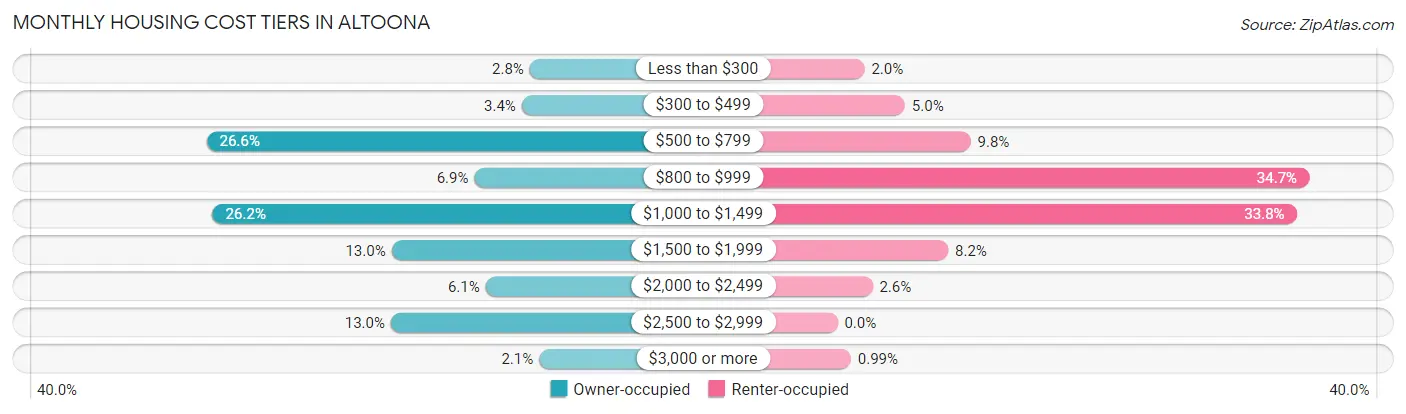
| Monthly Cost | Owner-occupied | Renter-occupied |
| Less than $300 | 57 (2.8%) | 30 (2.0%) |
| $300 to $499 | 69 (3.4%) | 75 (5.0%) |
| $500 to $799 | 541 (26.6%) | 148 (9.8%) |
| $800 to $999 | 140 (6.9%) | 524 (34.7%) |
| $1,000 to $1,499 | 532 (26.2%) | 510 (33.8%) |
| $1,500 to $1,999 | 264 (13.0%) | 123 (8.2%) |
| $2,000 to $2,499 | 123 (6.0%) | 39 (2.6%) |
| $2,500 to $2,999 | 265 (13.0%) | 0 (0.0%) |
| $3,000 or more | 43 (2.1%) | 15 (1.0%) |
| Total | 2,034 (100.0%) | 1,509 (100.0%) |
Physical Housing Characteristics in Altoona
Housing Structures in Altoona
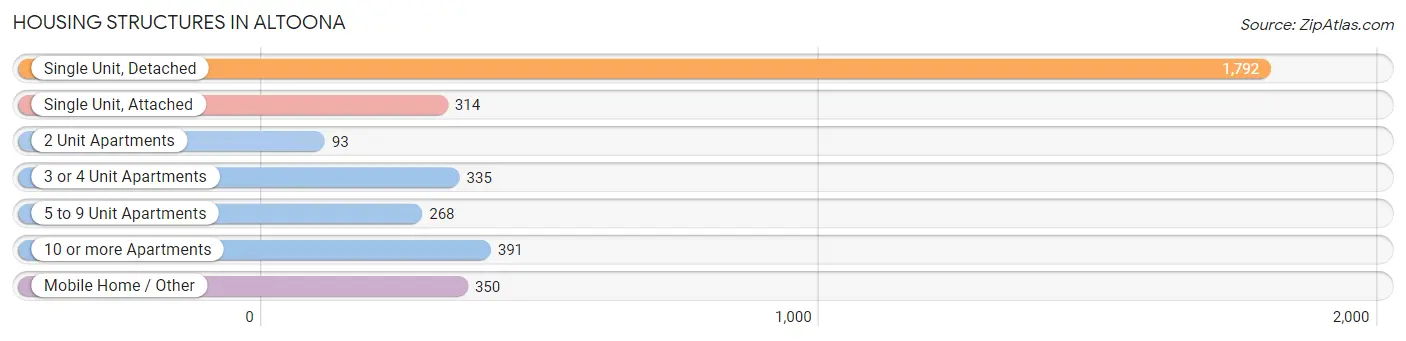
| Structure Type | # Housing Units | % Housing Units |
| Single Unit, Detached | 1,792 | 50.6% |
| Single Unit, Attached | 314 | 8.9% |
| 2 Unit Apartments | 93 | 2.6% |
| 3 or 4 Unit Apartments | 335 | 9.5% |
| 5 to 9 Unit Apartments | 268 | 7.6% |
| 10 or more Apartments | 391 | 11.0% |
| Mobile Home / Other | 350 | 9.9% |
| Total | 3,543 | 100.0% |
Housing Structures by Occupancy in Altoona
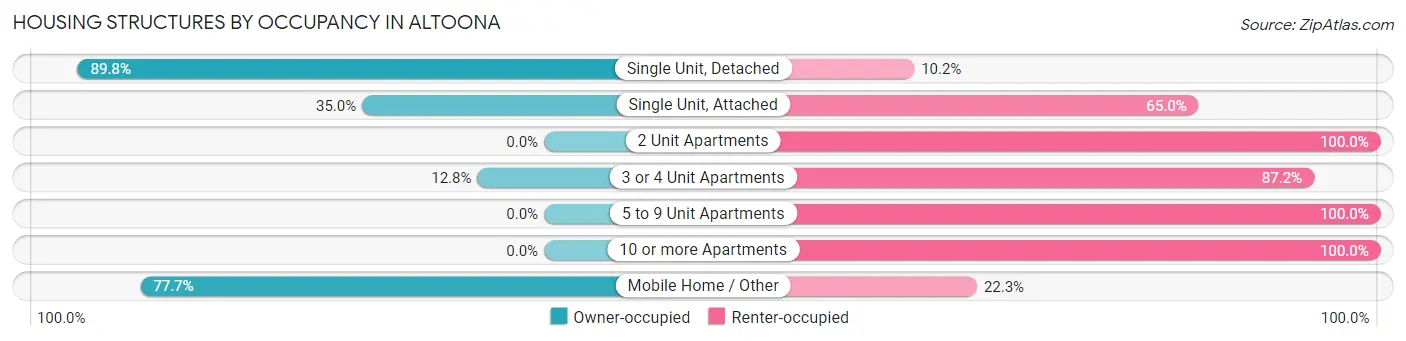
| Structure Type | Owner-occupied | Renter-occupied |
| Single Unit, Detached | 1,609 (89.8%) | 183 (10.2%) |
| Single Unit, Attached | 110 (35.0%) | 204 (65.0%) |
| 2 Unit Apartments | 0 (0.0%) | 93 (100.0%) |
| 3 or 4 Unit Apartments | 43 (12.8%) | 292 (87.2%) |
| 5 to 9 Unit Apartments | 0 (0.0%) | 268 (100.0%) |
| 10 or more Apartments | 0 (0.0%) | 391 (100.0%) |
| Mobile Home / Other | 272 (77.7%) | 78 (22.3%) |
| Total | 2,034 (57.4%) | 1,509 (42.6%) |
Housing Structures by Number of Rooms in Altoona
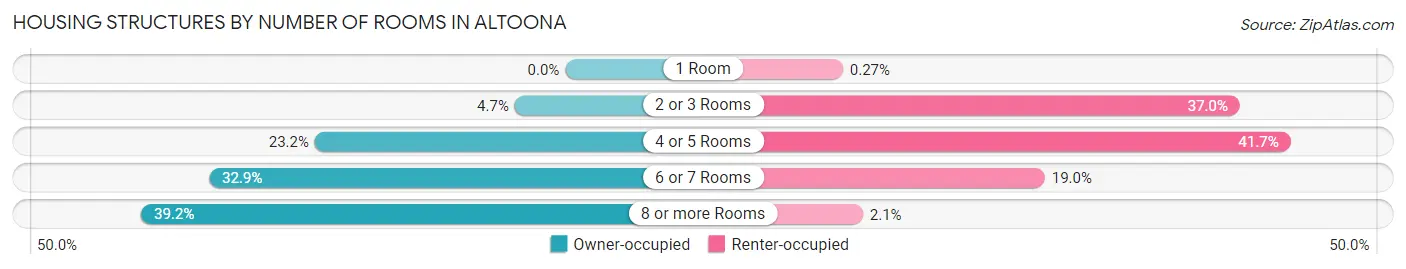
| Number of Rooms | Owner-occupied | Renter-occupied |
| 1 Room | 0 (0.0%) | 4 (0.3%) |
| 2 or 3 Rooms | 95 (4.7%) | 558 (37.0%) |
| 4 or 5 Rooms | 471 (23.2%) | 629 (41.7%) |
| 6 or 7 Rooms | 670 (32.9%) | 286 (19.0%) |
| 8 or more Rooms | 798 (39.2%) | 32 (2.1%) |
| Total | 2,034 (100.0%) | 1,509 (100.0%) |
Housing Structure by Heating Type in Altoona
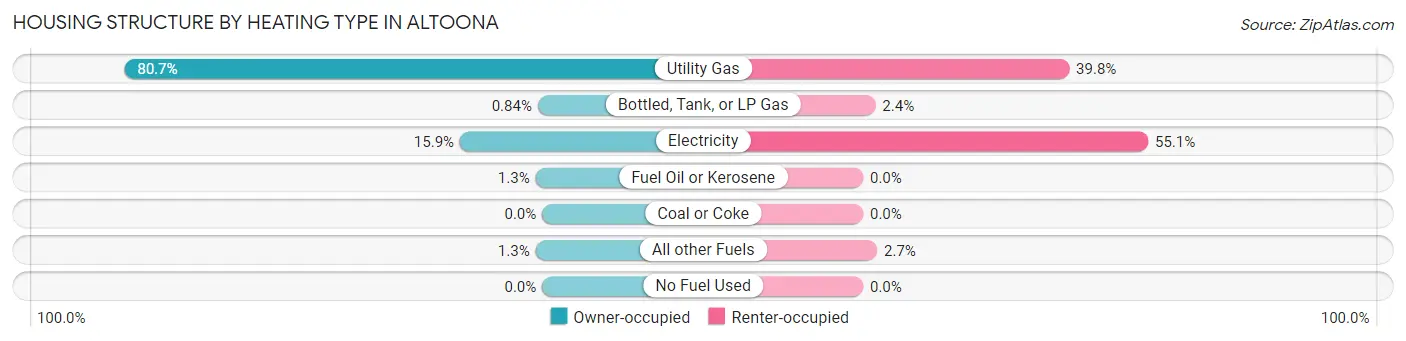
| Heating Type | Owner-occupied | Renter-occupied |
| Utility Gas | 1,642 (80.7%) | 601 (39.8%) |
| Bottled, Tank, or LP Gas | 17 (0.8%) | 36 (2.4%) |
| Electricity | 323 (15.9%) | 831 (55.1%) |
| Fuel Oil or Kerosene | 26 (1.3%) | 0 (0.0%) |
| Coal or Coke | 0 (0.0%) | 0 (0.0%) |
| All other Fuels | 26 (1.3%) | 41 (2.7%) |
| No Fuel Used | 0 (0.0%) | 0 (0.0%) |
| Total | 2,034 (100.0%) | 1,509 (100.0%) |
Household Vehicle Usage in Altoona
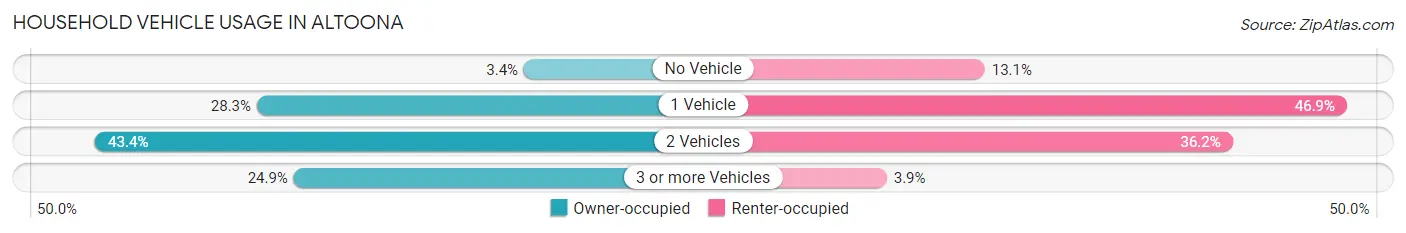
| Vehicles per Household | Owner-occupied | Renter-occupied |
| No Vehicle | 69 (3.4%) | 197 (13.1%) |
| 1 Vehicle | 576 (28.3%) | 707 (46.9%) |
| 2 Vehicles | 883 (43.4%) | 546 (36.2%) |
| 3 or more Vehicles | 506 (24.9%) | 59 (3.9%) |
| Total | 2,034 (100.0%) | 1,509 (100.0%) |
Real Estate & Mortgages in Altoona
Real Estate and Mortgage Overview in Altoona
| Characteristic | Without Mortgage | With Mortgage |
| Housing Units | 727 | 1,307 |
| Median Property Value | $173,200 | $236,200 |
| Median Household Income | $75,492 | $179 |
| Monthly Housing Costs | $590 | $43 |
| Real Estate Taxes | $3,063 | $18 |
Property Value by Mortgage Status in Altoona
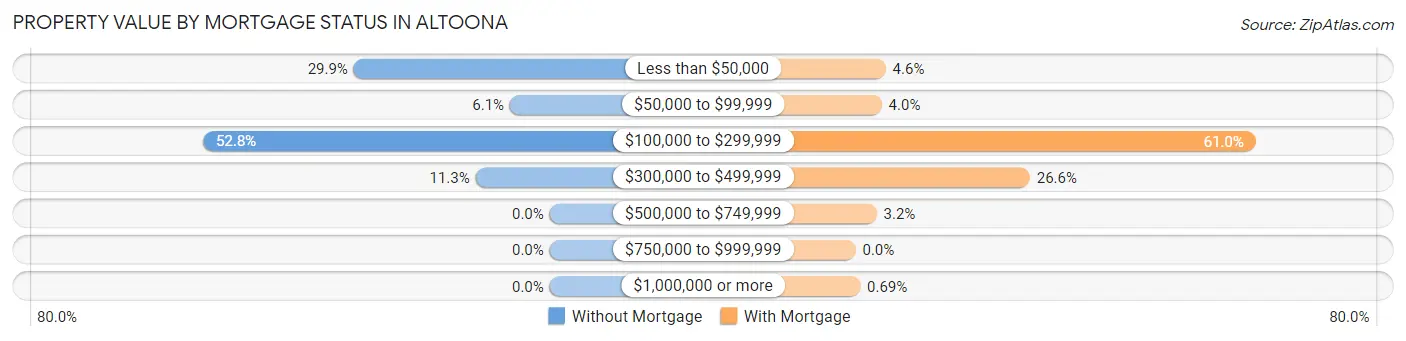
| Property Value | Without Mortgage | With Mortgage |
| Less than $50,000 | 217 (29.8%) | 60 (4.6%) |
| $50,000 to $99,999 | 44 (6.0%) | 52 (4.0%) |
| $100,000 to $299,999 | 384 (52.8%) | 797 (61.0%) |
| $300,000 to $499,999 | 82 (11.3%) | 347 (26.6%) |
| $500,000 to $749,999 | 0 (0.0%) | 42 (3.2%) |
| $750,000 to $999,999 | 0 (0.0%) | 0 (0.0%) |
| $1,000,000 or more | 0 (0.0%) | 9 (0.7%) |
| Total | 727 (100.0%) | 1,307 (100.0%) |
Household Income by Mortgage Status in Altoona
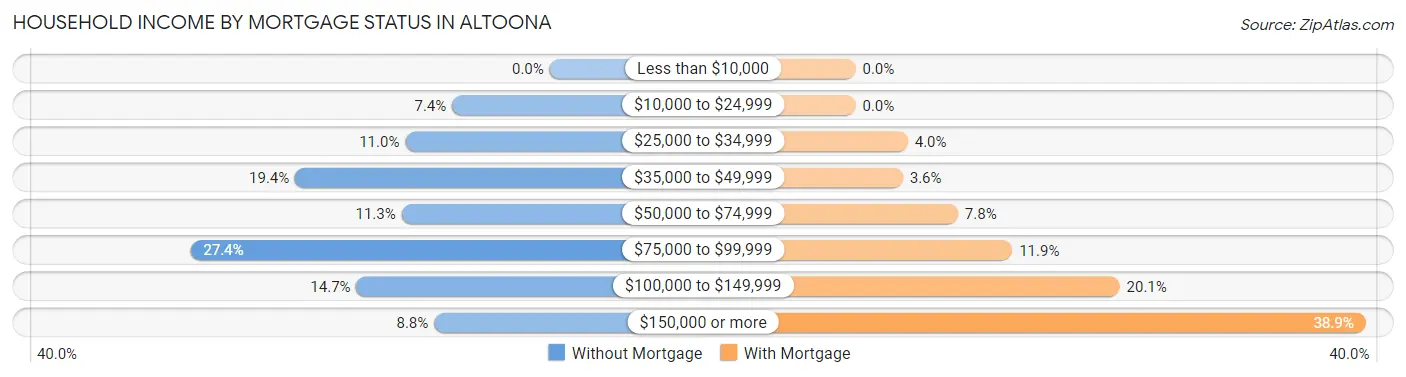
| Household Income | Without Mortgage | With Mortgage |
| Less than $10,000 | 0 (0.0%) | 0 (0.0%) |
| $10,000 to $24,999 | 54 (7.4%) | 0 (0.0%) |
| $25,000 to $34,999 | 80 (11.0%) | 52 (4.0%) |
| $35,000 to $49,999 | 141 (19.4%) | 47 (3.6%) |
| $50,000 to $74,999 | 82 (11.3%) | 102 (7.8%) |
| $75,000 to $99,999 | 199 (27.4%) | 156 (11.9%) |
| $100,000 to $149,999 | 107 (14.7%) | 263 (20.1%) |
| $150,000 or more | 64 (8.8%) | 508 (38.9%) |
| Total | 727 (100.0%) | 1,307 (100.0%) |
Property Value to Household Income Ratio in Altoona
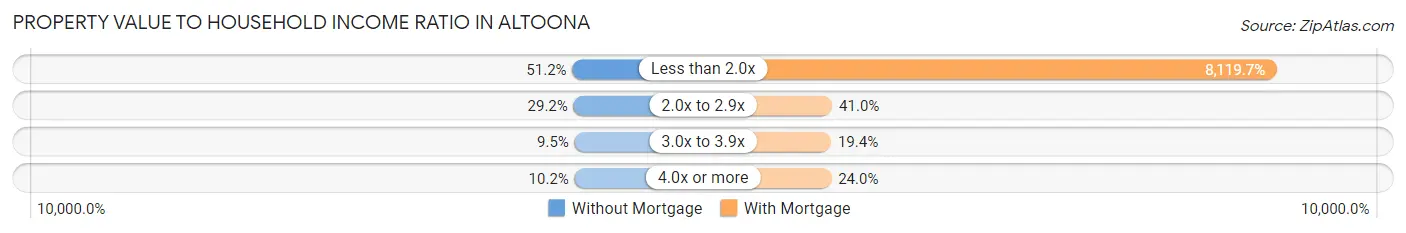
| Value-to-Income Ratio | Without Mortgage | With Mortgage |
| Less than 2.0x | 372 (51.2%) | 106,125 (8,119.7%) |
| 2.0x to 2.9x | 212 (29.2%) | 536 (41.0%) |
| 3.0x to 3.9x | 69 (9.5%) | 253 (19.4%) |
| 4.0x or more | 74 (10.2%) | 313 (23.9%) |
| Total | 727 (100.0%) | 1,307 (100.0%) |
Real Estate Taxes by Mortgage Status in Altoona
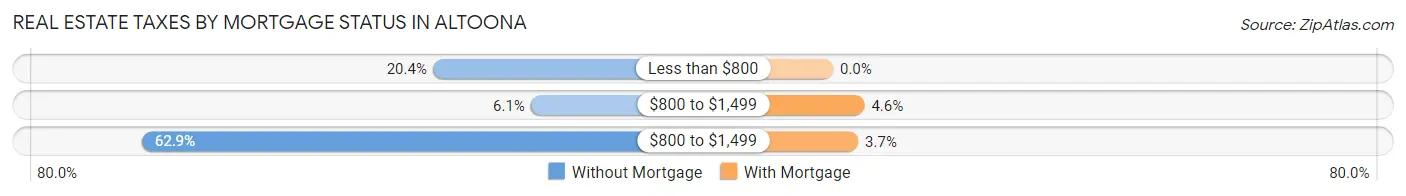
| Property Taxes | Without Mortgage | With Mortgage |
| Less than $800 | 148 (20.4%) | 0 (0.0%) |
| $800 to $1,499 | 44 (6.0%) | 60 (4.6%) |
| $800 to $1,499 | 457 (62.9%) | 48 (3.7%) |
| Total | 727 (100.0%) | 1,307 (100.0%) |
Health & Disability in Altoona
Health Insurance Coverage by Age in Altoona
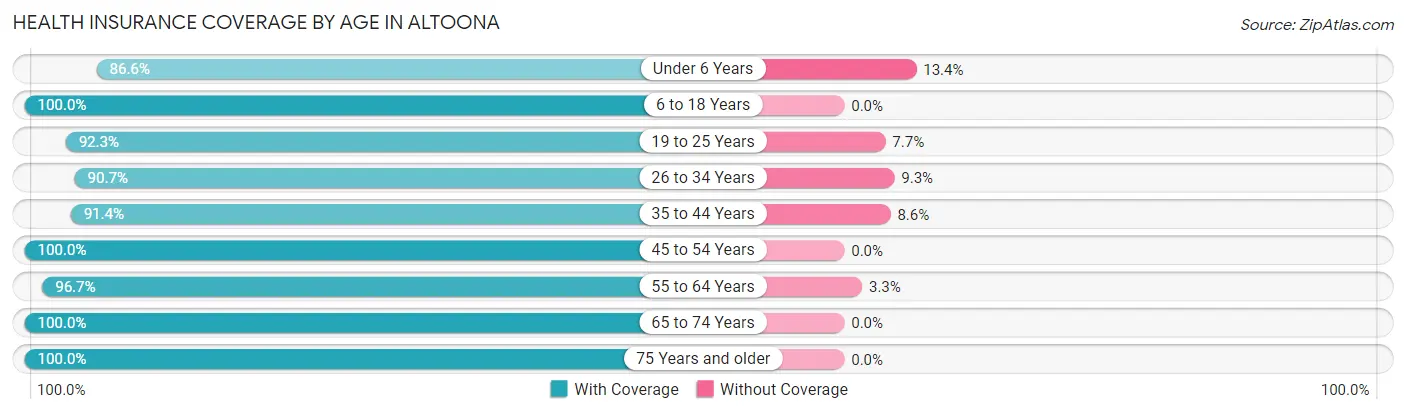
| Age Bracket | With Coverage | Without Coverage |
| Under 6 Years | 419 (86.6%) | 65 (13.4%) |
| 6 to 18 Years | 1,611 (100.0%) | 0 (0.0%) |
| 19 to 25 Years | 746 (92.3%) | 62 (7.7%) |
| 26 to 34 Years | 1,107 (90.7%) | 114 (9.3%) |
| 35 to 44 Years | 998 (91.4%) | 94 (8.6%) |
| 45 to 54 Years | 629 (100.0%) | 0 (0.0%) |
| 55 to 64 Years | 1,315 (96.7%) | 45 (3.3%) |
| 65 to 74 Years | 662 (100.0%) | 0 (0.0%) |
| 75 Years and older | 590 (100.0%) | 0 (0.0%) |
| Total | 8,077 (95.5%) | 380 (4.5%) |
Health Insurance Coverage by Citizenship Status in Altoona
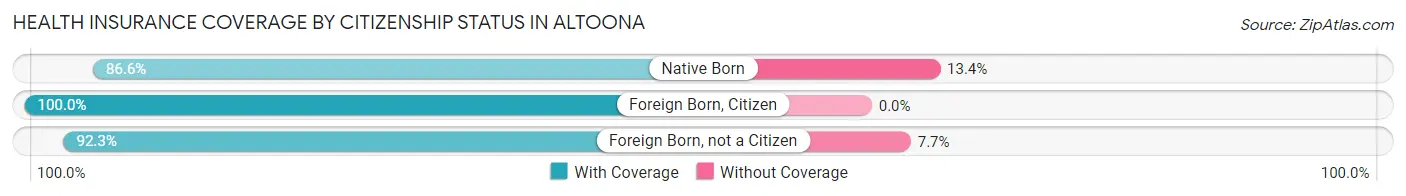
| Citizenship Status | With Coverage | Without Coverage |
| Native Born | 419 (86.6%) | 65 (13.4%) |
| Foreign Born, Citizen | 1,611 (100.0%) | 0 (0.0%) |
| Foreign Born, not a Citizen | 746 (92.3%) | 62 (7.7%) |
Health Insurance Coverage by Household Income in Altoona
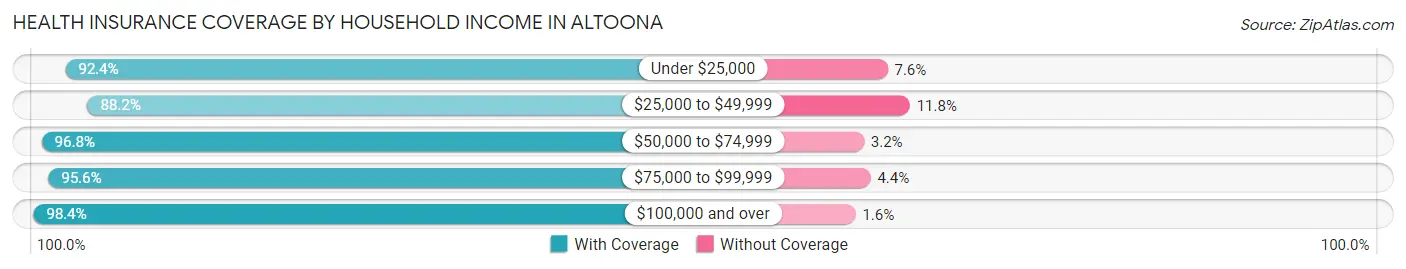
| Household Income | With Coverage | Without Coverage |
| Under $25,000 | 763 (92.4%) | 63 (7.6%) |
| $25,000 to $49,999 | 1,115 (88.2%) | 149 (11.8%) |
| $50,000 to $74,999 | 847 (96.8%) | 28 (3.2%) |
| $75,000 to $99,999 | 1,723 (95.6%) | 80 (4.4%) |
| $100,000 and over | 3,619 (98.4%) | 60 (1.6%) |
Public vs Private Health Insurance Coverage by Age in Altoona
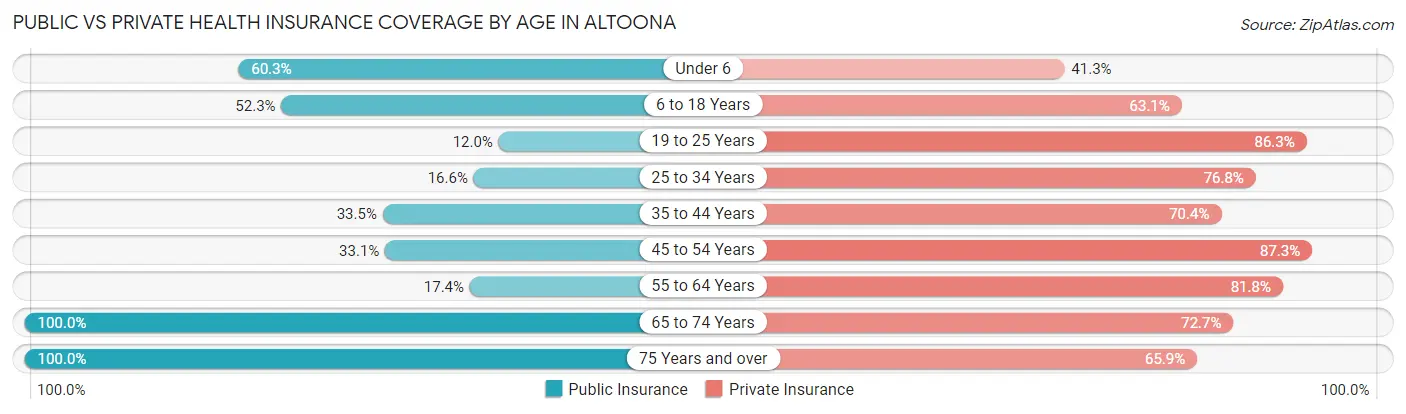
| Age Bracket | Public Insurance | Private Insurance |
| Under 6 | 292 (60.3%) | 200 (41.3%) |
| 6 to 18 Years | 843 (52.3%) | 1,016 (63.1%) |
| 19 to 25 Years | 97 (12.0%) | 697 (86.3%) |
| 25 to 34 Years | 203 (16.6%) | 938 (76.8%) |
| 35 to 44 Years | 366 (33.5%) | 769 (70.4%) |
| 45 to 54 Years | 208 (33.1%) | 549 (87.3%) |
| 55 to 64 Years | 236 (17.3%) | 1,113 (81.8%) |
| 65 to 74 Years | 662 (100.0%) | 481 (72.7%) |
| 75 Years and over | 590 (100.0%) | 389 (65.9%) |
| Total | 3,497 (41.3%) | 6,152 (72.7%) |
Disability Status by Sex by Age in Altoona
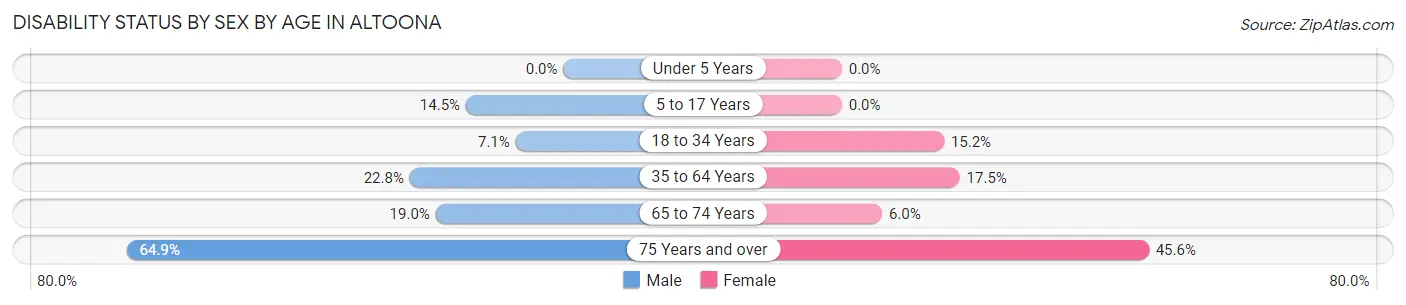
| Age Bracket | Male | Female |
| Under 5 Years | 0 (0.0%) | 0 (0.0%) |
| 5 to 17 Years | 156 (14.5%) | 0 (0.0%) |
| 18 to 34 Years | 91 (7.1%) | 128 (15.2%) |
| 35 to 64 Years | 360 (22.8%) | 263 (17.5%) |
| 65 to 74 Years | 62 (19.0%) | 20 (6.0%) |
| 75 Years and over | 155 (64.8%) | 160 (45.6%) |
Disability Class by Sex by Age in Altoona
Disability Class: Hearing Difficulty
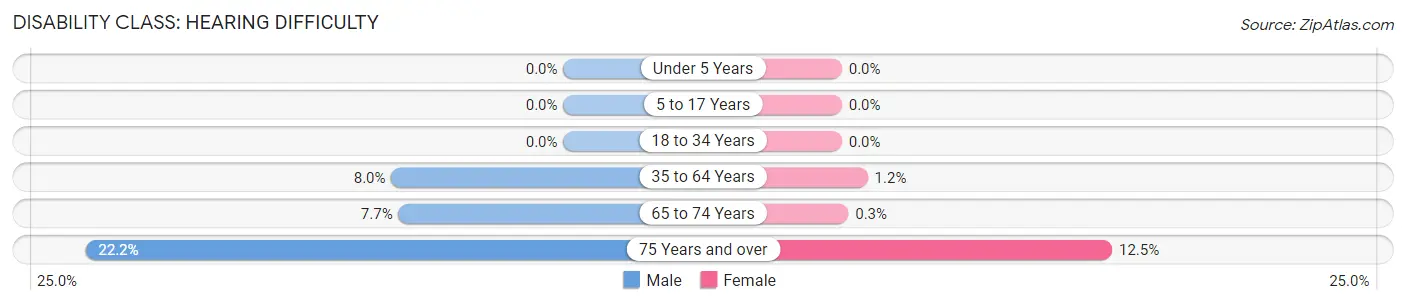
| Age Bracket | Male | Female |
| Under 5 Years | 0 (0.0%) | 0 (0.0%) |
| 5 to 17 Years | 0 (0.0%) | 0 (0.0%) |
| 18 to 34 Years | 0 (0.0%) | 0 (0.0%) |
| 35 to 64 Years | 126 (8.0%) | 18 (1.2%) |
| 65 to 74 Years | 25 (7.6%) | 1 (0.3%) |
| 75 Years and over | 53 (22.2%) | 44 (12.5%) |
Disability Class: Vision Difficulty
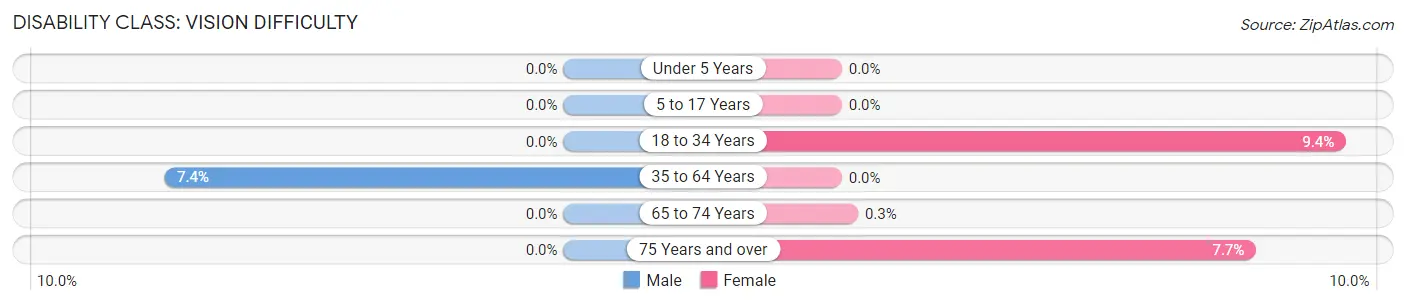
| Age Bracket | Male | Female |
| Under 5 Years | 0 (0.0%) | 0 (0.0%) |
| 5 to 17 Years | 0 (0.0%) | 0 (0.0%) |
| 18 to 34 Years | 0 (0.0%) | 79 (9.4%) |
| 35 to 64 Years | 117 (7.4%) | 0 (0.0%) |
| 65 to 74 Years | 0 (0.0%) | 1 (0.3%) |
| 75 Years and over | 0 (0.0%) | 27 (7.7%) |
Disability Class: Cognitive Difficulty
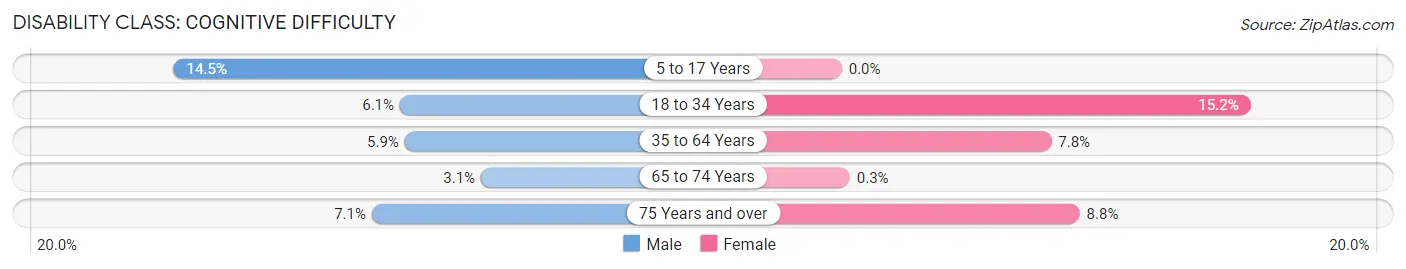
| Age Bracket | Male | Female |
| 5 to 17 Years | 156 (14.5%) | 0 (0.0%) |
| 18 to 34 Years | 78 (6.1%) | 128 (15.2%) |
| 35 to 64 Years | 93 (5.9%) | 117 (7.8%) |
| 65 to 74 Years | 10 (3.1%) | 1 (0.3%) |
| 75 Years and over | 17 (7.1%) | 31 (8.8%) |
Disability Class: Ambulatory Difficulty
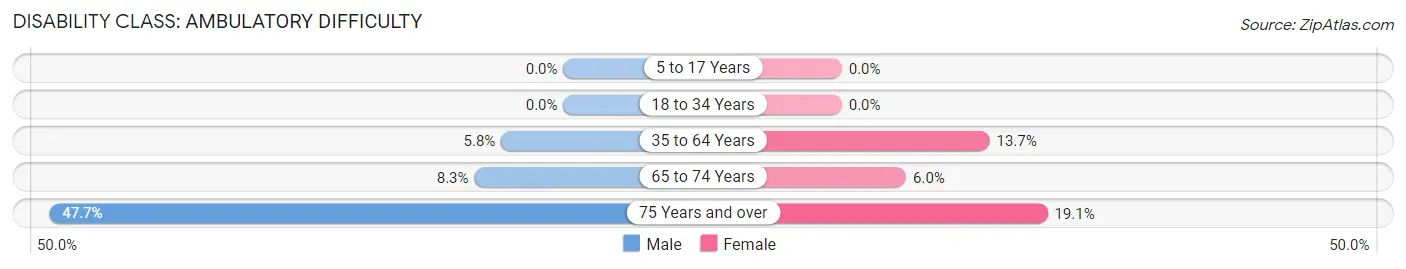
| Age Bracket | Male | Female |
| 5 to 17 Years | 0 (0.0%) | 0 (0.0%) |
| 18 to 34 Years | 0 (0.0%) | 0 (0.0%) |
| 35 to 64 Years | 91 (5.8%) | 206 (13.7%) |
| 65 to 74 Years | 27 (8.3%) | 20 (6.0%) |
| 75 Years and over | 114 (47.7%) | 67 (19.1%) |
Disability Class: Self-Care Difficulty
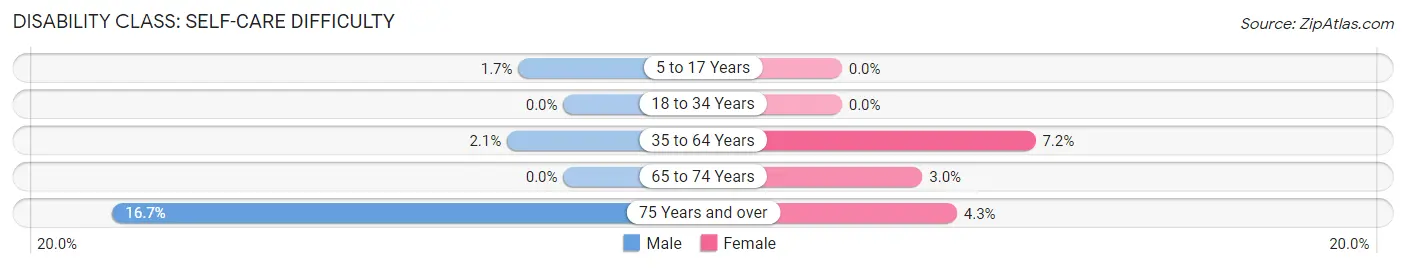
| Age Bracket | Male | Female |
| 5 to 17 Years | 18 (1.7%) | 0 (0.0%) |
| 18 to 34 Years | 0 (0.0%) | 0 (0.0%) |
| 35 to 64 Years | 33 (2.1%) | 108 (7.2%) |
| 65 to 74 Years | 0 (0.0%) | 10 (3.0%) |
| 75 Years and over | 40 (16.7%) | 15 (4.3%) |
Technology Access in Altoona
Computing Device Access in Altoona
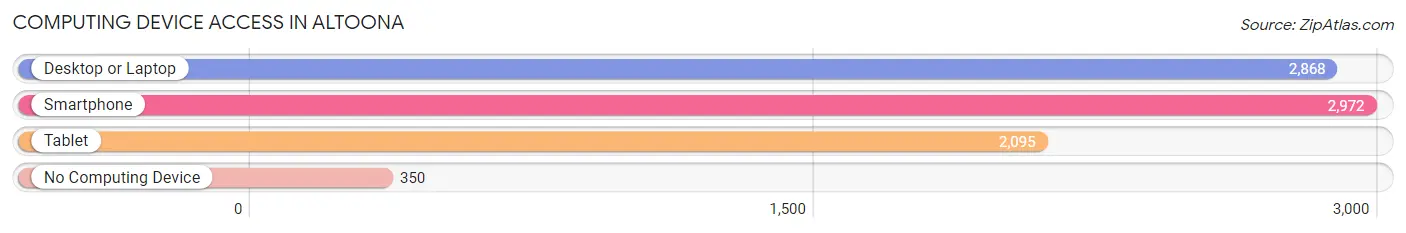
| Device Type | # Households | % Households |
| Desktop or Laptop | 2,868 | 80.9% |
| Smartphone | 2,972 | 83.9% |
| Tablet | 2,095 | 59.1% |
| No Computing Device | 350 | 9.9% |
| Total | 3,543 | 100.0% |
Internet Access in Altoona
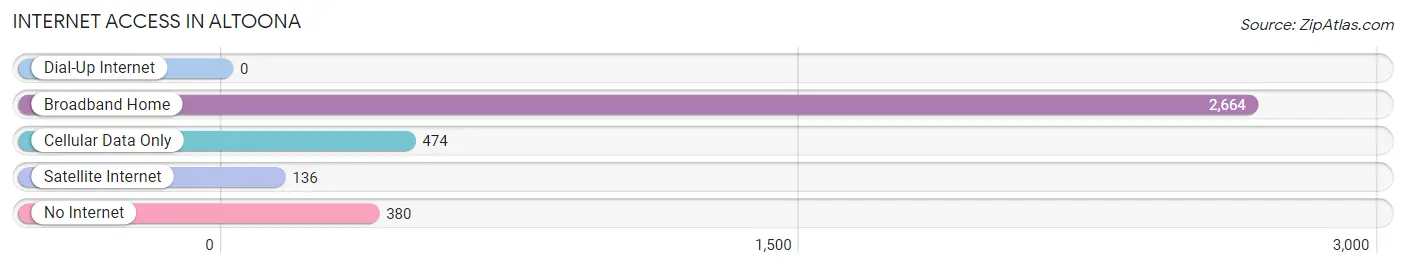
| Internet Type | # Households | % Households |
| Dial-Up Internet | 0 | 0.0% |
| Broadband Home | 2,664 | 75.2% |
| Cellular Data Only | 474 | 13.4% |
| Satellite Internet | 136 | 3.8% |
| No Internet | 380 | 10.7% |
| Total | 3,543 | 100.0% |
Altoona Summary
Altoona, Wisconsin is a small city located in Eau Claire County, in the western part of the state. It is situated on the Chippewa River, and is part of the Eau Claire metropolitan area. The city has a population of approximately 8,000 people, and is home to a variety of businesses, including manufacturing, retail, and healthcare.
History
Altoona was first settled in 1856 by a group of settlers from New York. The city was named after the Italian city of Altoona, which was the hometown of one of the settlers. The city was incorporated in 1891, and the first mayor was elected in 1892.
In the early 1900s, Altoona was a thriving lumber town, with several sawmills and lumber yards. The city was also home to a number of other businesses, including a brickyard, a creamery, and a flour mill.
In the 1950s, the city began to experience a decline in its economy, as the lumber industry began to decline. The city was also affected by the decline of the railroad industry, as the city was located on the Chicago and North Western Railway line.
In the late 1970s, the city began to experience a resurgence in its economy, as new businesses began to move into the area. The city has since become a popular destination for tourists, as it is located near several popular attractions, including the Chippewa River, Lake Altoona, and the Eau Claire County Fairgrounds.
Geography
Altoona is located in western Wisconsin, in Eau Claire County. The city is situated on the Chippewa River, and is part of the Eau Claire metropolitan area. The city has a total area of 4.2 square miles, all of which is land.
The city is located in a hilly region, with the highest point being the summit of Altoona Hill, which is located at an elevation of 1,068 feet. The city is located in a temperate climate, with hot summers and cold winters.
Economy
Altoona’s economy is largely based on manufacturing, retail, and healthcare. The city is home to several manufacturing companies, including a paper mill, a plastics manufacturer, and a metal fabrication plant. The city is also home to several retail stores, including a grocery store, a hardware store, and a variety of specialty shops.
The city is also home to several healthcare facilities, including a hospital, a nursing home, and several clinics. The city is also home to a number of educational institutions, including a community college and a technical college.
Demographics
As of the 2010 census, the population of Altoona was 8,037. The racial makeup of the city was 94.3% White, 0.7% African American, 0.3% Native American, 0.7% Asian, 0.1% Pacific Islander, 1.7% from other races, and 2.1% from two or more races. Hispanic or Latino of any race were 4.2% of the population.
The median household income in Altoona was $45,945, and the median family income was $54,945. The per capita income in the city was $21,945. About 8.3% of families and 10.7% of the population were below the poverty line, including 14.2% of those under age 18 and 6.2% of those age 65 or over.
Common Questions
What is Per Capita Income in Altoona?
Per Capita income in Altoona is $37,625.
What is the Median Family Income in Altoona?
Median Family Income in Altoona is $91,396.
What is the Median Household income in Altoona?
Median Household Income in Altoona is $77,002.
What is Income or Wage Gap in Altoona?
Income or Wage Gap in Altoona is 44.9%.
Women in Altoona earn 55.1 cents for every dollar earned by a man.
What is Family Income Deficit in Altoona?
Family Income Deficit in Altoona is $11,382.
Families that are below poverty line in Altoona earn $11,382 less on average than the poverty threshold level.
What is Inequality or Gini Index in Altoona?
Inequality or Gini Index in Altoona is 0.41.
What is the Total Population of Altoona?
Total Population of Altoona is 8,506.
What is the Total Male Population of Altoona?
Total Male Population of Altoona is 4,794.
What is the Total Female Population of Altoona?
Total Female Population of Altoona is 3,712.
What is the Ratio of Males per 100 Females in Altoona?
There are 129.15 Males per 100 Females in Altoona.
What is the Ratio of Females per 100 Males in Altoona?
There are 77.43 Females per 100 Males in Altoona.
What is the Median Population Age in Altoona?
Median Population Age in Altoona is 36.7 Years.
What is the Average Family Size in Altoona
Average Family Size in Altoona is 3.1 People.
What is the Average Household Size in Altoona
Average Household Size in Altoona is 2.4 People.
How Large is the Labor Force in Altoona?
There are 4,608 People in the Labor Forcein in Altoona.
What is the Percentage of People in the Labor Force in Altoona?
68.1% of People are in the Labor Force in Altoona.
What is the Unemployment Rate in Altoona?
Unemployment Rate in Altoona is 3.4%.