Algoma, WI Map & Demographics
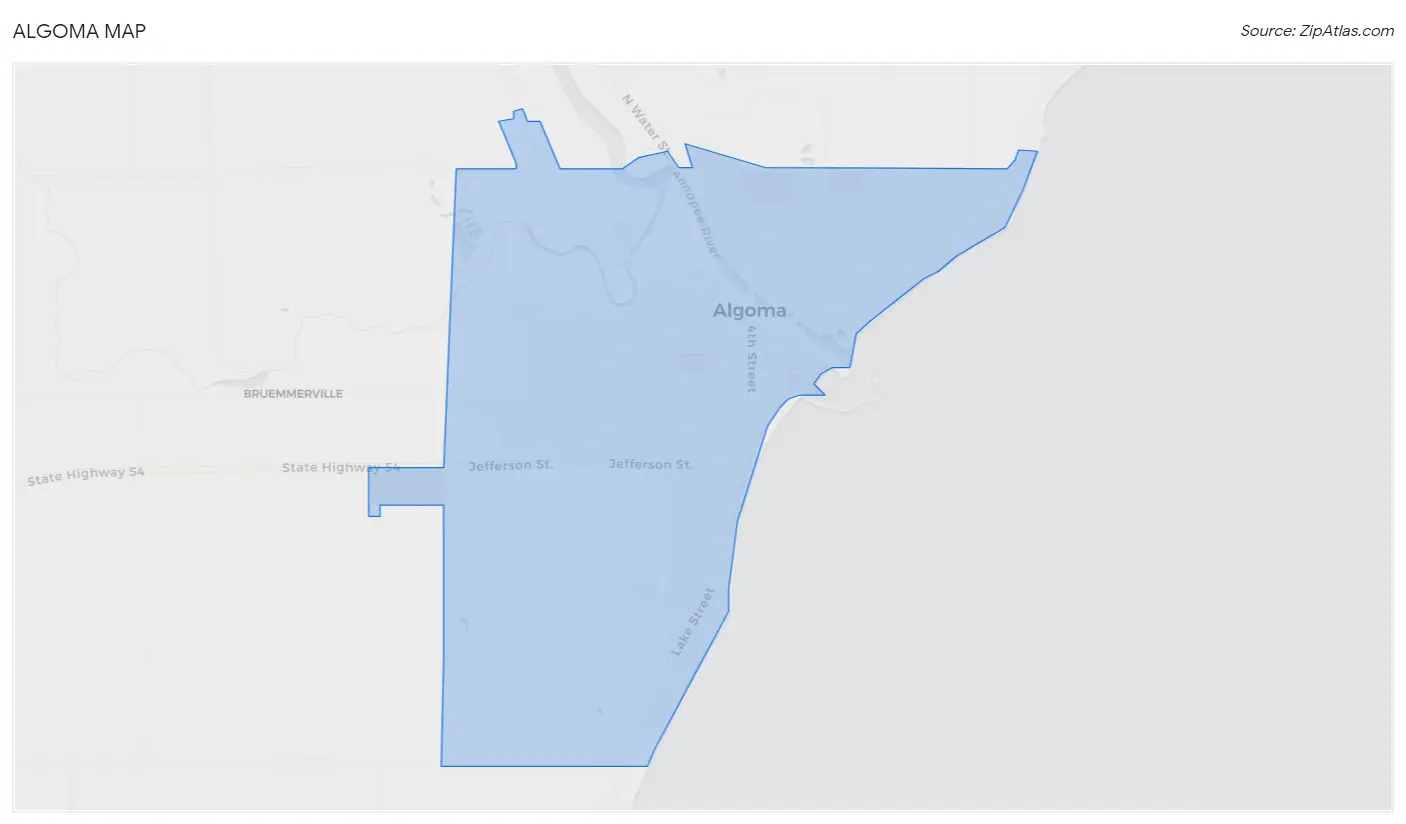
Algoma Map
Algoma Overview
$32,802
PER CAPITA INCOME
$88,840
AVG FAMILY INCOME
$72,232
AVG HOUSEHOLD INCOME
27.3%
WAGE / INCOME GAP [ % ]
72.7¢/ $1
WAGE / INCOME GAP [ $ ]
$15,828
FAMILY INCOME DEFICIT
0.37
INEQUALITY / GINI INDEX
3,227
TOTAL POPULATION
1,642
MALE POPULATION
1,585
FEMALE POPULATION
103.60
MALES / 100 FEMALES
96.53
FEMALES / 100 MALES
45.7
MEDIAN AGE
2.9
AVG FAMILY SIZE
2.4
AVG HOUSEHOLD SIZE
1,513
LABOR FORCE [ PEOPLE ]
57.3%
PERCENT IN LABOR FORCE
3.6%
UNEMPLOYMENT RATE
Algoma Zip Codes
Algoma Area Codes
Income in Algoma
Income Overview in Algoma
Per Capita Income in Algoma is $32,802, while median incomes of families and households are $88,840 and $72,232 respectively.
| Characteristic | Number | Measure |
| Per Capita Income | 3,227 | $32,802 |
| Median Family Income | 840 | $88,840 |
| Mean Family Income | 840 | $91,244 |
| Median Household Income | 1,343 | $72,232 |
| Mean Household Income | 1,343 | $77,214 |
| Income Deficit | 840 | $15,828 |
| Wage / Income Gap (%) | 3,227 | 27.28% |
| Wage / Income Gap ($) | 3,227 | 72.72¢ per $1 |
| Gini / Inequality Index | 3,227 | 0.37 |
Earnings by Sex in Algoma
Average Earnings in Algoma are $42,436, $46,563 for men and $33,859 for women, a difference of 27.3%.
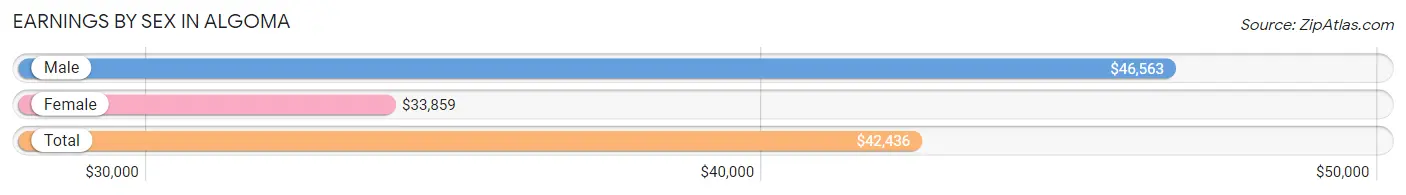
| Sex | Number | Average Earnings |
| Male | 862 (52.5%) | $46,563 |
| Female | 781 (47.5%) | $33,859 |
| Total | 1,643 (100.0%) | $42,436 |
Earnings by Sex by Income Bracket in Algoma
The most common earnings brackets in Algoma are $45,000 to $49,999 for men (102 | 11.8%) and $40,000 to $44,999 for women (106 | 13.6%).
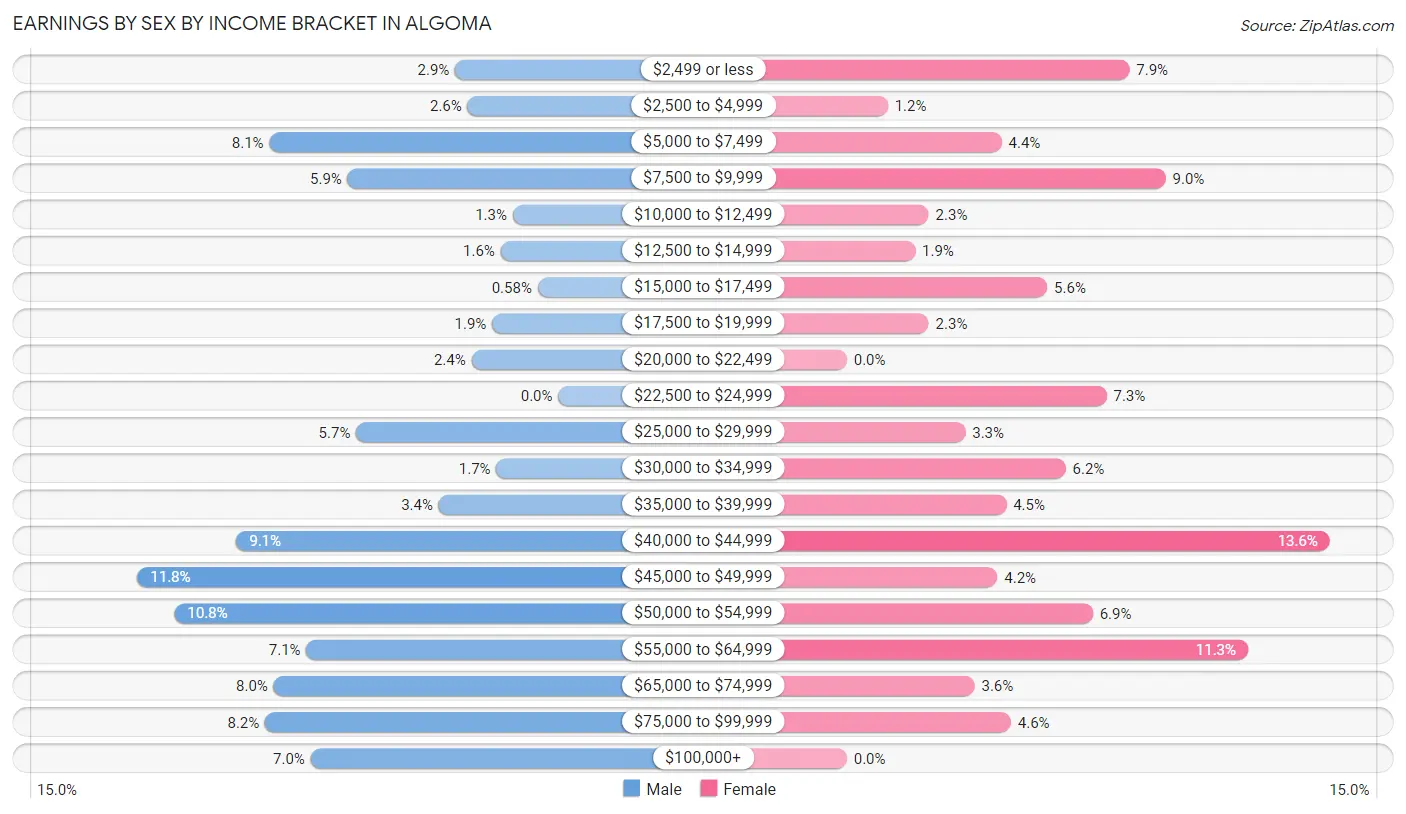
| Income | Male | Female |
| $2,499 or less | 25 (2.9%) | 62 (7.9%) |
| $2,500 to $4,999 | 22 (2.5%) | 9 (1.1%) |
| $5,000 to $7,499 | 70 (8.1%) | 34 (4.3%) |
| $7,500 to $9,999 | 51 (5.9%) | 70 (9.0%) |
| $10,000 to $12,499 | 11 (1.3%) | 18 (2.3%) |
| $12,500 to $14,999 | 14 (1.6%) | 15 (1.9%) |
| $15,000 to $17,499 | 5 (0.6%) | 44 (5.6%) |
| $17,500 to $19,999 | 16 (1.9%) | 18 (2.3%) |
| $20,000 to $22,499 | 21 (2.4%) | 0 (0.0%) |
| $22,500 to $24,999 | 0 (0.0%) | 57 (7.3%) |
| $25,000 to $29,999 | 49 (5.7%) | 26 (3.3%) |
| $30,000 to $34,999 | 15 (1.7%) | 48 (6.1%) |
| $35,000 to $39,999 | 29 (3.4%) | 35 (4.5%) |
| $40,000 to $44,999 | 78 (9.0%) | 106 (13.6%) |
| $45,000 to $49,999 | 102 (11.8%) | 33 (4.2%) |
| $50,000 to $54,999 | 93 (10.8%) | 54 (6.9%) |
| $55,000 to $64,999 | 61 (7.1%) | 88 (11.3%) |
| $65,000 to $74,999 | 69 (8.0%) | 28 (3.6%) |
| $75,000 to $99,999 | 71 (8.2%) | 36 (4.6%) |
| $100,000+ | 60 (7.0%) | 0 (0.0%) |
| Total | 862 (100.0%) | 781 (100.0%) |
Earnings by Sex by Educational Attainment in Algoma
Average earnings in Algoma are $49,977 for men and $39,931 for women, a difference of 20.1%. Men with an educational attainment of college or associate's degree enjoy the highest average annual earnings of $52,697, while those with less than high school education earn the least with $37,500. Women with an educational attainment of bachelor's degree earn the most with the average annual earnings of $48,214, while those with high school diploma education have the smallest earnings of $40,859.
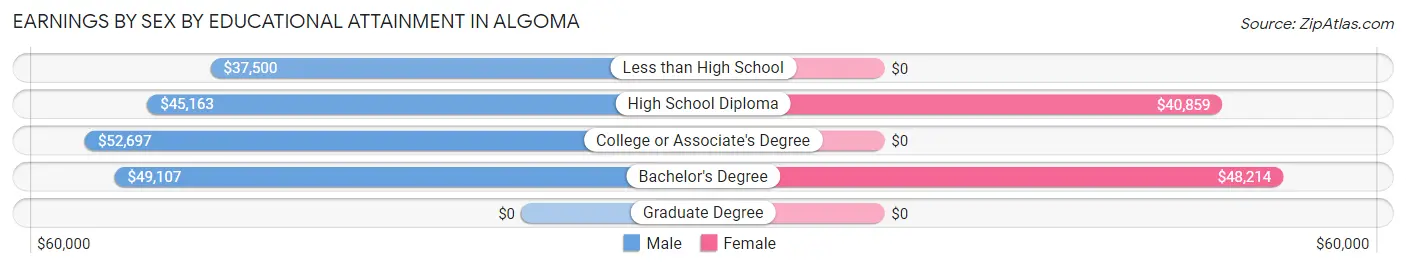
| Educational Attainment | Male Income | Female Income |
| Less than High School | $37,500 | $0 |
| High School Diploma | $45,163 | $40,859 |
| College or Associate's Degree | $52,697 | $0 |
| Bachelor's Degree | $49,107 | $48,214 |
| Graduate Degree | - | - |
| Total | $49,977 | $39,931 |
Family Income in Algoma
Family Income Brackets in Algoma
According to the Algoma family income data, there are 256 families falling into the $100,000 to $149,999 income range, which is the most common income bracket and makes up 30.5% of all families.
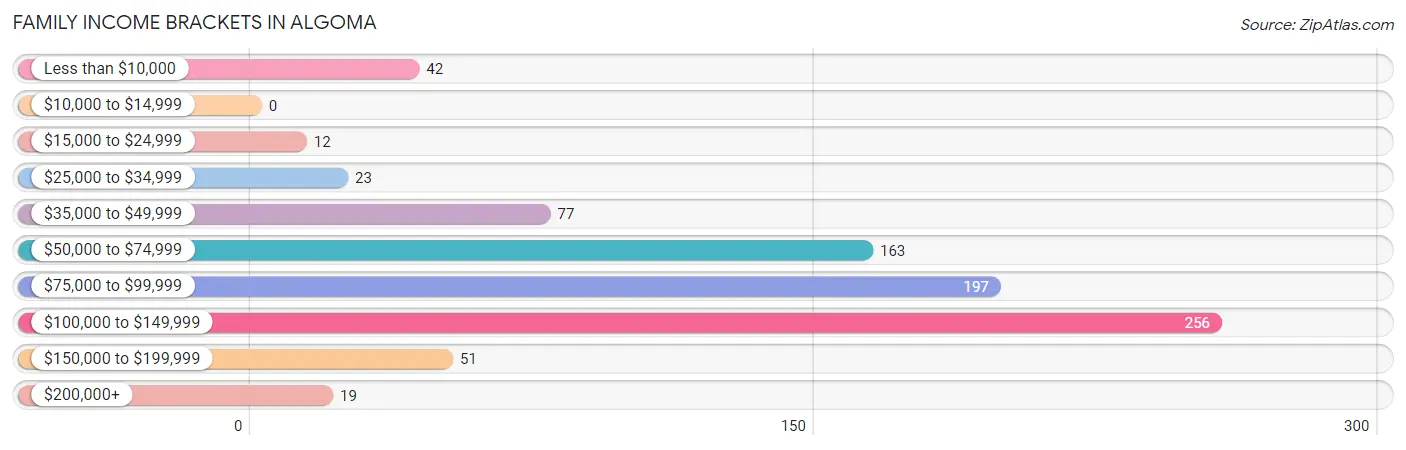
| Income Bracket | # Families | % Families |
| Less than $10,000 | 42 | 5.0% |
| $10,000 to $14,999 | 0 | 0.0% |
| $15,000 to $24,999 | 12 | 1.4% |
| $25,000 to $34,999 | 23 | 2.7% |
| $35,000 to $49,999 | 77 | 9.2% |
| $50,000 to $74,999 | 163 | 19.4% |
| $75,000 to $99,999 | 197 | 23.5% |
| $100,000 to $149,999 | 256 | 30.5% |
| $150,000 to $199,999 | 51 | 6.1% |
| $200,000+ | 19 | 2.3% |
Family Income by Famaliy Size in Algoma
5-person families (84 | 10.0%) account for the highest median family income in Algoma with $135,489 per family, while 2-person families (439 | 52.3%) have the highest median income of $39,943 per family member.
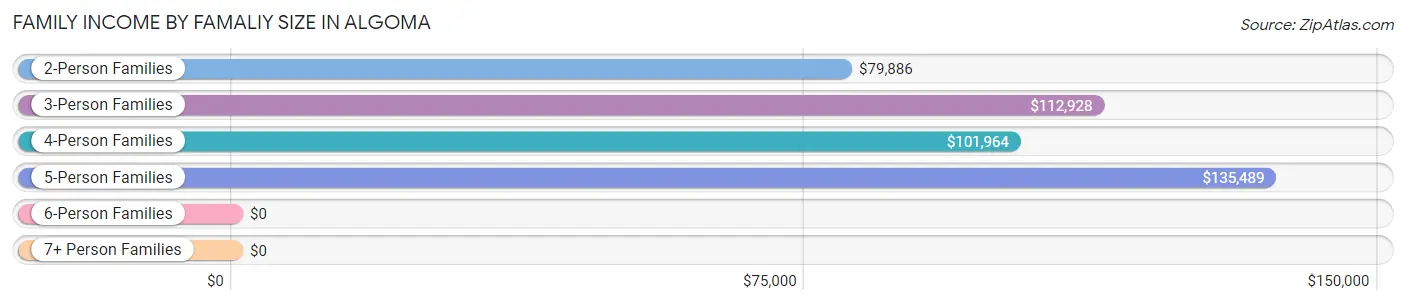
| Income Bracket | # Families | Median Income |
| 2-Person Families | 439 (52.3%) | $79,886 |
| 3-Person Families | 205 (24.4%) | $112,928 |
| 4-Person Families | 89 (10.6%) | $101,964 |
| 5-Person Families | 84 (10.0%) | $135,489 |
| 6-Person Families | 9 (1.1%) | $0 |
| 7+ Person Families | 14 (1.7%) | $0 |
| Total | 840 (100.0%) | $88,840 |
Family Income by Number of Earners in Algoma
The median family income in Algoma is $88,840, with families comprising 3+ earners (83) having the highest median family income of $136,929, while families with no earners (110) have the lowest median family income of $37,292, accounting for 9.9% and 13.1% of families, respectively.
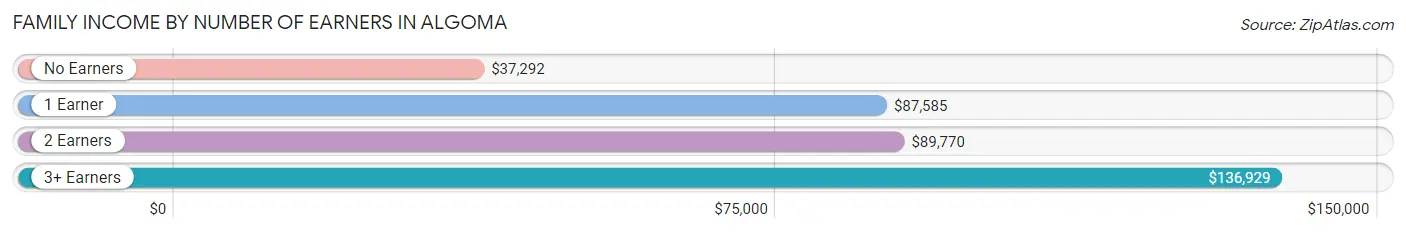
| Number of Earners | # Families | Median Income |
| No Earners | 110 (13.1%) | $37,292 |
| 1 Earner | 286 (34.1%) | $87,585 |
| 2 Earners | 361 (43.0%) | $89,770 |
| 3+ Earners | 83 (9.9%) | $136,929 |
| Total | 840 (100.0%) | $88,840 |
Household Income in Algoma
Household Income Brackets in Algoma
With 295 households falling in the category, the $100,000 to $149,999 income range is the most frequent in Algoma, accounting for 22.0% of all households. In contrast, only 30 households (2.2%) fall into the $200,000+ income bracket, making it the least populous group.
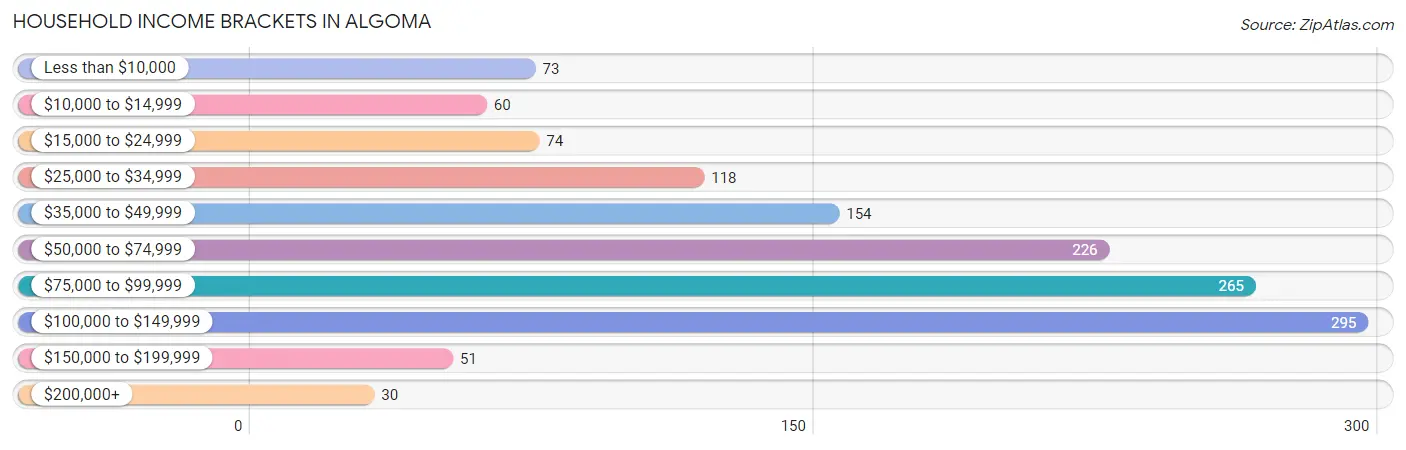
| Income Bracket | # Households | % Households |
| Less than $10,000 | 73 | 5.4% |
| $10,000 to $14,999 | 60 | 4.5% |
| $15,000 to $24,999 | 74 | 5.5% |
| $25,000 to $34,999 | 118 | 8.8% |
| $35,000 to $49,999 | 154 | 11.5% |
| $50,000 to $74,999 | 226 | 16.8% |
| $75,000 to $99,999 | 265 | 19.7% |
| $100,000 to $149,999 | 295 | 22.0% |
| $150,000 to $199,999 | 51 | 3.8% |
| $200,000+ | 30 | 2.2% |
Household Income by Householder Age in Algoma
The median household income in Algoma is $72,232, with the highest median household income of $92,981 found in the 25 to 44 years age bracket for the primary householder. A total of 301 households (22.4%) fall into this category. Meanwhile, the 15 to 24 years age bracket for the primary householder has the lowest median household income of $48,558, with 41 households (3.0%) in this group.
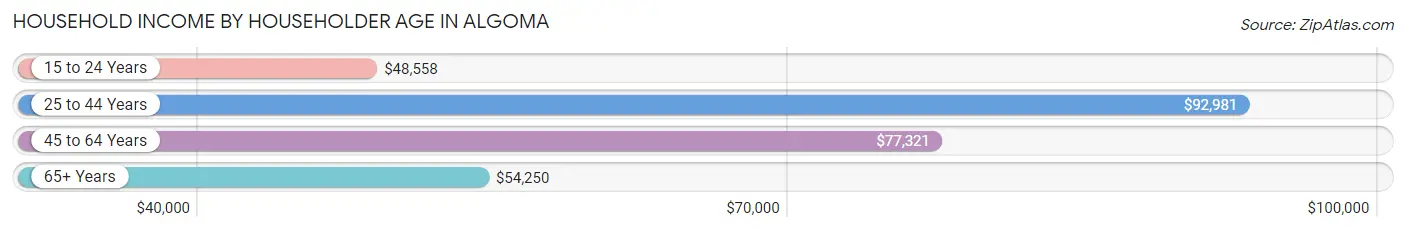
| Income Bracket | # Households | Median Income |
| 15 to 24 Years | 41 (3.0%) | $48,558 |
| 25 to 44 Years | 301 (22.4%) | $92,981 |
| 45 to 64 Years | 453 (33.7%) | $77,321 |
| 65+ Years | 548 (40.8%) | $54,250 |
| Total | 1,343 (100.0%) | $72,232 |
Poverty in Algoma
Income Below Poverty by Sex and Age in Algoma
With 10.3% poverty level for males and 17.6% for females among the residents of Algoma, 5 year old males and 25 to 34 year old females are the most vulnerable to poverty, with 6 males (42.9%) and 57 females (32.6%) in their respective age groups living below the poverty level.
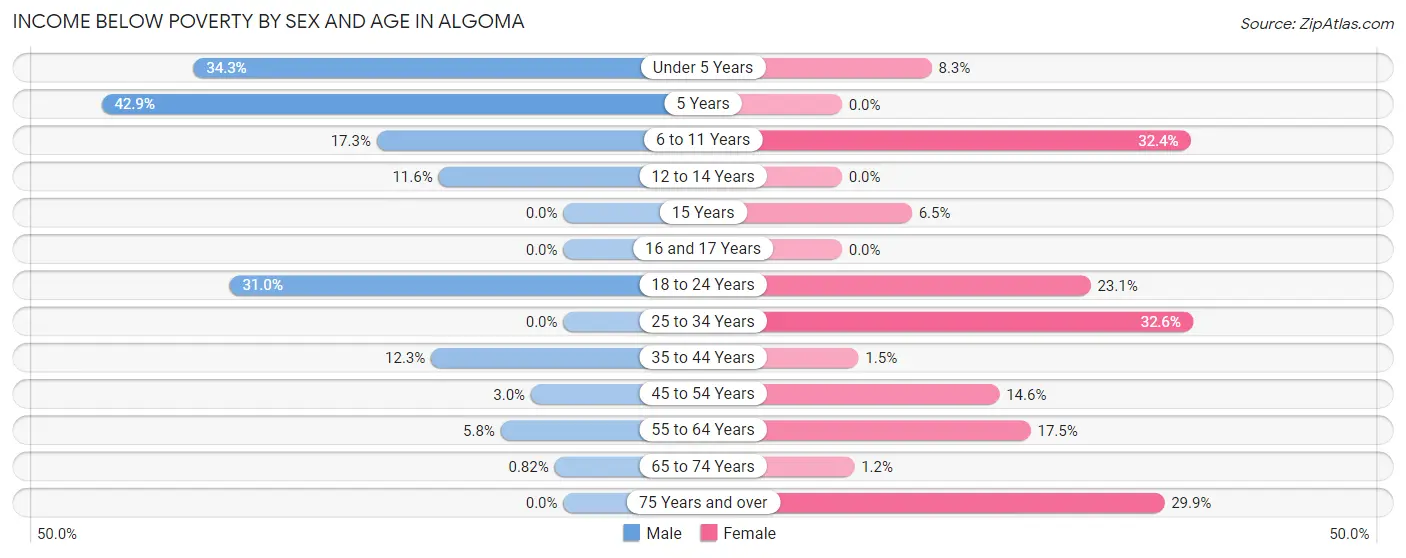
| Age Bracket | Male | Female |
| Under 5 Years | 23 (34.3%) | 6 (8.3%) |
| 5 Years | 6 (42.9%) | 0 (0.0%) |
| 6 to 11 Years | 22 (17.3%) | 33 (32.4%) |
| 12 to 14 Years | 8 (11.6%) | 0 (0.0%) |
| 15 Years | 0 (0.0%) | 5 (6.5%) |
| 16 and 17 Years | 0 (0.0%) | 0 (0.0%) |
| 18 to 24 Years | 57 (31.0%) | 24 (23.1%) |
| 25 to 34 Years | 0 (0.0%) | 57 (32.6%) |
| 35 to 44 Years | 27 (12.3%) | 2 (1.5%) |
| 45 to 54 Years | 4 (3.0%) | 32 (14.6%) |
| 55 to 64 Years | 16 (5.8%) | 41 (17.5%) |
| 65 to 74 Years | 2 (0.8%) | 2 (1.1%) |
| 75 Years and over | 0 (0.0%) | 73 (29.9%) |
| Total | 165 (10.3%) | 275 (17.6%) |
Income Above Poverty by Sex and Age in Algoma
According to the poverty statistics in Algoma, males aged 16 and 17 years and females aged 5 years are the age groups that are most secure financially, with 100.0% of males and 100.0% of females in these age groups living above the poverty line.
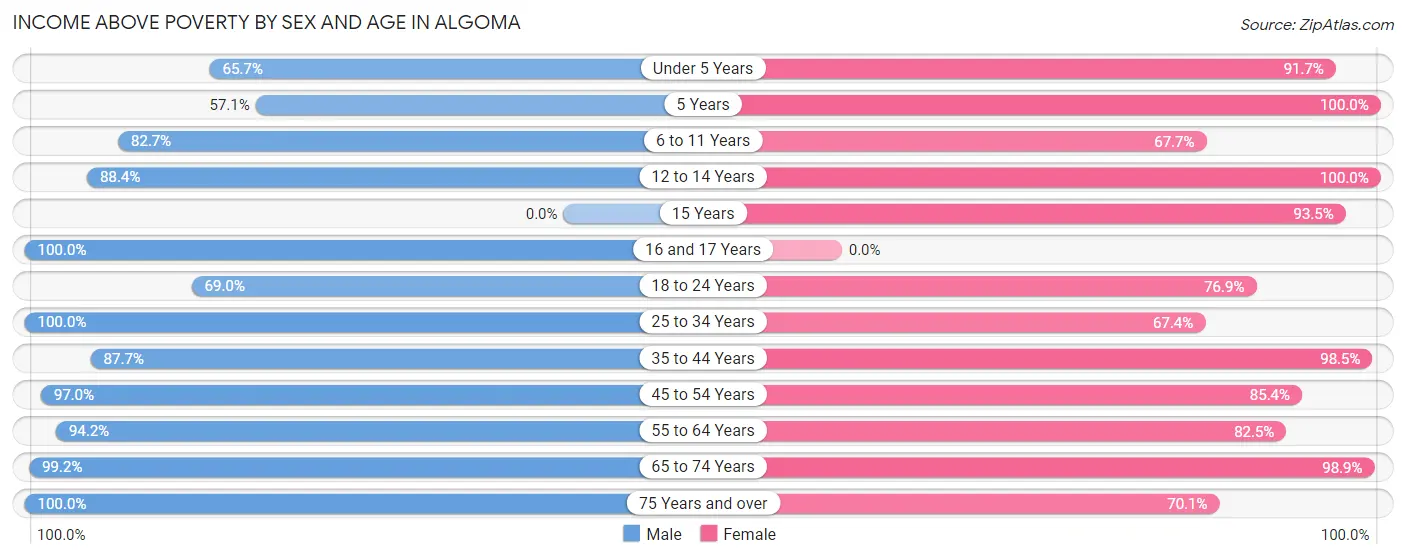
| Age Bracket | Male | Female |
| Under 5 Years | 44 (65.7%) | 66 (91.7%) |
| 5 Years | 8 (57.1%) | 28 (100.0%) |
| 6 to 11 Years | 105 (82.7%) | 69 (67.6%) |
| 12 to 14 Years | 61 (88.4%) | 6 (100.0%) |
| 15 Years | 0 (0.0%) | 72 (93.5%) |
| 16 and 17 Years | 63 (100.0%) | 0 (0.0%) |
| 18 to 24 Years | 127 (69.0%) | 80 (76.9%) |
| 25 to 34 Years | 119 (100.0%) | 118 (67.4%) |
| 35 to 44 Years | 193 (87.7%) | 128 (98.5%) |
| 45 to 54 Years | 129 (97.0%) | 187 (85.4%) |
| 55 to 64 Years | 259 (94.2%) | 193 (82.5%) |
| 65 to 74 Years | 241 (99.2%) | 172 (98.9%) |
| 75 Years and over | 84 (100.0%) | 171 (70.1%) |
| Total | 1,433 (89.7%) | 1,290 (82.4%) |
Income Below Poverty Among Married-Couple Families in Algoma
The poverty statistics for married-couple families in Algoma show that 2.6% or 19 of the total 742 families live below the poverty line. Families with 1 or 2 children have the highest poverty rate of 5.8%, comprising of 10 families. On the other hand, families with 3 or 4 children have the lowest poverty rate of 0.0%, which includes 0 families.
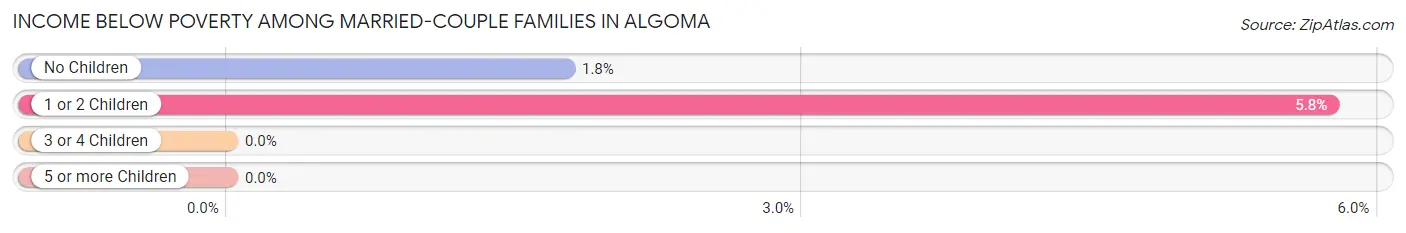
| Children | Above Poverty | Below Poverty |
| No Children | 503 (98.2%) | 9 (1.8%) |
| 1 or 2 Children | 164 (94.3%) | 10 (5.8%) |
| 3 or 4 Children | 42 (100.0%) | 0 (0.0%) |
| 5 or more Children | 14 (100.0%) | 0 (0.0%) |
| Total | 723 (97.4%) | 19 (2.6%) |
Income Below Poverty Among Single-Parent Households in Algoma
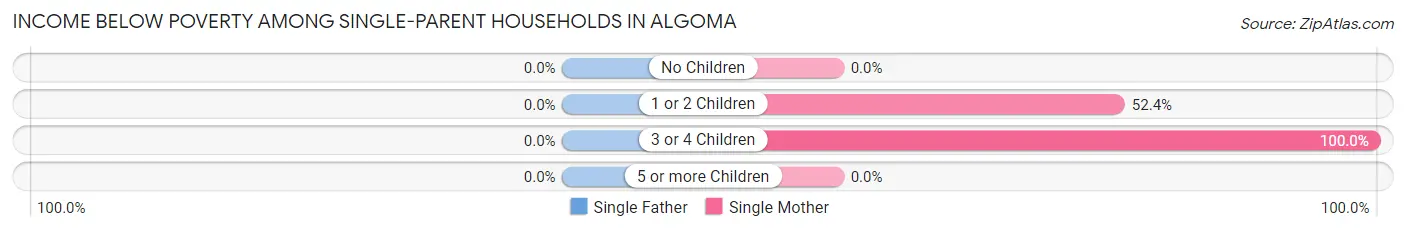
| Children | Single Father | Single Mother |
| No Children | 0 (0.0%) | 0 (0.0%) |
| 1 or 2 Children | 0 (0.0%) | 22 (52.4%) |
| 3 or 4 Children | 0 (0.0%) | 13 (100.0%) |
| 5 or more Children | 0 (0.0%) | 0 (0.0%) |
| Total | 0 (0.0%) | 35 (63.6%) |
Income Below Poverty Among Married-Couple vs Single-Parent Households in Algoma
The poverty data for Algoma shows that 19 of the married-couple family households (2.6%) and 35 of the single-parent households (35.7%) are living below the poverty level. Within the married-couple family households, those with 1 or 2 children have the highest poverty rate, with 10 households (5.8%) falling below the poverty line. Among the single-parent households, those with 3 or 4 children have the highest poverty rate, with 13 household (100.0%) living below poverty.
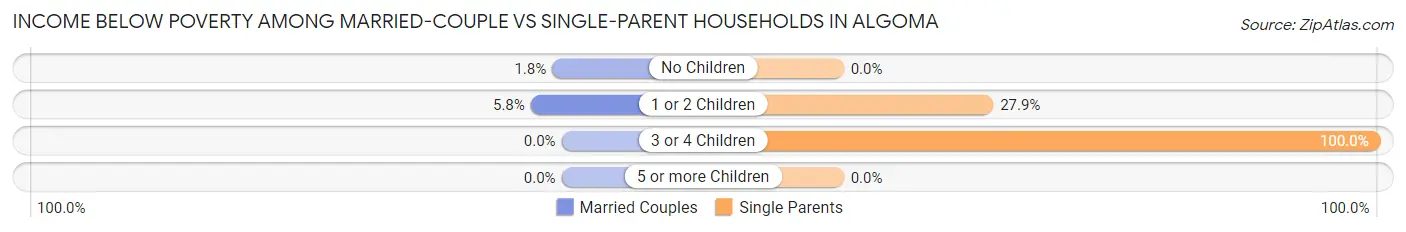
| Children | Married-Couple Families | Single-Parent Households |
| No Children | 9 (1.8%) | 0 (0.0%) |
| 1 or 2 Children | 10 (5.8%) | 22 (27.9%) |
| 3 or 4 Children | 0 (0.0%) | 13 (100.0%) |
| 5 or more Children | 0 (0.0%) | 0 (0.0%) |
| Total | 19 (2.6%) | 35 (35.7%) |
Race in Algoma
The most populous races in Algoma are White / Caucasian (2,937 | 91.0%), Hispanic or Latino (100 | 3.1%), and Some other Race (93 | 2.9%).
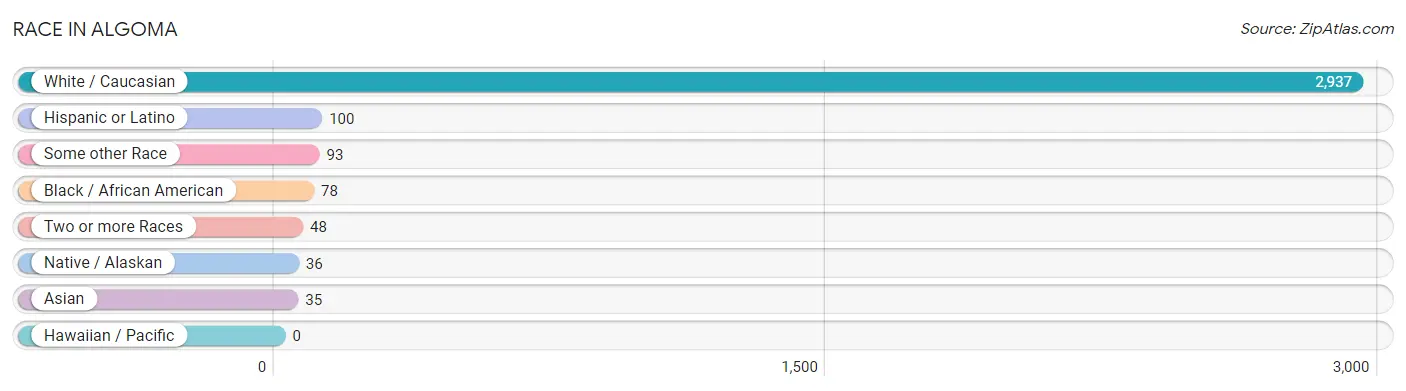
| Race | # Population | % Population |
| Asian | 35 | 1.1% |
| Black / African American | 78 | 2.4% |
| Hawaiian / Pacific | 0 | 0.0% |
| Hispanic or Latino | 100 | 3.1% |
| Native / Alaskan | 36 | 1.1% |
| White / Caucasian | 2,937 | 91.0% |
| Two or more Races | 48 | 1.5% |
| Some other Race | 93 | 2.9% |
| Total | 3,227 | 100.0% |
Ancestry in Algoma
The most populous ancestries reported in Algoma are German (1,473 | 45.7%), Belgian (439 | 13.6%), Irish (388 | 12.0%), American (329 | 10.2%), and Polish (170 | 5.3%), together accounting for 86.7% of all Algoma residents.
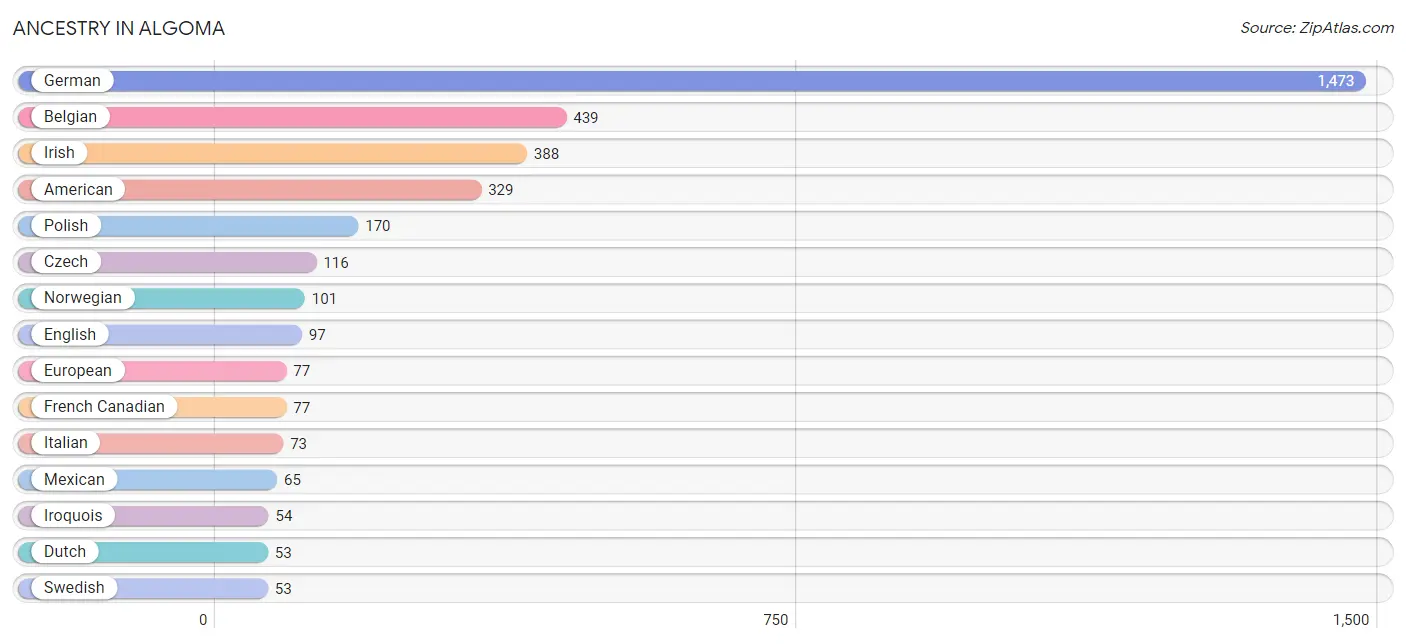
| Ancestry | # Population | % Population |
| American | 329 | 10.2% |
| Belgian | 439 | 13.6% |
| British | 9 | 0.3% |
| Cherokee | 23 | 0.7% |
| Czech | 116 | 3.6% |
| Danish | 8 | 0.3% |
| Dutch | 53 | 1.6% |
| English | 97 | 3.0% |
| European | 77 | 2.4% |
| Finnish | 14 | 0.4% |
| French | 22 | 0.7% |
| French Canadian | 77 | 2.4% |
| German | 1,473 | 45.7% |
| Irish | 388 | 12.0% |
| Iroquois | 54 | 1.7% |
| Italian | 73 | 2.3% |
| Korean | 35 | 1.1% |
| Latvian | 31 | 1.0% |
| Lithuanian | 31 | 1.0% |
| Mexican | 65 | 2.0% |
| Northern European | 20 | 0.6% |
| Norwegian | 101 | 3.1% |
| Polish | 170 | 5.3% |
| Puerto Rican | 35 | 1.1% |
| Russian | 7 | 0.2% |
| Scandinavian | 13 | 0.4% |
| Scotch-Irish | 43 | 1.3% |
| Scottish | 46 | 1.4% |
| Swedish | 53 | 1.6% |
| Swiss | 18 | 0.6% |
| Ukrainian | 4 | 0.1% |
| Welsh | 9 | 0.3% | View All 32 Rows |
Immigrants in Algoma
The most numerous immigrant groups reported in Algoma came from Central America (31 | 1.0%), Latin America (31 | 1.0%), and Mexico (31 | 1.0%), together accounting for 2.9% of all Algoma residents.
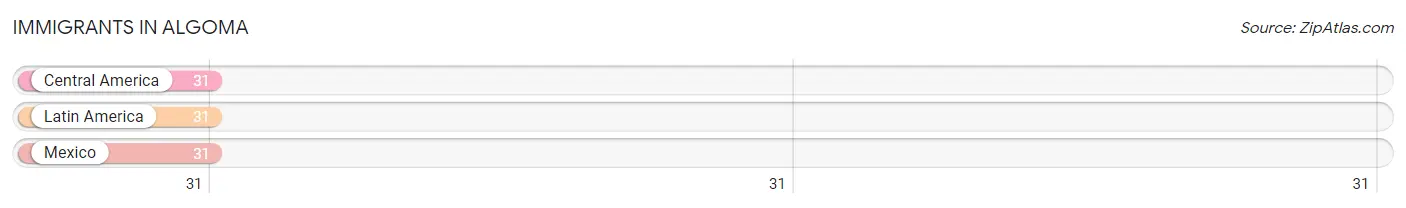
| Immigration Origin | # Population | % Population |
| Central America | 31 | 1.0% |
| Latin America | 31 | 1.0% |
| Mexico | 31 | 1.0% | View All 3 Rows |
Sex and Age in Algoma
Sex and Age in Algoma
The most populous age groups in Algoma are 55 to 59 Years (175 | 10.7%) for men and 60 to 64 Years (125 | 7.9%) for women.
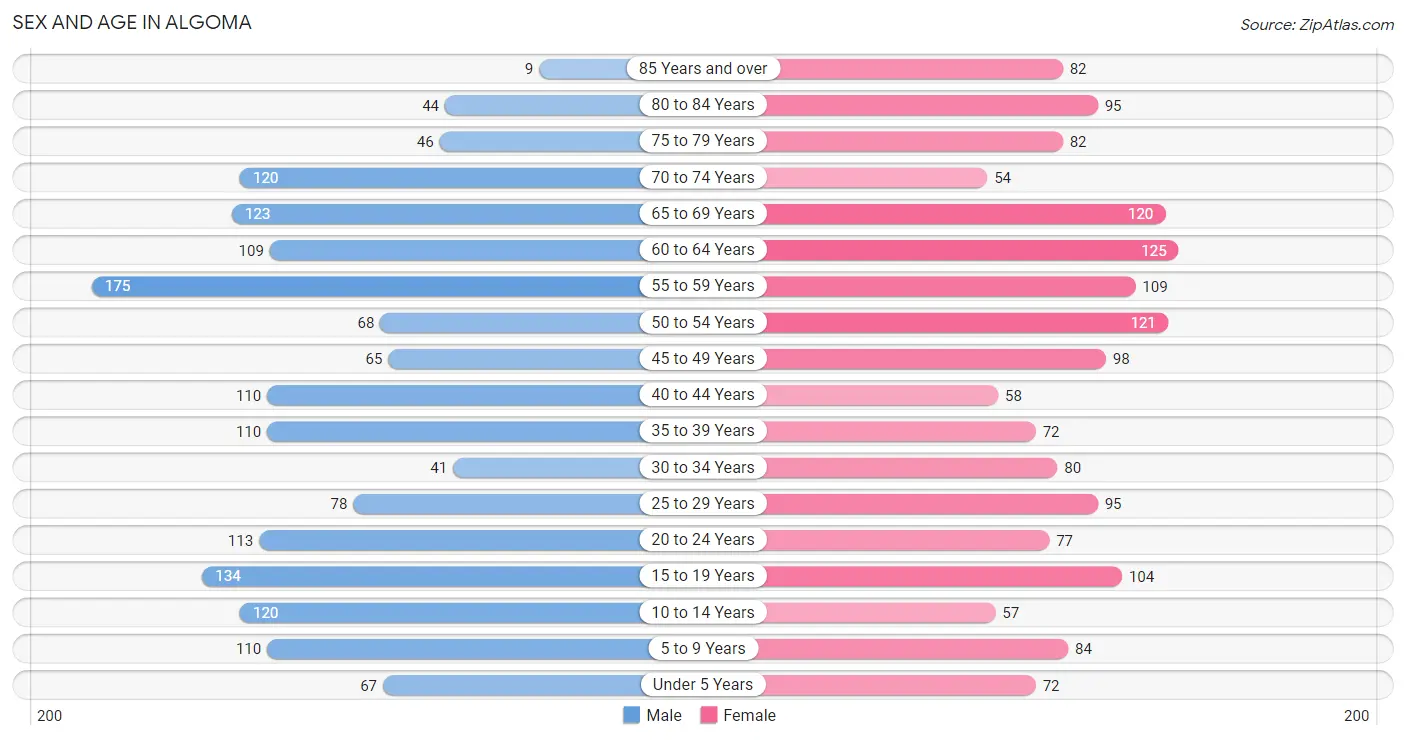
| Age Bracket | Male | Female |
| Under 5 Years | 67 (4.1%) | 72 (4.5%) |
| 5 to 9 Years | 110 (6.7%) | 84 (5.3%) |
| 10 to 14 Years | 120 (7.3%) | 57 (3.6%) |
| 15 to 19 Years | 134 (8.2%) | 104 (6.6%) |
| 20 to 24 Years | 113 (6.9%) | 77 (4.9%) |
| 25 to 29 Years | 78 (4.8%) | 95 (6.0%) |
| 30 to 34 Years | 41 (2.5%) | 80 (5.1%) |
| 35 to 39 Years | 110 (6.7%) | 72 (4.5%) |
| 40 to 44 Years | 110 (6.7%) | 58 (3.7%) |
| 45 to 49 Years | 65 (4.0%) | 98 (6.2%) |
| 50 to 54 Years | 68 (4.1%) | 121 (7.6%) |
| 55 to 59 Years | 175 (10.7%) | 109 (6.9%) |
| 60 to 64 Years | 109 (6.6%) | 125 (7.9%) |
| 65 to 69 Years | 123 (7.5%) | 120 (7.6%) |
| 70 to 74 Years | 120 (7.3%) | 54 (3.4%) |
| 75 to 79 Years | 46 (2.8%) | 82 (5.2%) |
| 80 to 84 Years | 44 (2.7%) | 95 (6.0%) |
| 85 Years and over | 9 (0.5%) | 82 (5.2%) |
| Total | 1,642 (100.0%) | 1,585 (100.0%) |
Families and Households in Algoma
Median Family Size in Algoma
The median family size in Algoma is 2.90 persons per family, with single female/mother families (55 | 6.6%) accounting for the largest median family size of 3.15 persons per family. On the other hand, single male/father families (43 | 5.1%) represent the smallest median family size with 2.56 persons per family.
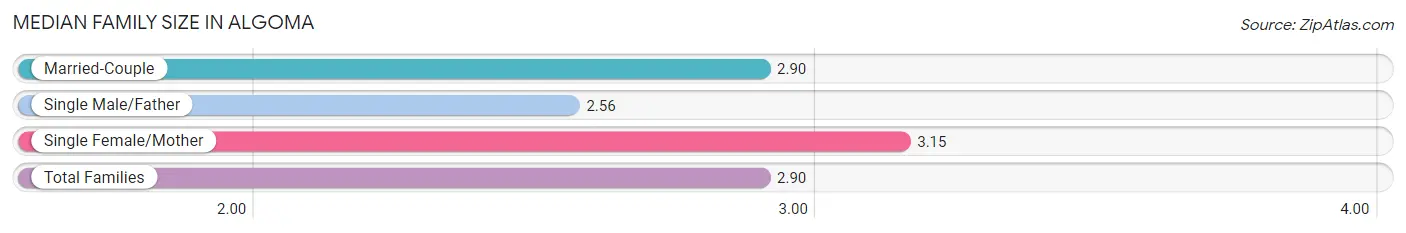
| Family Type | # Families | Family Size |
| Married-Couple | 742 (88.3%) | 2.90 |
| Single Male/Father | 43 (5.1%) | 2.56 |
| Single Female/Mother | 55 (6.6%) | 3.15 |
| Total Families | 840 (100.0%) | 2.90 |
Median Household Size in Algoma
The median household size in Algoma is 2.37 persons per household, with single female/mother households (55 | 4.1%) accounting for the largest median household size of 3.55 persons per household. non-family households (503 | 37.4%) represent the smallest median household size with 1.24 persons per household.
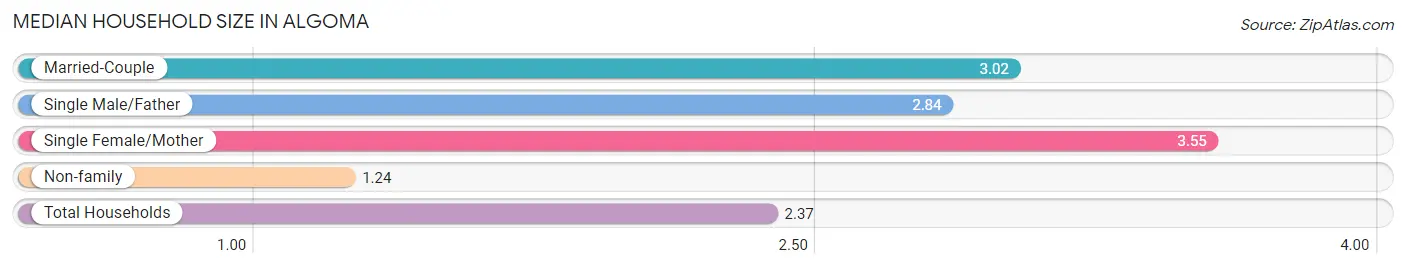
| Household Type | # Households | Household Size |
| Married-Couple | 742 (55.2%) | 3.02 |
| Single Male/Father | 43 (3.2%) | 2.84 |
| Single Female/Mother | 55 (4.1%) | 3.55 |
| Non-family | 503 (37.4%) | 1.24 |
| Total Households | 1,343 (100.0%) | 2.37 |
Household Size by Marriage Status in Algoma
Out of a total of 1,343 households in Algoma, 840 (62.5%) are family households, while 503 (37.4%) are nonfamily households. The most numerous type of family households are 2-person households, comprising 411, and the most common type of nonfamily households are 1-person households, comprising 442.
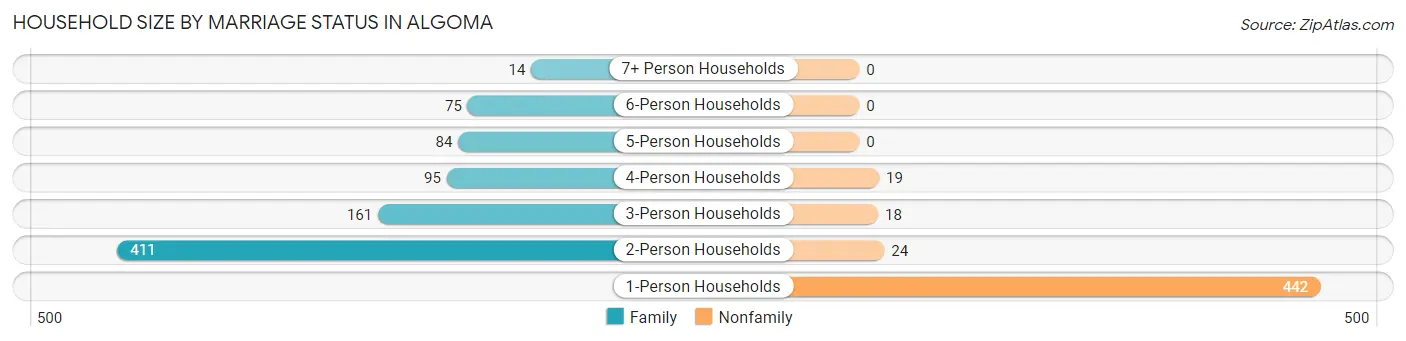
| Household Size | Family Households | Nonfamily Households |
| 1-Person Households | - | 442 (32.9%) |
| 2-Person Households | 411 (30.6%) | 24 (1.8%) |
| 3-Person Households | 161 (12.0%) | 18 (1.3%) |
| 4-Person Households | 95 (7.1%) | 19 (1.4%) |
| 5-Person Households | 84 (6.2%) | 0 (0.0%) |
| 6-Person Households | 75 (5.6%) | 0 (0.0%) |
| 7+ Person Households | 14 (1.0%) | 0 (0.0%) |
| Total | 840 (62.5%) | 503 (37.4%) |
Female Fertility in Algoma
Fertility by Age in Algoma
Average fertility rate in Algoma is 55.0 births per 1,000 women. Women in the age bracket of 20 to 34 years have the highest fertility rate with 87.0 births per 1,000 women. Women in the age bracket of 20 to 34 years acount for 68.8% of all women with births.
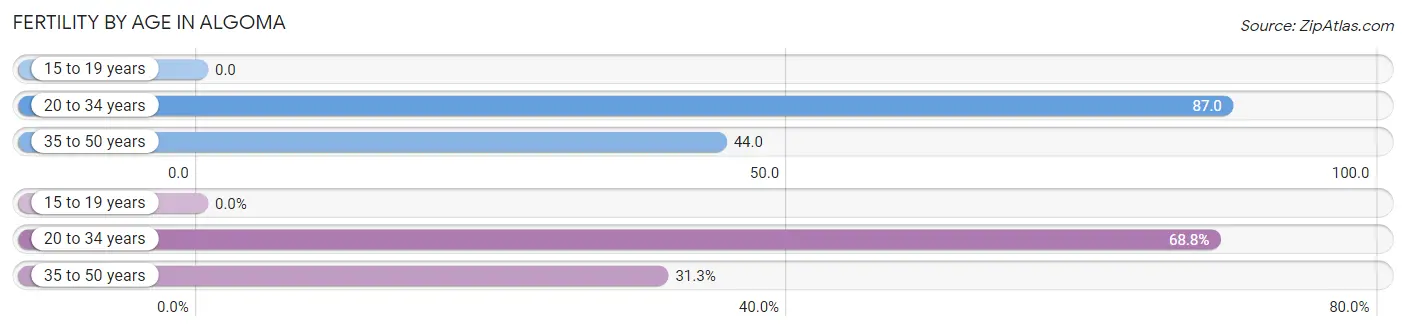
| Age Bracket | Women with Births | Births / 1,000 Women |
| 15 to 19 years | 0 (0.0%) | 0.0 |
| 20 to 34 years | 22 (68.8%) | 87.0 |
| 35 to 50 years | 10 (31.2%) | 44.0 |
| Total | 32 (100.0%) | 55.0 |
Fertility by Age by Marriage Status in Algoma
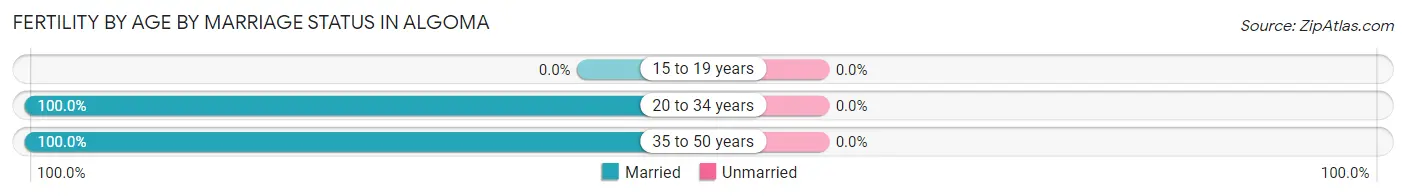
| Age Bracket | Married | Unmarried |
| 15 to 19 years | 0 (0.0%) | 0 (0.0%) |
| 20 to 34 years | 22 (100.0%) | 0 (0.0%) |
| 35 to 50 years | 10 (100.0%) | 0 (0.0%) |
| Total | 32 (100.0%) | 0 (0.0%) |
Fertility by Education in Algoma
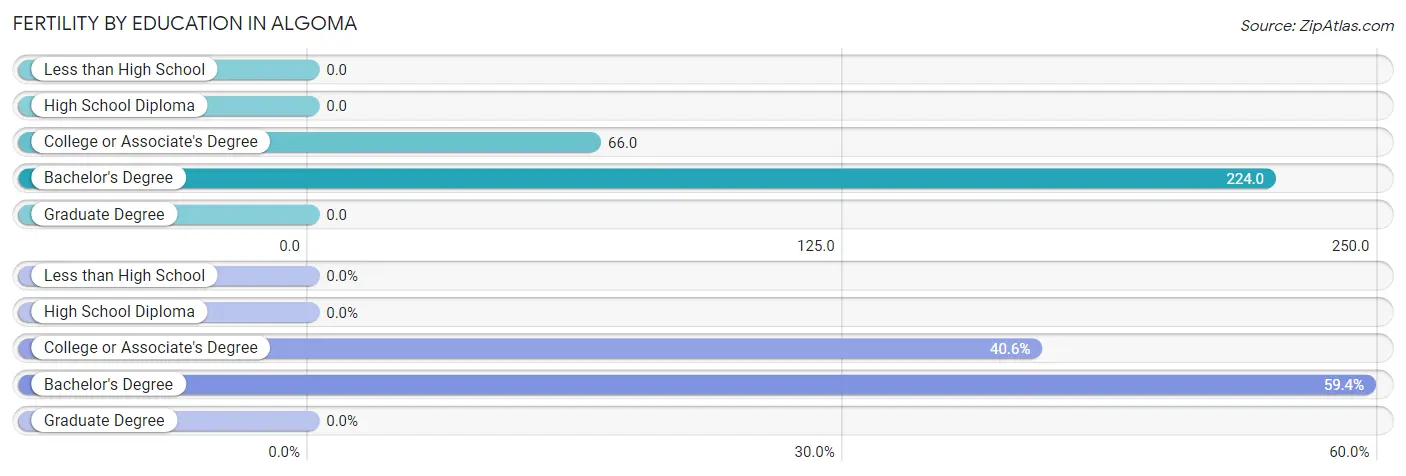
| Educational Attainment | Women with Births | Births / 1,000 Women |
| Less than High School | 0 (0.0%) | 0.0 |
| High School Diploma | 0 (0.0%) | 0.0 |
| College or Associate's Degree | 13 (40.6%) | 66.0 |
| Bachelor's Degree | 19 (59.4%) | 224.0 |
| Graduate Degree | 0 (0.0%) | 0.0 |
| Total | 32 (100.0%) | 55.0 |
Fertility by Education by Marriage Status in Algoma
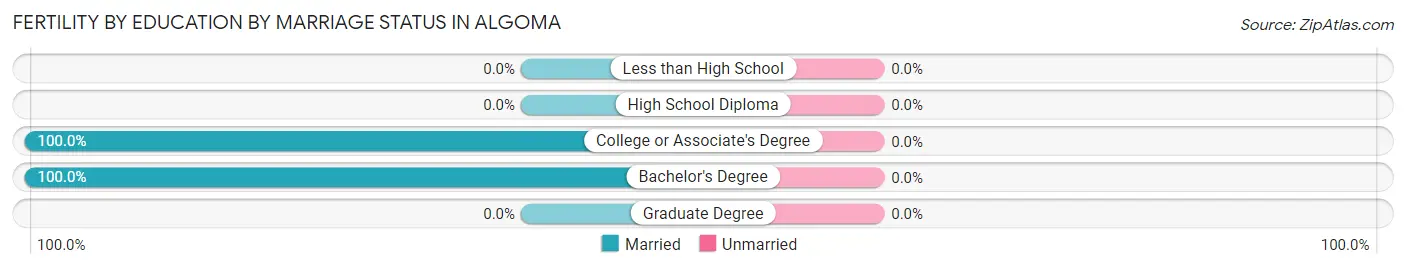
| Educational Attainment | Married | Unmarried |
| Less than High School | 0 (0.0%) | 0 (0.0%) |
| High School Diploma | 0 (0.0%) | 0 (0.0%) |
| College or Associate's Degree | 13 (100.0%) | 0 (0.0%) |
| Bachelor's Degree | 19 (100.0%) | 0 (0.0%) |
| Graduate Degree | 0 (0.0%) | 0 (0.0%) |
| Total | 32 (100.0%) | 0 (0.0%) |
Employment Characteristics in Algoma
Employment by Class of Employer in Algoma
Among the 1,451 employed individuals in Algoma, private company employees (1,098 | 75.7%), not-for-profit organizations (124 | 8.6%), and local government employees (80 | 5.5%) make up the most common classes of employment.
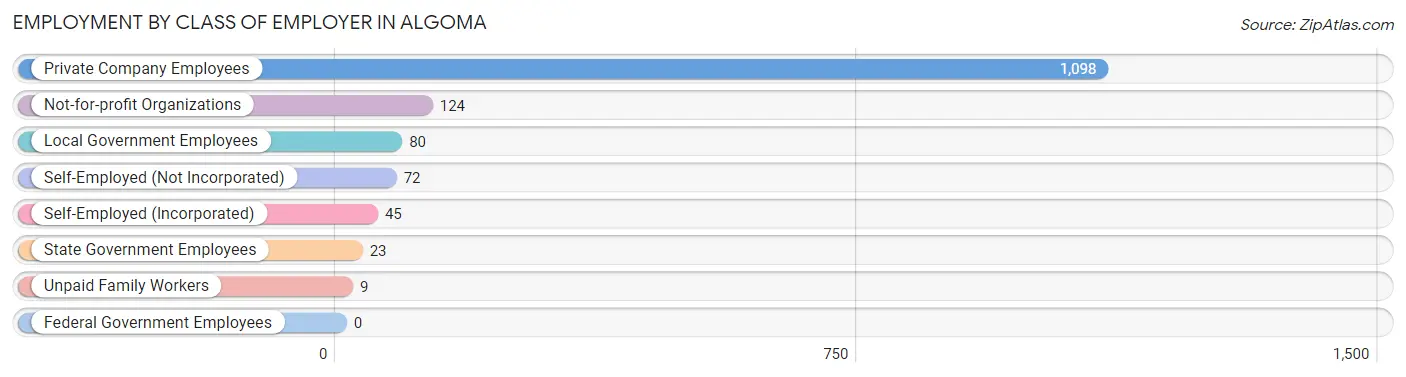
| Employer Class | # Employees | % Employees |
| Private Company Employees | 1,098 | 75.7% |
| Self-Employed (Incorporated) | 45 | 3.1% |
| Self-Employed (Not Incorporated) | 72 | 5.0% |
| Not-for-profit Organizations | 124 | 8.6% |
| Local Government Employees | 80 | 5.5% |
| State Government Employees | 23 | 1.6% |
| Federal Government Employees | 0 | 0.0% |
| Unpaid Family Workers | 9 | 0.6% |
| Total | 1,451 | 100.0% |
Employment Status by Age in Algoma
According to the labor force statistics for Algoma, out of the total population over 16 years of age (2,640), 57.3% or 1,513 individuals are in the labor force, with 3.6% or 54 of them unemployed. The age group with the highest labor force participation rate is 35 to 44 years, with 97.7% or 342 individuals in the labor force. Within the labor force, the 75 years and over age range has the highest percentage of unemployed individuals, with 58.3% or 14 of them being unemployed.
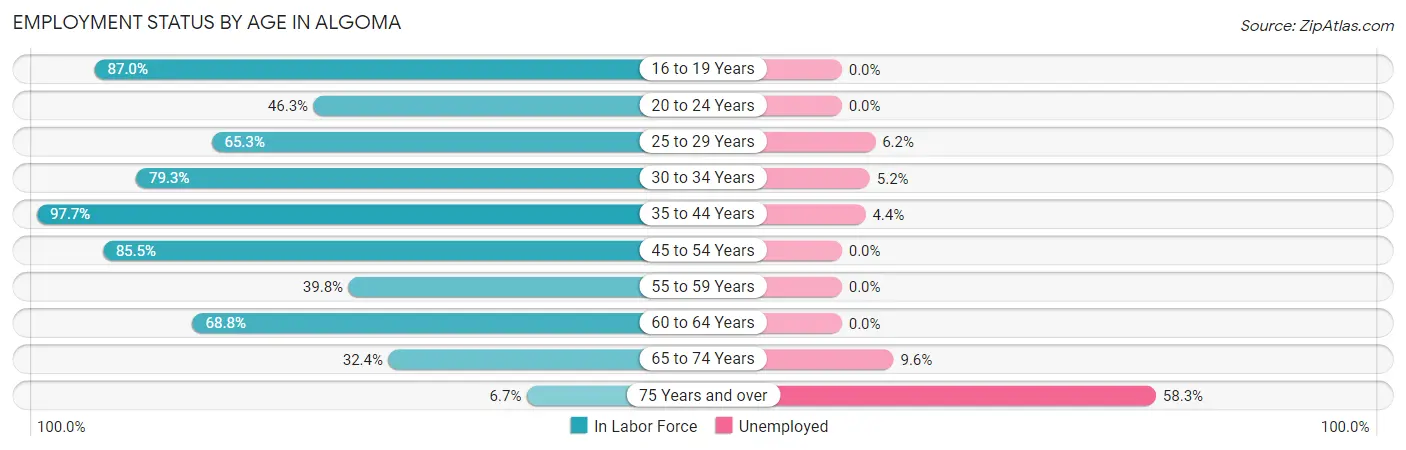
| Age Bracket | In Labor Force | Unemployed |
| 16 to 19 Years | 140 (87.0%) | 0 (0.0%) |
| 20 to 24 Years | 88 (46.3%) | 0 (0.0%) |
| 25 to 29 Years | 113 (65.3%) | 7 (6.2%) |
| 30 to 34 Years | 96 (79.3%) | 5 (5.2%) |
| 35 to 44 Years | 342 (97.7%) | 15 (4.4%) |
| 45 to 54 Years | 301 (85.5%) | 0 (0.0%) |
| 55 to 59 Years | 113 (39.8%) | 0 (0.0%) |
| 60 to 64 Years | 161 (68.8%) | 0 (0.0%) |
| 65 to 74 Years | 135 (32.4%) | 13 (9.6%) |
| 75 Years and over | 24 (6.7%) | 14 (58.3%) |
| Total | 1,513 (57.3%) | 54 (3.6%) |
Employment Status by Educational Attainment in Algoma
According to labor force statistics for Algoma, 74.4% of individuals (1,126) out of the total population between 25 and 64 years of age (1,514) are in the labor force, with 2.4% or 27 of them being unemployed. The group with the highest labor force participation rate are those with the educational attainment of high school diploma, with 86.3% or 483 individuals in the labor force. Within the labor force, individuals with bachelor's degree or higher education have the highest percentage of unemployment, with 4.0% or 7 of them being unemployed.
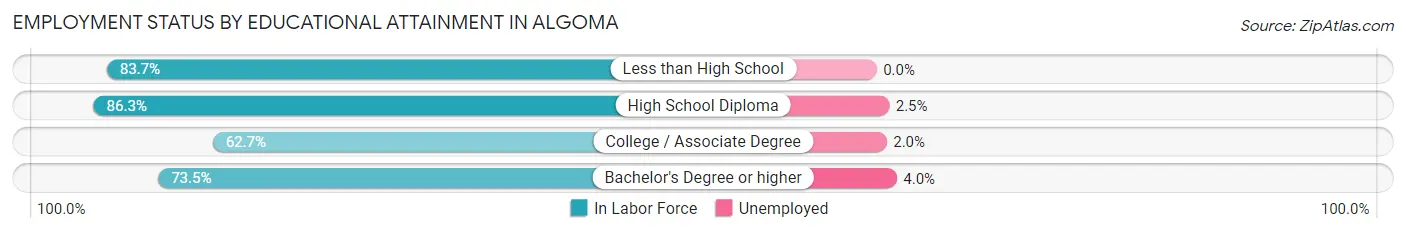
| Educational Attainment | In Labor Force | Unemployed |
| Less than High School | 77 (83.7%) | 0 (0.0%) |
| High School Diploma | 483 (86.3%) | 14 (2.5%) |
| College / Associate Degree | 391 (62.7%) | 12 (2.0%) |
| Bachelor's Degree or higher | 175 (73.5%) | 10 (4.0%) |
| Total | 1,126 (74.4%) | 36 (2.4%) |
Employment Occupations by Sex in Algoma
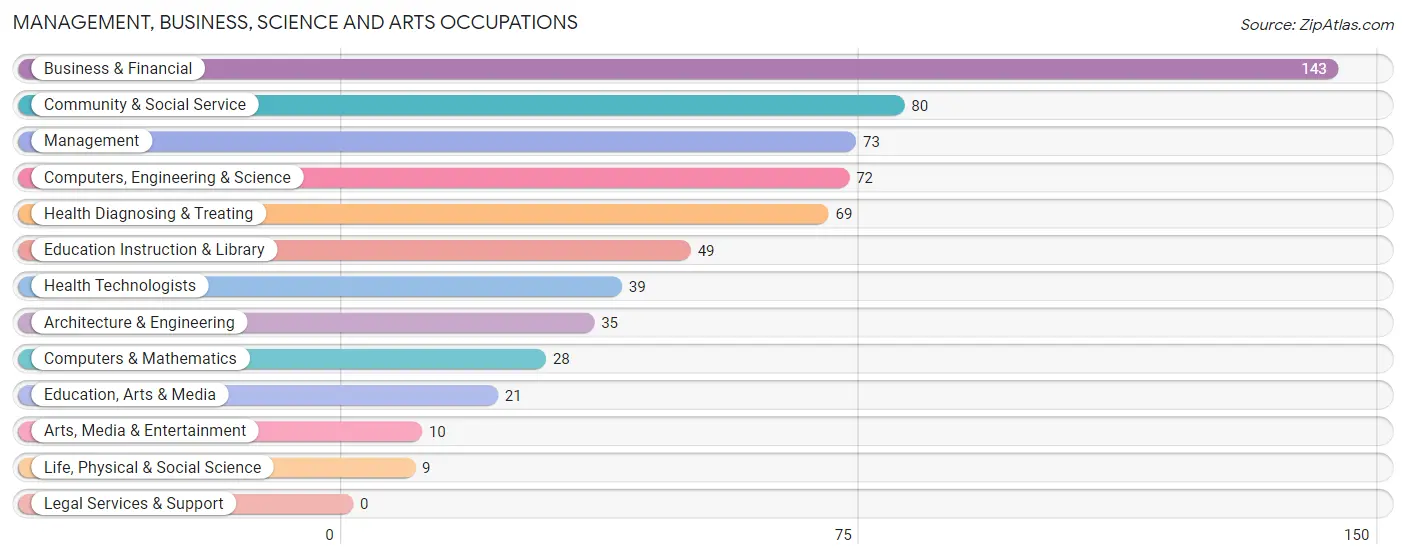
Management, Business, Science and Arts Occupations
The most common Management, Business, Science and Arts occupations in Algoma are Business & Financial (143 | 9.8%), Community & Social Service (80 | 5.5%), Management (73 | 5.0%), Computers, Engineering & Science (72 | 4.9%), and Health Diagnosing & Treating (69 | 4.7%).
Management, Business, Science and Arts Occupations by Sex
Within the Management, Business, Science and Arts occupations in Algoma, the most male-oriented occupations are Architecture & Engineering (100.0%), Education, Arts & Media (66.7%), and Computers, Engineering & Science (62.5%), while the most female-oriented occupations are Life, Physical & Social Science (100.0%), Arts, Media & Entertainment (100.0%), and Business & Financial (76.9%).
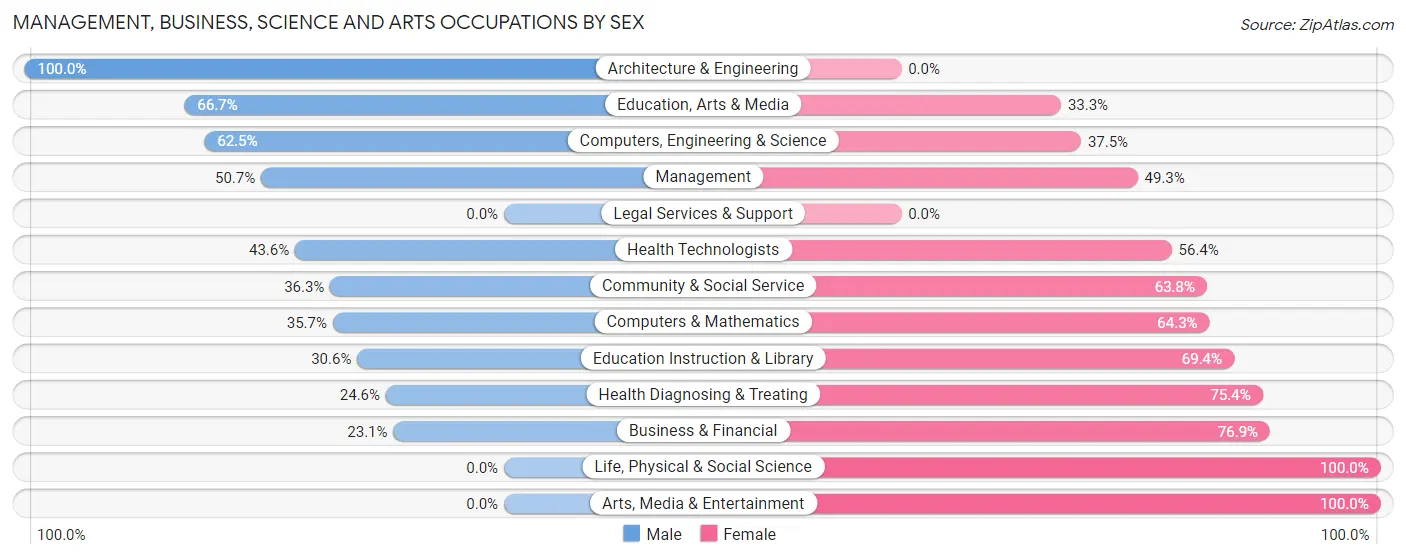
| Occupation | Male | Female |
| Management | 37 (50.7%) | 36 (49.3%) |
| Business & Financial | 33 (23.1%) | 110 (76.9%) |
| Computers, Engineering & Science | 45 (62.5%) | 27 (37.5%) |
| Computers & Mathematics | 10 (35.7%) | 18 (64.3%) |
| Architecture & Engineering | 35 (100.0%) | 0 (0.0%) |
| Life, Physical & Social Science | 0 (0.0%) | 9 (100.0%) |
| Community & Social Service | 29 (36.2%) | 51 (63.7%) |
| Education, Arts & Media | 14 (66.7%) | 7 (33.3%) |
| Legal Services & Support | 0 (0.0%) | 0 (0.0%) |
| Education Instruction & Library | 15 (30.6%) | 34 (69.4%) |
| Arts, Media & Entertainment | 0 (0.0%) | 10 (100.0%) |
| Health Diagnosing & Treating | 17 (24.6%) | 52 (75.4%) |
| Health Technologists | 17 (43.6%) | 22 (56.4%) |
| Total (Category) | 161 (36.8%) | 276 (63.2%) |
| Total (Overall) | 785 (53.8%) | 674 (46.2%) |
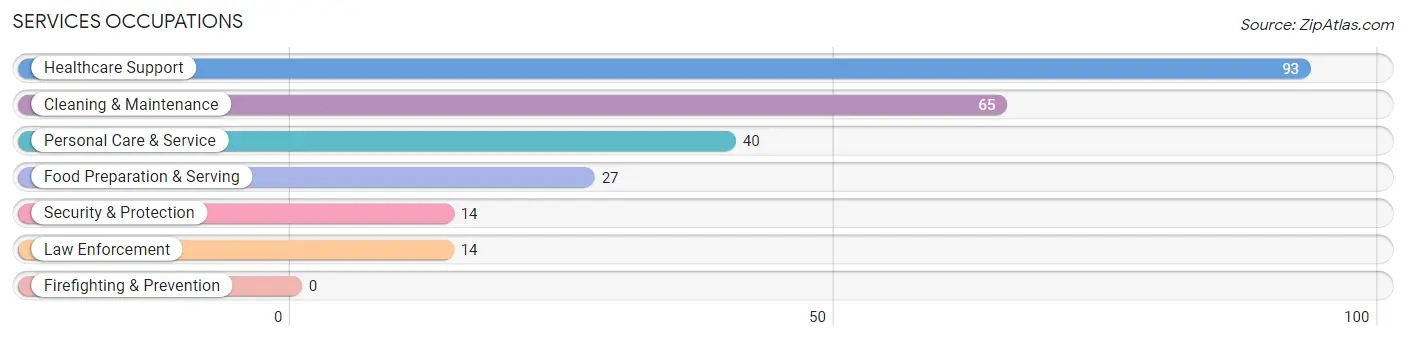
Services Occupations
The most common Services occupations in Algoma are Healthcare Support (93 | 6.4%), Cleaning & Maintenance (65 | 4.5%), Personal Care & Service (40 | 2.7%), Food Preparation & Serving (27 | 1.8%), and Security & Protection (14 | 1.0%).
Services Occupations by Sex
Within the Services occupations in Algoma, the most male-oriented occupations are Cleaning & Maintenance (73.9%), Security & Protection (64.3%), and Law Enforcement (64.3%), while the most female-oriented occupations are Personal Care & Service (100.0%), Healthcare Support (90.3%), and Food Preparation & Serving (77.8%).
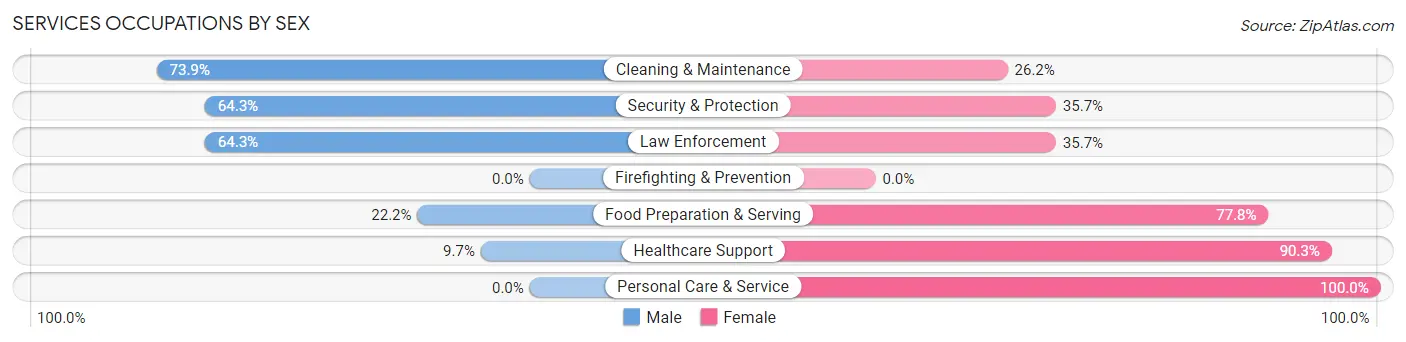
| Occupation | Male | Female |
| Healthcare Support | 9 (9.7%) | 84 (90.3%) |
| Security & Protection | 9 (64.3%) | 5 (35.7%) |
| Firefighting & Prevention | 0 (0.0%) | 0 (0.0%) |
| Law Enforcement | 9 (64.3%) | 5 (35.7%) |
| Food Preparation & Serving | 6 (22.2%) | 21 (77.8%) |
| Cleaning & Maintenance | 48 (73.9%) | 17 (26.2%) |
| Personal Care & Service | 0 (0.0%) | 40 (100.0%) |
| Total (Category) | 72 (30.1%) | 167 (69.9%) |
| Total (Overall) | 785 (53.8%) | 674 (46.2%) |
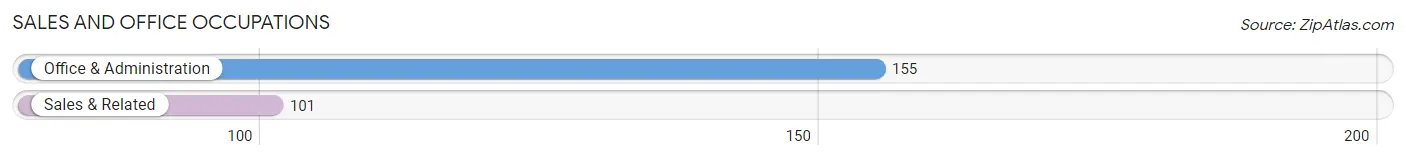
Sales and Office Occupations
The most common Sales and Office occupations in Algoma are Office & Administration (155 | 10.6%), and Sales & Related (101 | 6.9%).
Sales and Office Occupations by Sex
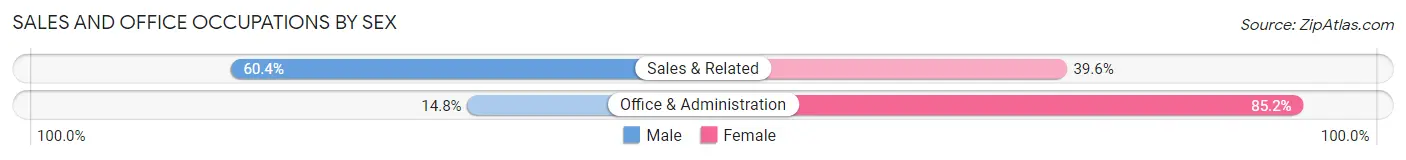
| Occupation | Male | Female |
| Sales & Related | 61 (60.4%) | 40 (39.6%) |
| Office & Administration | 23 (14.8%) | 132 (85.2%) |
| Total (Category) | 84 (32.8%) | 172 (67.2%) |
| Total (Overall) | 785 (53.8%) | 674 (46.2%) |
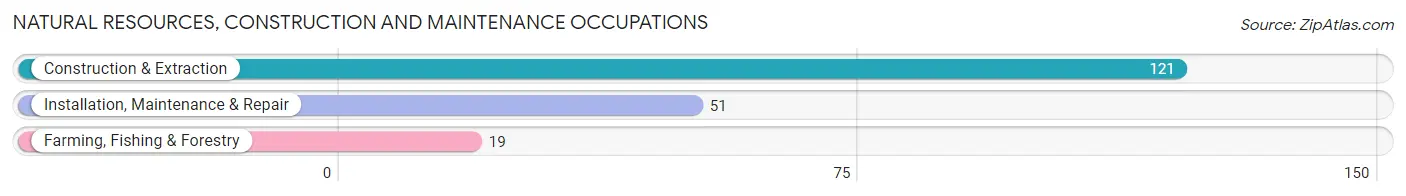
Natural Resources, Construction and Maintenance Occupations
The most common Natural Resources, Construction and Maintenance occupations in Algoma are Construction & Extraction (121 | 8.3%), Installation, Maintenance & Repair (51 | 3.5%), and Farming, Fishing & Forestry (19 | 1.3%).
Natural Resources, Construction and Maintenance Occupations by Sex
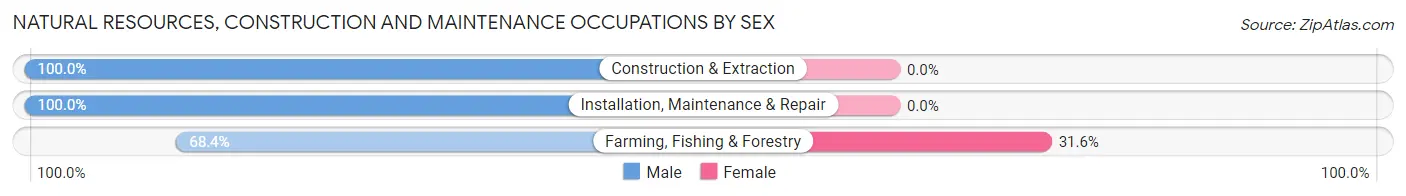
| Occupation | Male | Female |
| Farming, Fishing & Forestry | 13 (68.4%) | 6 (31.6%) |
| Construction & Extraction | 121 (100.0%) | 0 (0.0%) |
| Installation, Maintenance & Repair | 51 (100.0%) | 0 (0.0%) |
| Total (Category) | 185 (96.9%) | 6 (3.1%) |
| Total (Overall) | 785 (53.8%) | 674 (46.2%) |
Production, Transportation and Moving Occupations
The most common Production, Transportation and Moving occupations in Algoma are Production (155 | 10.6%), Transportation (118 | 8.1%), and Material Moving (63 | 4.3%).
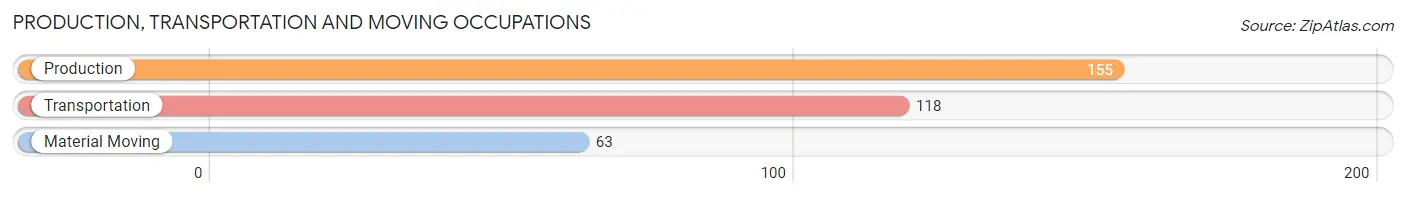
Production, Transportation and Moving Occupations by Sex
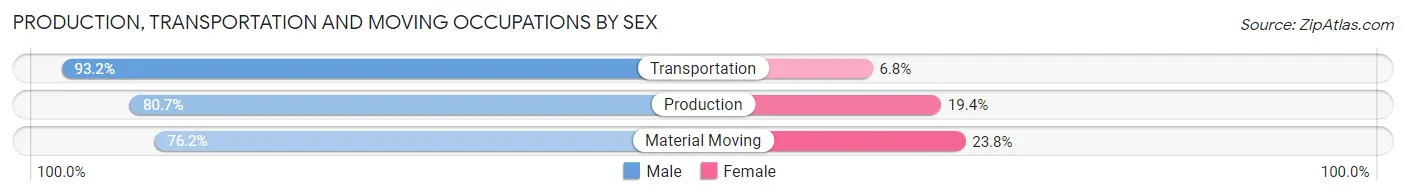
| Occupation | Male | Female |
| Production | 125 (80.6%) | 30 (19.4%) |
| Transportation | 110 (93.2%) | 8 (6.8%) |
| Material Moving | 48 (76.2%) | 15 (23.8%) |
| Total (Category) | 283 (84.2%) | 53 (15.8%) |
| Total (Overall) | 785 (53.8%) | 674 (46.2%) |
Employment Industries by Sex in Algoma
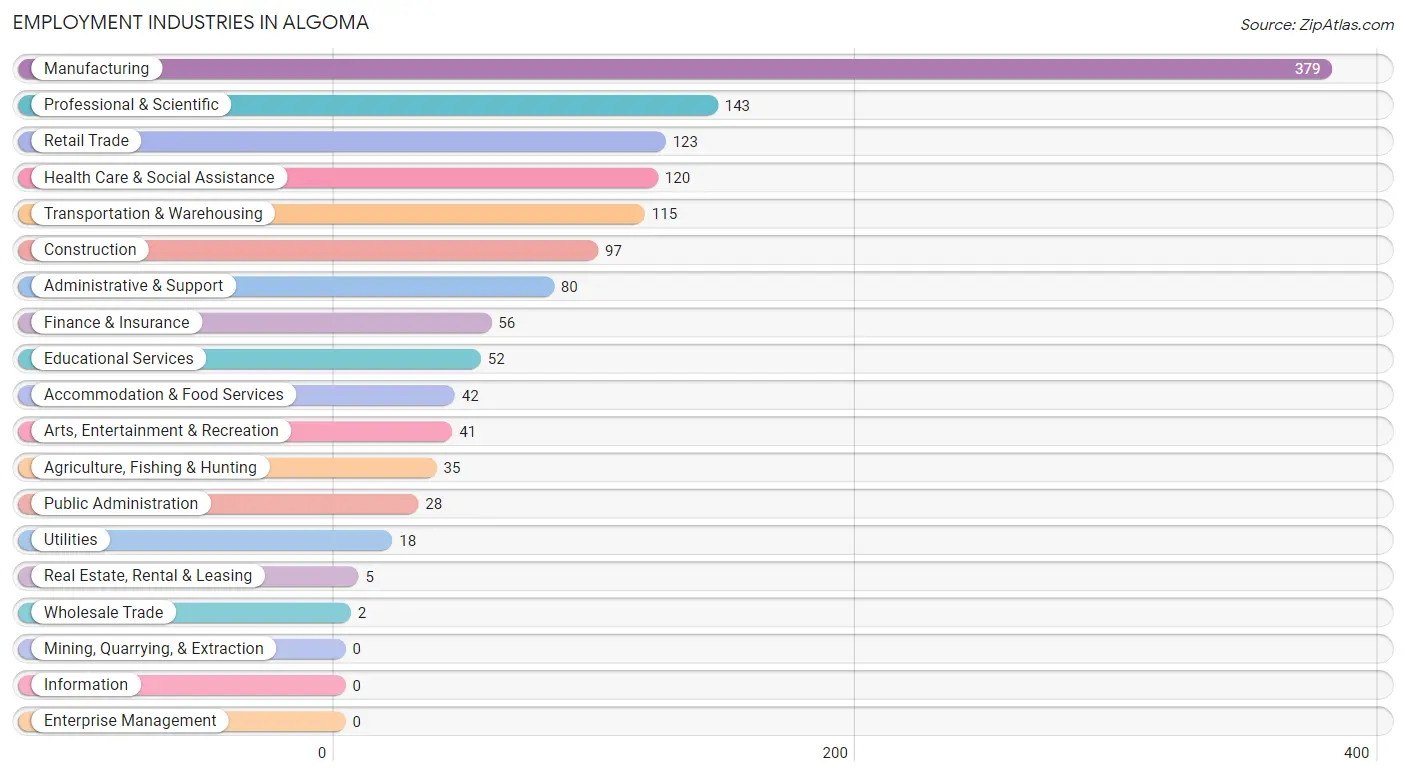
Employment Industries in Algoma
The major employment industries in Algoma include Manufacturing (379 | 26.0%), Professional & Scientific (143 | 9.8%), Retail Trade (123 | 8.4%), Health Care & Social Assistance (120 | 8.2%), and Transportation & Warehousing (115 | 7.9%).
Employment Industries by Sex in Algoma
The Algoma industries that see more men than women are Construction (100.0%), Wholesale Trade (100.0%), and Agriculture, Fishing & Hunting (82.9%), whereas the industries that tend to have a higher number of women are Real Estate, Rental & Leasing (100.0%), Finance & Insurance (89.3%), and Educational Services (86.5%).
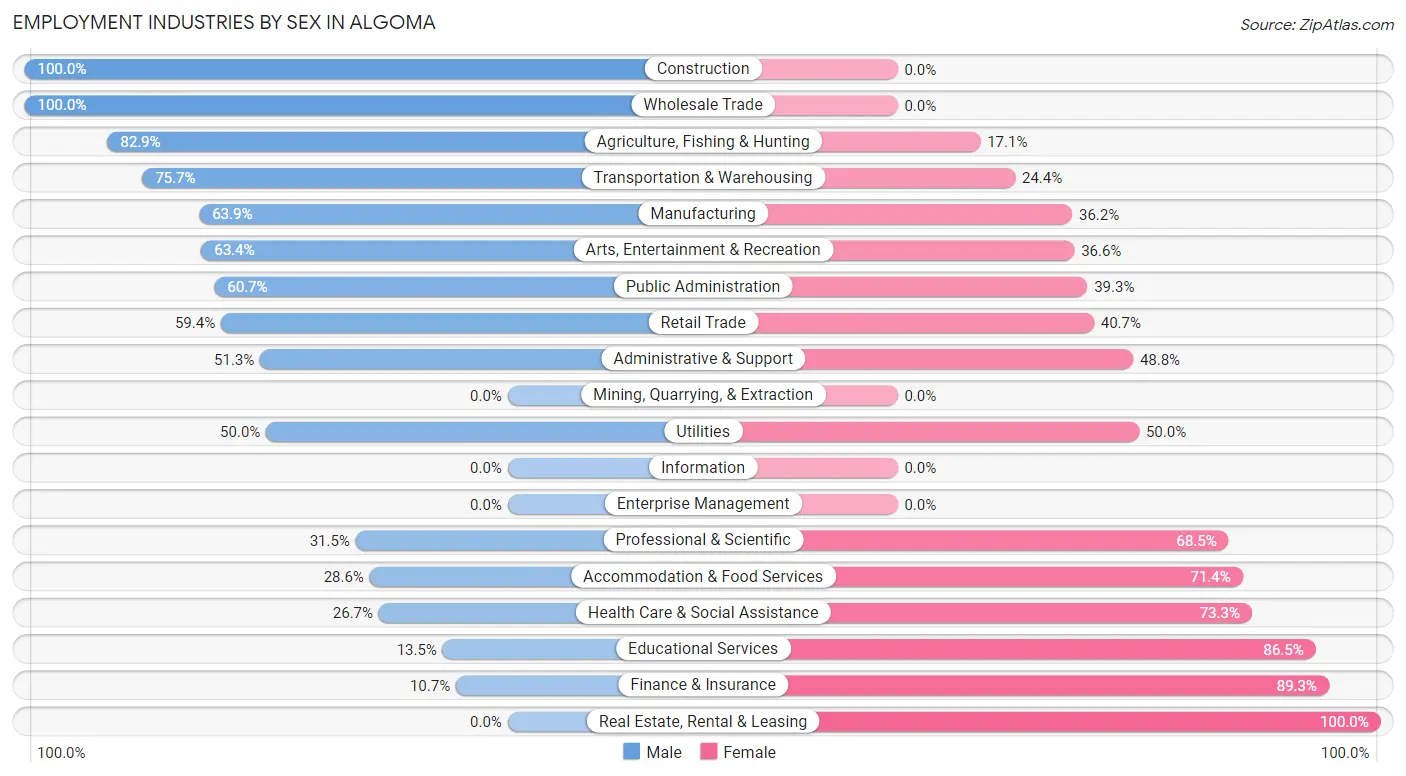
| Industry | Male | Female |
| Agriculture, Fishing & Hunting | 29 (82.9%) | 6 (17.1%) |
| Mining, Quarrying, & Extraction | 0 (0.0%) | 0 (0.0%) |
| Construction | 97 (100.0%) | 0 (0.0%) |
| Manufacturing | 242 (63.8%) | 137 (36.1%) |
| Wholesale Trade | 2 (100.0%) | 0 (0.0%) |
| Retail Trade | 73 (59.4%) | 50 (40.6%) |
| Transportation & Warehousing | 87 (75.6%) | 28 (24.3%) |
| Utilities | 9 (50.0%) | 9 (50.0%) |
| Information | 0 (0.0%) | 0 (0.0%) |
| Finance & Insurance | 6 (10.7%) | 50 (89.3%) |
| Real Estate, Rental & Leasing | 0 (0.0%) | 5 (100.0%) |
| Professional & Scientific | 45 (31.5%) | 98 (68.5%) |
| Enterprise Management | 0 (0.0%) | 0 (0.0%) |
| Administrative & Support | 41 (51.2%) | 39 (48.7%) |
| Educational Services | 7 (13.5%) | 45 (86.5%) |
| Health Care & Social Assistance | 32 (26.7%) | 88 (73.3%) |
| Arts, Entertainment & Recreation | 26 (63.4%) | 15 (36.6%) |
| Accommodation & Food Services | 12 (28.6%) | 30 (71.4%) |
| Public Administration | 17 (60.7%) | 11 (39.3%) |
| Total | 785 (53.8%) | 674 (46.2%) |
Education in Algoma
School Enrollment in Algoma
The most common levels of schooling among the 740 students in Algoma are high school (228 | 30.8%), middle school (144 | 19.5%), and elementary school (129 | 17.4%).
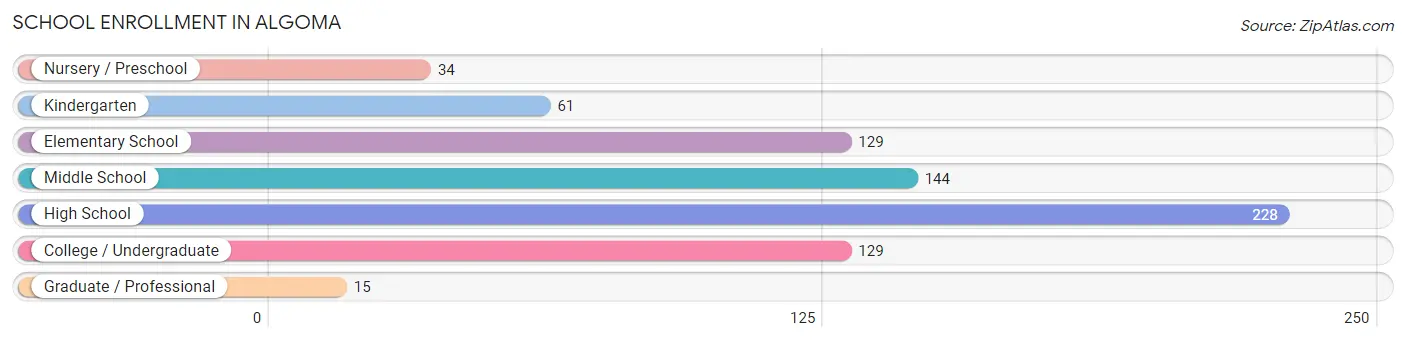
| School Level | # Students | % Students |
| Nursery / Preschool | 34 | 4.6% |
| Kindergarten | 61 | 8.2% |
| Elementary School | 129 | 17.4% |
| Middle School | 144 | 19.5% |
| High School | 228 | 30.8% |
| College / Undergraduate | 129 | 17.4% |
| Graduate / Professional | 15 | 2.0% |
| Total | 740 | 100.0% |
School Enrollment by Age by Funding Source in Algoma
Out of a total of 740 students who are enrolled in schools in Algoma, 147 (19.9%) attend a private institution, while the remaining 593 (80.1%) are enrolled in public schools. The age group of 35 years and over has the highest likelihood of being enrolled in private schools, with 27 (75.0% in the age bracket) enrolled. Conversely, the age group of 3 to 4 year olds has the lowest likelihood of being enrolled in a private school, with 27 (100.0% in the age bracket) attending a public institution.
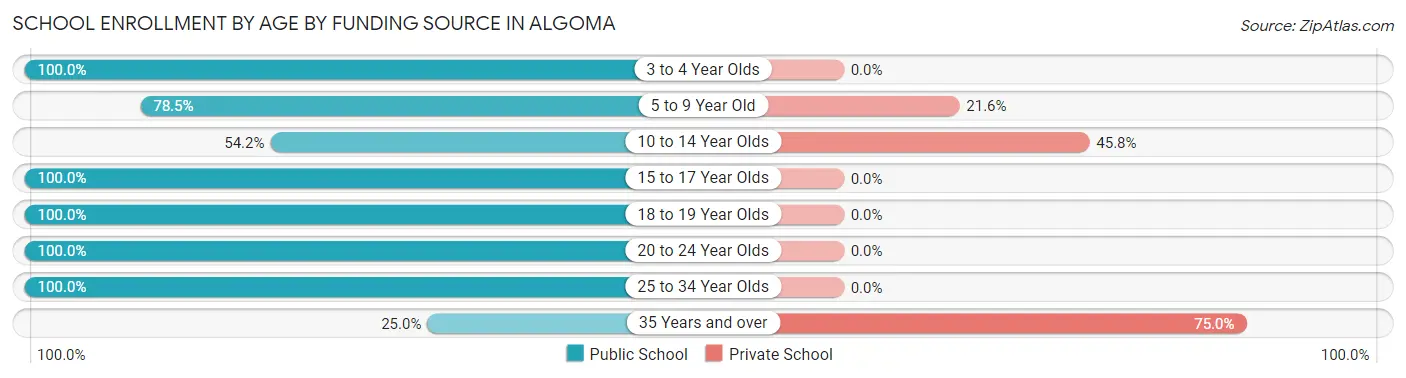
| Age Bracket | Public School | Private School |
| 3 to 4 Year Olds | 27 (100.0%) | 0 (0.0%) |
| 5 to 9 Year Old | 142 (78.4%) | 39 (21.5%) |
| 10 to 14 Year Olds | 96 (54.2%) | 81 (45.8%) |
| 15 to 17 Year Olds | 140 (100.0%) | 0 (0.0%) |
| 18 to 19 Year Olds | 83 (100.0%) | 0 (0.0%) |
| 20 to 24 Year Olds | 47 (100.0%) | 0 (0.0%) |
| 25 to 34 Year Olds | 49 (100.0%) | 0 (0.0%) |
| 35 Years and over | 9 (25.0%) | 27 (75.0%) |
| Total | 593 (80.1%) | 147 (19.9%) |
Educational Attainment by Field of Study in Algoma
Education (116 | 27.6%), science & technology (98 | 23.3%), business (51 | 12.1%), social sciences (35 | 8.3%), and arts & humanities (31 | 7.4%) are the most common fields of study among 421 individuals in Algoma who have obtained a bachelor's degree or higher.
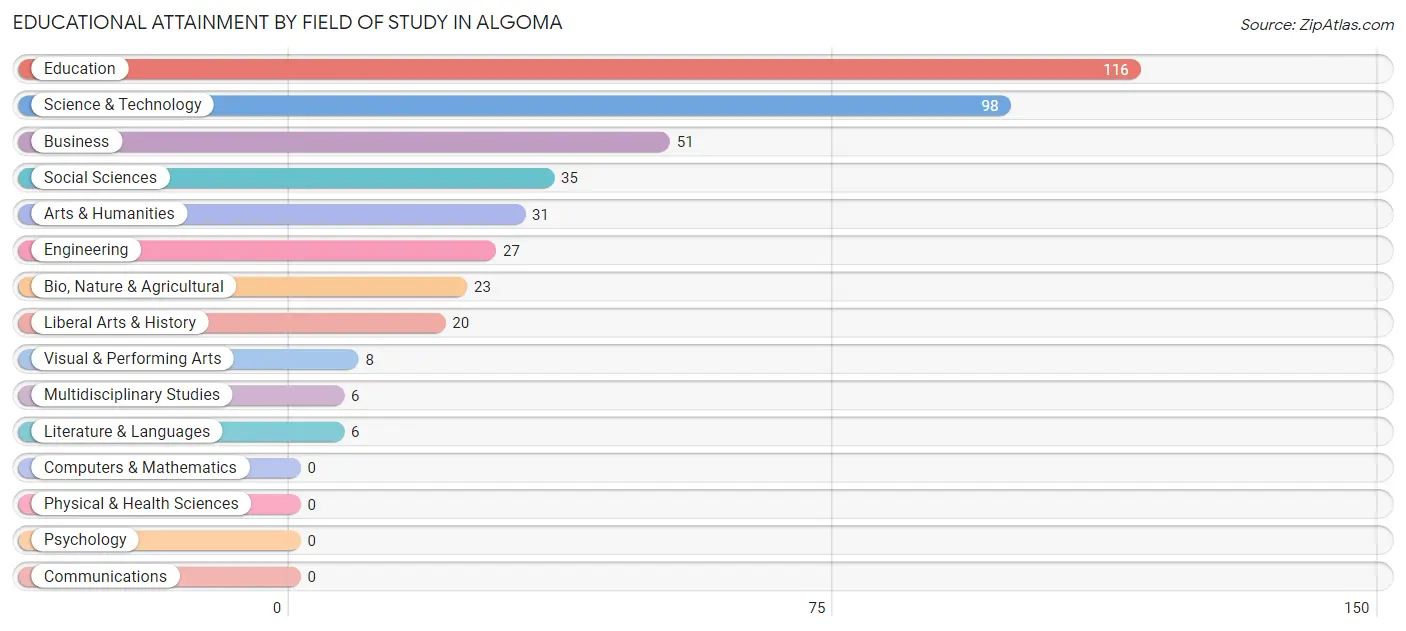
| Field of Study | # Graduates | % Graduates |
| Computers & Mathematics | 0 | 0.0% |
| Bio, Nature & Agricultural | 23 | 5.5% |
| Physical & Health Sciences | 0 | 0.0% |
| Psychology | 0 | 0.0% |
| Social Sciences | 35 | 8.3% |
| Engineering | 27 | 6.4% |
| Multidisciplinary Studies | 6 | 1.4% |
| Science & Technology | 98 | 23.3% |
| Business | 51 | 12.1% |
| Education | 116 | 27.6% |
| Literature & Languages | 6 | 1.4% |
| Liberal Arts & History | 20 | 4.8% |
| Visual & Performing Arts | 8 | 1.9% |
| Communications | 0 | 0.0% |
| Arts & Humanities | 31 | 7.4% |
| Total | 421 | 100.0% |
Transportation & Commute in Algoma
Vehicle Availability by Sex in Algoma
The most prevalent vehicle ownership categories in Algoma are males with 2 vehicles (324, accounting for 41.3%) and females with 2 vehicles (334, making up 48.9%).
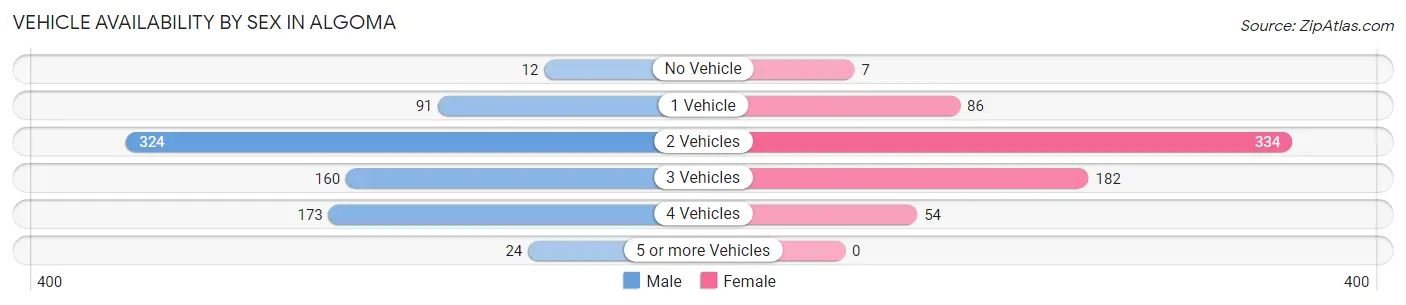
| Vehicles Available | Male | Female |
| No Vehicle | 12 (1.5%) | 7 (1.1%) |
| 1 Vehicle | 91 (11.6%) | 86 (13.0%) |
| 2 Vehicles | 324 (41.3%) | 334 (50.4%) |
| 3 Vehicles | 160 (20.4%) | 182 (27.5%) |
| 4 Vehicles | 173 (22.1%) | 54 (8.1%) |
| 5 or more Vehicles | 24 (3.1%) | 0 (0.0%) |
| Total | 784 (100.0%) | 663 (100.0%) |
Commute Time in Algoma
The most frequently occuring commute durations in Algoma are 5 to 9 minutes (298 commuters, 21.8%), less than 5 minutes (278 commuters, 20.4%), and 20 to 24 minutes (171 commuters, 12.5%).
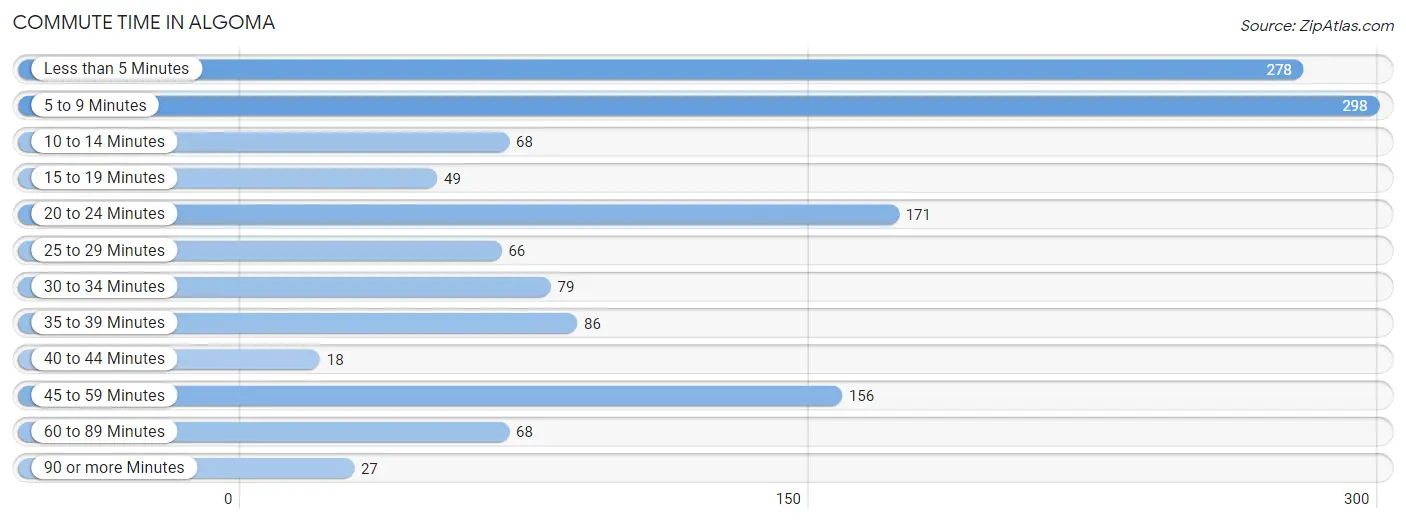
| Commute Time | # Commuters | % Commuters |
| Less than 5 Minutes | 278 | 20.4% |
| 5 to 9 Minutes | 298 | 21.8% |
| 10 to 14 Minutes | 68 | 5.0% |
| 15 to 19 Minutes | 49 | 3.6% |
| 20 to 24 Minutes | 171 | 12.5% |
| 25 to 29 Minutes | 66 | 4.8% |
| 30 to 34 Minutes | 79 | 5.8% |
| 35 to 39 Minutes | 86 | 6.3% |
| 40 to 44 Minutes | 18 | 1.3% |
| 45 to 59 Minutes | 156 | 11.4% |
| 60 to 89 Minutes | 68 | 5.0% |
| 90 or more Minutes | 27 | 2.0% |
Commute Time by Sex in Algoma
The most common commute times in Algoma are less than 5 minutes (138 commuters, 18.8%) for males and 5 to 9 minutes (174 commuters, 27.7%) for females.
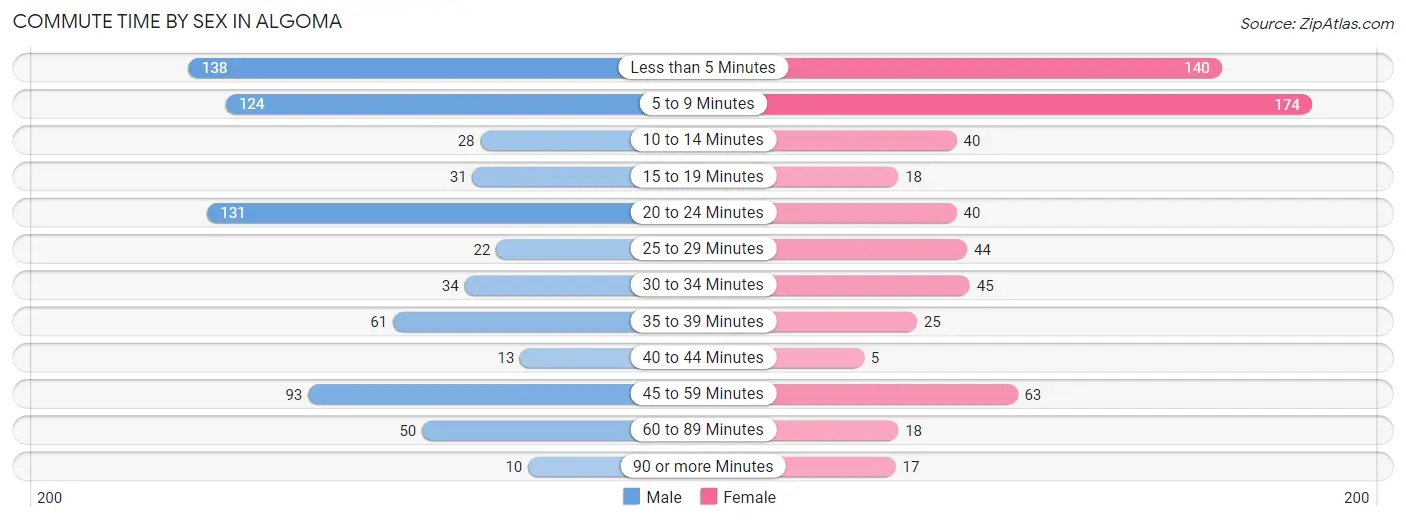
| Commute Time | Male | Female |
| Less than 5 Minutes | 138 (18.8%) | 140 (22.3%) |
| 5 to 9 Minutes | 124 (16.9%) | 174 (27.7%) |
| 10 to 14 Minutes | 28 (3.8%) | 40 (6.4%) |
| 15 to 19 Minutes | 31 (4.2%) | 18 (2.9%) |
| 20 to 24 Minutes | 131 (17.8%) | 40 (6.4%) |
| 25 to 29 Minutes | 22 (3.0%) | 44 (7.0%) |
| 30 to 34 Minutes | 34 (4.6%) | 45 (7.1%) |
| 35 to 39 Minutes | 61 (8.3%) | 25 (4.0%) |
| 40 to 44 Minutes | 13 (1.8%) | 5 (0.8%) |
| 45 to 59 Minutes | 93 (12.7%) | 63 (10.0%) |
| 60 to 89 Minutes | 50 (6.8%) | 18 (2.9%) |
| 90 or more Minutes | 10 (1.4%) | 17 (2.7%) |
Time of Departure to Work by Sex in Algoma
The most frequent times of departure to work in Algoma are 6:30 AM to 6:59 AM (146, 19.9%) for males and 8:00 AM to 8:29 AM (168, 26.7%) for females.
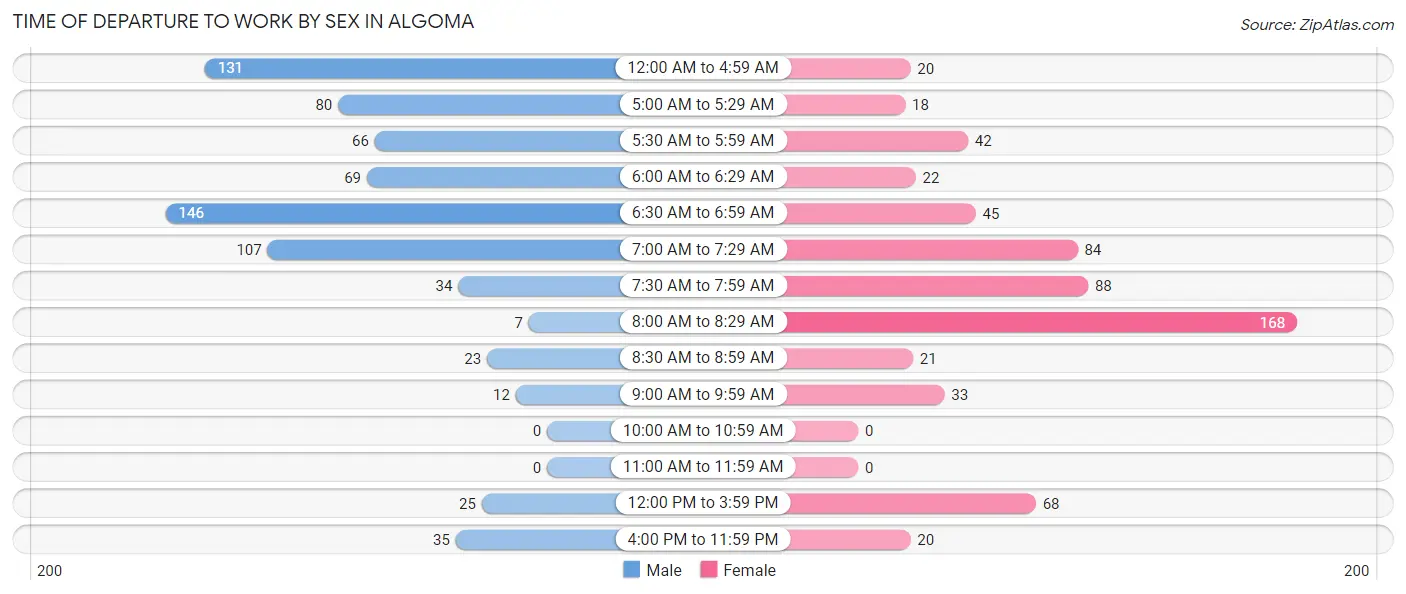
| Time of Departure | Male | Female |
| 12:00 AM to 4:59 AM | 131 (17.8%) | 20 (3.2%) |
| 5:00 AM to 5:29 AM | 80 (10.9%) | 18 (2.9%) |
| 5:30 AM to 5:59 AM | 66 (9.0%) | 42 (6.7%) |
| 6:00 AM to 6:29 AM | 69 (9.4%) | 22 (3.5%) |
| 6:30 AM to 6:59 AM | 146 (19.9%) | 45 (7.1%) |
| 7:00 AM to 7:29 AM | 107 (14.6%) | 84 (13.4%) |
| 7:30 AM to 7:59 AM | 34 (4.6%) | 88 (14.0%) |
| 8:00 AM to 8:29 AM | 7 (0.9%) | 168 (26.7%) |
| 8:30 AM to 8:59 AM | 23 (3.1%) | 21 (3.3%) |
| 9:00 AM to 9:59 AM | 12 (1.6%) | 33 (5.2%) |
| 10:00 AM to 10:59 AM | 0 (0.0%) | 0 (0.0%) |
| 11:00 AM to 11:59 AM | 0 (0.0%) | 0 (0.0%) |
| 12:00 PM to 3:59 PM | 25 (3.4%) | 68 (10.8%) |
| 4:00 PM to 11:59 PM | 35 (4.8%) | 20 (3.2%) |
| Total | 735 (100.0%) | 629 (100.0%) |
Housing Occupancy in Algoma
Occupancy by Ownership in Algoma
Of the total 1,343 dwellings in Algoma, owner-occupied units account for 1,079 (80.3%), while renter-occupied units make up 264 (19.7%).
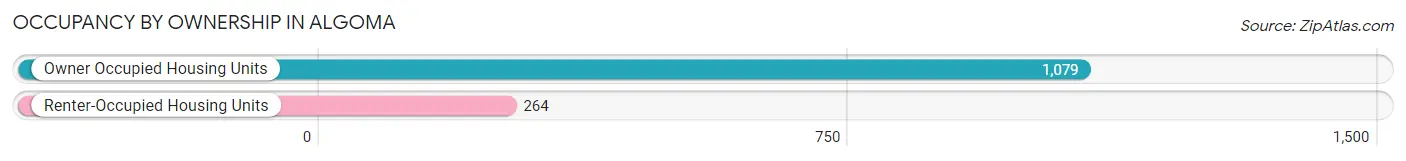
| Occupancy | # Housing Units | % Housing Units |
| Owner Occupied Housing Units | 1,079 | 80.3% |
| Renter-Occupied Housing Units | 264 | 19.7% |
| Total Occupied Housing Units | 1,343 | 100.0% |
Occupancy by Household Size in Algoma
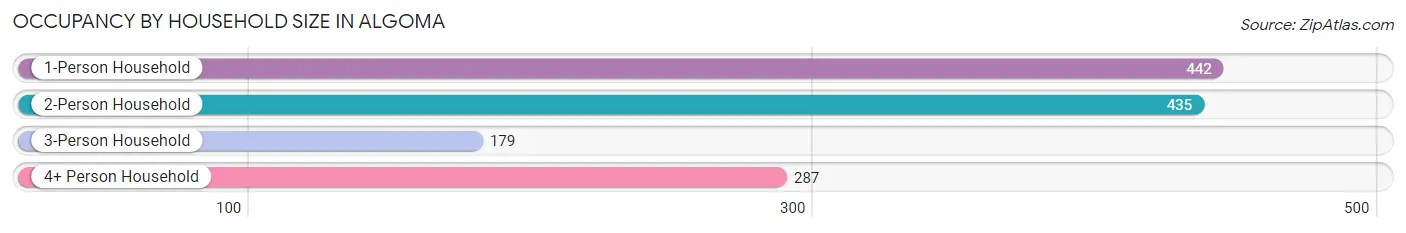
| Household Size | # Housing Units | % Housing Units |
| 1-Person Household | 442 | 32.9% |
| 2-Person Household | 435 | 32.4% |
| 3-Person Household | 179 | 13.3% |
| 4+ Person Household | 287 | 21.4% |
| Total Housing Units | 1,343 | 100.0% |
Occupancy by Ownership by Household Size in Algoma
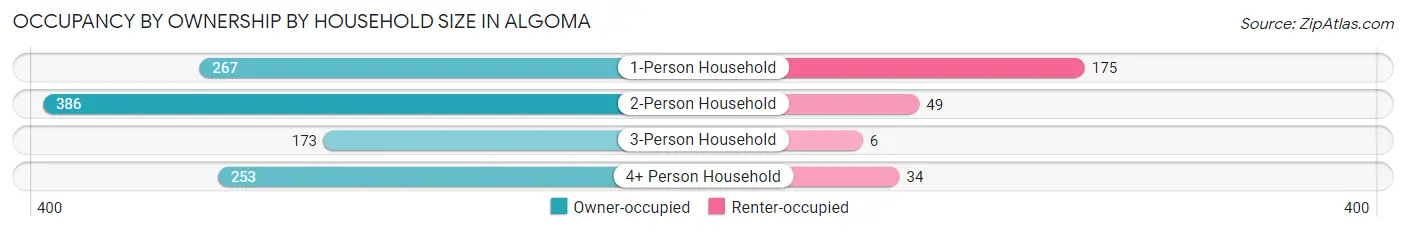
| Household Size | Owner-occupied | Renter-occupied |
| 1-Person Household | 267 (60.4%) | 175 (39.6%) |
| 2-Person Household | 386 (88.7%) | 49 (11.3%) |
| 3-Person Household | 173 (96.7%) | 6 (3.4%) |
| 4+ Person Household | 253 (88.1%) | 34 (11.8%) |
| Total Housing Units | 1,079 (80.3%) | 264 (19.7%) |
Occupancy by Educational Attainment in Algoma
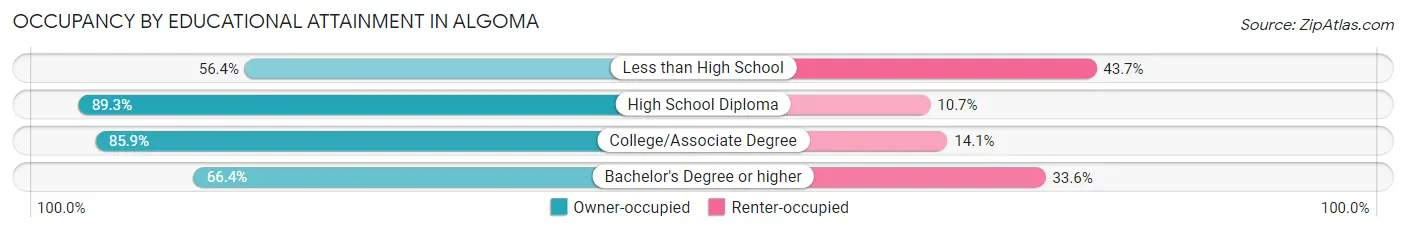
| Household Size | Owner-occupied | Renter-occupied |
| Less than High School | 71 (56.4%) | 55 (43.6%) |
| High School Diploma | 457 (89.3%) | 55 (10.7%) |
| College/Associate Degree | 365 (85.9%) | 60 (14.1%) |
| Bachelor's Degree or higher | 186 (66.4%) | 94 (33.6%) |
Occupancy by Age of Householder in Algoma
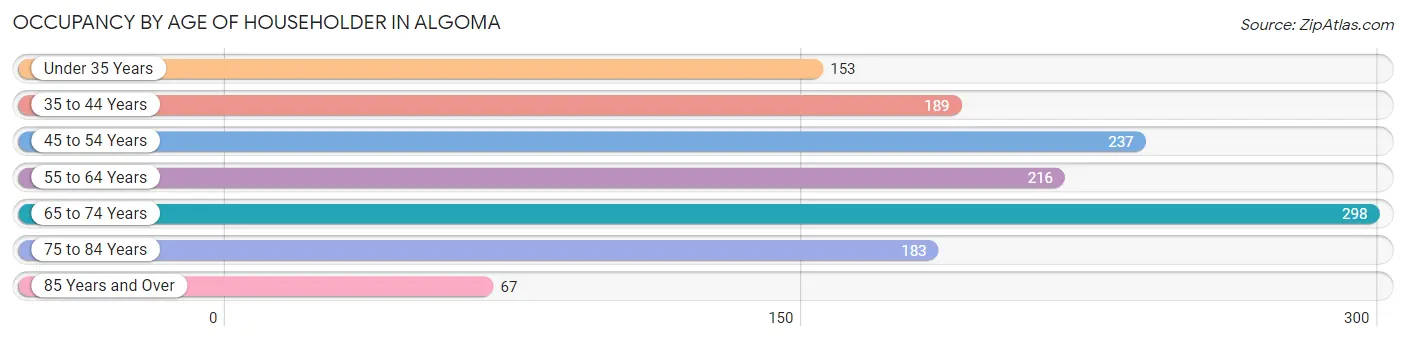
| Age Bracket | # Households | % Households |
| Under 35 Years | 153 | 11.4% |
| 35 to 44 Years | 189 | 14.1% |
| 45 to 54 Years | 237 | 17.6% |
| 55 to 64 Years | 216 | 16.1% |
| 65 to 74 Years | 298 | 22.2% |
| 75 to 84 Years | 183 | 13.6% |
| 85 Years and Over | 67 | 5.0% |
| Total | 1,343 | 100.0% |
Housing Finances in Algoma
Median Income by Occupancy in Algoma
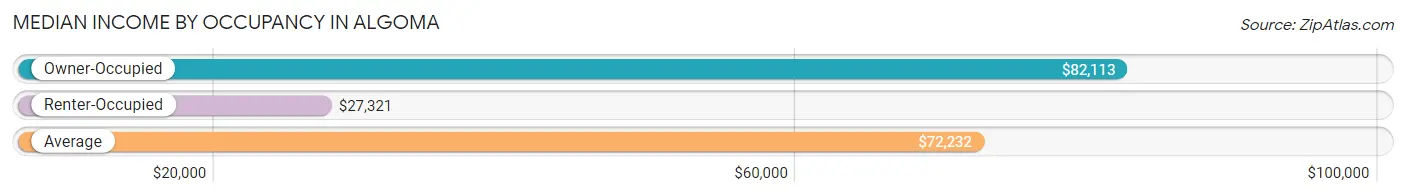
| Occupancy Type | # Households | Median Income |
| Owner-Occupied | 1,079 (80.3%) | $82,113 |
| Renter-Occupied | 264 (19.7%) | $27,321 |
| Average | 1,343 (100.0%) | $72,232 |
Occupancy by Householder Income Bracket in Algoma
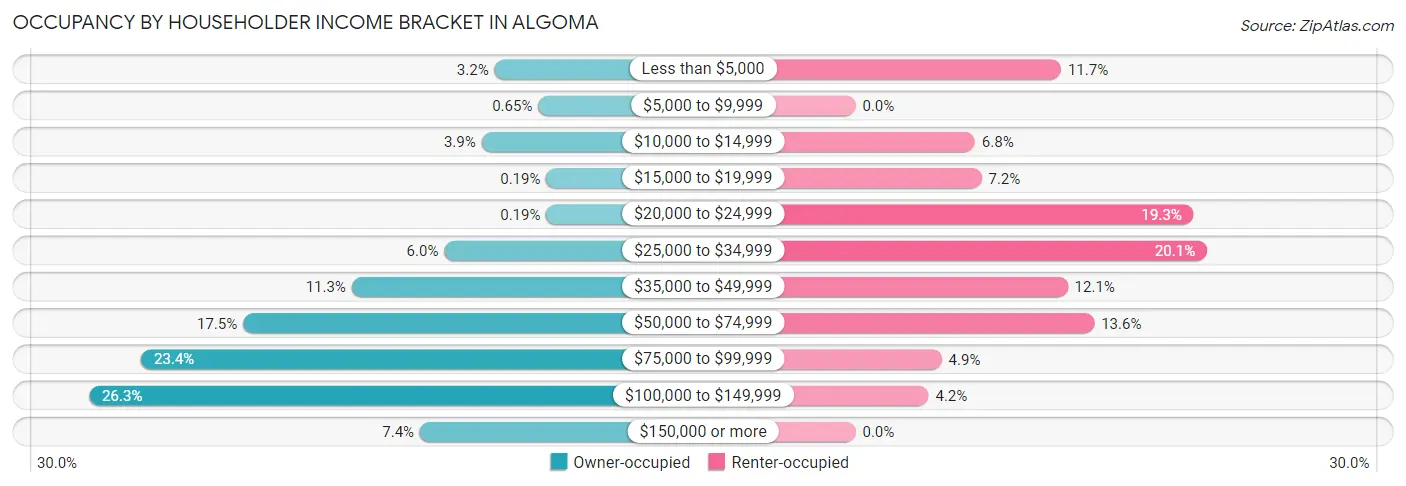
| Income Bracket | Owner-occupied | Renter-occupied |
| Less than $5,000 | 34 (3.2%) | 31 (11.7%) |
| $5,000 to $9,999 | 7 (0.6%) | 0 (0.0%) |
| $10,000 to $14,999 | 42 (3.9%) | 18 (6.8%) |
| $15,000 to $19,999 | 2 (0.2%) | 19 (7.2%) |
| $20,000 to $24,999 | 2 (0.2%) | 51 (19.3%) |
| $25,000 to $34,999 | 65 (6.0%) | 53 (20.1%) |
| $35,000 to $49,999 | 122 (11.3%) | 32 (12.1%) |
| $50,000 to $74,999 | 189 (17.5%) | 36 (13.6%) |
| $75,000 to $99,999 | 252 (23.4%) | 13 (4.9%) |
| $100,000 to $149,999 | 284 (26.3%) | 11 (4.2%) |
| $150,000 or more | 80 (7.4%) | 0 (0.0%) |
| Total | 1,079 (100.0%) | 264 (100.0%) |
Monthly Housing Cost Tiers in Algoma
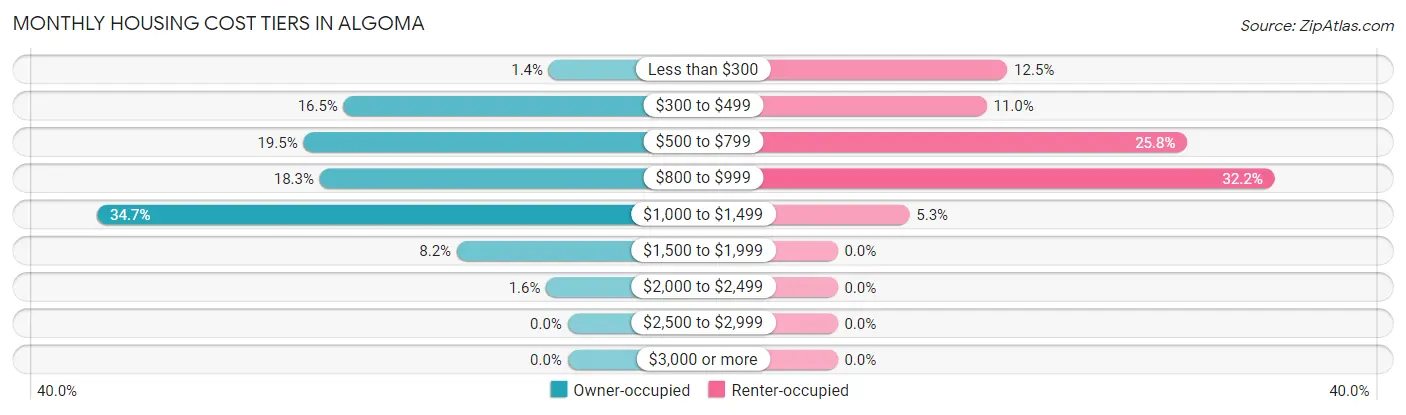
| Monthly Cost | Owner-occupied | Renter-occupied |
| Less than $300 | 15 (1.4%) | 33 (12.5%) |
| $300 to $499 | 178 (16.5%) | 29 (11.0%) |
| $500 to $799 | 210 (19.5%) | 68 (25.8%) |
| $800 to $999 | 197 (18.3%) | 85 (32.2%) |
| $1,000 to $1,499 | 374 (34.7%) | 14 (5.3%) |
| $1,500 to $1,999 | 88 (8.2%) | 0 (0.0%) |
| $2,000 to $2,499 | 17 (1.6%) | 0 (0.0%) |
| $2,500 to $2,999 | 0 (0.0%) | 0 (0.0%) |
| $3,000 or more | 0 (0.0%) | 0 (0.0%) |
| Total | 1,079 (100.0%) | 264 (100.0%) |
Physical Housing Characteristics in Algoma
Housing Structures in Algoma
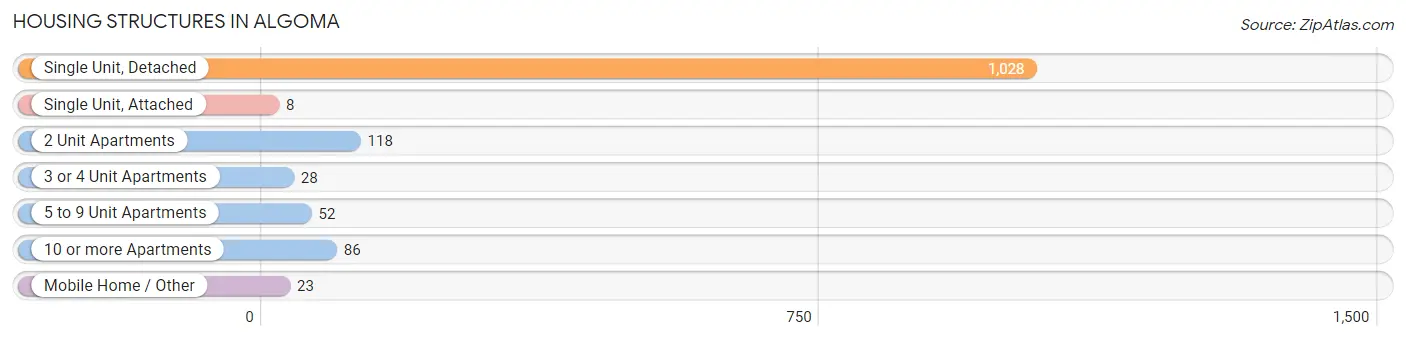
| Structure Type | # Housing Units | % Housing Units |
| Single Unit, Detached | 1,028 | 76.5% |
| Single Unit, Attached | 8 | 0.6% |
| 2 Unit Apartments | 118 | 8.8% |
| 3 or 4 Unit Apartments | 28 | 2.1% |
| 5 to 9 Unit Apartments | 52 | 3.9% |
| 10 or more Apartments | 86 | 6.4% |
| Mobile Home / Other | 23 | 1.7% |
| Total | 1,343 | 100.0% |
Housing Structures by Occupancy in Algoma
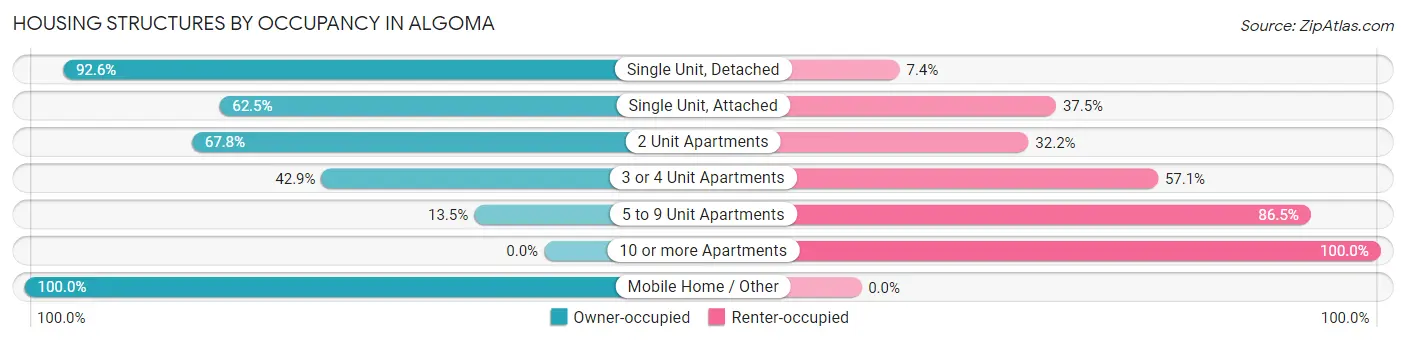
| Structure Type | Owner-occupied | Renter-occupied |
| Single Unit, Detached | 952 (92.6%) | 76 (7.4%) |
| Single Unit, Attached | 5 (62.5%) | 3 (37.5%) |
| 2 Unit Apartments | 80 (67.8%) | 38 (32.2%) |
| 3 or 4 Unit Apartments | 12 (42.9%) | 16 (57.1%) |
| 5 to 9 Unit Apartments | 7 (13.5%) | 45 (86.5%) |
| 10 or more Apartments | 0 (0.0%) | 86 (100.0%) |
| Mobile Home / Other | 23 (100.0%) | 0 (0.0%) |
| Total | 1,079 (80.3%) | 264 (19.7%) |
Housing Structures by Number of Rooms in Algoma
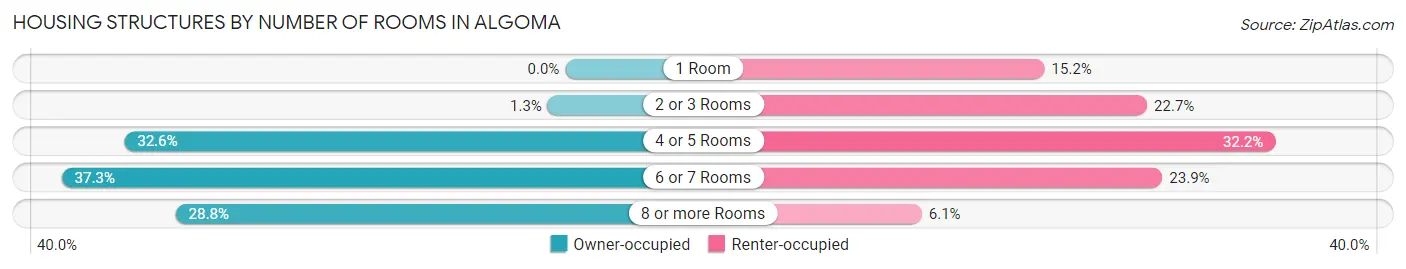
| Number of Rooms | Owner-occupied | Renter-occupied |
| 1 Room | 0 (0.0%) | 40 (15.1%) |
| 2 or 3 Rooms | 14 (1.3%) | 60 (22.7%) |
| 4 or 5 Rooms | 352 (32.6%) | 85 (32.2%) |
| 6 or 7 Rooms | 402 (37.3%) | 63 (23.9%) |
| 8 or more Rooms | 311 (28.8%) | 16 (6.1%) |
| Total | 1,079 (100.0%) | 264 (100.0%) |
Housing Structure by Heating Type in Algoma
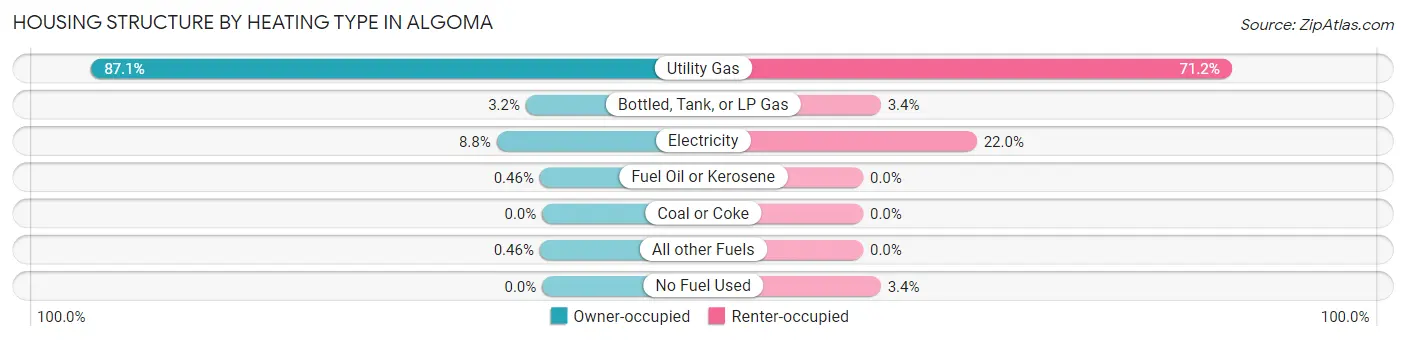
| Heating Type | Owner-occupied | Renter-occupied |
| Utility Gas | 940 (87.1%) | 188 (71.2%) |
| Bottled, Tank, or LP Gas | 34 (3.2%) | 9 (3.4%) |
| Electricity | 95 (8.8%) | 58 (22.0%) |
| Fuel Oil or Kerosene | 5 (0.5%) | 0 (0.0%) |
| Coal or Coke | 0 (0.0%) | 0 (0.0%) |
| All other Fuels | 5 (0.5%) | 0 (0.0%) |
| No Fuel Used | 0 (0.0%) | 9 (3.4%) |
| Total | 1,079 (100.0%) | 264 (100.0%) |
Household Vehicle Usage in Algoma
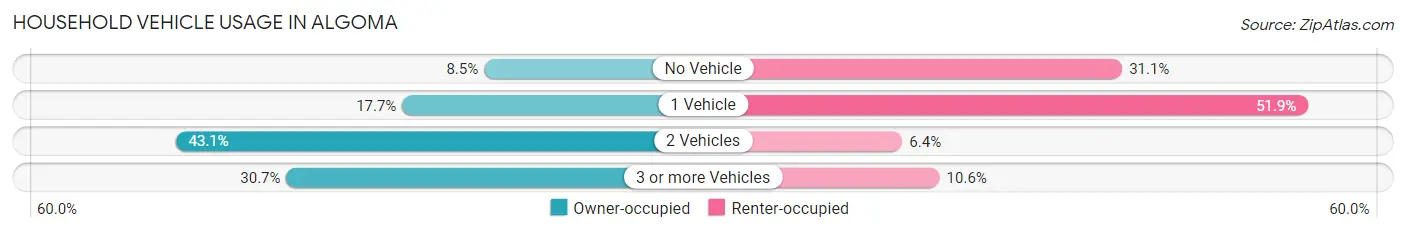
| Vehicles per Household | Owner-occupied | Renter-occupied |
| No Vehicle | 92 (8.5%) | 82 (31.1%) |
| 1 Vehicle | 191 (17.7%) | 137 (51.9%) |
| 2 Vehicles | 465 (43.1%) | 17 (6.4%) |
| 3 or more Vehicles | 331 (30.7%) | 28 (10.6%) |
| Total | 1,079 (100.0%) | 264 (100.0%) |
Real Estate & Mortgages in Algoma
Real Estate and Mortgage Overview in Algoma
| Characteristic | Without Mortgage | With Mortgage |
| Housing Units | 422 | 657 |
| Median Property Value | $108,300 | $129,000 |
| Median Household Income | $64,808 | $46 |
| Monthly Housing Costs | $535 | $0 |
| Real Estate Taxes | $2,343 | $6 |
Property Value by Mortgage Status in Algoma
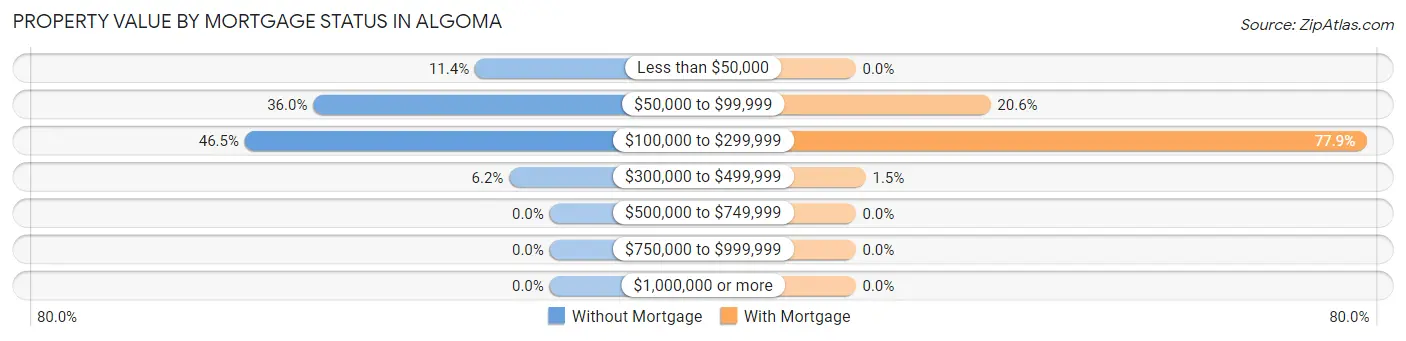
| Property Value | Without Mortgage | With Mortgage |
| Less than $50,000 | 48 (11.4%) | 0 (0.0%) |
| $50,000 to $99,999 | 152 (36.0%) | 135 (20.5%) |
| $100,000 to $299,999 | 196 (46.5%) | 512 (77.9%) |
| $300,000 to $499,999 | 26 (6.2%) | 10 (1.5%) |
| $500,000 to $749,999 | 0 (0.0%) | 0 (0.0%) |
| $750,000 to $999,999 | 0 (0.0%) | 0 (0.0%) |
| $1,000,000 or more | 0 (0.0%) | 0 (0.0%) |
| Total | 422 (100.0%) | 657 (100.0%) |
Household Income by Mortgage Status in Algoma
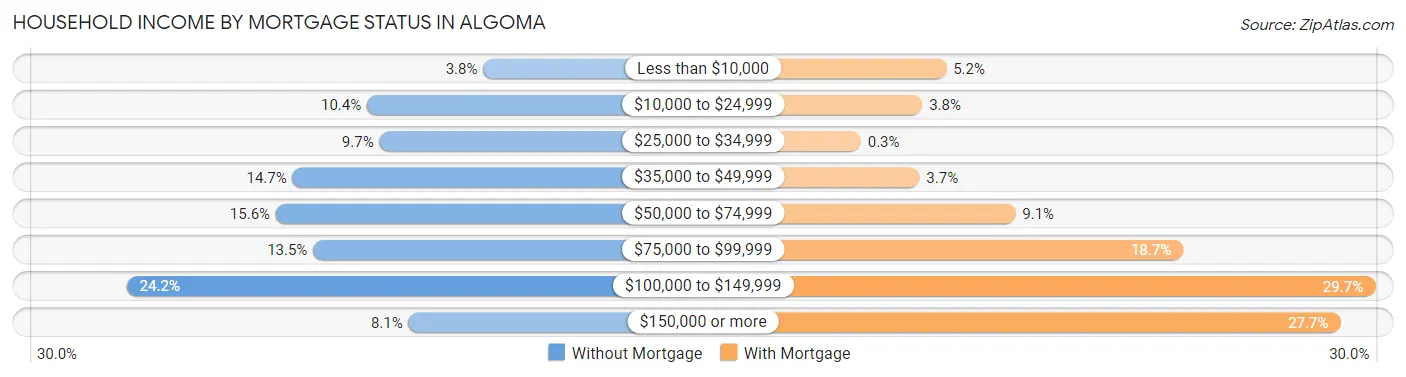
| Household Income | Without Mortgage | With Mortgage |
| Less than $10,000 | 16 (3.8%) | 34 (5.2%) |
| $10,000 to $24,999 | 44 (10.4%) | 25 (3.8%) |
| $25,000 to $34,999 | 41 (9.7%) | 2 (0.3%) |
| $35,000 to $49,999 | 62 (14.7%) | 24 (3.6%) |
| $50,000 to $74,999 | 66 (15.6%) | 60 (9.1%) |
| $75,000 to $99,999 | 57 (13.5%) | 123 (18.7%) |
| $100,000 to $149,999 | 102 (24.2%) | 195 (29.7%) |
| $150,000 or more | 34 (8.1%) | 182 (27.7%) |
| Total | 422 (100.0%) | 657 (100.0%) |
Property Value to Household Income Ratio in Algoma
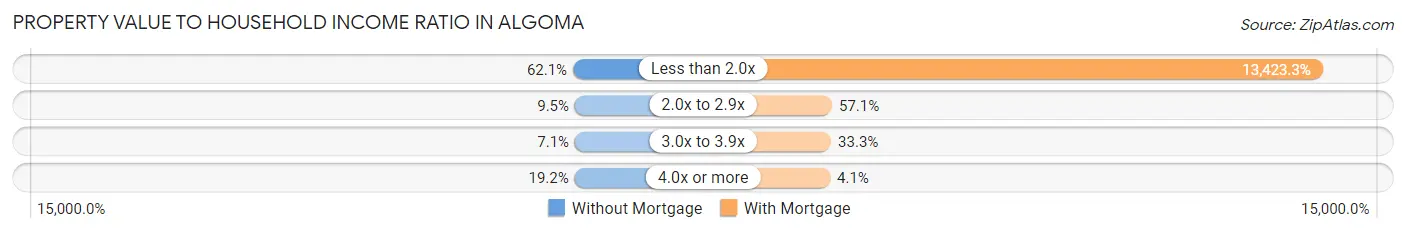
| Value-to-Income Ratio | Without Mortgage | With Mortgage |
| Less than 2.0x | 262 (62.1%) | 88,191 (13,423.3%) |
| 2.0x to 2.9x | 40 (9.5%) | 375 (57.1%) |
| 3.0x to 3.9x | 30 (7.1%) | 219 (33.3%) |
| 4.0x or more | 81 (19.2%) | 27 (4.1%) |
| Total | 422 (100.0%) | 657 (100.0%) |
Real Estate Taxes by Mortgage Status in Algoma
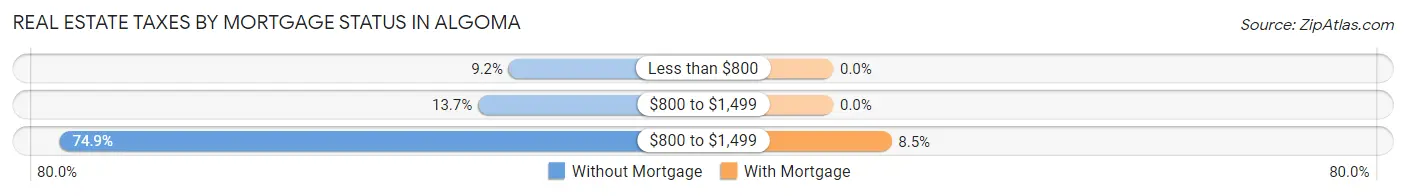
| Property Taxes | Without Mortgage | With Mortgage |
| Less than $800 | 39 (9.2%) | 0 (0.0%) |
| $800 to $1,499 | 58 (13.7%) | 0 (0.0%) |
| $800 to $1,499 | 316 (74.9%) | 56 (8.5%) |
| Total | 422 (100.0%) | 657 (100.0%) |
Health & Disability in Algoma
Health Insurance Coverage by Age in Algoma
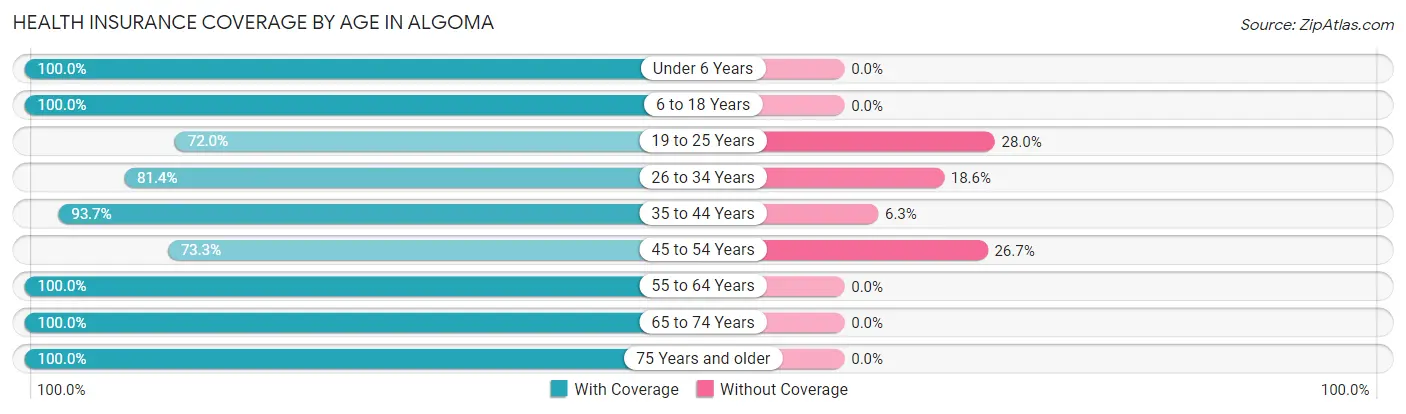
| Age Bracket | With Coverage | Without Coverage |
| Under 6 Years | 188 (100.0%) | 0 (0.0%) |
| 6 to 18 Years | 548 (100.0%) | 0 (0.0%) |
| 19 to 25 Years | 167 (72.0%) | 65 (28.0%) |
| 26 to 34 Years | 215 (81.4%) | 49 (18.6%) |
| 35 to 44 Years | 328 (93.7%) | 22 (6.3%) |
| 45 to 54 Years | 258 (73.3%) | 94 (26.7%) |
| 55 to 64 Years | 509 (100.0%) | 0 (0.0%) |
| 65 to 74 Years | 417 (100.0%) | 0 (0.0%) |
| 75 Years and older | 328 (100.0%) | 0 (0.0%) |
| Total | 2,958 (92.8%) | 230 (7.2%) |
Health Insurance Coverage by Citizenship Status in Algoma
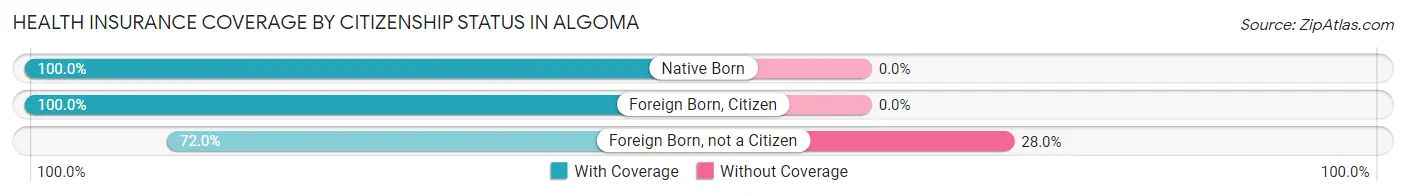
| Citizenship Status | With Coverage | Without Coverage |
| Native Born | 188 (100.0%) | 0 (0.0%) |
| Foreign Born, Citizen | 548 (100.0%) | 0 (0.0%) |
| Foreign Born, not a Citizen | 167 (72.0%) | 65 (28.0%) |
Health Insurance Coverage by Household Income in Algoma
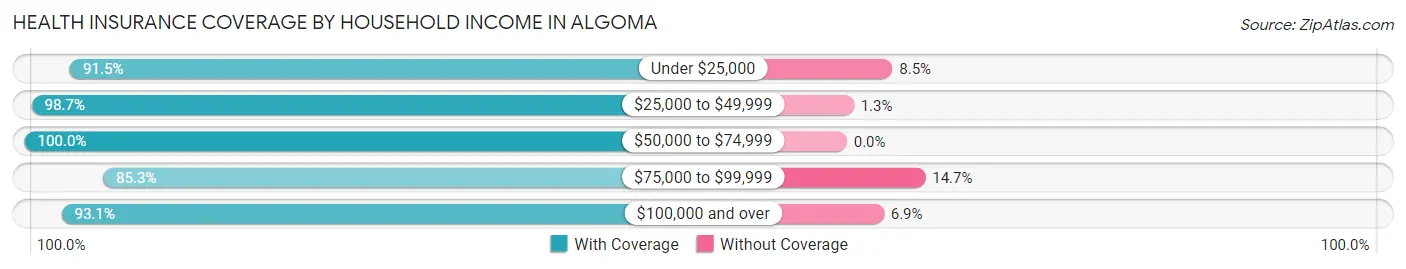
| Household Income | With Coverage | Without Coverage |
| Under $25,000 | 332 (91.5%) | 31 (8.5%) |
| $25,000 to $49,999 | 380 (98.7%) | 5 (1.3%) |
| $50,000 to $74,999 | 491 (100.0%) | 0 (0.0%) |
| $75,000 to $99,999 | 644 (85.3%) | 111 (14.7%) |
| $100,000 and over | 1,102 (93.1%) | 82 (6.9%) |
Public vs Private Health Insurance Coverage by Age in Algoma
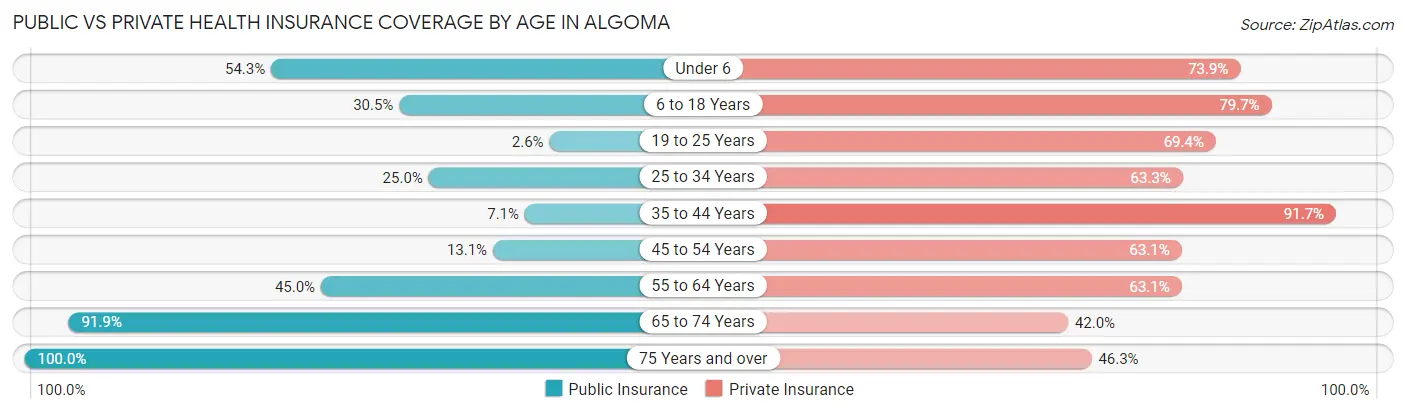
| Age Bracket | Public Insurance | Private Insurance |
| Under 6 | 102 (54.3%) | 139 (73.9%) |
| 6 to 18 Years | 167 (30.5%) | 437 (79.7%) |
| 19 to 25 Years | 6 (2.6%) | 161 (69.4%) |
| 25 to 34 Years | 66 (25.0%) | 167 (63.3%) |
| 35 to 44 Years | 25 (7.1%) | 321 (91.7%) |
| 45 to 54 Years | 46 (13.1%) | 222 (63.1%) |
| 55 to 64 Years | 229 (45.0%) | 321 (63.1%) |
| 65 to 74 Years | 383 (91.8%) | 175 (42.0%) |
| 75 Years and over | 328 (100.0%) | 152 (46.3%) |
| Total | 1,352 (42.4%) | 2,095 (65.7%) |
Disability Status by Sex by Age in Algoma
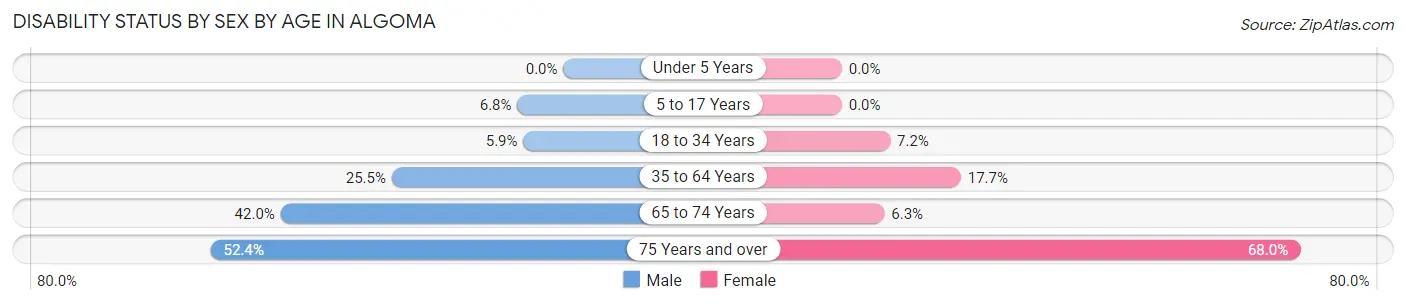
| Age Bracket | Male | Female |
| Under 5 Years | 0 (0.0%) | 0 (0.0%) |
| 5 to 17 Years | 20 (6.8%) | 0 (0.0%) |
| 18 to 34 Years | 18 (5.9%) | 20 (7.2%) |
| 35 to 64 Years | 160 (25.5%) | 103 (17.7%) |
| 65 to 74 Years | 102 (42.0%) | 11 (6.3%) |
| 75 Years and over | 44 (52.4%) | 166 (68.0%) |
Disability Class by Sex by Age in Algoma
Disability Class: Hearing Difficulty
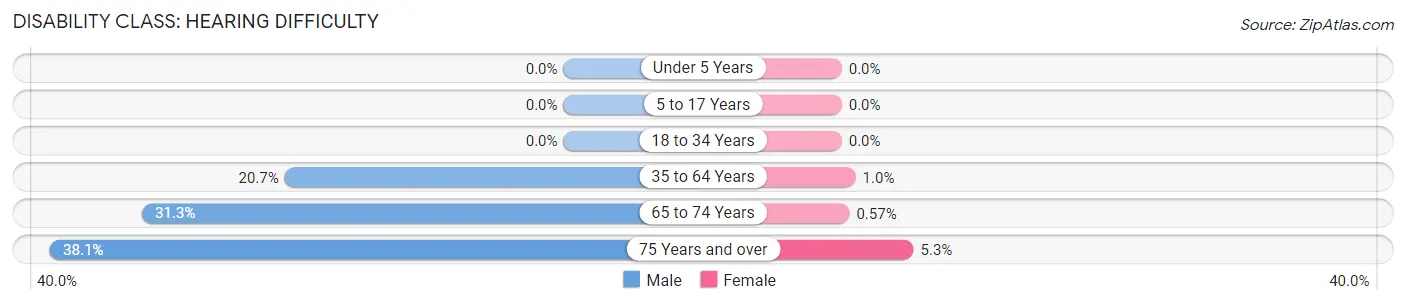
| Age Bracket | Male | Female |
| Under 5 Years | 0 (0.0%) | 0 (0.0%) |
| 5 to 17 Years | 0 (0.0%) | 0 (0.0%) |
| 18 to 34 Years | 0 (0.0%) | 0 (0.0%) |
| 35 to 64 Years | 130 (20.7%) | 6 (1.0%) |
| 65 to 74 Years | 76 (31.3%) | 1 (0.6%) |
| 75 Years and over | 32 (38.1%) | 13 (5.3%) |
Disability Class: Vision Difficulty
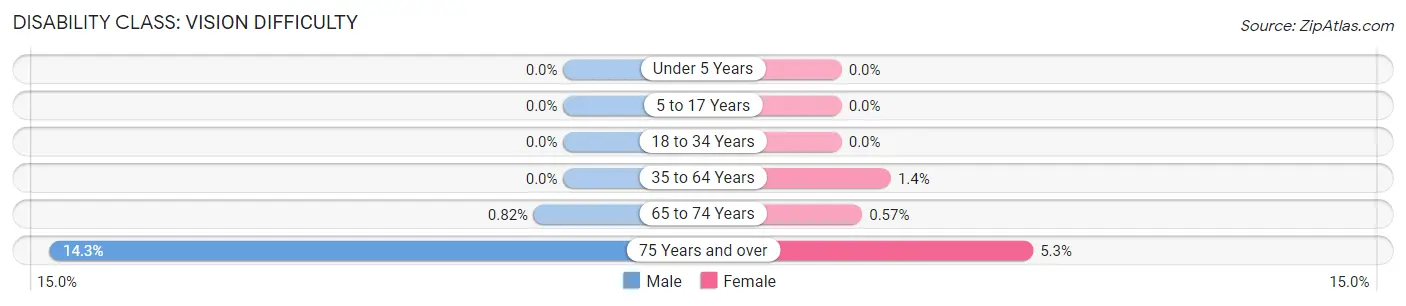
| Age Bracket | Male | Female |
| Under 5 Years | 0 (0.0%) | 0 (0.0%) |
| 5 to 17 Years | 0 (0.0%) | 0 (0.0%) |
| 18 to 34 Years | 0 (0.0%) | 0 (0.0%) |
| 35 to 64 Years | 0 (0.0%) | 8 (1.4%) |
| 65 to 74 Years | 2 (0.8%) | 1 (0.6%) |
| 75 Years and over | 12 (14.3%) | 13 (5.3%) |
Disability Class: Cognitive Difficulty
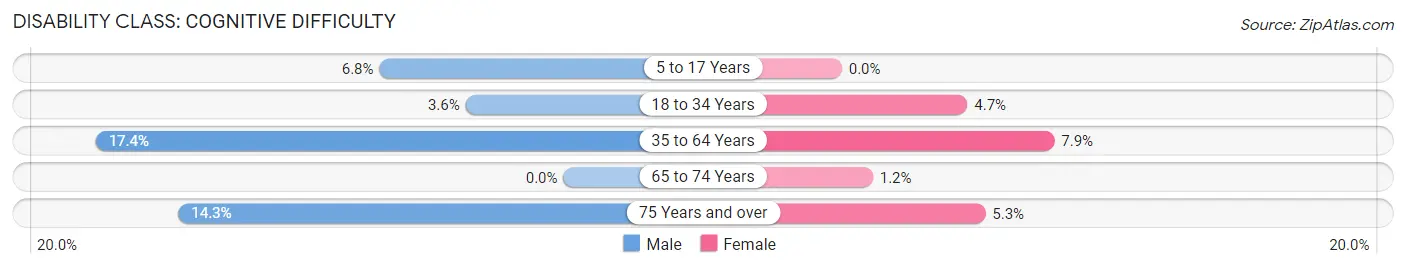
| Age Bracket | Male | Female |
| 5 to 17 Years | 20 (6.8%) | 0 (0.0%) |
| 18 to 34 Years | 11 (3.6%) | 13 (4.7%) |
| 35 to 64 Years | 109 (17.4%) | 46 (7.9%) |
| 65 to 74 Years | 0 (0.0%) | 2 (1.1%) |
| 75 Years and over | 12 (14.3%) | 13 (5.3%) |
Disability Class: Ambulatory Difficulty
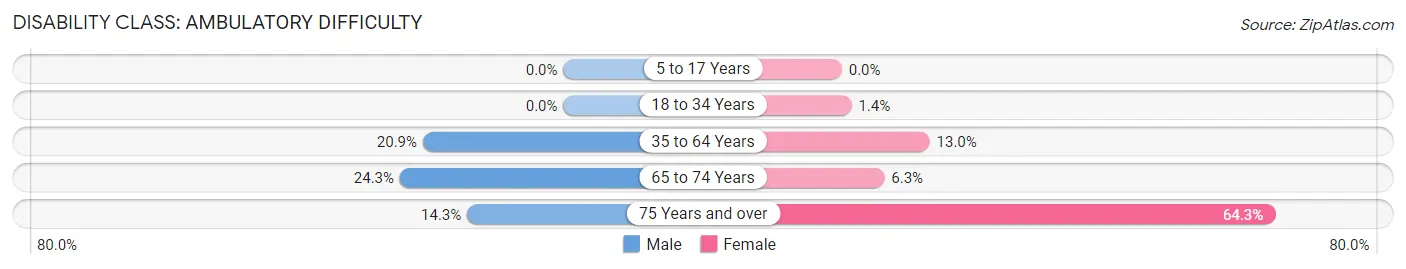
| Age Bracket | Male | Female |
| 5 to 17 Years | 0 (0.0%) | 0 (0.0%) |
| 18 to 34 Years | 0 (0.0%) | 4 (1.4%) |
| 35 to 64 Years | 131 (20.9%) | 76 (13.0%) |
| 65 to 74 Years | 59 (24.3%) | 11 (6.3%) |
| 75 Years and over | 12 (14.3%) | 157 (64.3%) |
Disability Class: Self-Care Difficulty
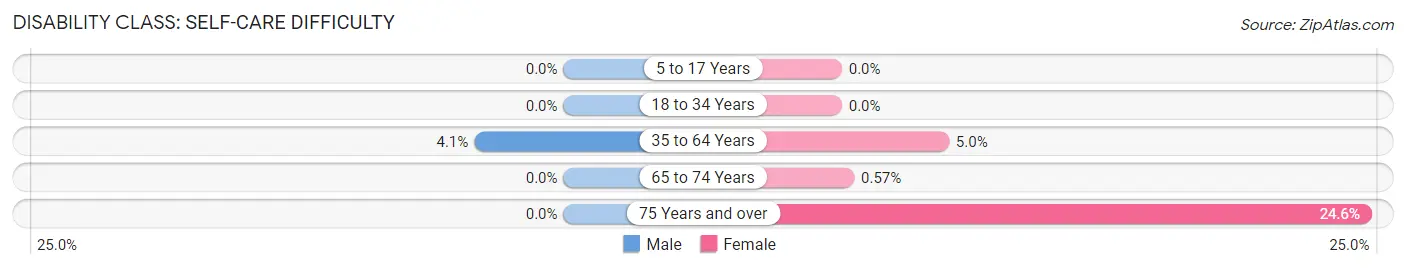
| Age Bracket | Male | Female |
| 5 to 17 Years | 0 (0.0%) | 0 (0.0%) |
| 18 to 34 Years | 0 (0.0%) | 0 (0.0%) |
| 35 to 64 Years | 26 (4.1%) | 29 (5.0%) |
| 65 to 74 Years | 0 (0.0%) | 1 (0.6%) |
| 75 Years and over | 0 (0.0%) | 60 (24.6%) |
Technology Access in Algoma
Computing Device Access in Algoma
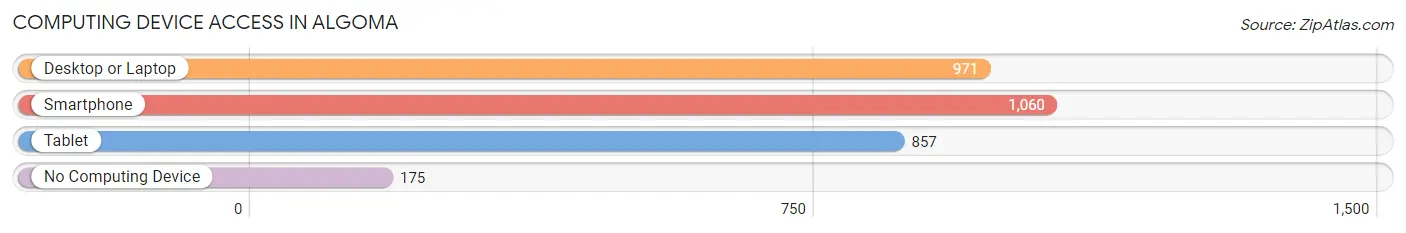
| Device Type | # Households | % Households |
| Desktop or Laptop | 971 | 72.3% |
| Smartphone | 1,060 | 78.9% |
| Tablet | 857 | 63.8% |
| No Computing Device | 175 | 13.0% |
| Total | 1,343 | 100.0% |
Internet Access in Algoma
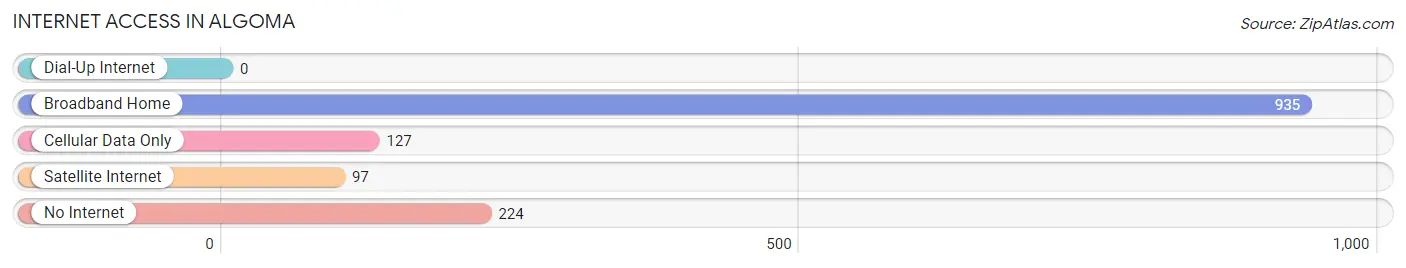
| Internet Type | # Households | % Households |
| Dial-Up Internet | 0 | 0.0% |
| Broadband Home | 935 | 69.6% |
| Cellular Data Only | 127 | 9.5% |
| Satellite Internet | 97 | 7.2% |
| No Internet | 224 | 16.7% |
| Total | 1,343 | 100.0% |
Algoma Summary
Algoma, Wisconsin is a city located in Kewaunee County, Wisconsin, United States. The population was 3,167 at the 2010 census. It is located on the shores of Lake Michigan, and is part of the Green Bay Metropolitan Statistical Area.
History
Algoma was founded in 1851 by a group of German immigrants. The city was named after the Algoma region of Canada, which was named after the Algonquin word for “lake.” The city was originally a fishing village, and the first settlers were mostly fishermen and farmers. The city was incorporated in 1872.
In the late 19th century, Algoma became a popular tourist destination, and the city was known for its beautiful beaches and resorts. The city was also home to a number of factories, including a canning factory, a brickyard, and a sawmill.
In the early 20th century, Algoma experienced a period of growth and prosperity. The city was home to a number of businesses, including a bank, a hotel, a movie theater, and a number of stores. The city also had a number of churches, including a Catholic church, a Lutheran church, and a Methodist church.
In the 1950s, Algoma experienced a period of decline. The city’s factories closed, and the population began to decline. In the 1970s, the city began to experience a period of revitalization, and the population began to increase.
Geography
Algoma is located at 44°37′N 87°37′W (44.619, -87.619). According to the United States Census Bureau, the city has a total area of 2.2 square miles (5.7 km2), all of it land.
The city is located on the shores of Lake Michigan, and is part of the Green Bay Metropolitan Statistical Area. The city is located near the cities of Kewaunee and Sturgeon Bay.
Economy
Algoma’s economy is largely based on tourism and fishing. The city is home to a number of resorts and hotels, as well as a number of restaurants and bars. The city is also home to a number of retail stores, including a grocery store, a hardware store, and a number of specialty shops.
The city is also home to a number of manufacturing companies, including a canning factory, a brickyard, and a sawmill. The city is also home to a number of businesses, including a bank, a hotel, a movie theater, and a number of stores.
Demographics
As of the 2010 census, there were 3,167 people, 1,323 households, and 845 families residing in the city. The population density was 1,427.2 people per square mile (550.7/km2). There were 1,521 housing units at an average density of 686.2 per square mile (265.2/km2). The racial makeup of the city was 97.2% White, 0.3% African American, 0.3% Native American, 0.4% Asian, 0.1% Pacific Islander, 0.7% from other races, and 0.9% from two or more races. Hispanic or Latino of any race were 2.2% of the population.
There were 1,323 households, out of which 28.2% had children under the age of 18 living with them, 48.2% were married couples living together, 11.2% had a female householder with no husband present, and 36.2% were non-families. 32.2% of all households were made up of individuals, and 16.2% had someone living alone who was 65 years of age or older. The average household size was 2.35 and the average family size was 2.94.
In the city, the population was spread out, with 24.2% under the age of 18, 7.2% from 18 to 24, 25.2% from 25 to 44, 22.2% from 45 to 64, and 21.2% who were 65 years of age or older. The median age was 40 years. For every 100 females, there were 91.2 males. For every 100 females age 18 and over, there were 87.2 males.
The median income for a household in the city was $37,917, and the median income for a family was $45,938. Males had a median income of $31,964 versus $22,917 for females. The per capita income for the city was $19,945. About 6.2% of families and 8.2% of the population were below the poverty line, including 10.2% of those under age 18 and 8.2% of those age 65 or over.
Common Questions
What is Per Capita Income in Algoma?
Per Capita income in Algoma is $32,802.
What is the Median Family Income in Algoma?
Median Family Income in Algoma is $88,840.
What is the Median Household income in Algoma?
Median Household Income in Algoma is $72,232.
What is Income or Wage Gap in Algoma?
Income or Wage Gap in Algoma is 27.3%.
Women in Algoma earn 72.7 cents for every dollar earned by a man.
What is Family Income Deficit in Algoma?
Family Income Deficit in Algoma is $15,828.
Families that are below poverty line in Algoma earn $15,828 less on average than the poverty threshold level.
What is Inequality or Gini Index in Algoma?
Inequality or Gini Index in Algoma is 0.37.
What is the Total Population of Algoma?
Total Population of Algoma is 3,227.
What is the Total Male Population of Algoma?
Total Male Population of Algoma is 1,642.
What is the Total Female Population of Algoma?
Total Female Population of Algoma is 1,585.
What is the Ratio of Males per 100 Females in Algoma?
There are 103.60 Males per 100 Females in Algoma.
What is the Ratio of Females per 100 Males in Algoma?
There are 96.53 Females per 100 Males in Algoma.
What is the Median Population Age in Algoma?
Median Population Age in Algoma is 45.7 Years.
What is the Average Family Size in Algoma
Average Family Size in Algoma is 2.9 People.
What is the Average Household Size in Algoma
Average Household Size in Algoma is 2.4 People.
How Large is the Labor Force in Algoma?
There are 1,513 People in the Labor Forcein in Algoma.
What is the Percentage of People in the Labor Force in Algoma?
57.3% of People are in the Labor Force in Algoma.
What is the Unemployment Rate in Algoma?
Unemployment Rate in Algoma is 3.6%.