Abrams, WI Map & Demographics
Abrams Map
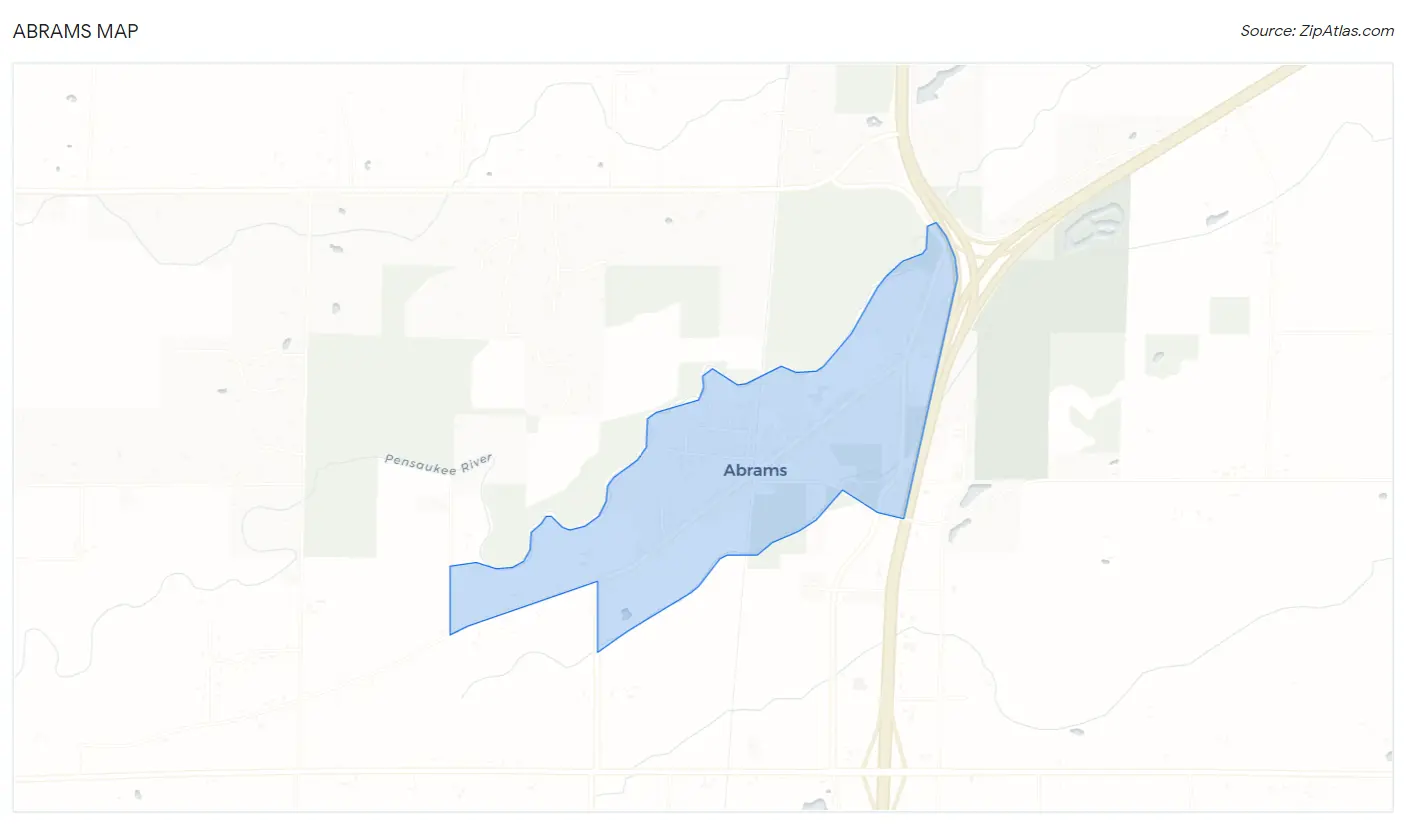
Abrams Overview
$35,230
PER CAPITA INCOME
$92,083
AVG FAMILY INCOME
$88,542
AVG HOUSEHOLD INCOME
32.2%
WAGE / INCOME GAP [ % ]
67.8¢/ $1
WAGE / INCOME GAP [ $ ]
0.33
INEQUALITY / GINI INDEX
282
TOTAL POPULATION
130
MALE POPULATION
152
FEMALE POPULATION
85.53
MALES / 100 FEMALES
116.92
FEMALES / 100 MALES
37.8
MEDIAN AGE
2.9
AVG FAMILY SIZE
2.6
AVG HOUSEHOLD SIZE
177
LABOR FORCE [ PEOPLE ]
76.6%
PERCENT IN LABOR FORCE
3.4%
UNEMPLOYMENT RATE
Abrams Zip Codes
Abrams Area Codes
Income in Abrams
Income Overview in Abrams
Per Capita Income in Abrams is $35,230, while median incomes of families and households are $92,083 and $88,542 respectively.
| Characteristic | Number | Measure |
| Per Capita Income | 282 | $35,230 |
| Median Family Income | 85 | $92,083 |
| Mean Family Income | 85 | $97,815 |
| Median Household Income | 109 | $88,542 |
| Mean Household Income | 109 | $89,378 |
| Income Deficit | 85 | $0 |
| Wage / Income Gap (%) | 282 | 32.20% |
| Wage / Income Gap ($) | 282 | 67.80¢ per $1 |
| Gini / Inequality Index | 282 | 0.33 |
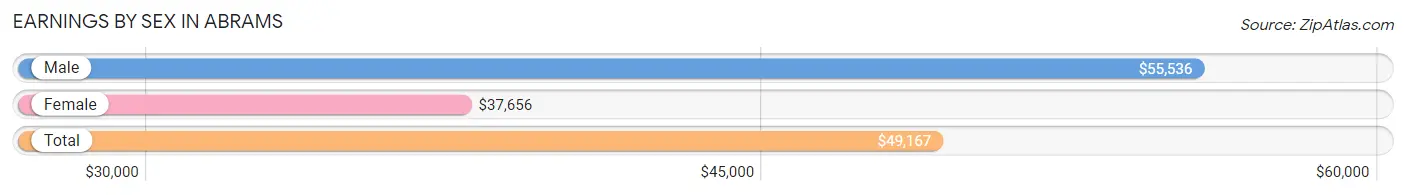
Earnings by Sex in Abrams
Average Earnings in Abrams are $49,167, $55,536 for men and $37,656 for women, a difference of 32.2%.
| Sex | Number | Average Earnings |
| Male | 89 (49.4%) | $55,536 |
| Female | 91 (50.6%) | $37,656 |
| Total | 180 (100.0%) | $49,167 |
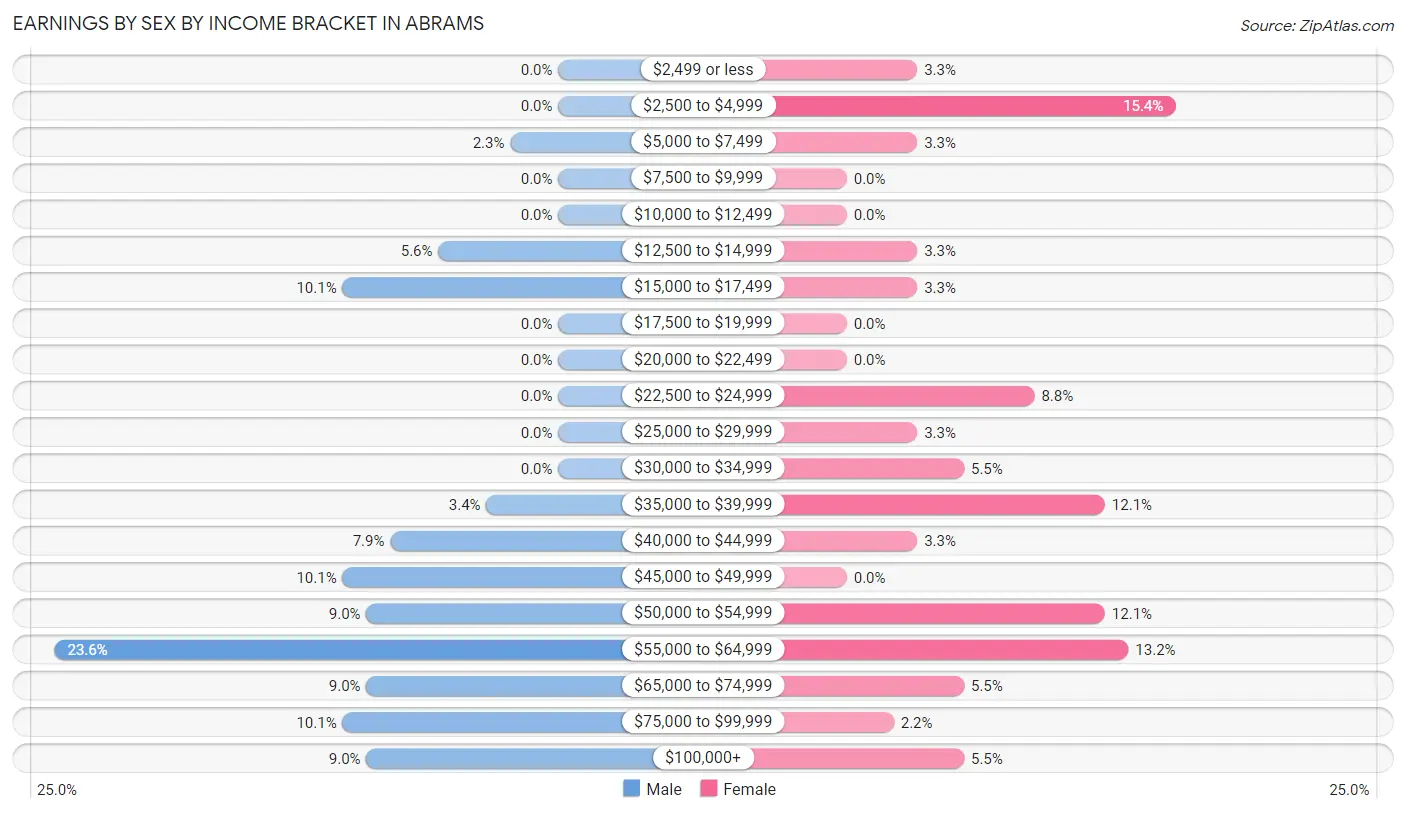
Earnings by Sex by Income Bracket in Abrams
The most common earnings brackets in Abrams are $55,000 to $64,999 for men (21 | 23.6%) and $2,500 to $4,999 for women (14 | 15.4%).
| Income | Male | Female |
| $2,499 or less | 0 (0.0%) | 3 (3.3%) |
| $2,500 to $4,999 | 0 (0.0%) | 14 (15.4%) |
| $5,000 to $7,499 | 2 (2.2%) | 3 (3.3%) |
| $7,500 to $9,999 | 0 (0.0%) | 0 (0.0%) |
| $10,000 to $12,499 | 0 (0.0%) | 0 (0.0%) |
| $12,500 to $14,999 | 5 (5.6%) | 3 (3.3%) |
| $15,000 to $17,499 | 9 (10.1%) | 3 (3.3%) |
| $17,500 to $19,999 | 0 (0.0%) | 0 (0.0%) |
| $20,000 to $22,499 | 0 (0.0%) | 0 (0.0%) |
| $22,500 to $24,999 | 0 (0.0%) | 8 (8.8%) |
| $25,000 to $29,999 | 0 (0.0%) | 3 (3.3%) |
| $30,000 to $34,999 | 0 (0.0%) | 5 (5.5%) |
| $35,000 to $39,999 | 3 (3.4%) | 11 (12.1%) |
| $40,000 to $44,999 | 7 (7.9%) | 3 (3.3%) |
| $45,000 to $49,999 | 9 (10.1%) | 0 (0.0%) |
| $50,000 to $54,999 | 8 (9.0%) | 11 (12.1%) |
| $55,000 to $64,999 | 21 (23.6%) | 12 (13.2%) |
| $65,000 to $74,999 | 8 (9.0%) | 5 (5.5%) |
| $75,000 to $99,999 | 9 (10.1%) | 2 (2.2%) |
| $100,000+ | 8 (9.0%) | 5 (5.5%) |
| Total | 89 (100.0%) | 91 (100.0%) |
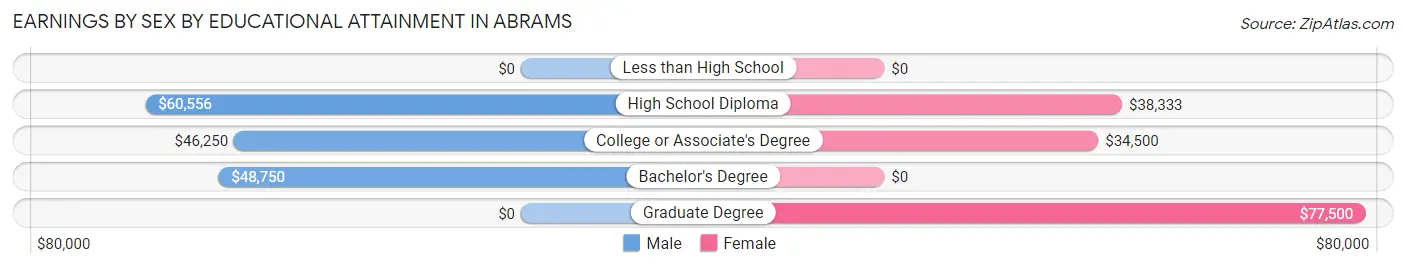
Earnings by Sex by Educational Attainment in Abrams
Average earnings in Abrams are $55,893 for men and $39,063 for women, a difference of 30.1%. Men with an educational attainment of high school diploma enjoy the highest average annual earnings of $60,556, while those with college or associate's degree education earn the least with $46,250. Women with an educational attainment of graduate degree earn the most with the average annual earnings of $77,500, while those with college or associate's degree education have the smallest earnings of $34,500.
| Educational Attainment | Male Income | Female Income |
| Less than High School | - | - |
| High School Diploma | $60,556 | $38,333 |
| College or Associate's Degree | $46,250 | $34,500 |
| Bachelor's Degree | $48,750 | $0 |
| Graduate Degree | - | - |
| Total | $55,893 | $39,063 |
Family Income in Abrams
Family Income Brackets in Abrams
According to the Abrams family income data, there are 26 families falling into the $75,000 to $99,999 income range, which is the most common income bracket and makes up 30.6% of all families.
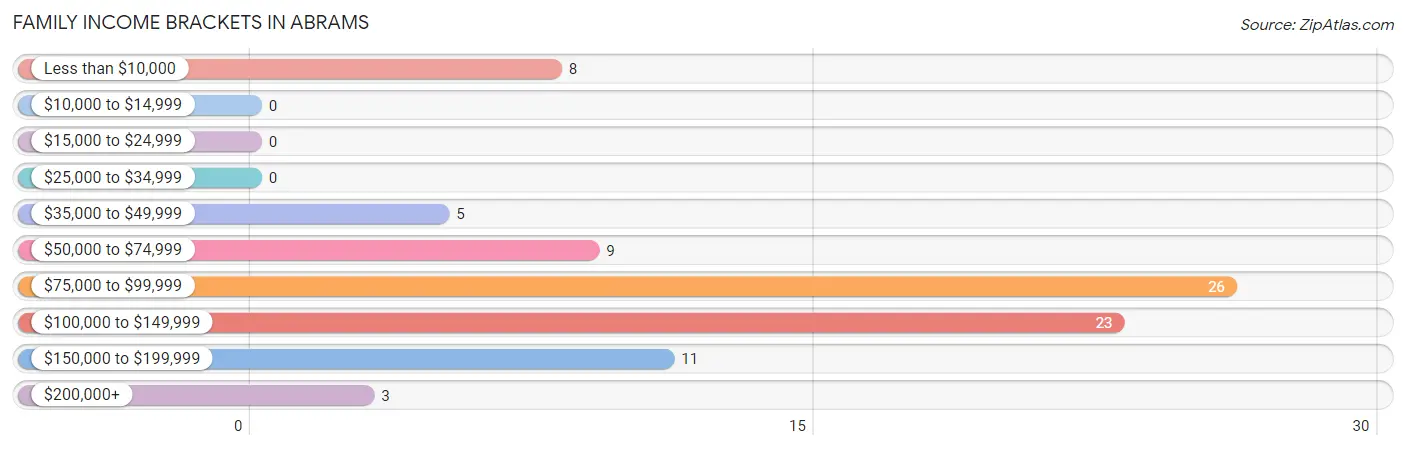
| Income Bracket | # Families | % Families |
| Less than $10,000 | 8 | 9.4% |
| $10,000 to $14,999 | 0 | 0.0% |
| $15,000 to $24,999 | 0 | 0.0% |
| $25,000 to $34,999 | 0 | 0.0% |
| $35,000 to $49,999 | 5 | 5.9% |
| $50,000 to $74,999 | 9 | 10.6% |
| $75,000 to $99,999 | 26 | 30.6% |
| $100,000 to $149,999 | 23 | 27.1% |
| $150,000 to $199,999 | 11 | 12.9% |
| $200,000+ | 3 | 3.5% |
Family Income by Famaliy Size in Abrams
4-person families (8 | 9.4%) account for the highest median family income in Abrams with $98,750 per family, while 2-person families (46 | 54.1%) have the highest median income of $44,375 per family member.
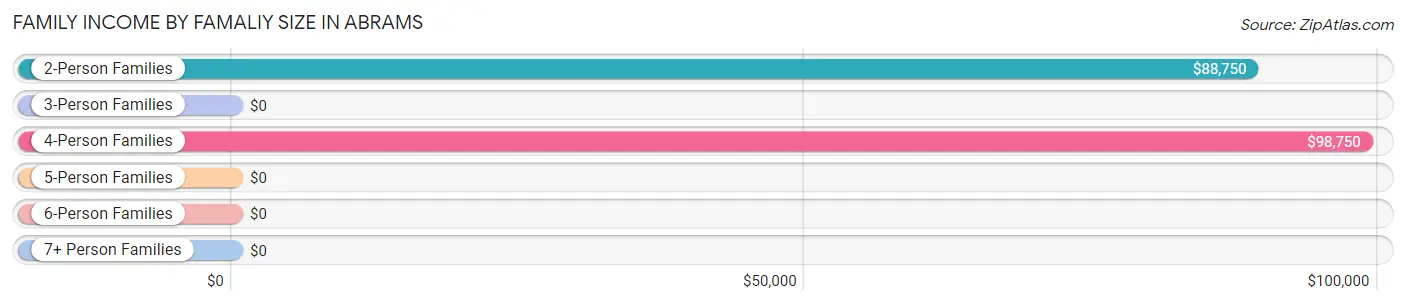
| Income Bracket | # Families | Median Income |
| 2-Person Families | 46 (54.1%) | $88,750 |
| 3-Person Families | 24 (28.2%) | $0 |
| 4-Person Families | 8 (9.4%) | $98,750 |
| 5-Person Families | 7 (8.2%) | $0 |
| 6-Person Families | 0 (0.0%) | $0 |
| 7+ Person Families | 0 (0.0%) | $0 |
| Total | 85 (100.0%) | $92,083 |
Family Income by Number of Earners in Abrams
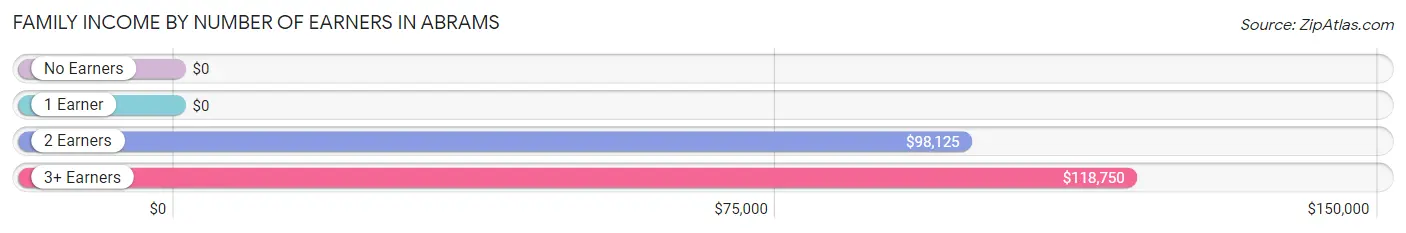
| Number of Earners | # Families | Median Income |
| No Earners | 3 (3.5%) | $0 |
| 1 Earner | 20 (23.5%) | $0 |
| 2 Earners | 53 (62.4%) | $98,125 |
| 3+ Earners | 9 (10.6%) | $118,750 |
| Total | 85 (100.0%) | $92,083 |
Household Income in Abrams
Household Income Brackets in Abrams
With 29 households falling in the category, the $100,000 to $149,999 income range is the most frequent in Abrams, accounting for 26.6% of all households. In contrast, only 2 households (1.8%) fall into the $10,000 to $14,999 income bracket, making it the least populous group.
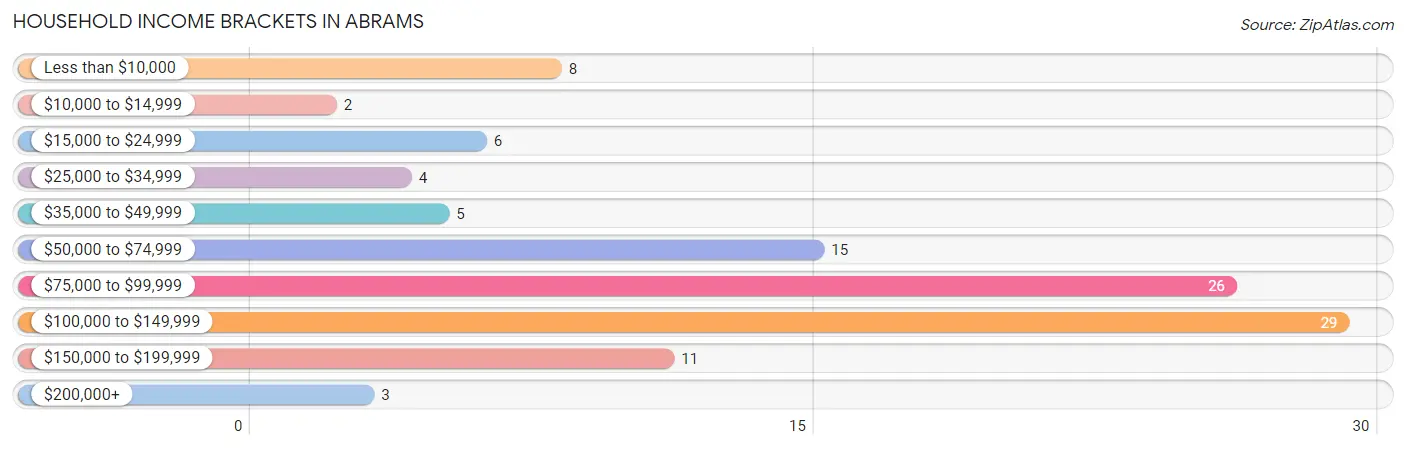
| Income Bracket | # Households | % Households |
| Less than $10,000 | 8 | 7.3% |
| $10,000 to $14,999 | 2 | 1.8% |
| $15,000 to $24,999 | 6 | 5.5% |
| $25,000 to $34,999 | 4 | 3.7% |
| $35,000 to $49,999 | 5 | 4.6% |
| $50,000 to $74,999 | 15 | 13.8% |
| $75,000 to $99,999 | 26 | 23.9% |
| $100,000 to $149,999 | 29 | 26.6% |
| $150,000 to $199,999 | 11 | 10.1% |
| $200,000+ | 3 | 2.8% |
Household Income by Householder Age in Abrams
The median household income in Abrams is $88,542, with the highest median household income of $115,833 found in the 45 to 64 years age bracket for the primary householder. A total of 46 households (42.2%) fall into this category.
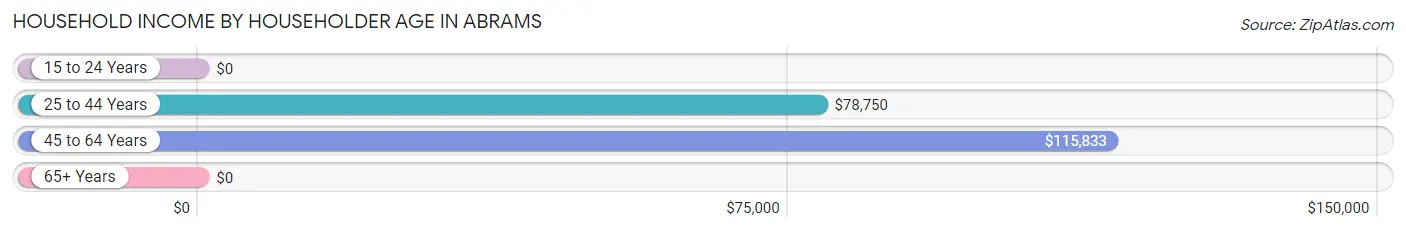
| Income Bracket | # Households | Median Income |
| 15 to 24 Years | 0 (0.0%) | $0 |
| 25 to 44 Years | 39 (35.8%) | $78,750 |
| 45 to 64 Years | 46 (42.2%) | $115,833 |
| 65+ Years | 24 (22.0%) | $0 |
| Total | 109 (100.0%) | $88,542 |
Poverty in Abrams
Income Below Poverty by Sex and Age in Abrams
With 6.1% poverty level for males and 22.4% for females among the residents of Abrams, 35 to 44 year old males and under 5 year old females are the most vulnerable to poverty, with 4 males (16.7%) and 9 females (100.0%) in their respective age groups living below the poverty level.
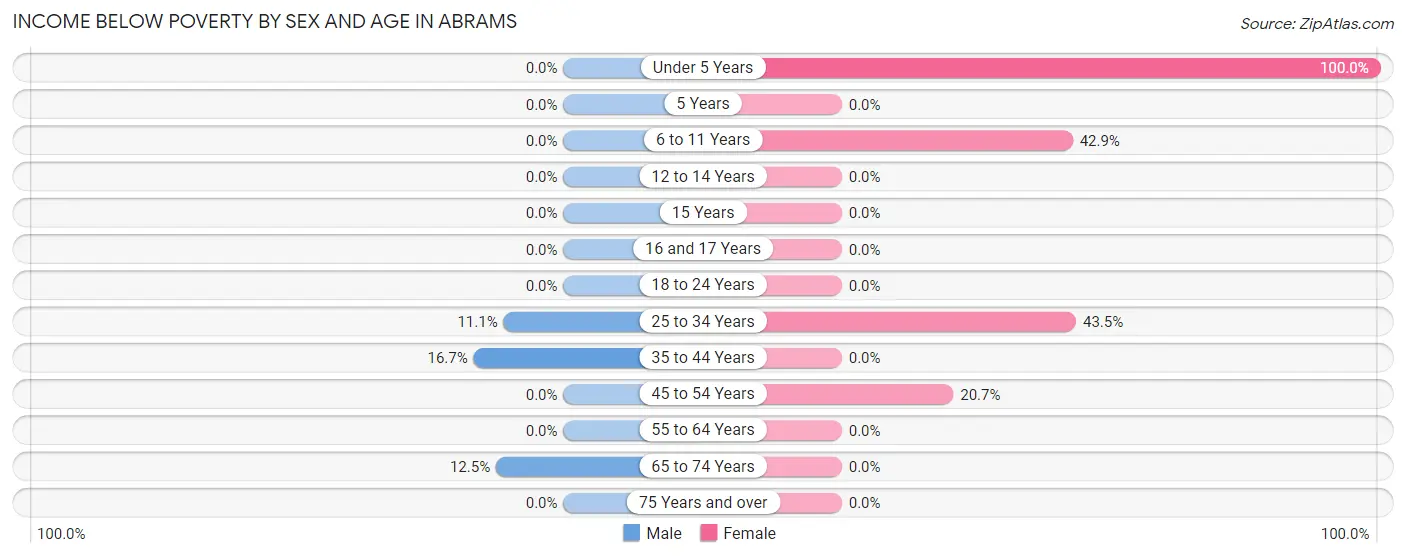
| Age Bracket | Male | Female |
| Under 5 Years | 0 (0.0%) | 9 (100.0%) |
| 5 Years | 0 (0.0%) | 0 (0.0%) |
| 6 to 11 Years | 0 (0.0%) | 9 (42.9%) |
| 12 to 14 Years | 0 (0.0%) | 0 (0.0%) |
| 15 Years | 0 (0.0%) | 0 (0.0%) |
| 16 and 17 Years | 0 (0.0%) | 0 (0.0%) |
| 18 to 24 Years | 0 (0.0%) | 0 (0.0%) |
| 25 to 34 Years | 2 (11.1%) | 10 (43.5%) |
| 35 to 44 Years | 4 (16.7%) | 0 (0.0%) |
| 45 to 54 Years | 0 (0.0%) | 6 (20.7%) |
| 55 to 64 Years | 0 (0.0%) | 0 (0.0%) |
| 65 to 74 Years | 2 (12.5%) | 0 (0.0%) |
| 75 Years and over | 0 (0.0%) | 0 (0.0%) |
| Total | 8 (6.1%) | 34 (22.4%) |
Income Above Poverty by Sex and Age in Abrams
According to the poverty statistics in Abrams, males aged 6 to 11 years and females aged 12 to 14 years are the age groups that are most secure financially, with 100.0% of males and 100.0% of females in these age groups living above the poverty line.
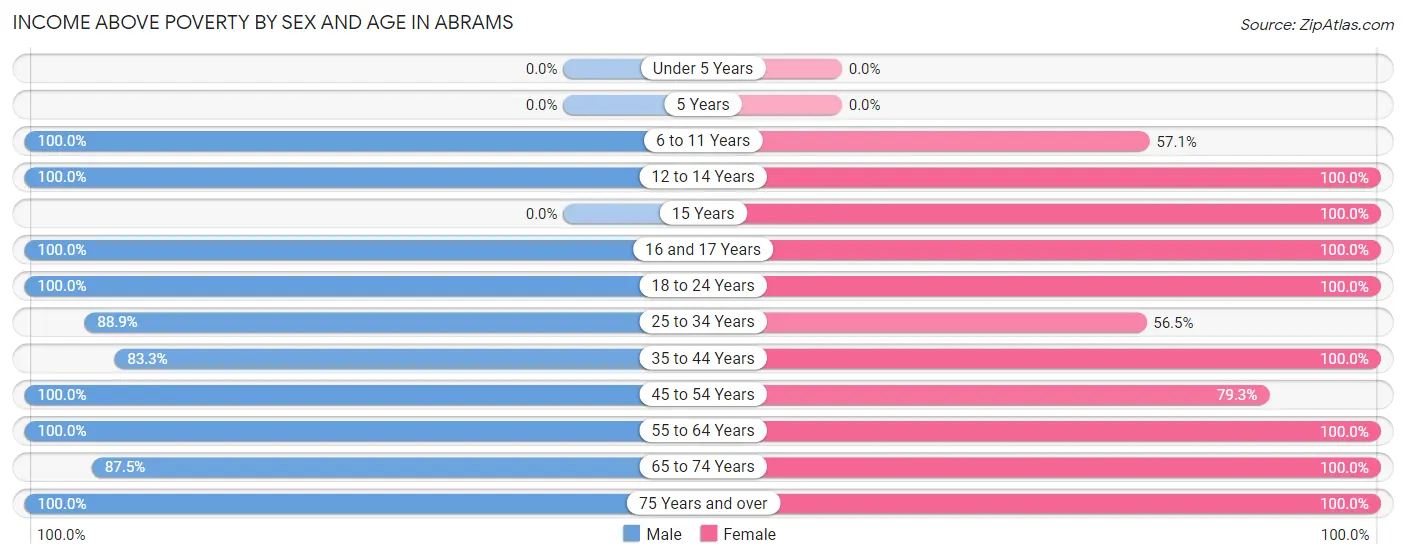
| Age Bracket | Male | Female |
| Under 5 Years | 0 (0.0%) | 0 (0.0%) |
| 5 Years | 0 (0.0%) | 0 (0.0%) |
| 6 to 11 Years | 10 (100.0%) | 12 (57.1%) |
| 12 to 14 Years | 2 (100.0%) | 5 (100.0%) |
| 15 Years | 0 (0.0%) | 4 (100.0%) |
| 16 and 17 Years | 12 (100.0%) | 3 (100.0%) |
| 18 to 24 Years | 2 (100.0%) | 6 (100.0%) |
| 25 to 34 Years | 16 (88.9%) | 13 (56.5%) |
| 35 to 44 Years | 20 (83.3%) | 22 (100.0%) |
| 45 to 54 Years | 24 (100.0%) | 23 (79.3%) |
| 55 to 64 Years | 21 (100.0%) | 11 (100.0%) |
| 65 to 74 Years | 14 (87.5%) | 12 (100.0%) |
| 75 Years and over | 1 (100.0%) | 7 (100.0%) |
| Total | 122 (93.9%) | 118 (77.6%) |
Income Below Poverty Among Married-Couple Families in Abrams
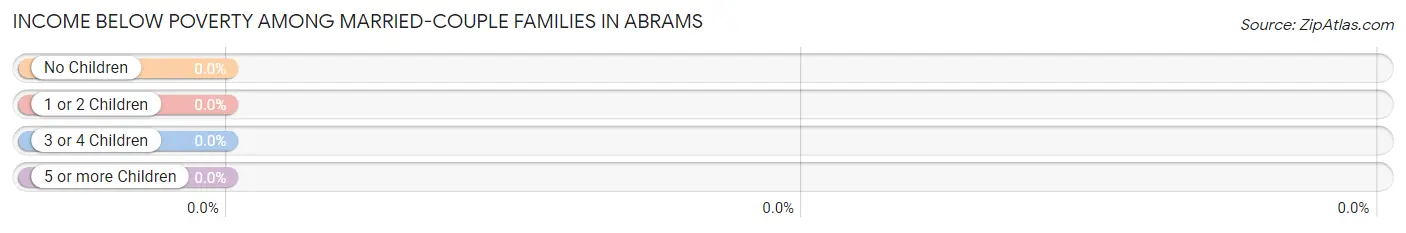
| Children | Above Poverty | Below Poverty |
| No Children | 50 (100.0%) | 0 (0.0%) |
| 1 or 2 Children | 7 (100.0%) | 0 (0.0%) |
| 3 or 4 Children | 7 (100.0%) | 0 (0.0%) |
| 5 or more Children | 0 (0.0%) | 0 (0.0%) |
| Total | 64 (100.0%) | 0 (0.0%) |
Income Below Poverty Among Single-Parent Households in Abrams
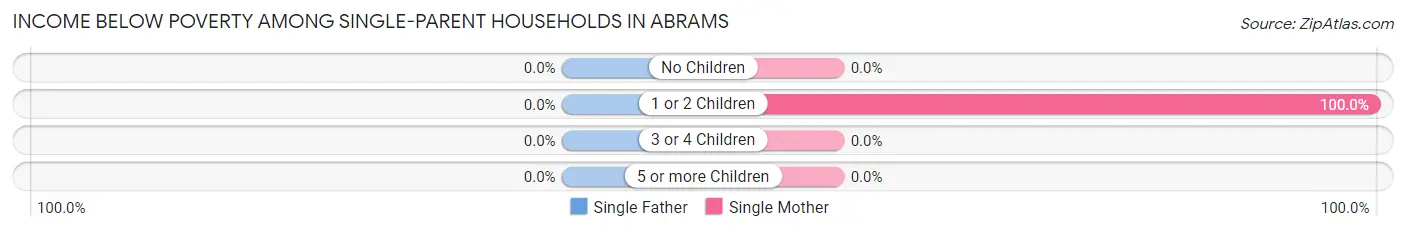
| Children | Single Father | Single Mother |
| No Children | 0 (0.0%) | 0 (0.0%) |
| 1 or 2 Children | 0 (0.0%) | 8 (100.0%) |
| 3 or 4 Children | 0 (0.0%) | 0 (0.0%) |
| 5 or more Children | 0 (0.0%) | 0 (0.0%) |
| Total | 0 (0.0%) | 8 (61.5%) |
Income Below Poverty Among Married-Couple vs Single-Parent Households in Abrams
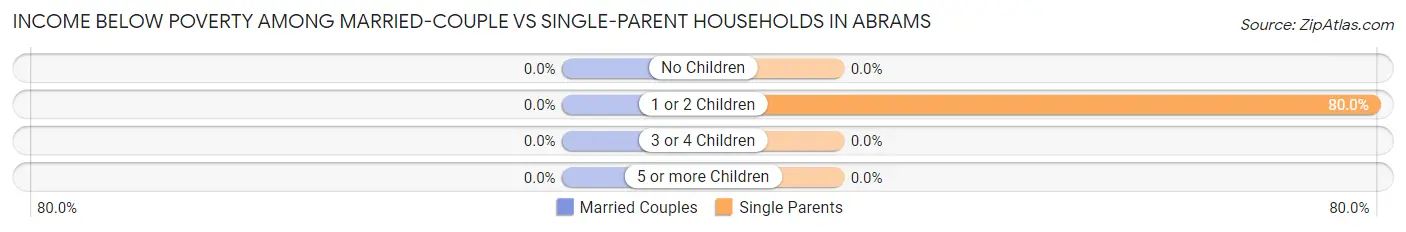
| Children | Married-Couple Families | Single-Parent Households |
| No Children | 0 (0.0%) | 0 (0.0%) |
| 1 or 2 Children | 0 (0.0%) | 8 (80.0%) |
| 3 or 4 Children | 0 (0.0%) | 0 (0.0%) |
| 5 or more Children | 0 (0.0%) | 0 (0.0%) |
| Total | 0 (0.0%) | 8 (38.1%) |
Race in Abrams
The most populous races in Abrams are White / Caucasian (281 | 99.7%), and Two or more Races (1 | 0.4%).
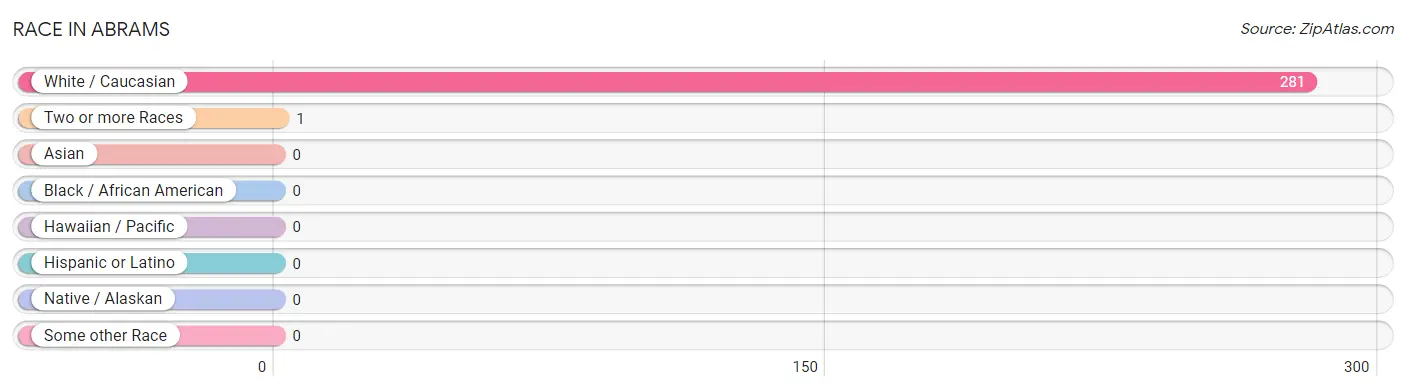
| Race | # Population | % Population |
| Asian | 0 | 0.0% |
| Black / African American | 0 | 0.0% |
| Hawaiian / Pacific | 0 | 0.0% |
| Hispanic or Latino | 0 | 0.0% |
| Native / Alaskan | 0 | 0.0% |
| White / Caucasian | 281 | 99.7% |
| Two or more Races | 1 | 0.4% |
| Some other Race | 0 | 0.0% |
| Total | 282 | 100.0% |
Ancestry in Abrams
The most populous ancestries reported in Abrams are German (140 | 49.6%), Irish (71 | 25.2%), Welsh (33 | 11.7%), Polish (31 | 11.0%), and Belgian (26 | 9.2%), together accounting for 106.7% of all Abrams residents.
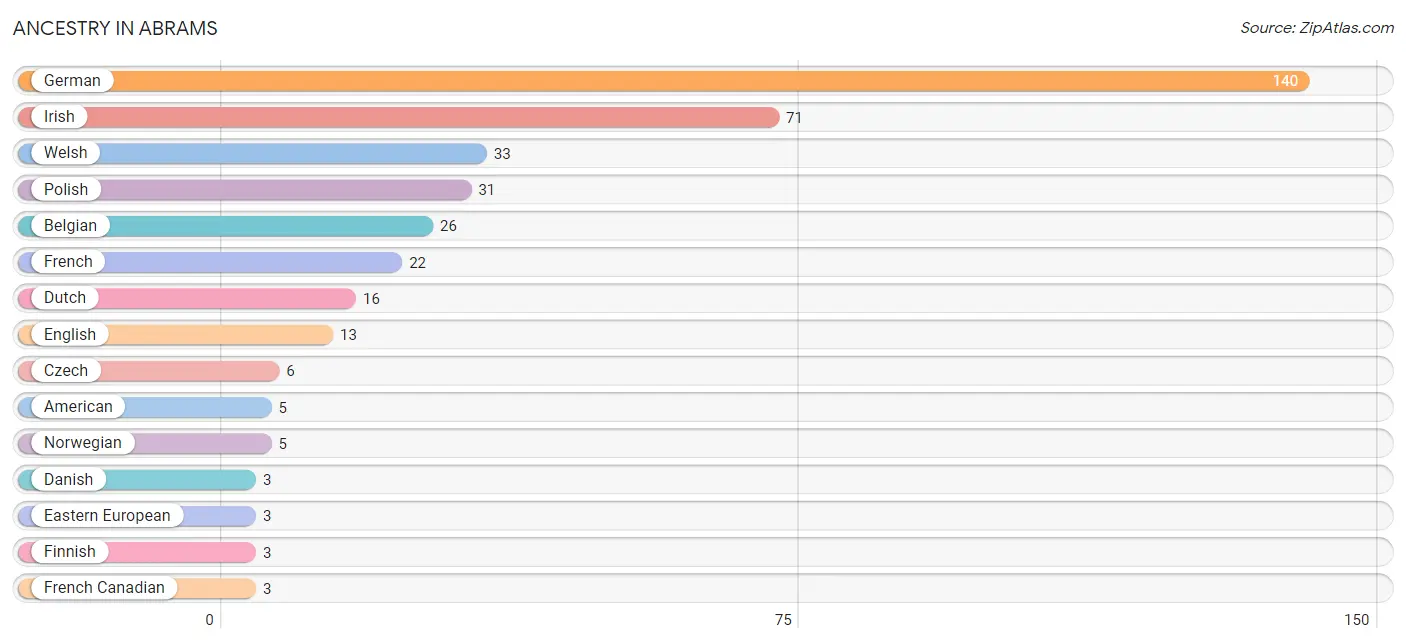
| Ancestry | # Population | % Population |
| American | 5 | 1.8% |
| Belgian | 26 | 9.2% |
| Czech | 6 | 2.1% |
| Danish | 3 | 1.1% |
| Dutch | 16 | 5.7% |
| Eastern European | 3 | 1.1% |
| English | 13 | 4.6% |
| Finnish | 3 | 1.1% |
| French | 22 | 7.8% |
| French Canadian | 3 | 1.1% |
| German | 140 | 49.6% |
| Irish | 71 | 25.2% |
| Norwegian | 5 | 1.8% |
| Polish | 31 | 11.0% |
| Welsh | 33 | 11.7% | View All 15 Rows |
Immigrants in Abrams
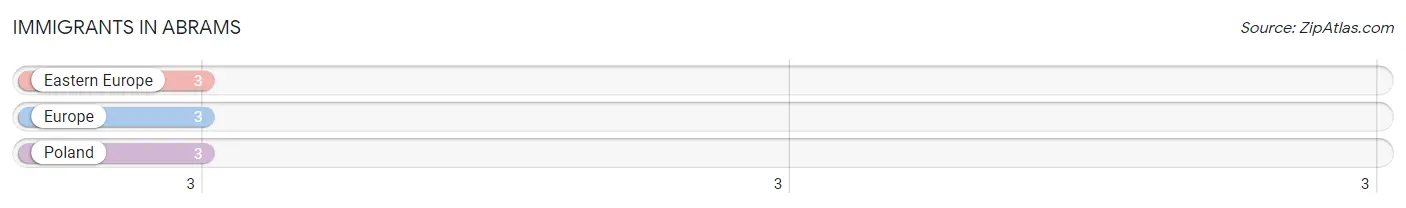
The most numerous immigrant groups reported in Abrams came from Eastern Europe (3 | 1.1%), Europe (3 | 1.1%), and Poland (3 | 1.1%), together accounting for 3.2% of all Abrams residents.
| Immigration Origin | # Population | % Population |
| Eastern Europe | 3 | 1.1% |
| Europe | 3 | 1.1% |
| Poland | 3 | 1.1% | View All 3 Rows |
Sex and Age in Abrams
Sex and Age in Abrams
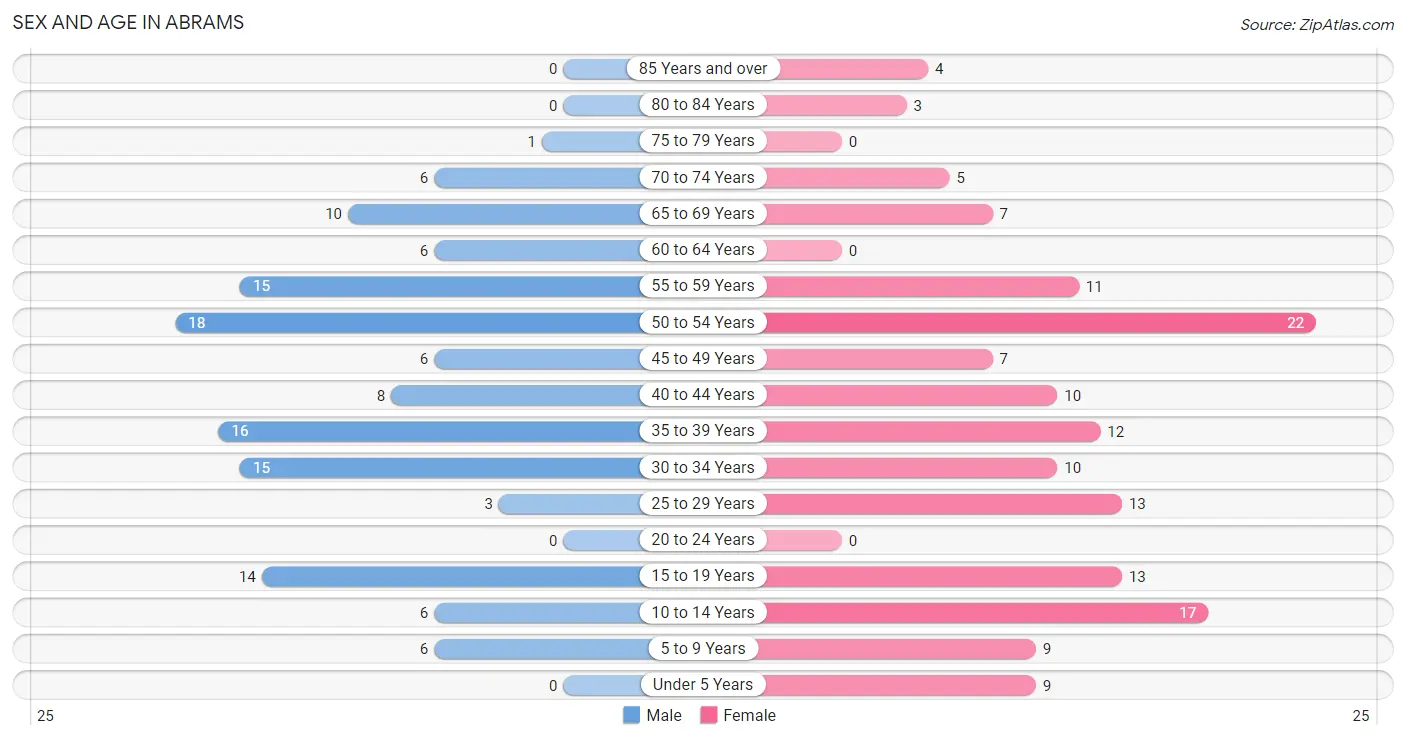
The most populous age groups in Abrams are 50 to 54 Years (18 | 13.9%) for men and 50 to 54 Years (22 | 14.5%) for women.
| Age Bracket | Male | Female |
| Under 5 Years | 0 (0.0%) | 9 (5.9%) |
| 5 to 9 Years | 6 (4.6%) | 9 (5.9%) |
| 10 to 14 Years | 6 (4.6%) | 17 (11.2%) |
| 15 to 19 Years | 14 (10.8%) | 13 (8.6%) |
| 20 to 24 Years | 0 (0.0%) | 0 (0.0%) |
| 25 to 29 Years | 3 (2.3%) | 13 (8.6%) |
| 30 to 34 Years | 15 (11.5%) | 10 (6.6%) |
| 35 to 39 Years | 16 (12.3%) | 12 (7.9%) |
| 40 to 44 Years | 8 (6.1%) | 10 (6.6%) |
| 45 to 49 Years | 6 (4.6%) | 7 (4.6%) |
| 50 to 54 Years | 18 (13.9%) | 22 (14.5%) |
| 55 to 59 Years | 15 (11.5%) | 11 (7.2%) |
| 60 to 64 Years | 6 (4.6%) | 0 (0.0%) |
| 65 to 69 Years | 10 (7.7%) | 7 (4.6%) |
| 70 to 74 Years | 6 (4.6%) | 5 (3.3%) |
| 75 to 79 Years | 1 (0.8%) | 0 (0.0%) |
| 80 to 84 Years | 0 (0.0%) | 3 (2.0%) |
| 85 Years and over | 0 (0.0%) | 4 (2.6%) |
| Total | 130 (100.0%) | 152 (100.0%) |
Families and Households in Abrams
Median Family Size in Abrams
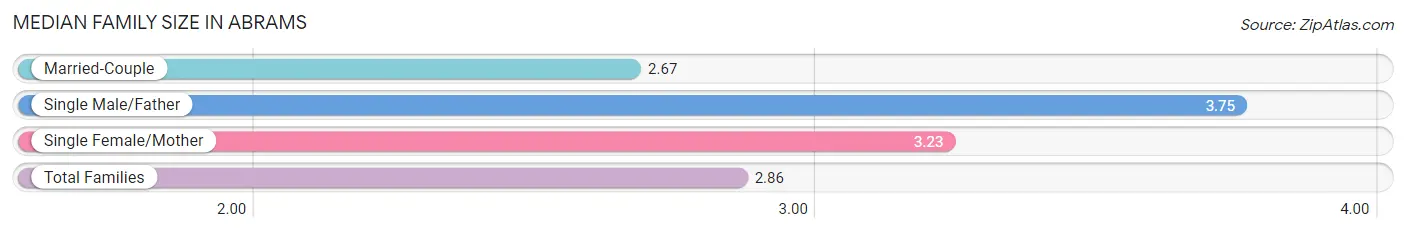
The median family size in Abrams is 2.86 persons per family, with single male/father families (8 | 9.4%) accounting for the largest median family size of 3.75 persons per family. On the other hand, married-couple families (64 | 75.3%) represent the smallest median family size with 2.67 persons per family.
| Family Type | # Families | Family Size |
| Married-Couple | 64 (75.3%) | 2.67 |
| Single Male/Father | 8 (9.4%) | 3.75 |
| Single Female/Mother | 13 (15.3%) | 3.23 |
| Total Families | 85 (100.0%) | 2.86 |
Median Household Size in Abrams
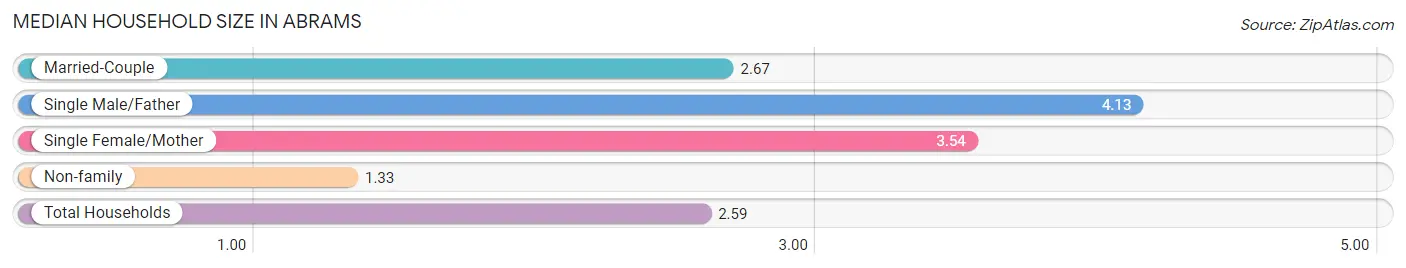
The median household size in Abrams is 2.59 persons per household, with single male/father households (8 | 7.3%) accounting for the largest median household size of 4.13 persons per household. non-family households (24 | 22.0%) represent the smallest median household size with 1.33 persons per household.
| Household Type | # Households | Household Size |
| Married-Couple | 64 (58.7%) | 2.67 |
| Single Male/Father | 8 (7.3%) | 4.13 |
| Single Female/Mother | 13 (11.9%) | 3.54 |
| Non-family | 24 (22.0%) | 1.33 |
| Total Households | 109 (100.0%) | 2.59 |
Household Size by Marriage Status in Abrams
Out of a total of 109 households in Abrams, 85 (78.0%) are family households, while 24 (22.0%) are nonfamily households. The most numerous type of family households are 2-person households, comprising 43, and the most common type of nonfamily households are 1-person households, comprising 16.
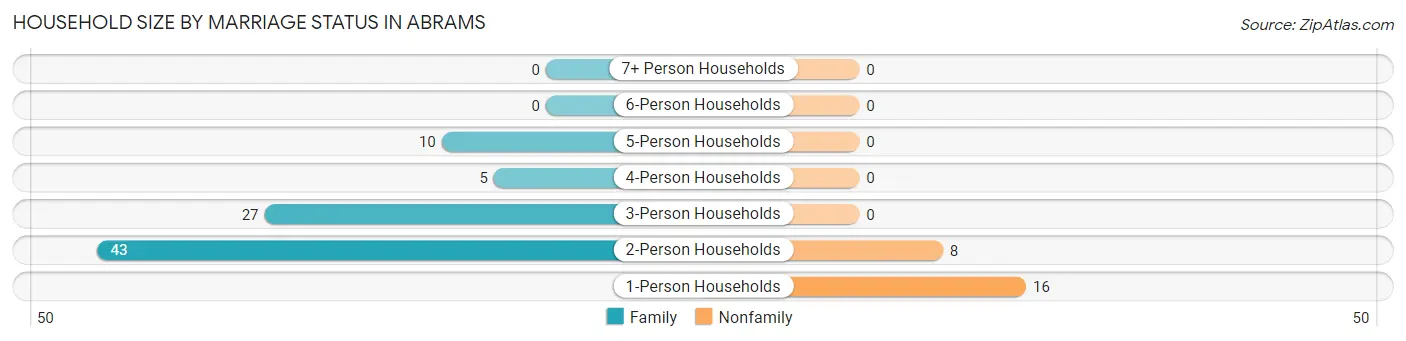
| Household Size | Family Households | Nonfamily Households |
| 1-Person Households | - | 16 (14.7%) |
| 2-Person Households | 43 (39.5%) | 8 (7.3%) |
| 3-Person Households | 27 (24.8%) | 0 (0.0%) |
| 4-Person Households | 5 (4.6%) | 0 (0.0%) |
| 5-Person Households | 10 (9.2%) | 0 (0.0%) |
| 6-Person Households | 0 (0.0%) | 0 (0.0%) |
| 7+ Person Households | 0 (0.0%) | 0 (0.0%) |
| Total | 85 (78.0%) | 24 (22.0%) |
Female Fertility in Abrams
Fertility by Age in Abrams
| Age Bracket | Women with Births | Births / 1,000 Women |
| 15 to 19 years | 0 (0.0%) | 0.0 |
| 20 to 34 years | 0 (0.0%) | 0.0 |
| 35 to 50 years | 0 (0.0%) | 0.0 |
| Total | 0 (0.0%) | 0.0 |
Fertility by Age by Marriage Status in Abrams
| Age Bracket | Married | Unmarried |
| 15 to 19 years | 0 (0.0%) | 0 (0.0%) |
| 20 to 34 years | 0 (0.0%) | 0 (0.0%) |
| 35 to 50 years | 0 (0.0%) | 0 (0.0%) |
| Total | 0 (0.0%) | 0 (0.0%) |
Fertility by Education in Abrams
| Educational Attainment | Women with Births | Births / 1,000 Women |
| Less than High School | 0 (0.0%) | 0.0 |
| High School Diploma | 0 (0.0%) | 0.0 |
| College or Associate's Degree | 0 (0.0%) | 0.0 |
| Bachelor's Degree | 0 (0.0%) | 0.0 |
| Graduate Degree | 0 (0.0%) | 0.0 |
| Total | 0 (0.0%) | 0.0 |
Fertility by Education by Marriage Status in Abrams
| Educational Attainment | Married | Unmarried |
| Less than High School | 0 (0.0%) | 0 (0.0%) |
| High School Diploma | 0 (0.0%) | 0 (0.0%) |
| College or Associate's Degree | 0 (0.0%) | 0 (0.0%) |
| Bachelor's Degree | 0 (0.0%) | 0 (0.0%) |
| Graduate Degree | 0 (0.0%) | 0 (0.0%) |
| Total | 0 (0.0%) | 0 (0.0%) |
Employment Characteristics in Abrams
Employment by Class of Employer in Abrams
Among the 171 employed individuals in Abrams, private company employees (136 | 79.5%), local government employees (19 | 11.1%), and not-for-profit organizations (11 | 6.4%) make up the most common classes of employment.
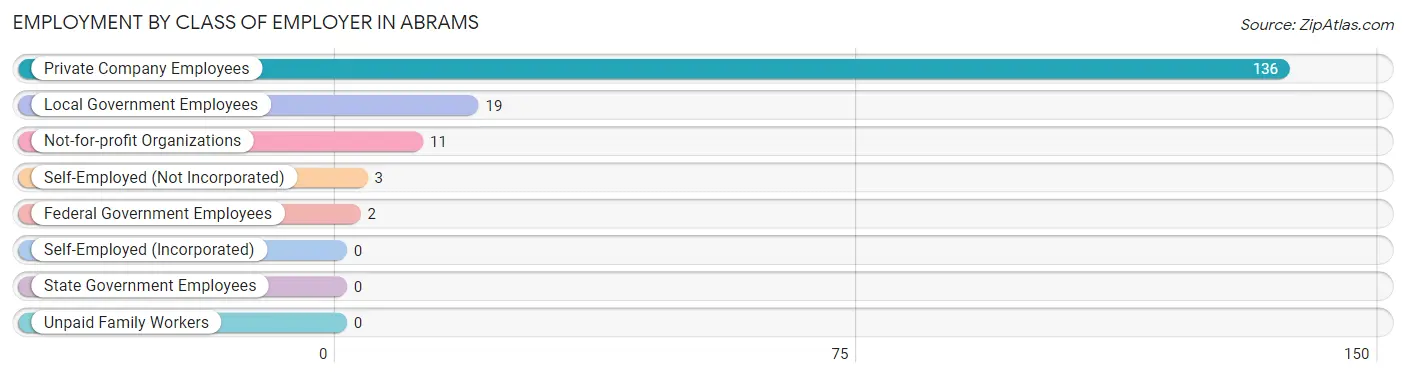
| Employer Class | # Employees | % Employees |
| Private Company Employees | 136 | 79.5% |
| Self-Employed (Incorporated) | 0 | 0.0% |
| Self-Employed (Not Incorporated) | 3 | 1.8% |
| Not-for-profit Organizations | 11 | 6.4% |
| Local Government Employees | 19 | 11.1% |
| State Government Employees | 0 | 0.0% |
| Federal Government Employees | 2 | 1.2% |
| Unpaid Family Workers | 0 | 0.0% |
| Total | 171 | 100.0% |
Employment Status by Age in Abrams
According to the labor force statistics for Abrams, out of the total population over 16 years of age (231), 76.6% or 177 individuals are in the labor force, with 3.4% or 6 of them unemployed. The age group with the highest labor force participation rate is 45 to 54 years, with 94.3% or 50 individuals in the labor force. Within the labor force, the 65 to 74 years age range has the highest percentage of unemployed individuals, with 18.8% or 3 of them being unemployed.
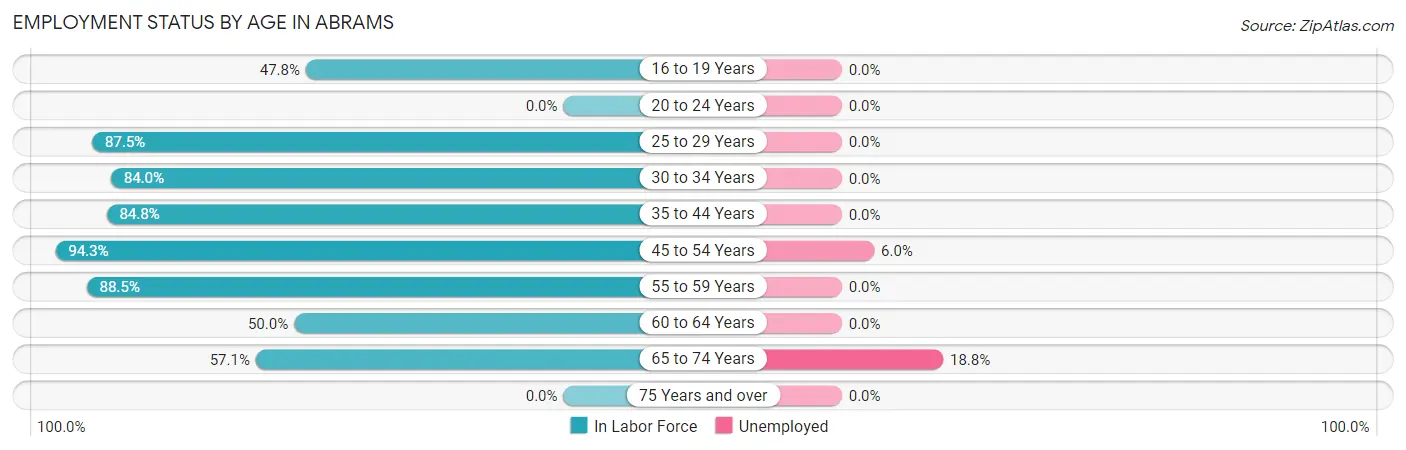
| Age Bracket | In Labor Force | Unemployed |
| 16 to 19 Years | 11 (47.8%) | 0 (0.0%) |
| 20 to 24 Years | 0 (0.0%) | 0 (0.0%) |
| 25 to 29 Years | 14 (87.5%) | 0 (0.0%) |
| 30 to 34 Years | 21 (84.0%) | 0 (0.0%) |
| 35 to 44 Years | 39 (84.8%) | 0 (0.0%) |
| 45 to 54 Years | 50 (94.3%) | 3 (6.0%) |
| 55 to 59 Years | 23 (88.5%) | 0 (0.0%) |
| 60 to 64 Years | 3 (50.0%) | 0 (0.0%) |
| 65 to 74 Years | 16 (57.1%) | 3 (18.8%) |
| 75 Years and over | 0 (0.0%) | 0 (0.0%) |
| Total | 177 (76.6%) | 6 (3.4%) |
Employment Status by Educational Attainment in Abrams
According to labor force statistics for Abrams, 87.2% of individuals (150) out of the total population between 25 and 64 years of age (172) are in the labor force, with 2.0% or 3 of them being unemployed. The group with the highest labor force participation rate are those with the educational attainment of high school diploma, with 90.5% or 57 individuals in the labor force. Within the labor force, individuals with college / associate degree education have the highest percentage of unemployment, with 4.7% or 3 of them being unemployed.
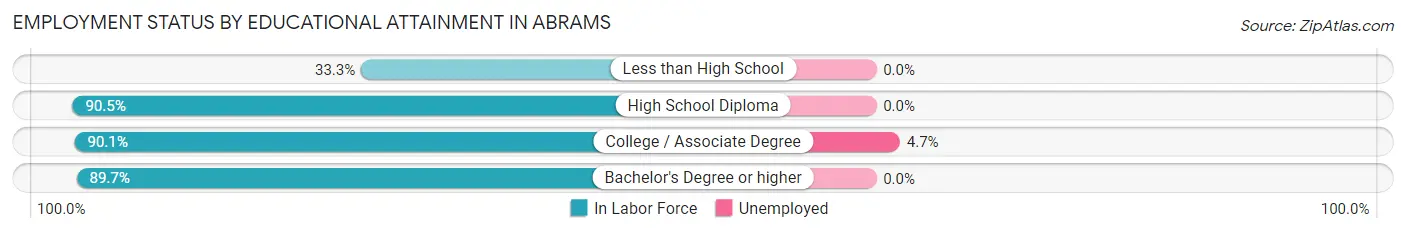
| Educational Attainment | In Labor Force | Unemployed |
| Less than High School | 3 (33.3%) | 0 (0.0%) |
| High School Diploma | 57 (90.5%) | 0 (0.0%) |
| College / Associate Degree | 64 (90.1%) | 3 (4.7%) |
| Bachelor's Degree or higher | 26 (89.7%) | 0 (0.0%) |
| Total | 150 (87.2%) | 3 (2.0%) |
Employment Occupations by Sex in Abrams
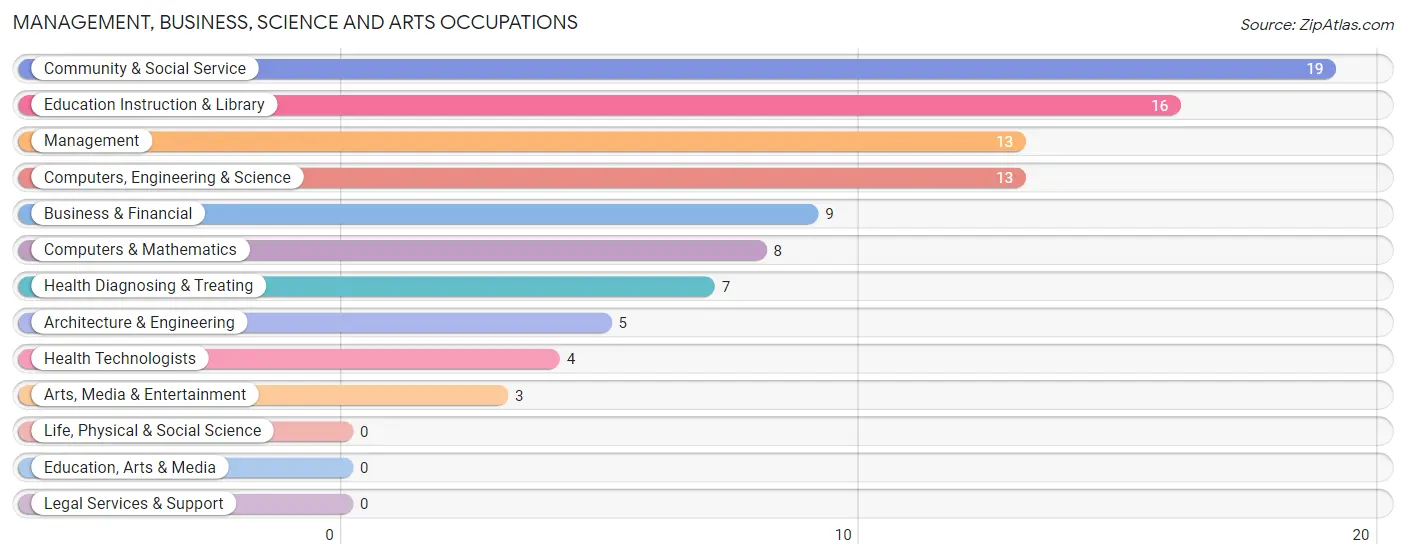
Management, Business, Science and Arts Occupations
The most common Management, Business, Science and Arts occupations in Abrams are Community & Social Service (19 | 11.1%), Education Instruction & Library (16 | 9.4%), Management (13 | 7.6%), Computers, Engineering & Science (13 | 7.6%), and Business & Financial (9 | 5.3%).
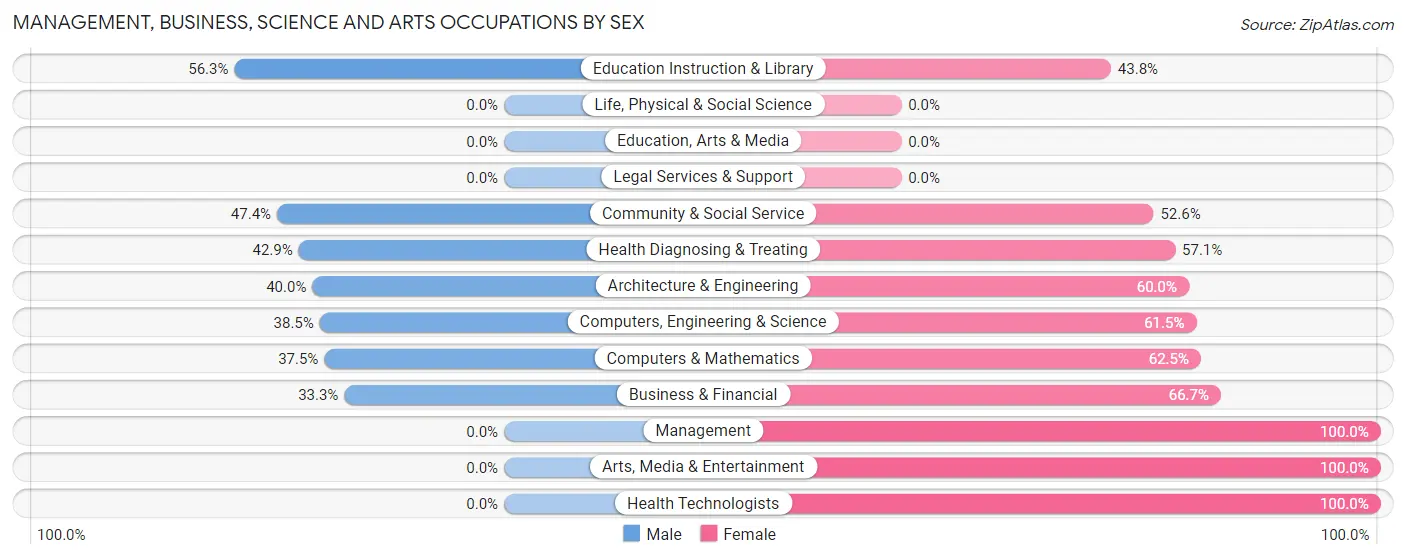
Management, Business, Science and Arts Occupations by Sex
Within the Management, Business, Science and Arts occupations in Abrams, the most male-oriented occupations are Education Instruction & Library (56.2%), Community & Social Service (47.4%), and Health Diagnosing & Treating (42.9%), while the most female-oriented occupations are Management (100.0%), Arts, Media & Entertainment (100.0%), and Health Technologists (100.0%).
| Occupation | Male | Female |
| Management | 0 (0.0%) | 13 (100.0%) |
| Business & Financial | 3 (33.3%) | 6 (66.7%) |
| Computers, Engineering & Science | 5 (38.5%) | 8 (61.5%) |
| Computers & Mathematics | 3 (37.5%) | 5 (62.5%) |
| Architecture & Engineering | 2 (40.0%) | 3 (60.0%) |
| Life, Physical & Social Science | 0 (0.0%) | 0 (0.0%) |
| Community & Social Service | 9 (47.4%) | 10 (52.6%) |
| Education, Arts & Media | 0 (0.0%) | 0 (0.0%) |
| Legal Services & Support | 0 (0.0%) | 0 (0.0%) |
| Education Instruction & Library | 9 (56.2%) | 7 (43.8%) |
| Arts, Media & Entertainment | 0 (0.0%) | 3 (100.0%) |
| Health Diagnosing & Treating | 3 (42.9%) | 4 (57.1%) |
| Health Technologists | 0 (0.0%) | 4 (100.0%) |
| Total (Category) | 20 (32.8%) | 41 (67.2%) |
| Total (Overall) | 83 (48.5%) | 88 (51.5%) |
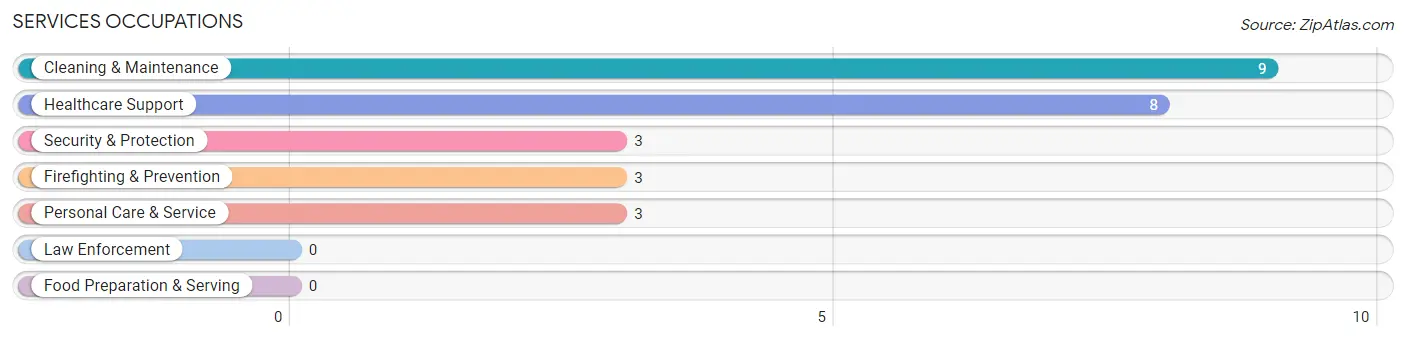
Services Occupations
The most common Services occupations in Abrams are Cleaning & Maintenance (9 | 5.3%), Healthcare Support (8 | 4.7%), Security & Protection (3 | 1.8%), Firefighting & Prevention (3 | 1.8%), and Personal Care & Service (3 | 1.8%).
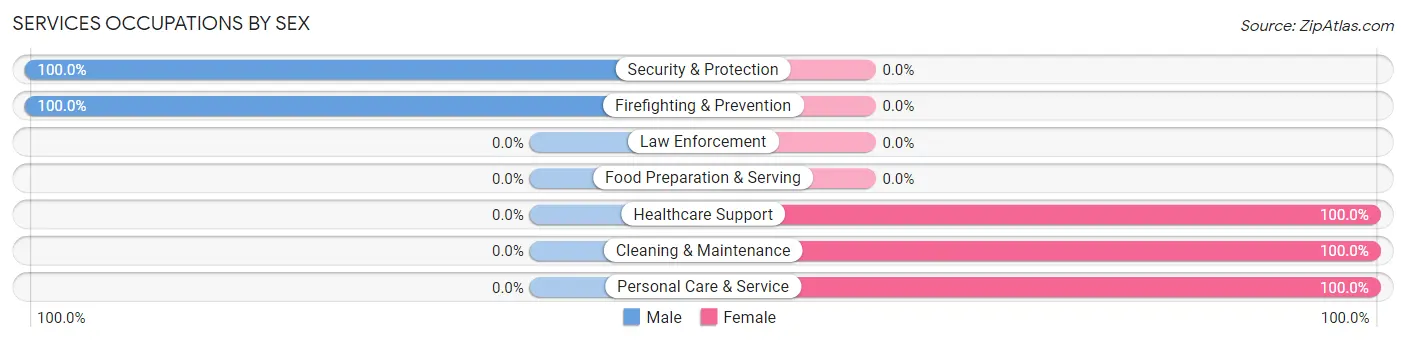
Services Occupations by Sex
Within the Services occupations in Abrams, the most male-oriented occupations are Security & Protection (100.0%), and Firefighting & Prevention (100.0%), while the most female-oriented occupations are Healthcare Support (100.0%), Cleaning & Maintenance (100.0%), and Personal Care & Service (100.0%).
| Occupation | Male | Female |
| Healthcare Support | 0 (0.0%) | 8 (100.0%) |
| Security & Protection | 3 (100.0%) | 0 (0.0%) |
| Firefighting & Prevention | 3 (100.0%) | 0 (0.0%) |
| Law Enforcement | 0 (0.0%) | 0 (0.0%) |
| Food Preparation & Serving | 0 (0.0%) | 0 (0.0%) |
| Cleaning & Maintenance | 0 (0.0%) | 9 (100.0%) |
| Personal Care & Service | 0 (0.0%) | 3 (100.0%) |
| Total (Category) | 3 (13.0%) | 20 (87.0%) |
| Total (Overall) | 83 (48.5%) | 88 (51.5%) |
Sales and Office Occupations
The most common Sales and Office occupations in Abrams are Office & Administration (25 | 14.6%), and Sales & Related (11 | 6.4%).
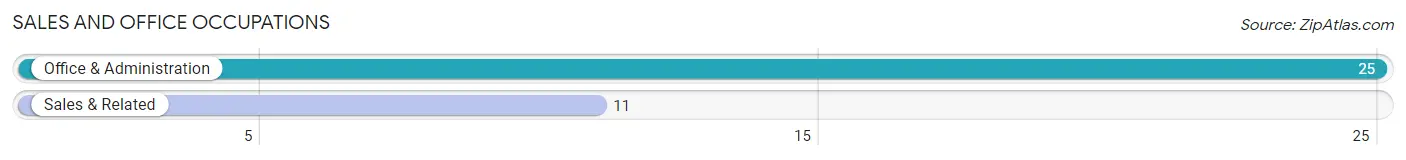
Sales and Office Occupations by Sex
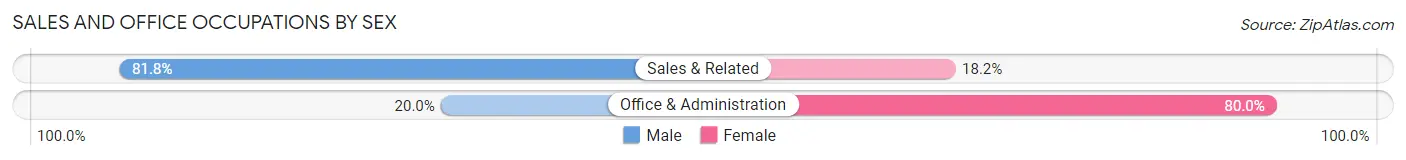
| Occupation | Male | Female |
| Sales & Related | 9 (81.8%) | 2 (18.2%) |
| Office & Administration | 5 (20.0%) | 20 (80.0%) |
| Total (Category) | 14 (38.9%) | 22 (61.1%) |
| Total (Overall) | 83 (48.5%) | 88 (51.5%) |
Natural Resources, Construction and Maintenance Occupations
The most common Natural Resources, Construction and Maintenance occupations in Abrams are Installation, Maintenance & Repair (10 | 5.9%), and Construction & Extraction (3 | 1.8%).
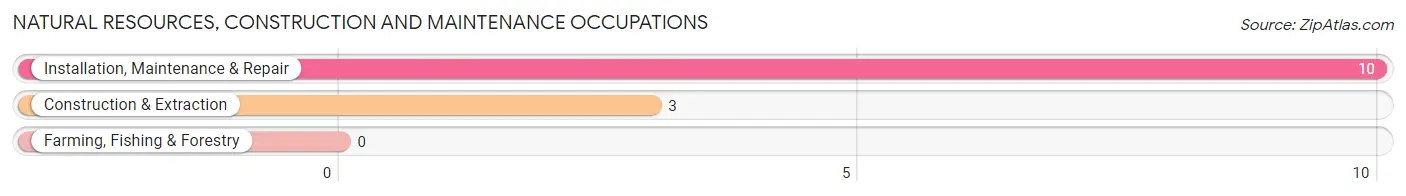
Natural Resources, Construction and Maintenance Occupations by Sex
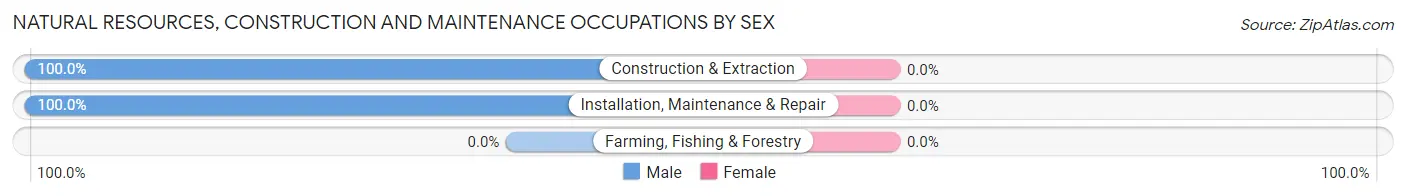
| Occupation | Male | Female |
| Farming, Fishing & Forestry | 0 (0.0%) | 0 (0.0%) |
| Construction & Extraction | 3 (100.0%) | 0 (0.0%) |
| Installation, Maintenance & Repair | 10 (100.0%) | 0 (0.0%) |
| Total (Category) | 13 (100.0%) | 0 (0.0%) |
| Total (Overall) | 83 (48.5%) | 88 (51.5%) |
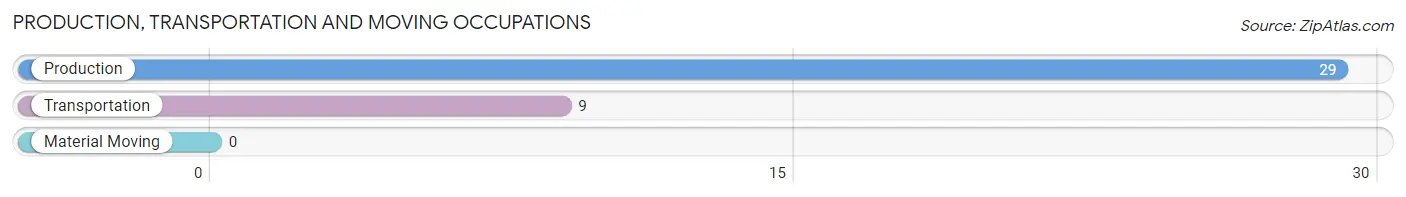
Production, Transportation and Moving Occupations
The most common Production, Transportation and Moving occupations in Abrams are Production (29 | 17.0%), and Transportation (9 | 5.3%).
Production, Transportation and Moving Occupations by Sex
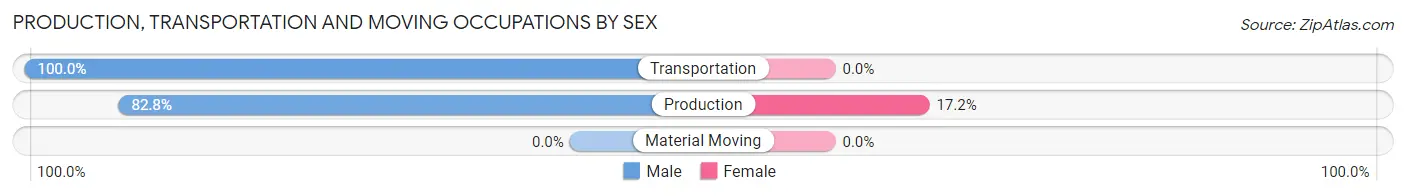
| Occupation | Male | Female |
| Production | 24 (82.8%) | 5 (17.2%) |
| Transportation | 9 (100.0%) | 0 (0.0%) |
| Material Moving | 0 (0.0%) | 0 (0.0%) |
| Total (Category) | 33 (86.8%) | 5 (13.2%) |
| Total (Overall) | 83 (48.5%) | 88 (51.5%) |
Employment Industries by Sex in Abrams
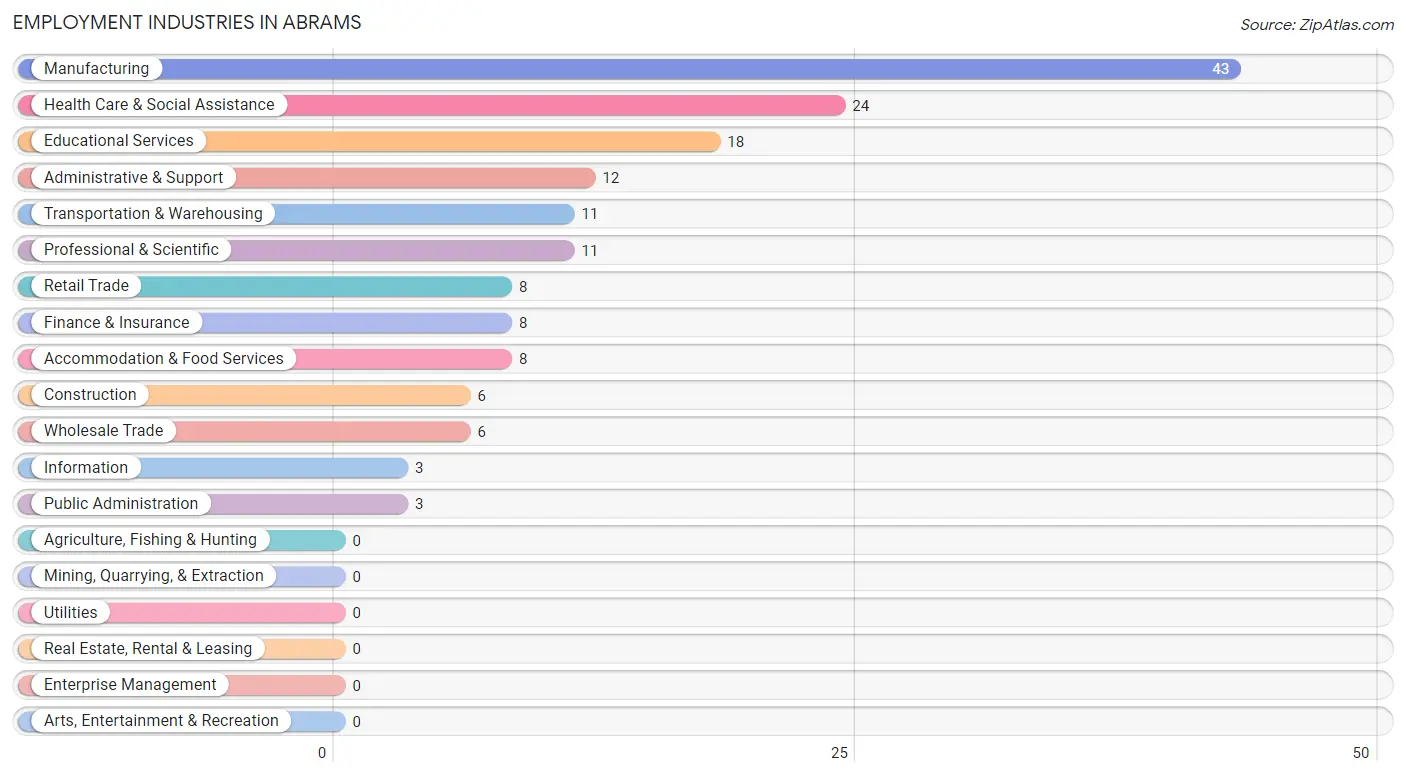
Employment Industries in Abrams
The major employment industries in Abrams include Manufacturing (43 | 25.2%), Health Care & Social Assistance (24 | 14.0%), Educational Services (18 | 10.5%), Administrative & Support (12 | 7.0%), and Transportation & Warehousing (11 | 6.4%).
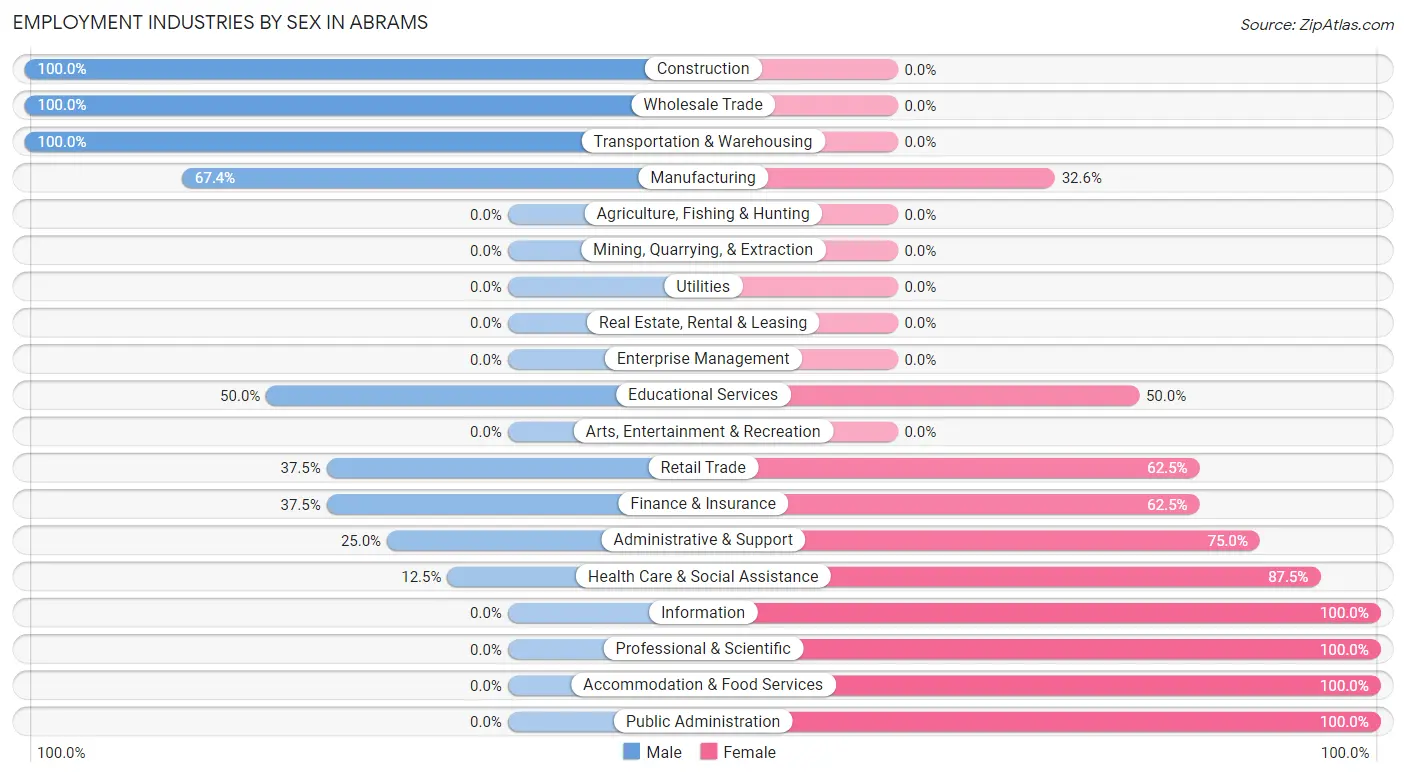
Employment Industries by Sex in Abrams
The Abrams industries that see more men than women are Construction (100.0%), Wholesale Trade (100.0%), and Transportation & Warehousing (100.0%), whereas the industries that tend to have a higher number of women are Information (100.0%), Professional & Scientific (100.0%), and Accommodation & Food Services (100.0%).
| Industry | Male | Female |
| Agriculture, Fishing & Hunting | 0 (0.0%) | 0 (0.0%) |
| Mining, Quarrying, & Extraction | 0 (0.0%) | 0 (0.0%) |
| Construction | 6 (100.0%) | 0 (0.0%) |
| Manufacturing | 29 (67.4%) | 14 (32.6%) |
| Wholesale Trade | 6 (100.0%) | 0 (0.0%) |
| Retail Trade | 3 (37.5%) | 5 (62.5%) |
| Transportation & Warehousing | 11 (100.0%) | 0 (0.0%) |
| Utilities | 0 (0.0%) | 0 (0.0%) |
| Information | 0 (0.0%) | 3 (100.0%) |
| Finance & Insurance | 3 (37.5%) | 5 (62.5%) |
| Real Estate, Rental & Leasing | 0 (0.0%) | 0 (0.0%) |
| Professional & Scientific | 0 (0.0%) | 11 (100.0%) |
| Enterprise Management | 0 (0.0%) | 0 (0.0%) |
| Administrative & Support | 3 (25.0%) | 9 (75.0%) |
| Educational Services | 9 (50.0%) | 9 (50.0%) |
| Health Care & Social Assistance | 3 (12.5%) | 21 (87.5%) |
| Arts, Entertainment & Recreation | 0 (0.0%) | 0 (0.0%) |
| Accommodation & Food Services | 0 (0.0%) | 8 (100.0%) |
| Public Administration | 0 (0.0%) | 3 (100.0%) |
| Total | 83 (48.5%) | 88 (51.5%) |
Education in Abrams
School Enrollment in Abrams
The most common levels of schooling among the 75 students in Abrams are middle school (26 | 34.7%), high school (22 | 29.3%), and elementary school (12 | 16.0%).
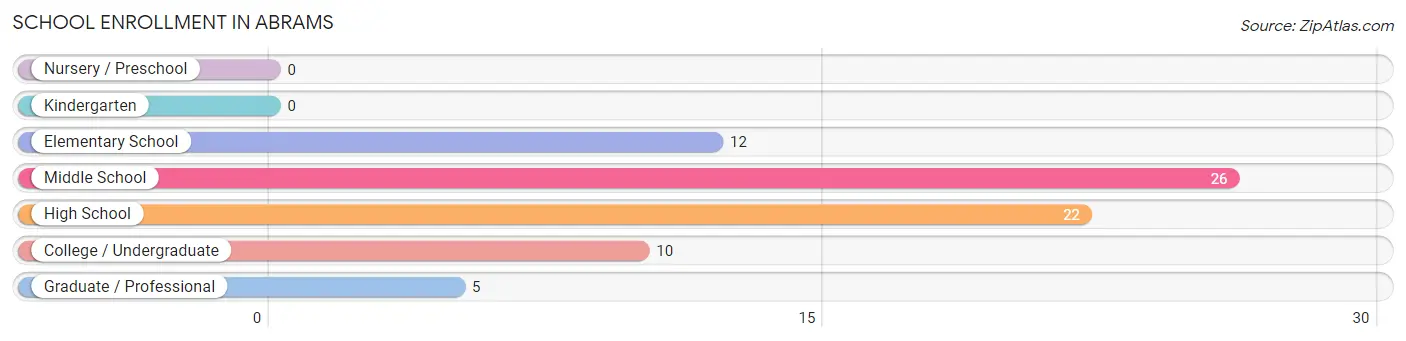
| School Level | # Students | % Students |
| Nursery / Preschool | 0 | 0.0% |
| Kindergarten | 0 | 0.0% |
| Elementary School | 12 | 16.0% |
| Middle School | 26 | 34.7% |
| High School | 22 | 29.3% |
| College / Undergraduate | 10 | 13.3% |
| Graduate / Professional | 5 | 6.7% |
| Total | 75 | 100.0% |
School Enrollment by Age by Funding Source in Abrams
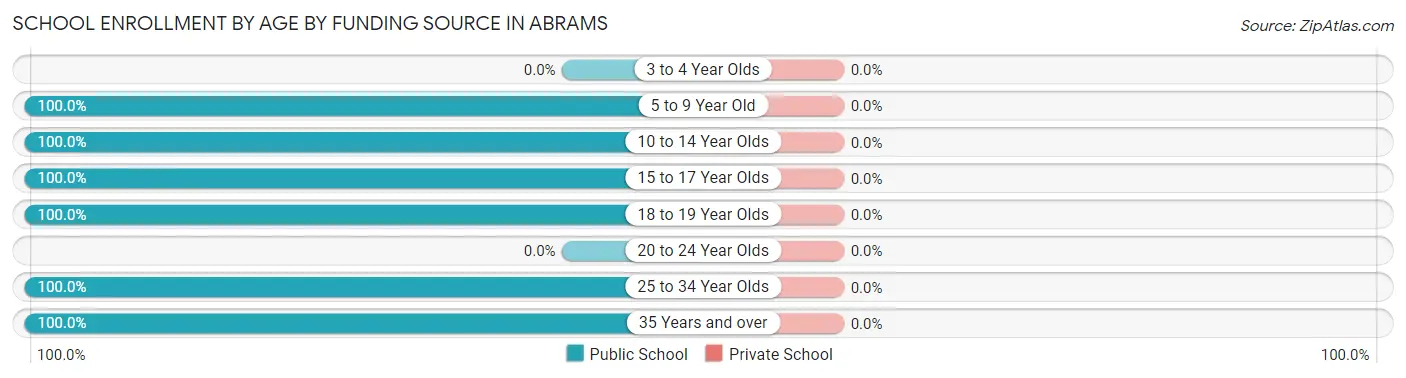
| Age Bracket | Public School | Private School |
| 3 to 4 Year Olds | 0 (0.0%) | 0 (0.0%) |
| 5 to 9 Year Old | 15 (100.0%) | 0 (0.0%) |
| 10 to 14 Year Olds | 23 (100.0%) | 0 (0.0%) |
| 15 to 17 Year Olds | 19 (100.0%) | 0 (0.0%) |
| 18 to 19 Year Olds | 8 (100.0%) | 0 (0.0%) |
| 20 to 24 Year Olds | 0 (0.0%) | 0 (0.0%) |
| 25 to 34 Year Olds | 2 (100.0%) | 0 (0.0%) |
| 35 Years and over | 8 (100.0%) | 0 (0.0%) |
| Total | 75 (100.0%) | 0 (0.0%) |
Educational Attainment by Field of Study in Abrams
Education (11 | 34.4%), business (6 | 18.8%), computers & mathematics (3 | 9.4%), science & technology (3 | 9.4%), and visual & performing arts (3 | 9.4%) are the most common fields of study among 32 individuals in Abrams who have obtained a bachelor's degree or higher.
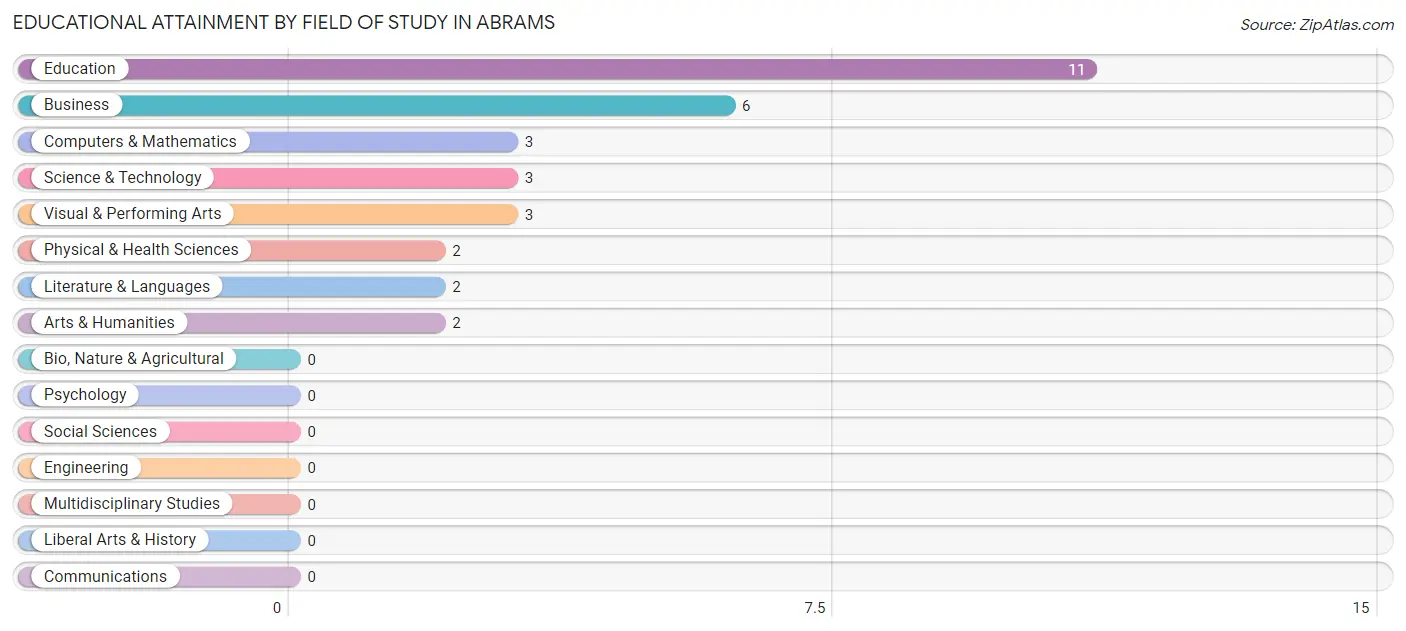
| Field of Study | # Graduates | % Graduates |
| Computers & Mathematics | 3 | 9.4% |
| Bio, Nature & Agricultural | 0 | 0.0% |
| Physical & Health Sciences | 2 | 6.2% |
| Psychology | 0 | 0.0% |
| Social Sciences | 0 | 0.0% |
| Engineering | 0 | 0.0% |
| Multidisciplinary Studies | 0 | 0.0% |
| Science & Technology | 3 | 9.4% |
| Business | 6 | 18.8% |
| Education | 11 | 34.4% |
| Literature & Languages | 2 | 6.2% |
| Liberal Arts & History | 0 | 0.0% |
| Visual & Performing Arts | 3 | 9.4% |
| Communications | 0 | 0.0% |
| Arts & Humanities | 2 | 6.2% |
| Total | 32 | 100.0% |
Transportation & Commute in Abrams
Vehicle Availability by Sex in Abrams
The most prevalent vehicle ownership categories in Abrams are males with 3 vehicles (33, accounting for 39.8%) and females with 3 vehicles (36, making up 37.5%).
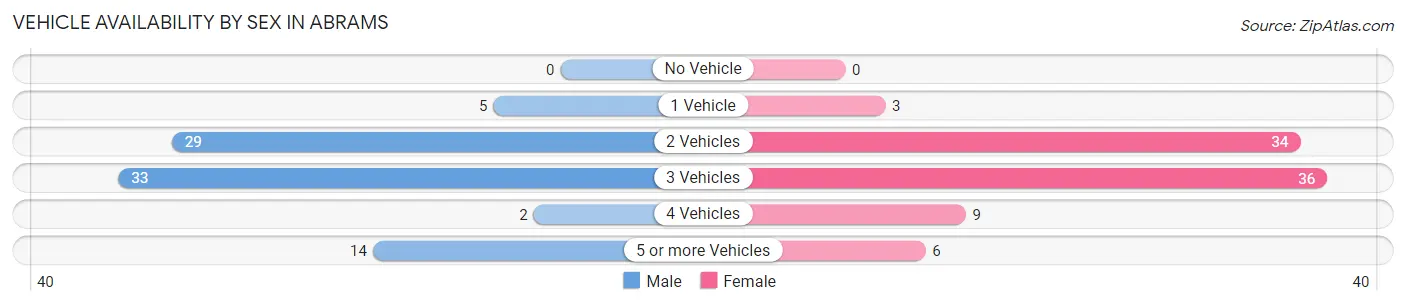
| Vehicles Available | Male | Female |
| No Vehicle | 0 (0.0%) | 0 (0.0%) |
| 1 Vehicle | 5 (6.0%) | 3 (3.4%) |
| 2 Vehicles | 29 (34.9%) | 34 (38.6%) |
| 3 Vehicles | 33 (39.8%) | 36 (40.9%) |
| 4 Vehicles | 2 (2.4%) | 9 (10.2%) |
| 5 or more Vehicles | 14 (16.9%) | 6 (6.8%) |
| Total | 83 (100.0%) | 88 (100.0%) |
Commute Time in Abrams
The most frequently occuring commute durations in Abrams are 30 to 34 minutes (35 commuters, 23.5%), less than 5 minutes (22 commuters, 14.8%), and 20 to 24 minutes (22 commuters, 14.8%).
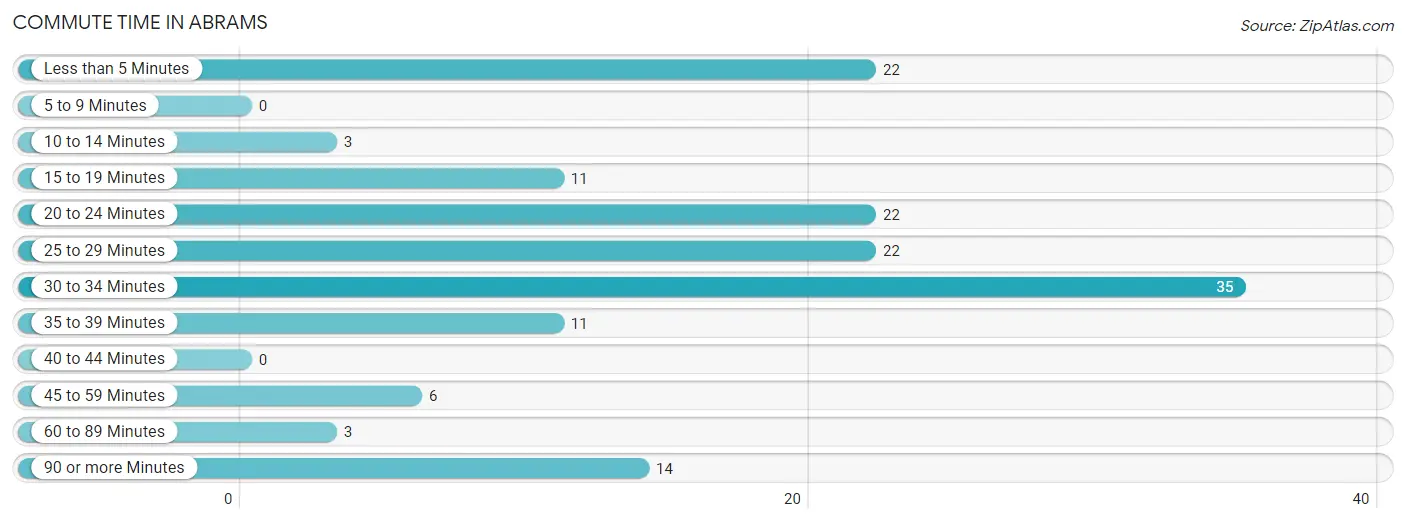
| Commute Time | # Commuters | % Commuters |
| Less than 5 Minutes | 22 | 14.8% |
| 5 to 9 Minutes | 0 | 0.0% |
| 10 to 14 Minutes | 3 | 2.0% |
| 15 to 19 Minutes | 11 | 7.4% |
| 20 to 24 Minutes | 22 | 14.8% |
| 25 to 29 Minutes | 22 | 14.8% |
| 30 to 34 Minutes | 35 | 23.5% |
| 35 to 39 Minutes | 11 | 7.4% |
| 40 to 44 Minutes | 0 | 0.0% |
| 45 to 59 Minutes | 6 | 4.0% |
| 60 to 89 Minutes | 3 | 2.0% |
| 90 or more Minutes | 14 | 9.4% |
Commute Time by Sex in Abrams
The most common commute times in Abrams are 30 to 34 minutes (21 commuters, 26.3%) for males and less than 5 minutes (19 commuters, 27.5%) for females.
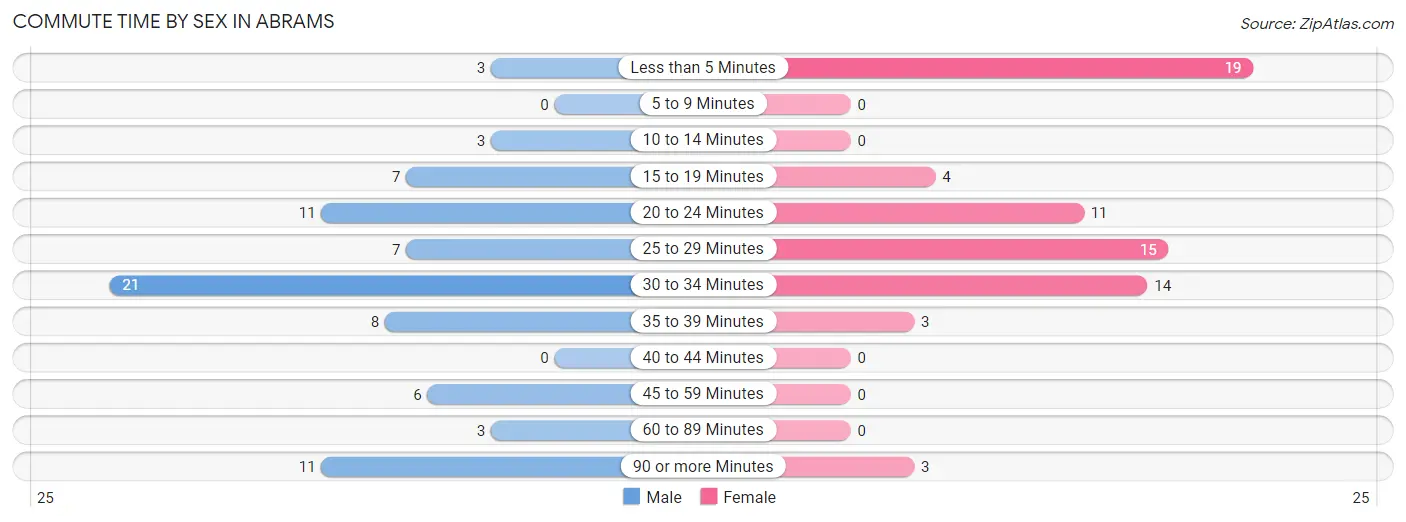
| Commute Time | Male | Female |
| Less than 5 Minutes | 3 (3.7%) | 19 (27.5%) |
| 5 to 9 Minutes | 0 (0.0%) | 0 (0.0%) |
| 10 to 14 Minutes | 3 (3.7%) | 0 (0.0%) |
| 15 to 19 Minutes | 7 (8.7%) | 4 (5.8%) |
| 20 to 24 Minutes | 11 (13.8%) | 11 (15.9%) |
| 25 to 29 Minutes | 7 (8.7%) | 15 (21.7%) |
| 30 to 34 Minutes | 21 (26.3%) | 14 (20.3%) |
| 35 to 39 Minutes | 8 (10.0%) | 3 (4.3%) |
| 40 to 44 Minutes | 0 (0.0%) | 0 (0.0%) |
| 45 to 59 Minutes | 6 (7.5%) | 0 (0.0%) |
| 60 to 89 Minutes | 3 (3.7%) | 0 (0.0%) |
| 90 or more Minutes | 11 (13.8%) | 3 (4.3%) |
Time of Departure to Work by Sex in Abrams
The most frequent times of departure to work in Abrams are 6:30 AM to 6:59 AM (13, 16.3%) for males and 7:00 AM to 7:29 AM (17, 24.6%) for females.
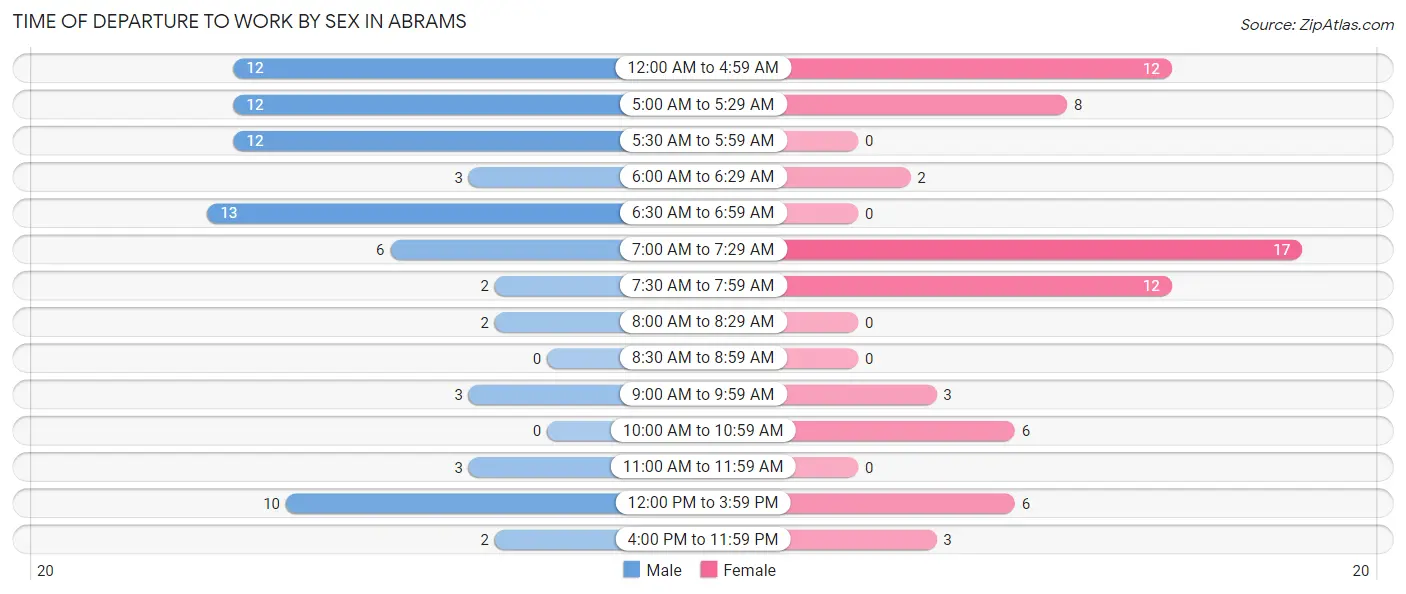
| Time of Departure | Male | Female |
| 12:00 AM to 4:59 AM | 12 (15.0%) | 12 (17.4%) |
| 5:00 AM to 5:29 AM | 12 (15.0%) | 8 (11.6%) |
| 5:30 AM to 5:59 AM | 12 (15.0%) | 0 (0.0%) |
| 6:00 AM to 6:29 AM | 3 (3.7%) | 2 (2.9%) |
| 6:30 AM to 6:59 AM | 13 (16.3%) | 0 (0.0%) |
| 7:00 AM to 7:29 AM | 6 (7.5%) | 17 (24.6%) |
| 7:30 AM to 7:59 AM | 2 (2.5%) | 12 (17.4%) |
| 8:00 AM to 8:29 AM | 2 (2.5%) | 0 (0.0%) |
| 8:30 AM to 8:59 AM | 0 (0.0%) | 0 (0.0%) |
| 9:00 AM to 9:59 AM | 3 (3.7%) | 3 (4.3%) |
| 10:00 AM to 10:59 AM | 0 (0.0%) | 6 (8.7%) |
| 11:00 AM to 11:59 AM | 3 (3.7%) | 0 (0.0%) |
| 12:00 PM to 3:59 PM | 10 (12.5%) | 6 (8.7%) |
| 4:00 PM to 11:59 PM | 2 (2.5%) | 3 (4.3%) |
| Total | 80 (100.0%) | 69 (100.0%) |
Housing Occupancy in Abrams
Occupancy by Ownership in Abrams
Of the total 109 dwellings in Abrams, owner-occupied units account for 100 (91.7%), while renter-occupied units make up 9 (8.3%).
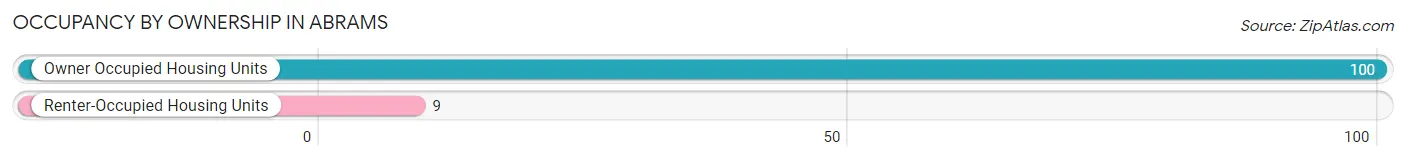
| Occupancy | # Housing Units | % Housing Units |
| Owner Occupied Housing Units | 100 | 91.7% |
| Renter-Occupied Housing Units | 9 | 8.3% |
| Total Occupied Housing Units | 109 | 100.0% |
Occupancy by Household Size in Abrams
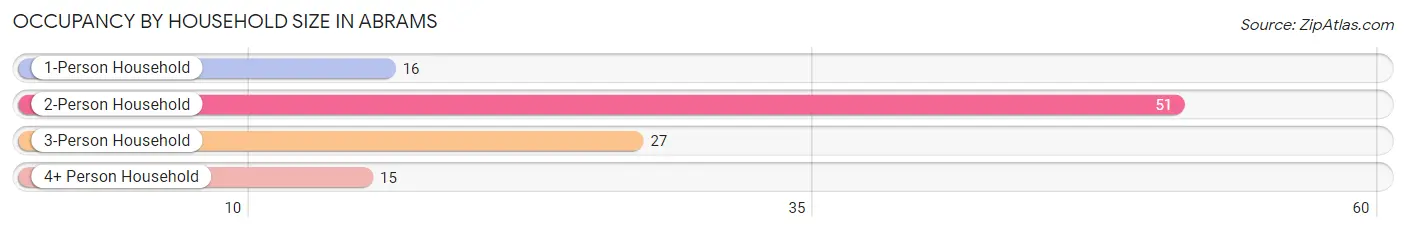
| Household Size | # Housing Units | % Housing Units |
| 1-Person Household | 16 | 14.7% |
| 2-Person Household | 51 | 46.8% |
| 3-Person Household | 27 | 24.8% |
| 4+ Person Household | 15 | 13.8% |
| Total Housing Units | 109 | 100.0% |
Occupancy by Ownership by Household Size in Abrams
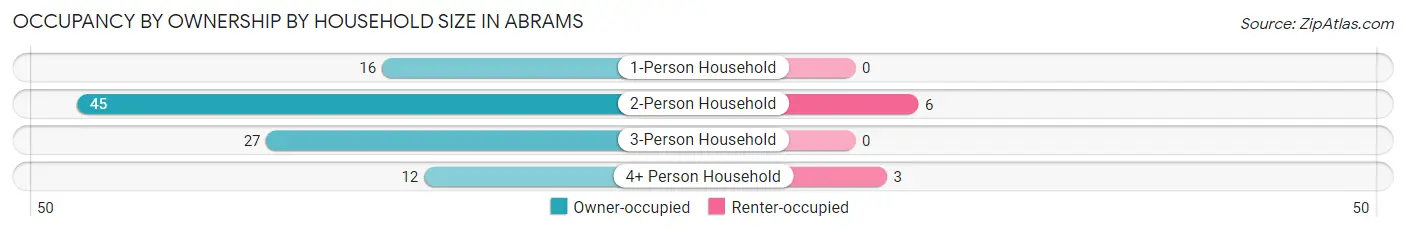
| Household Size | Owner-occupied | Renter-occupied |
| 1-Person Household | 16 (100.0%) | 0 (0.0%) |
| 2-Person Household | 45 (88.2%) | 6 (11.8%) |
| 3-Person Household | 27 (100.0%) | 0 (0.0%) |
| 4+ Person Household | 12 (80.0%) | 3 (20.0%) |
| Total Housing Units | 100 (91.7%) | 9 (8.3%) |
Occupancy by Educational Attainment in Abrams
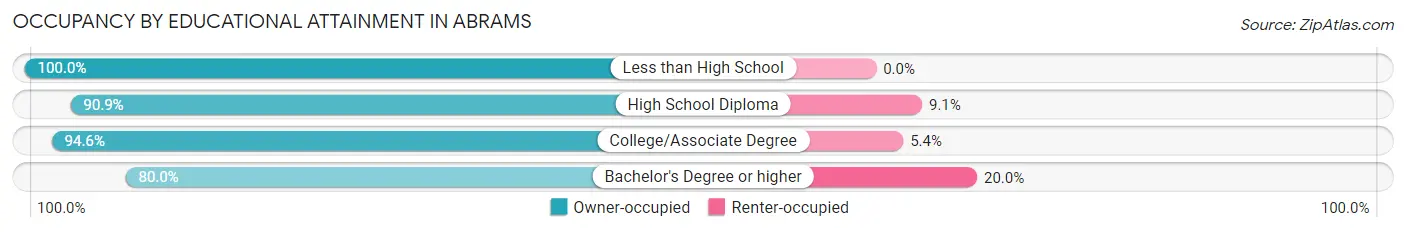
| Household Size | Owner-occupied | Renter-occupied |
| Less than High School | 5 (100.0%) | 0 (0.0%) |
| High School Diploma | 30 (90.9%) | 3 (9.1%) |
| College/Associate Degree | 53 (94.6%) | 3 (5.4%) |
| Bachelor's Degree or higher | 12 (80.0%) | 3 (20.0%) |
Occupancy by Age of Householder in Abrams
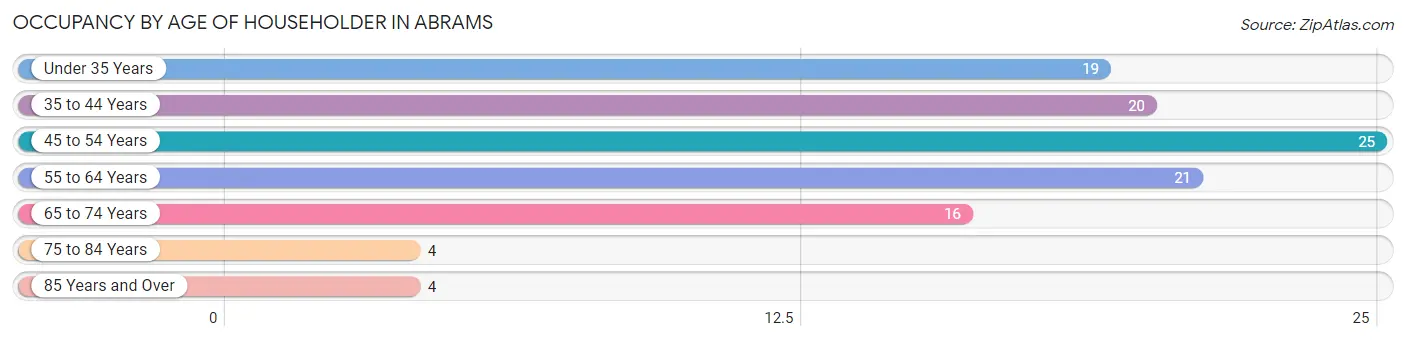
| Age Bracket | # Households | % Households |
| Under 35 Years | 19 | 17.4% |
| 35 to 44 Years | 20 | 18.3% |
| 45 to 54 Years | 25 | 22.9% |
| 55 to 64 Years | 21 | 19.3% |
| 65 to 74 Years | 16 | 14.7% |
| 75 to 84 Years | 4 | 3.7% |
| 85 Years and Over | 4 | 3.7% |
| Total | 109 | 100.0% |
Housing Finances in Abrams
Median Income by Occupancy in Abrams
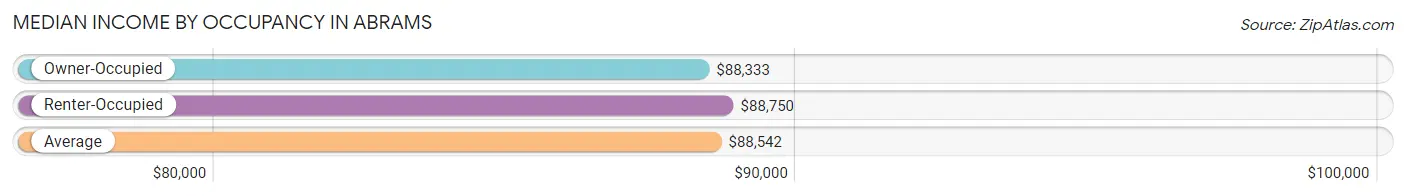
| Occupancy Type | # Households | Median Income |
| Owner-Occupied | 100 (91.7%) | $88,333 |
| Renter-Occupied | 9 (8.3%) | $88,750 |
| Average | 109 (100.0%) | $88,542 |
Occupancy by Householder Income Bracket in Abrams
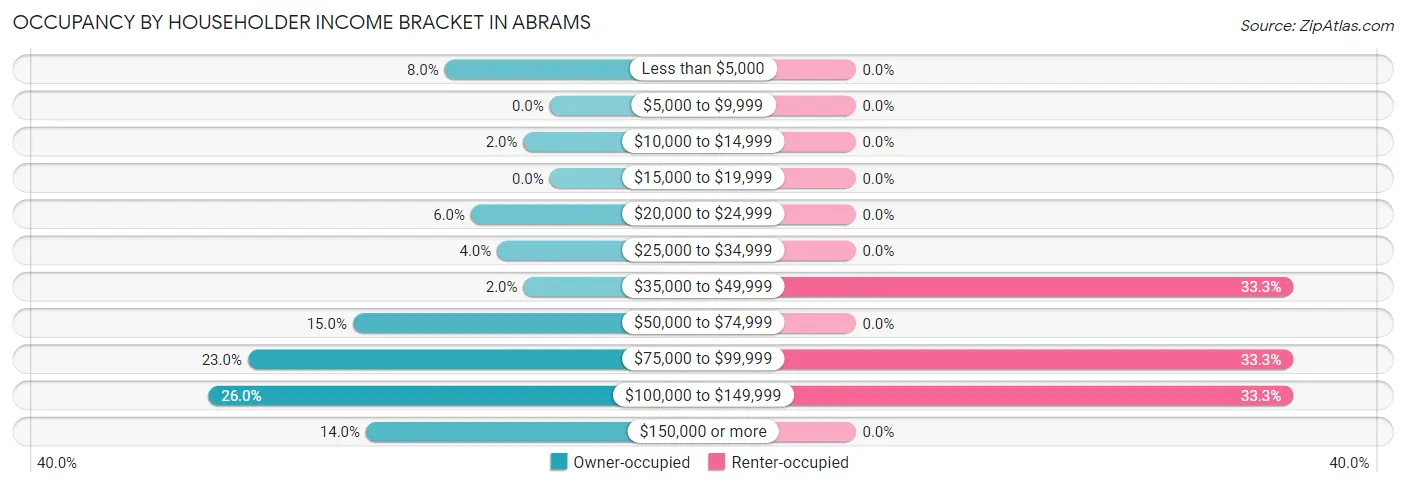
| Income Bracket | Owner-occupied | Renter-occupied |
| Less than $5,000 | 8 (8.0%) | 0 (0.0%) |
| $5,000 to $9,999 | 0 (0.0%) | 0 (0.0%) |
| $10,000 to $14,999 | 2 (2.0%) | 0 (0.0%) |
| $15,000 to $19,999 | 0 (0.0%) | 0 (0.0%) |
| $20,000 to $24,999 | 6 (6.0%) | 0 (0.0%) |
| $25,000 to $34,999 | 4 (4.0%) | 0 (0.0%) |
| $35,000 to $49,999 | 2 (2.0%) | 3 (33.3%) |
| $50,000 to $74,999 | 15 (15.0%) | 0 (0.0%) |
| $75,000 to $99,999 | 23 (23.0%) | 3 (33.3%) |
| $100,000 to $149,999 | 26 (26.0%) | 3 (33.3%) |
| $150,000 or more | 14 (14.0%) | 0 (0.0%) |
| Total | 100 (100.0%) | 9 (100.0%) |
Monthly Housing Cost Tiers in Abrams
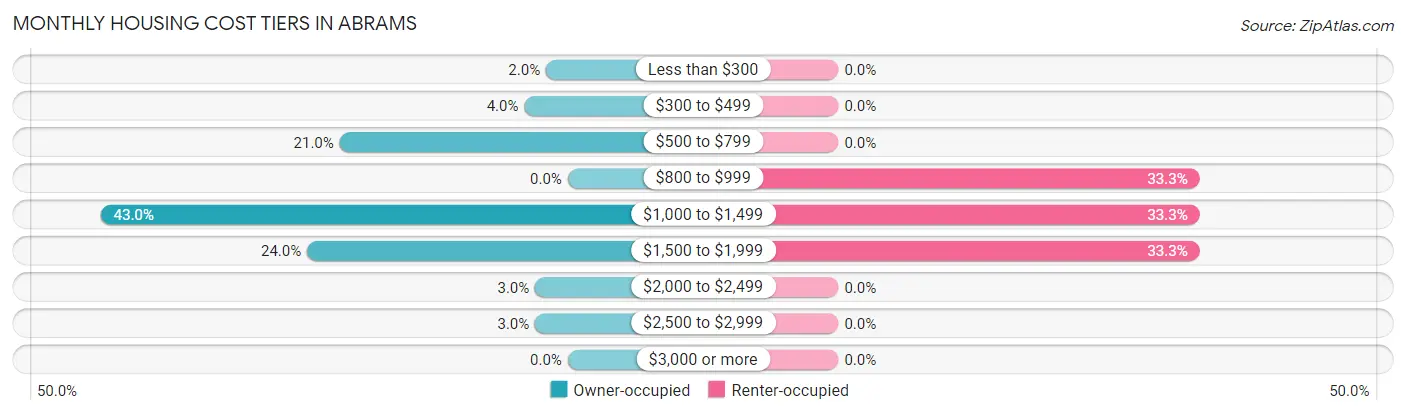
| Monthly Cost | Owner-occupied | Renter-occupied |
| Less than $300 | 2 (2.0%) | 0 (0.0%) |
| $300 to $499 | 4 (4.0%) | 0 (0.0%) |
| $500 to $799 | 21 (21.0%) | 0 (0.0%) |
| $800 to $999 | 0 (0.0%) | 3 (33.3%) |
| $1,000 to $1,499 | 43 (43.0%) | 3 (33.3%) |
| $1,500 to $1,999 | 24 (24.0%) | 3 (33.3%) |
| $2,000 to $2,499 | 3 (3.0%) | 0 (0.0%) |
| $2,500 to $2,999 | 3 (3.0%) | 0 (0.0%) |
| $3,000 or more | 0 (0.0%) | 0 (0.0%) |
| Total | 100 (100.0%) | 9 (100.0%) |
Physical Housing Characteristics in Abrams
Housing Structures in Abrams
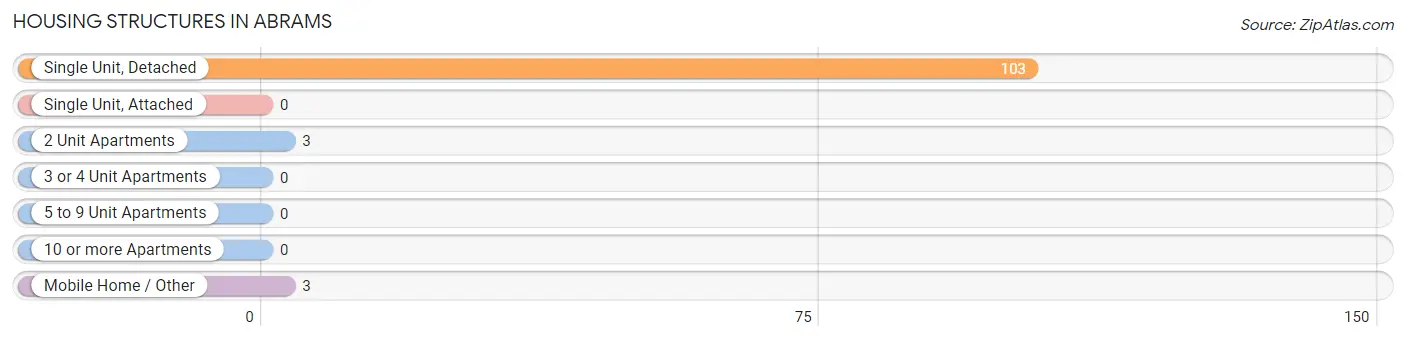
| Structure Type | # Housing Units | % Housing Units |
| Single Unit, Detached | 103 | 94.5% |
| Single Unit, Attached | 0 | 0.0% |
| 2 Unit Apartments | 3 | 2.8% |
| 3 or 4 Unit Apartments | 0 | 0.0% |
| 5 to 9 Unit Apartments | 0 | 0.0% |
| 10 or more Apartments | 0 | 0.0% |
| Mobile Home / Other | 3 | 2.8% |
| Total | 109 | 100.0% |
Housing Structures by Occupancy in Abrams
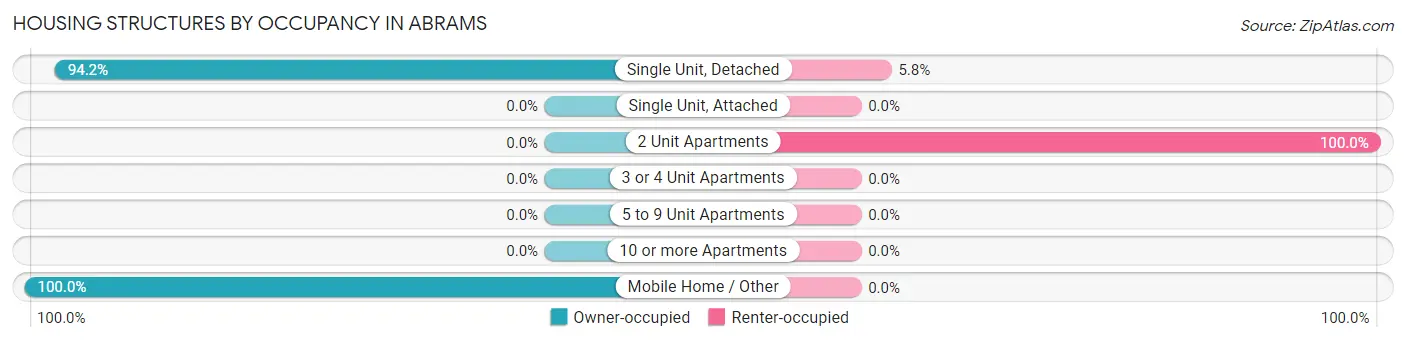
| Structure Type | Owner-occupied | Renter-occupied |
| Single Unit, Detached | 97 (94.2%) | 6 (5.8%) |
| Single Unit, Attached | 0 (0.0%) | 0 (0.0%) |
| 2 Unit Apartments | 0 (0.0%) | 3 (100.0%) |
| 3 or 4 Unit Apartments | 0 (0.0%) | 0 (0.0%) |
| 5 to 9 Unit Apartments | 0 (0.0%) | 0 (0.0%) |
| 10 or more Apartments | 0 (0.0%) | 0 (0.0%) |
| Mobile Home / Other | 3 (100.0%) | 0 (0.0%) |
| Total | 100 (91.7%) | 9 (8.3%) |
Housing Structures by Number of Rooms in Abrams
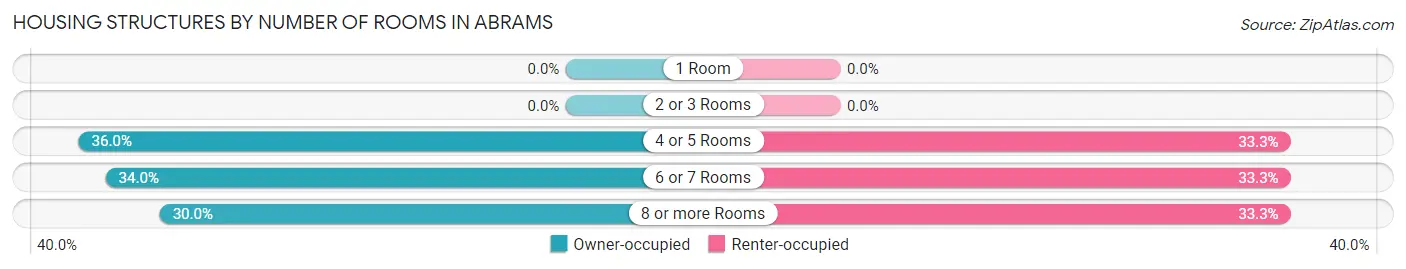
| Number of Rooms | Owner-occupied | Renter-occupied |
| 1 Room | 0 (0.0%) | 0 (0.0%) |
| 2 or 3 Rooms | 0 (0.0%) | 0 (0.0%) |
| 4 or 5 Rooms | 36 (36.0%) | 3 (33.3%) |
| 6 or 7 Rooms | 34 (34.0%) | 3 (33.3%) |
| 8 or more Rooms | 30 (30.0%) | 3 (33.3%) |
| Total | 100 (100.0%) | 9 (100.0%) |
Housing Structure by Heating Type in Abrams
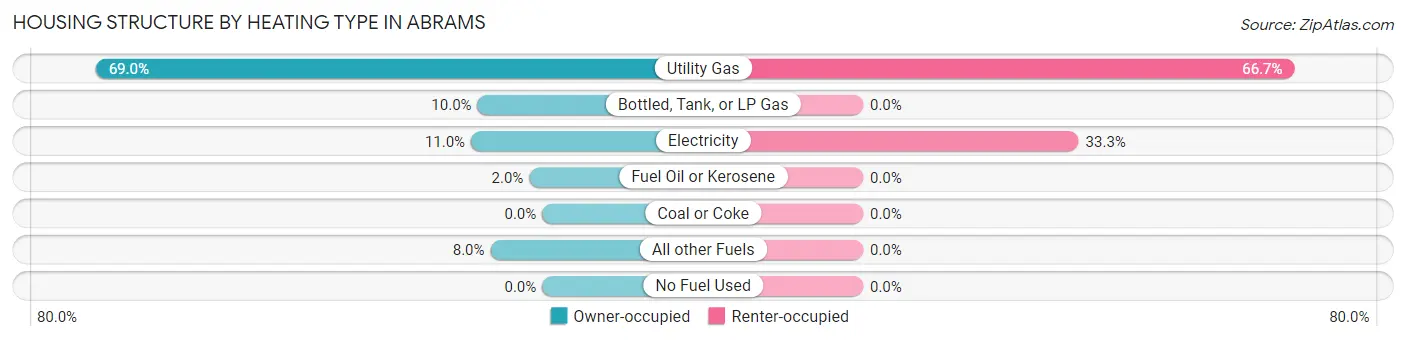
| Heating Type | Owner-occupied | Renter-occupied |
| Utility Gas | 69 (69.0%) | 6 (66.7%) |
| Bottled, Tank, or LP Gas | 10 (10.0%) | 0 (0.0%) |
| Electricity | 11 (11.0%) | 3 (33.3%) |
| Fuel Oil or Kerosene | 2 (2.0%) | 0 (0.0%) |
| Coal or Coke | 0 (0.0%) | 0 (0.0%) |
| All other Fuels | 8 (8.0%) | 0 (0.0%) |
| No Fuel Used | 0 (0.0%) | 0 (0.0%) |
| Total | 100 (100.0%) | 9 (100.0%) |
Household Vehicle Usage in Abrams
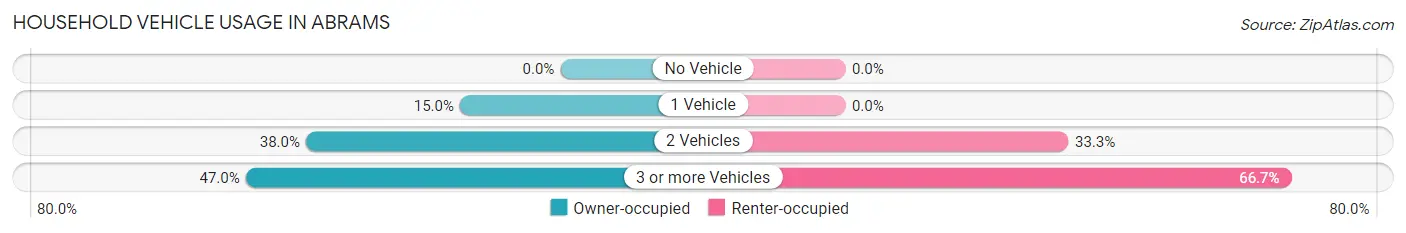
| Vehicles per Household | Owner-occupied | Renter-occupied |
| No Vehicle | 0 (0.0%) | 0 (0.0%) |
| 1 Vehicle | 15 (15.0%) | 0 (0.0%) |
| 2 Vehicles | 38 (38.0%) | 3 (33.3%) |
| 3 or more Vehicles | 47 (47.0%) | 6 (66.7%) |
| Total | 100 (100.0%) | 9 (100.0%) |
Real Estate & Mortgages in Abrams
Real Estate and Mortgage Overview in Abrams
| Characteristic | Without Mortgage | With Mortgage |
| Housing Units | 20 | 80 |
| Median Property Value | $143,800 | $187,500 |
| Median Household Income | $66,667 | $14 |
| Monthly Housing Costs | $567 | $0 |
| Real Estate Taxes | $2,167 | $0 |
Property Value by Mortgage Status in Abrams
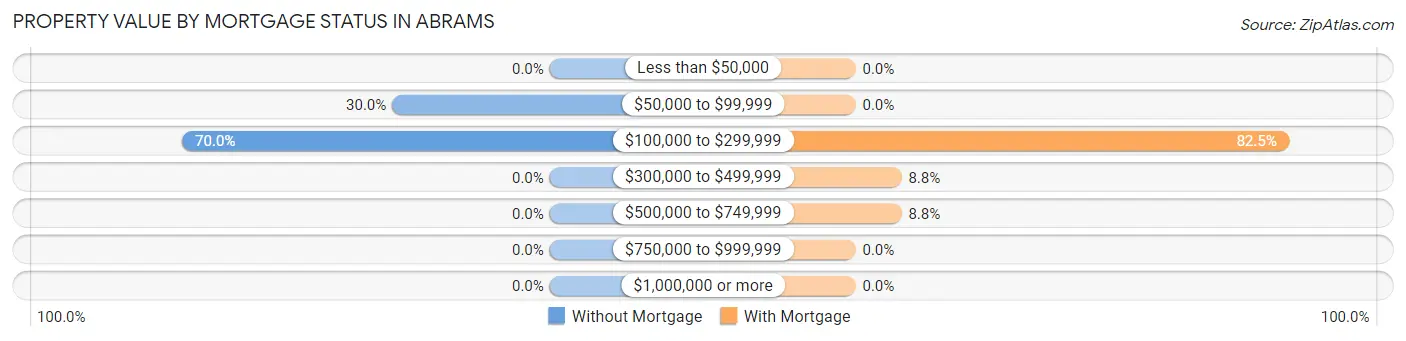
| Property Value | Without Mortgage | With Mortgage |
| Less than $50,000 | 0 (0.0%) | 0 (0.0%) |
| $50,000 to $99,999 | 6 (30.0%) | 0 (0.0%) |
| $100,000 to $299,999 | 14 (70.0%) | 66 (82.5%) |
| $300,000 to $499,999 | 0 (0.0%) | 7 (8.7%) |
| $500,000 to $749,999 | 0 (0.0%) | 7 (8.7%) |
| $750,000 to $999,999 | 0 (0.0%) | 0 (0.0%) |
| $1,000,000 or more | 0 (0.0%) | 0 (0.0%) |
| Total | 20 (100.0%) | 80 (100.0%) |
Household Income by Mortgage Status in Abrams
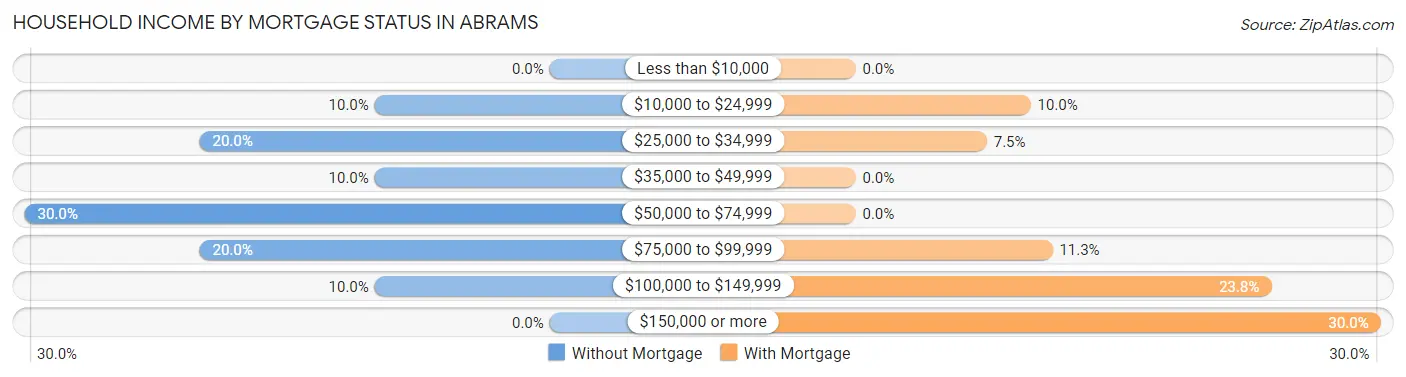
| Household Income | Without Mortgage | With Mortgage |
| Less than $10,000 | 0 (0.0%) | 0 (0.0%) |
| $10,000 to $24,999 | 2 (10.0%) | 8 (10.0%) |
| $25,000 to $34,999 | 4 (20.0%) | 6 (7.5%) |
| $35,000 to $49,999 | 2 (10.0%) | 0 (0.0%) |
| $50,000 to $74,999 | 6 (30.0%) | 0 (0.0%) |
| $75,000 to $99,999 | 4 (20.0%) | 9 (11.3%) |
| $100,000 to $149,999 | 2 (10.0%) | 19 (23.7%) |
| $150,000 or more | 0 (0.0%) | 24 (30.0%) |
| Total | 20 (100.0%) | 80 (100.0%) |
Property Value to Household Income Ratio in Abrams
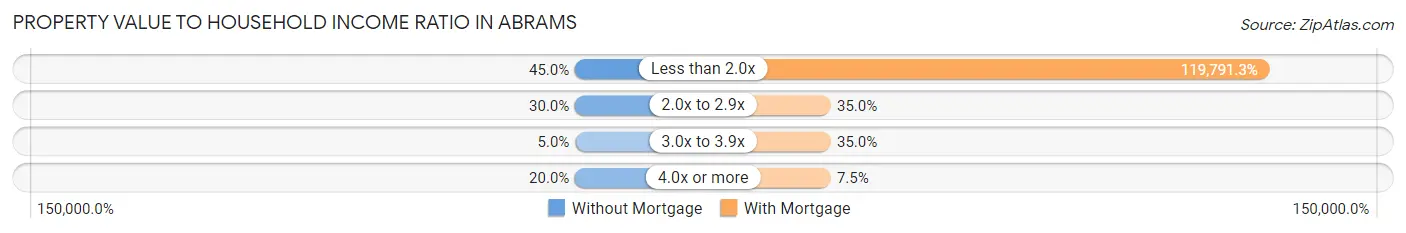
| Value-to-Income Ratio | Without Mortgage | With Mortgage |
| Less than 2.0x | 9 (45.0%) | 95,833 (119,791.2%) |
| 2.0x to 2.9x | 6 (30.0%) | 28 (35.0%) |
| 3.0x to 3.9x | 1 (5.0%) | 28 (35.0%) |
| 4.0x or more | 4 (20.0%) | 6 (7.5%) |
| Total | 20 (100.0%) | 80 (100.0%) |
Real Estate Taxes by Mortgage Status in Abrams
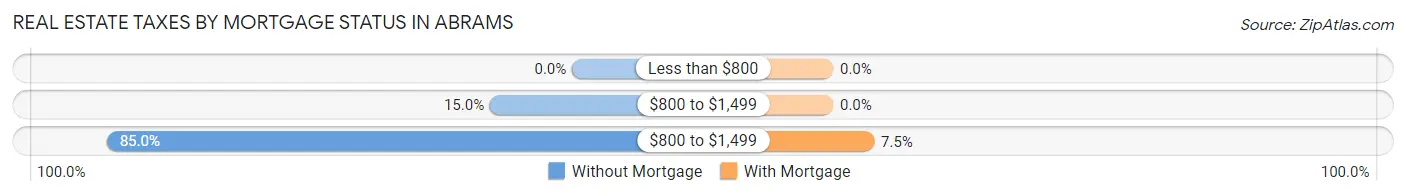
| Property Taxes | Without Mortgage | With Mortgage |
| Less than $800 | 0 (0.0%) | 0 (0.0%) |
| $800 to $1,499 | 3 (15.0%) | 0 (0.0%) |
| $800 to $1,499 | 17 (85.0%) | 6 (7.5%) |
| Total | 20 (100.0%) | 80 (100.0%) |
Health & Disability in Abrams
Health Insurance Coverage by Age in Abrams
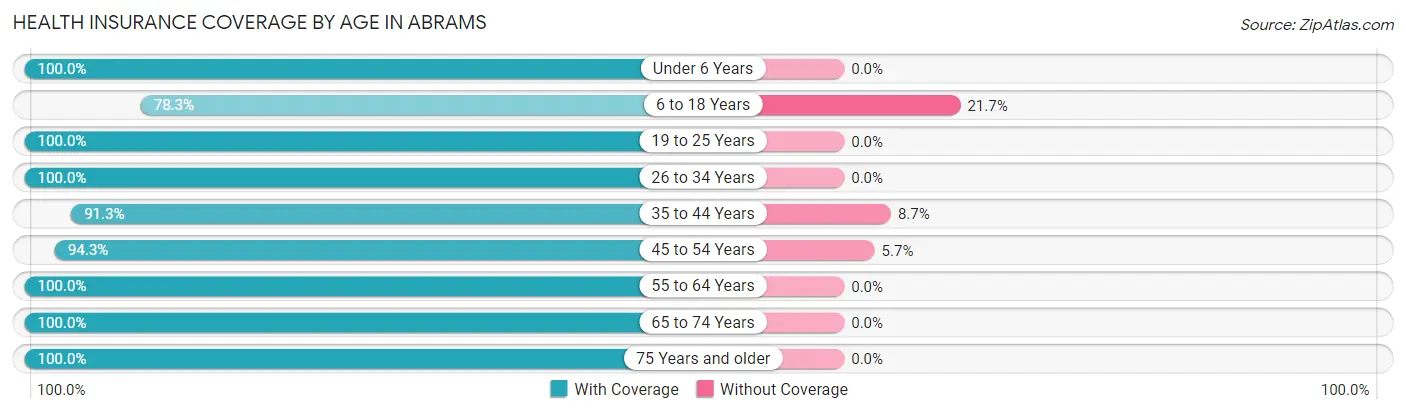
| Age Bracket | With Coverage | Without Coverage |
| Under 6 Years | 9 (100.0%) | 0 (0.0%) |
| 6 to 18 Years | 47 (78.3%) | 13 (21.7%) |
| 19 to 25 Years | 8 (100.0%) | 0 (0.0%) |
| 26 to 34 Years | 38 (100.0%) | 0 (0.0%) |
| 35 to 44 Years | 42 (91.3%) | 4 (8.7%) |
| 45 to 54 Years | 50 (94.3%) | 3 (5.7%) |
| 55 to 64 Years | 32 (100.0%) | 0 (0.0%) |
| 65 to 74 Years | 28 (100.0%) | 0 (0.0%) |
| 75 Years and older | 8 (100.0%) | 0 (0.0%) |
| Total | 262 (92.9%) | 20 (7.1%) |
Health Insurance Coverage by Citizenship Status in Abrams
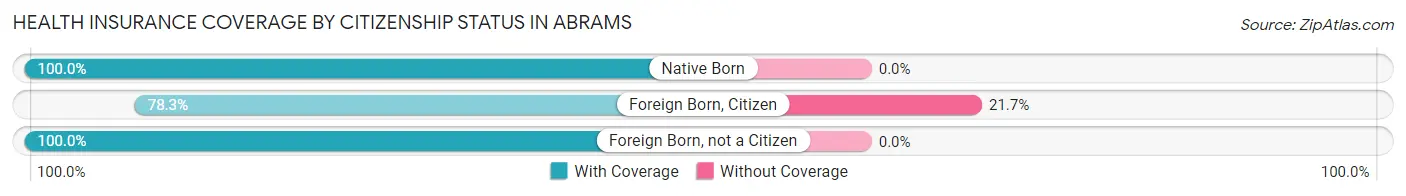
| Citizenship Status | With Coverage | Without Coverage |
| Native Born | 9 (100.0%) | 0 (0.0%) |
| Foreign Born, Citizen | 47 (78.3%) | 13 (21.7%) |
| Foreign Born, not a Citizen | 8 (100.0%) | 0 (0.0%) |
Health Insurance Coverage by Household Income in Abrams
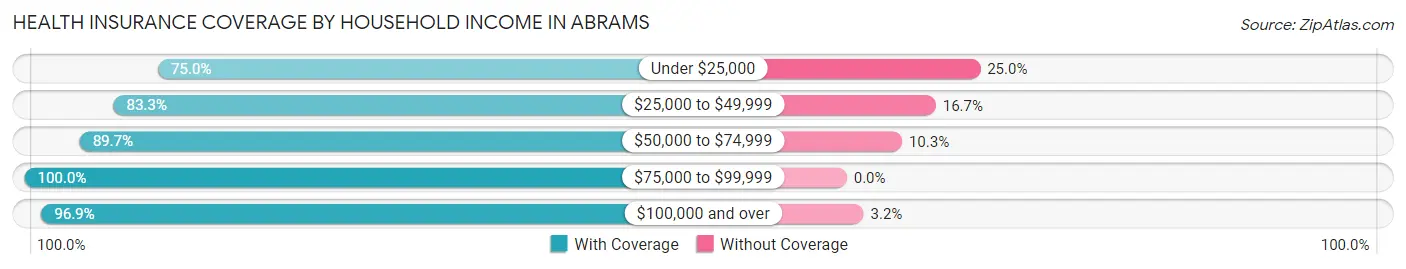
| Household Income | With Coverage | Without Coverage |
| Under $25,000 | 27 (75.0%) | 9 (25.0%) |
| $25,000 to $49,999 | 20 (83.3%) | 4 (16.7%) |
| $50,000 to $74,999 | 26 (89.7%) | 3 (10.3%) |
| $75,000 to $99,999 | 66 (100.0%) | 0 (0.0%) |
| $100,000 and over | 123 (96.9%) | 4 (3.2%) |
Public vs Private Health Insurance Coverage by Age in Abrams
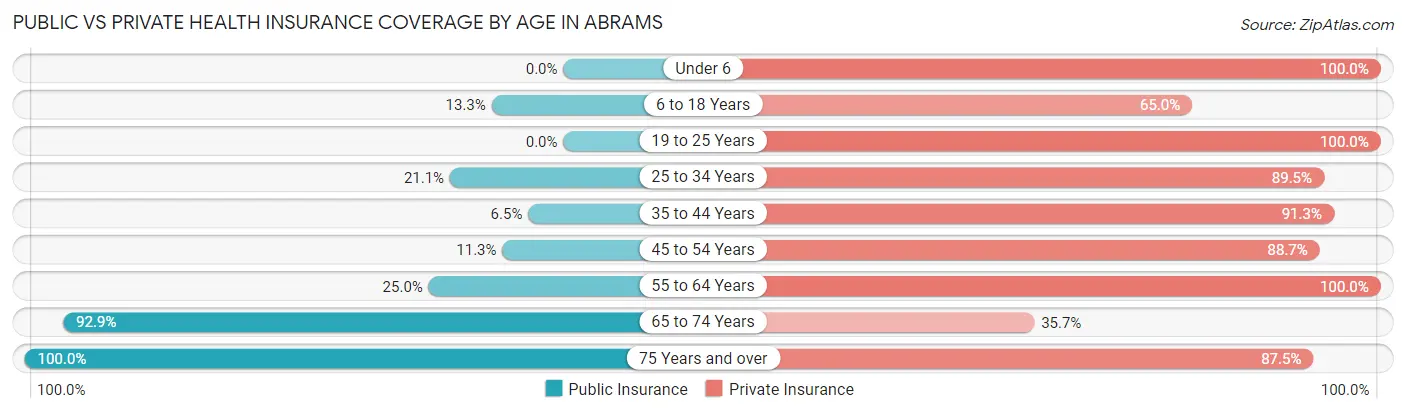
| Age Bracket | Public Insurance | Private Insurance |
| Under 6 | 0 (0.0%) | 9 (100.0%) |
| 6 to 18 Years | 8 (13.3%) | 39 (65.0%) |
| 19 to 25 Years | 0 (0.0%) | 8 (100.0%) |
| 25 to 34 Years | 8 (21.0%) | 34 (89.5%) |
| 35 to 44 Years | 3 (6.5%) | 42 (91.3%) |
| 45 to 54 Years | 6 (11.3%) | 47 (88.7%) |
| 55 to 64 Years | 8 (25.0%) | 32 (100.0%) |
| 65 to 74 Years | 26 (92.9%) | 10 (35.7%) |
| 75 Years and over | 8 (100.0%) | 7 (87.5%) |
| Total | 67 (23.8%) | 228 (80.8%) |
Disability Status by Sex by Age in Abrams
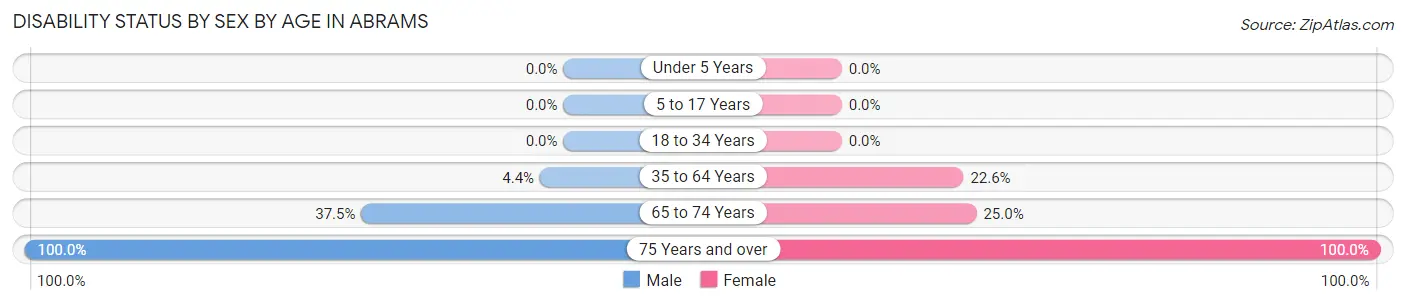
| Age Bracket | Male | Female |
| Under 5 Years | 0 (0.0%) | 0 (0.0%) |
| 5 to 17 Years | 0 (0.0%) | 0 (0.0%) |
| 18 to 34 Years | 0 (0.0%) | 0 (0.0%) |
| 35 to 64 Years | 3 (4.3%) | 14 (22.6%) |
| 65 to 74 Years | 6 (37.5%) | 3 (25.0%) |
| 75 Years and over | 1 (100.0%) | 7 (100.0%) |
Disability Class by Sex by Age in Abrams
Disability Class: Hearing Difficulty
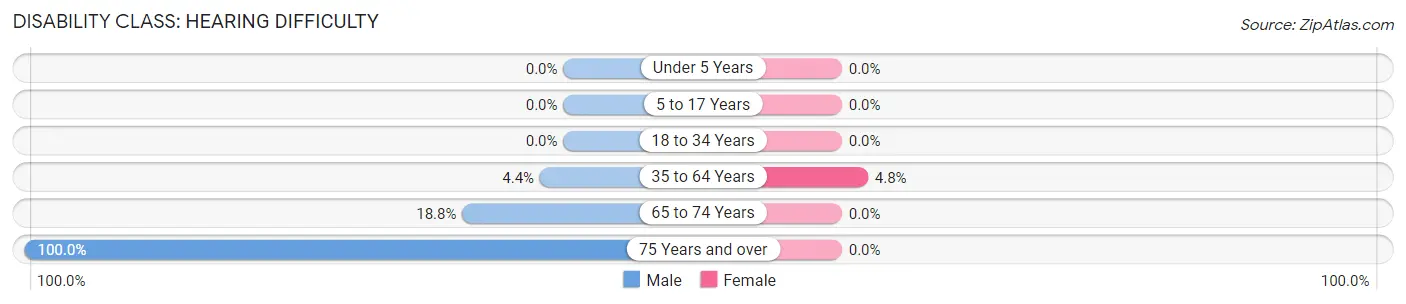
| Age Bracket | Male | Female |
| Under 5 Years | 0 (0.0%) | 0 (0.0%) |
| 5 to 17 Years | 0 (0.0%) | 0 (0.0%) |
| 18 to 34 Years | 0 (0.0%) | 0 (0.0%) |
| 35 to 64 Years | 3 (4.3%) | 3 (4.8%) |
| 65 to 74 Years | 3 (18.8%) | 0 (0.0%) |
| 75 Years and over | 1 (100.0%) | 0 (0.0%) |
Disability Class: Vision Difficulty
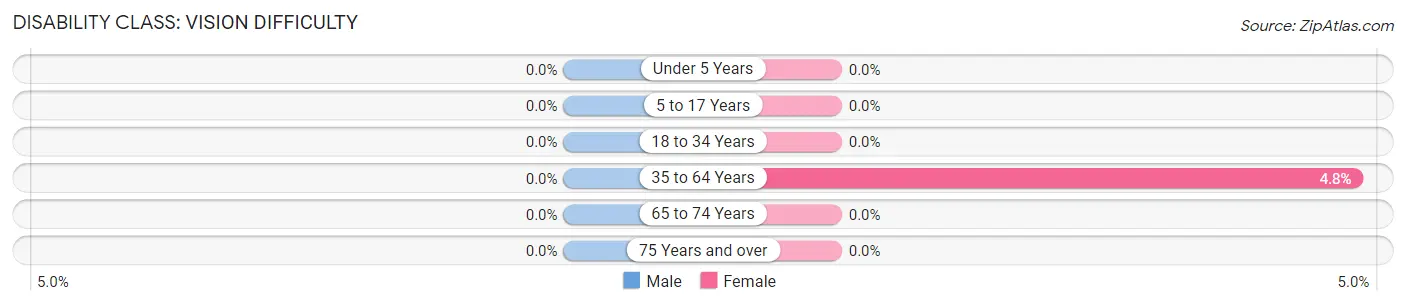
| Age Bracket | Male | Female |
| Under 5 Years | 0 (0.0%) | 0 (0.0%) |
| 5 to 17 Years | 0 (0.0%) | 0 (0.0%) |
| 18 to 34 Years | 0 (0.0%) | 0 (0.0%) |
| 35 to 64 Years | 0 (0.0%) | 3 (4.8%) |
| 65 to 74 Years | 0 (0.0%) | 0 (0.0%) |
| 75 Years and over | 0 (0.0%) | 0 (0.0%) |
Disability Class: Cognitive Difficulty
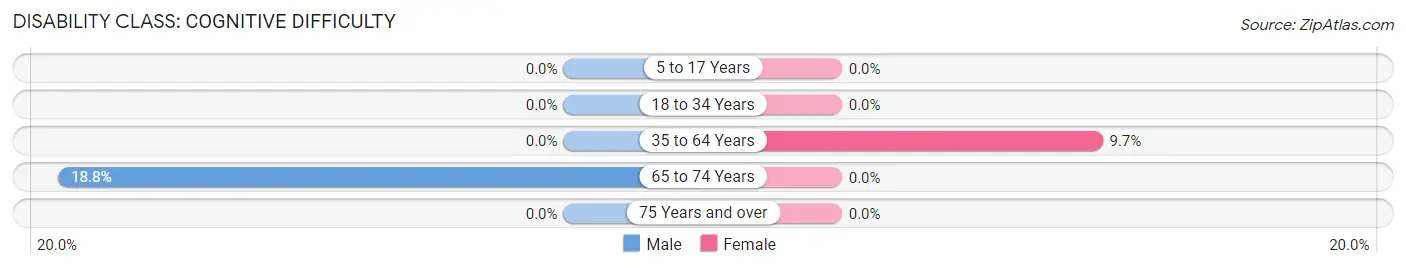
| Age Bracket | Male | Female |
| 5 to 17 Years | 0 (0.0%) | 0 (0.0%) |
| 18 to 34 Years | 0 (0.0%) | 0 (0.0%) |
| 35 to 64 Years | 0 (0.0%) | 6 (9.7%) |
| 65 to 74 Years | 3 (18.8%) | 0 (0.0%) |
| 75 Years and over | 0 (0.0%) | 0 (0.0%) |
Disability Class: Ambulatory Difficulty
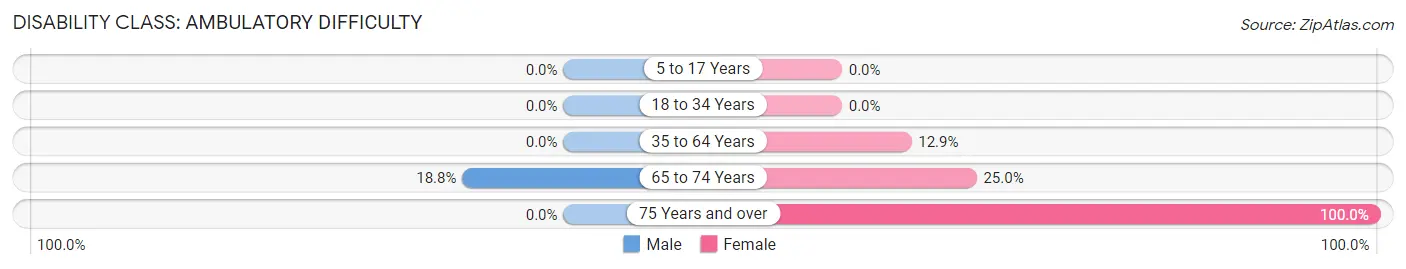
| Age Bracket | Male | Female |
| 5 to 17 Years | 0 (0.0%) | 0 (0.0%) |
| 18 to 34 Years | 0 (0.0%) | 0 (0.0%) |
| 35 to 64 Years | 0 (0.0%) | 8 (12.9%) |
| 65 to 74 Years | 3 (18.8%) | 3 (25.0%) |
| 75 Years and over | 0 (0.0%) | 7 (100.0%) |
Disability Class: Self-Care Difficulty
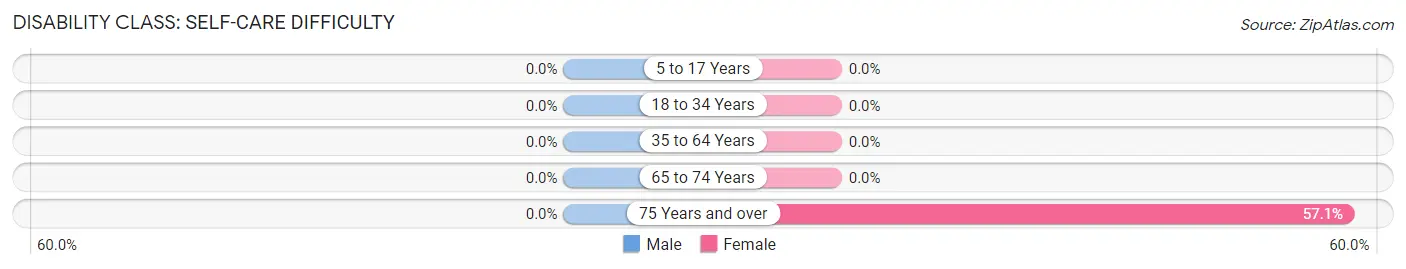
| Age Bracket | Male | Female |
| 5 to 17 Years | 0 (0.0%) | 0 (0.0%) |
| 18 to 34 Years | 0 (0.0%) | 0 (0.0%) |
| 35 to 64 Years | 0 (0.0%) | 0 (0.0%) |
| 65 to 74 Years | 0 (0.0%) | 0 (0.0%) |
| 75 Years and over | 0 (0.0%) | 4 (57.1%) |
Technology Access in Abrams
Computing Device Access in Abrams
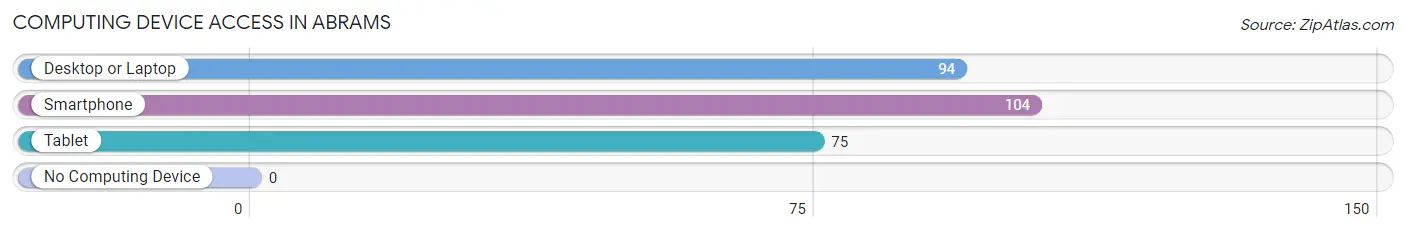
| Device Type | # Households | % Households |
| Desktop or Laptop | 94 | 86.2% |
| Smartphone | 104 | 95.4% |
| Tablet | 75 | 68.8% |
| No Computing Device | 0 | 0.0% |
| Total | 109 | 100.0% |
Internet Access in Abrams
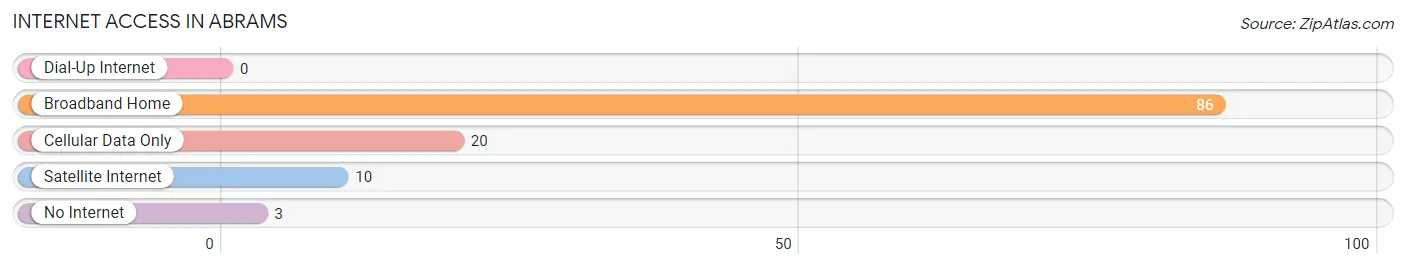
| Internet Type | # Households | % Households |
| Dial-Up Internet | 0 | 0.0% |
| Broadband Home | 86 | 78.9% |
| Cellular Data Only | 20 | 18.3% |
| Satellite Internet | 10 | 9.2% |
| No Internet | 3 | 2.8% |
| Total | 109 | 100.0% |
Abrams Summary
Abrams, Wisconsin is a small village located in Oconto County, Wisconsin. It is situated on the banks of the Oconto River, approximately 20 miles northeast of Green Bay. The village has a population of approximately 1,000 people and covers an area of 1.2 square miles.
History
The area that is now Abrams was first settled in the late 1840s by a group of French-Canadian immigrants. The village was originally known as “La Petite Chute”, which translates to “Little Falls” in English. The village was renamed Abrams in 1876 after the first postmaster, John Abrams.
In the late 19th century, Abrams was a thriving lumber town. The village was home to several sawmills, a grist mill, and a shingle mill. The lumber industry was the primary source of employment for the residents of Abrams.
In the early 20th century, the lumber industry began to decline and the village began to transition to a more agricultural-based economy. The village was home to several dairy farms and a cheese factory.
Geography
Abrams is located in the northeastern corner of Oconto County, Wisconsin. The village is situated on the banks of the Oconto River, approximately 20 miles northeast of Green Bay. The village is surrounded by rolling hills and forests.
The climate in Abrams is typical of the Upper Midwest. Summers are warm and humid, while winters are cold and snowy. The average annual temperature is around 40 degrees Fahrenheit.
Economy
The economy of Abrams is largely based on agriculture and tourism. The village is home to several dairy farms and a cheese factory. The village also has several small businesses, including a grocery store, a hardware store, and a restaurant.
Tourism is an important part of the local economy. The village is home to several parks and recreational areas, including the Oconto River State Wildlife Area and the Abrams State Forest. The village also hosts several annual events, such as the Abrams Fall Festival and the Abrams Winter Festival.
Demographics
As of the 2010 census, the population of Abrams was 1,000 people. The racial makeup of the village was 97.2% White, 0.7% African American, 0.3% Native American, 0.2% Asian, and 1.6% from other races.
The median household income in Abrams was $41,250, and the median family income was $50,000. The per capita income was $20,000. Approximately 10.2% of the population was below the poverty line.
The village is served by the Oconto County School District. The village has one elementary school, one middle school, and one high school. The village also has a public library.
Common Questions
What is Per Capita Income in Abrams?
Per Capita income in Abrams is $35,230.
What is the Median Family Income in Abrams?
Median Family Income in Abrams is $92,083.
What is the Median Household income in Abrams?
Median Household Income in Abrams is $88,542.
What is Income or Wage Gap in Abrams?
Income or Wage Gap in Abrams is 32.2%.
Women in Abrams earn 67.8 cents for every dollar earned by a man.
What is Inequality or Gini Index in Abrams?
Inequality or Gini Index in Abrams is 0.33.
What is the Total Population of Abrams?
Total Population of Abrams is 282.
What is the Total Male Population of Abrams?
Total Male Population of Abrams is 130.
What is the Total Female Population of Abrams?
Total Female Population of Abrams is 152.
What is the Ratio of Males per 100 Females in Abrams?
There are 85.53 Males per 100 Females in Abrams.
What is the Ratio of Females per 100 Males in Abrams?
There are 116.92 Females per 100 Males in Abrams.
What is the Median Population Age in Abrams?
Median Population Age in Abrams is 37.8 Years.
What is the Average Family Size in Abrams
Average Family Size in Abrams is 2.9 People.
What is the Average Household Size in Abrams
Average Household Size in Abrams is 2.6 People.
How Large is the Labor Force in Abrams?
There are 177 People in the Labor Forcein in Abrams.
What is the Percentage of People in the Labor Force in Abrams?
76.6% of People are in the Labor Force in Abrams.
What is the Unemployment Rate in Abrams?
Unemployment Rate in Abrams is 3.4%.