Zip Codes with the Highest Percentage of Population Employed in Installation, Maintenance & Repair in Richland, WA
RELATED REPORTS & OPTIONS
Installation, Maintenance & Repair
Richland
Compare Zip Codes
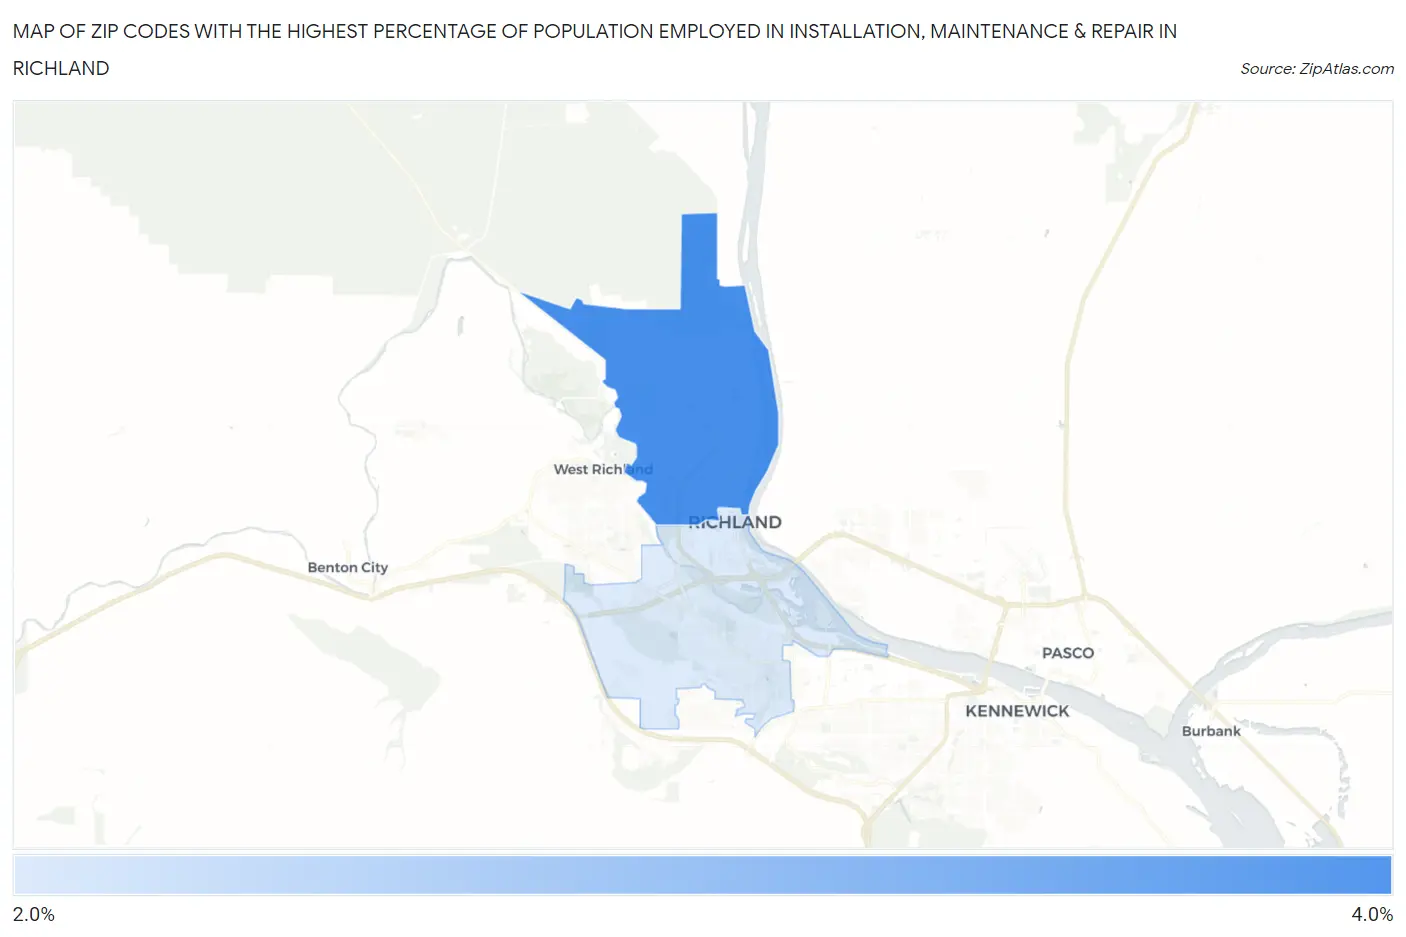
Map of Zip Codes with the Highest Percentage of Population Employed in Installation, Maintenance & Repair in Richland
2.5%
3.2%
Zip Codes with the Highest Percentage of Population Employed in Installation, Maintenance & Repair in Richland, WA
| Zip Code | % Employed | vs State | vs National | |
| 1. | 99354 | 3.2% | 2.9%(+0.304)#255 | 3.1%(+0.165)#15,870 |
| 2. | 99352 | 2.5% | 2.9%(-0.440)#325 | 3.1%(-0.579)#19,609 |
1
Common Questions
What are the Top Zip Codes with the Highest Percentage of Population Employed in Installation, Maintenance & Repair in Richland, WA?
Top Zip Codes with the Highest Percentage of Population Employed in Installation, Maintenance & Repair in Richland, WA are:
What zip code has the Highest Percentage of Population Employed in Installation, Maintenance & Repair in Richland, WA?
99354 has the Highest Percentage of Population Employed in Installation, Maintenance & Repair in Richland, WA with 3.2%.
What is the Percentage of Population Employed in Installation, Maintenance & Repair in Richland, WA?
Percentage of Population Employed in Installation, Maintenance & Repair in Richland is 2.8%.
What is the Percentage of Population Employed in Installation, Maintenance & Repair in Washington?
Percentage of Population Employed in Installation, Maintenance & Repair in Washington is 2.9%.
What is the Percentage of Population Employed in Installation, Maintenance & Repair in the United States?
Percentage of Population Employed in Installation, Maintenance & Repair in the United States is 3.1%.