Zip Codes with the Highest Percentage of Population Employed in Food Preparation & Serving in Spokane, WA
RELATED REPORTS & OPTIONS
Food Preparation & Serving
Spokane
Compare Zip Codes
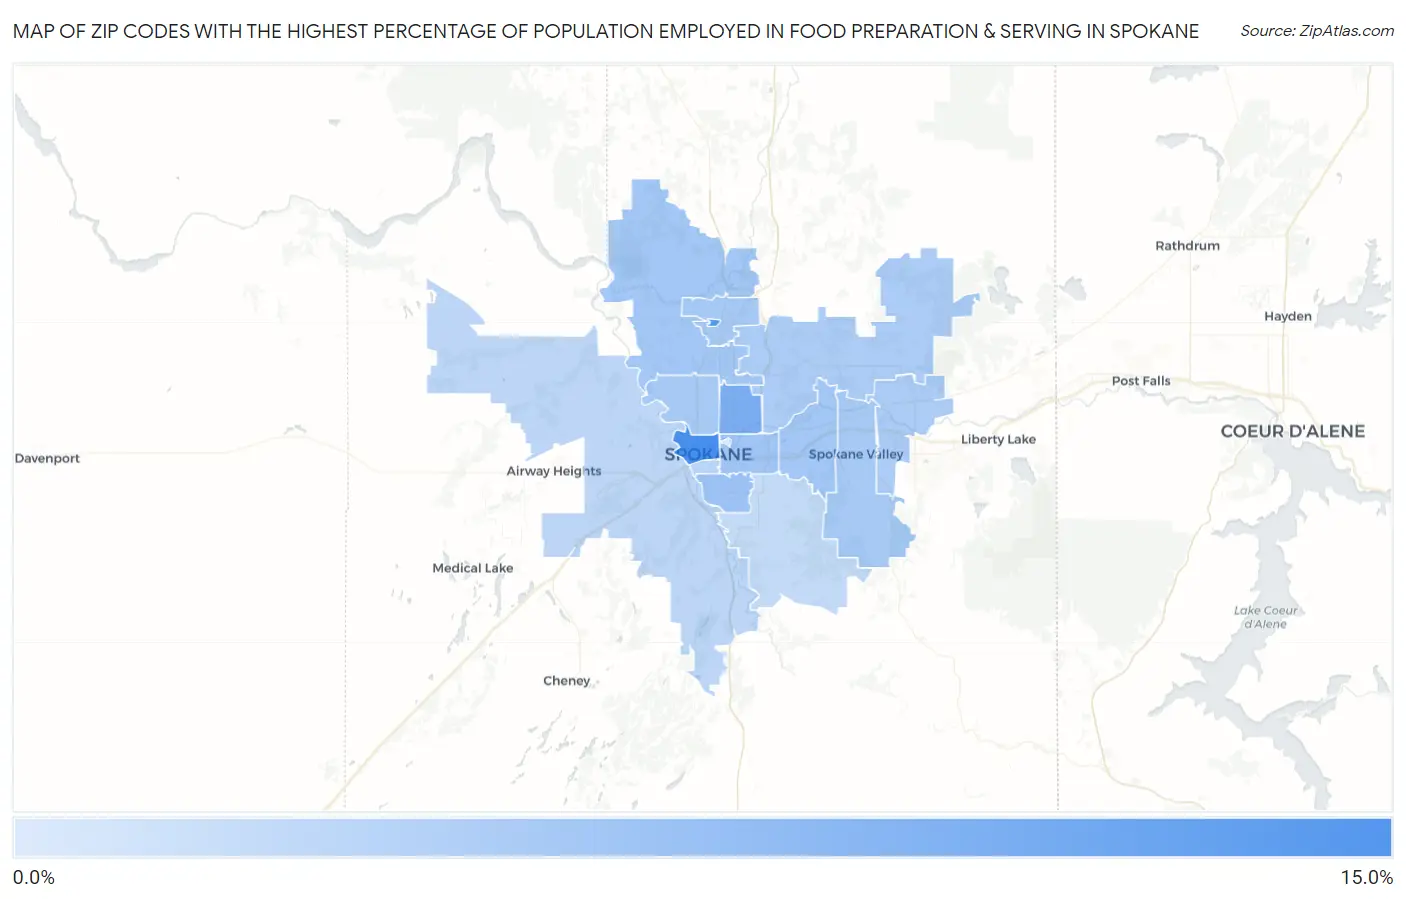
Map of Zip Codes with the Highest Percentage of Population Employed in Food Preparation & Serving in Spokane
1.7%
13.8%
Zip Codes with the Highest Percentage of Population Employed in Food Preparation & Serving in Spokane, WA
| Zip Code | % Employed | vs State | vs National | |
| 1. | 99201 | 13.8% | 5.1%(+8.65)#19 | 5.3%(+8.50)#1,211 |
| 2. | 99251 | 12.7% | 5.1%(+7.55)#25 | 5.3%(+7.41)#1,468 |
| 3. | 99207 | 9.5% | 5.1%(+4.31)#55 | 5.3%(+4.16)#3,096 |
| 4. | 99203 | 6.7% | 5.1%(+1.60)#120 | 5.3%(+1.46)#7,209 |
| 5. | 99202 | 6.4% | 5.1%(+1.28)#135 | 5.3%(+1.13)#8,097 |
| 6. | 99208 | 6.2% | 5.1%(+1.08)#152 | 5.3%(+0.939)#8,664 |
| 7. | 99212 | 6.2% | 5.1%(+1.07)#153 | 5.3%(+0.926)#8,698 |
| 8. | 99206 | 5.8% | 5.1%(+0.696)#174 | 5.3%(+0.553)#9,903 |
| 9. | 99218 | 5.8% | 5.1%(+0.689)#175 | 5.3%(+0.546)#9,927 |
| 10. | 99205 | 5.8% | 5.1%(+0.647)#176 | 5.3%(+0.504)#10,063 |
| 11. | 99216 | 5.5% | 5.1%(+0.376)#191 | 5.3%(+0.233)#11,003 |
| 12. | 99217 | 5.4% | 5.1%(+0.232)#206 | 5.3%(+0.089)#11,489 |
| 13. | 99204 | 4.3% | 5.1%(-0.808)#293 | 5.3%(-0.951)#15,727 |
| 14. | 99224 | 4.2% | 5.1%(-0.924)#302 | 5.3%(-1.07)#16,247 |
| 15. | 99223 | 3.6% | 5.1%(-1.52)#347 | 5.3%(-1.66)#18,681 |
| 16. | 99258 | 1.7% | 5.1%(-3.48)#466 | 5.3%(-3.62)#25,605 |
1
Common Questions
What are the Top 10 Zip Codes with the Highest Percentage of Population Employed in Food Preparation & Serving in Spokane, WA?
Top 10 Zip Codes with the Highest Percentage of Population Employed in Food Preparation & Serving in Spokane, WA are:
What zip code has the Highest Percentage of Population Employed in Food Preparation & Serving in Spokane, WA?
99201 has the Highest Percentage of Population Employed in Food Preparation & Serving in Spokane, WA with 13.8%.
What is the Percentage of Population Employed in Food Preparation & Serving in Spokane, WA?
Percentage of Population Employed in Food Preparation & Serving in Spokane is 6.7%.
What is the Percentage of Population Employed in Food Preparation & Serving in Washington?
Percentage of Population Employed in Food Preparation & Serving in Washington is 5.1%.
What is the Percentage of Population Employed in Food Preparation & Serving in the United States?
Percentage of Population Employed in Food Preparation & Serving in the United States is 5.3%.