Zip Codes with the Highest Percentage of Population Employed in Food Preparation & Serving in Bothell, WA
RELATED REPORTS & OPTIONS
Food Preparation & Serving
Bothell
Compare Zip Codes
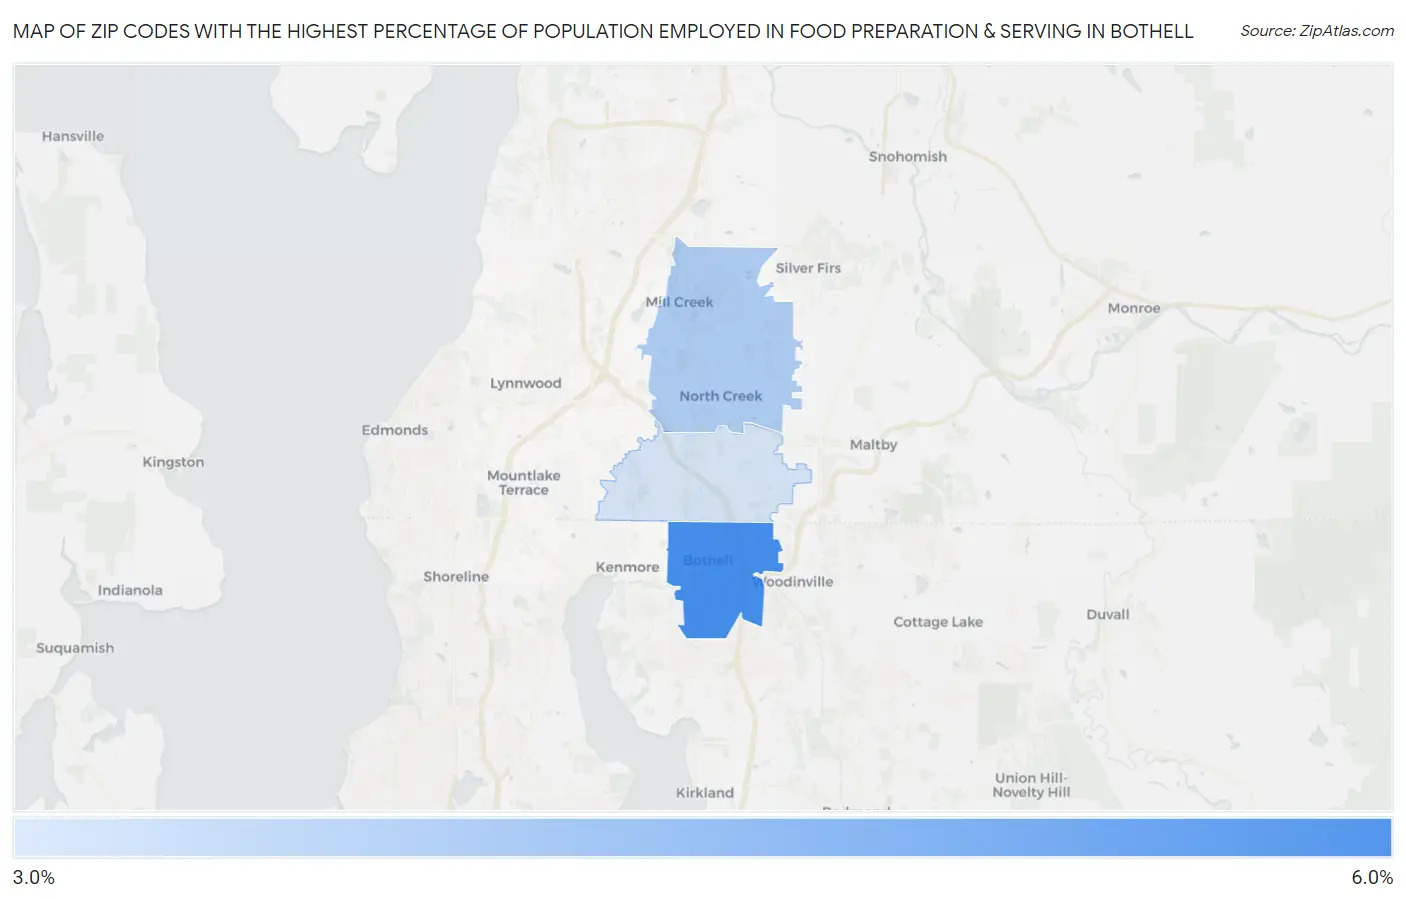
Map of Zip Codes with the Highest Percentage of Population Employed in Food Preparation & Serving in Bothell
3.0%
5.2%
Zip Codes with the Highest Percentage of Population Employed in Food Preparation & Serving in Bothell, WA
| Zip Code | % Employed | vs State | vs National | |
| 1. | 98011 | 5.2% | 5.1%(+0.034)#227 | 5.3%(-0.109)#12,251 |
| 2. | 98012 | 3.6% | 5.1%(-1.53)#350 | 5.3%(-1.67)#18,713 |
| 3. | 98021 | 3.0% | 5.1%(-2.14)#395 | 5.3%(-2.28)#21,253 |
1
Common Questions
What are the Top Zip Codes with the Highest Percentage of Population Employed in Food Preparation & Serving in Bothell, WA?
Top Zip Codes with the Highest Percentage of Population Employed in Food Preparation & Serving in Bothell, WA are:
What zip code has the Highest Percentage of Population Employed in Food Preparation & Serving in Bothell, WA?
98011 has the Highest Percentage of Population Employed in Food Preparation & Serving in Bothell, WA with 5.2%.
What is the Percentage of Population Employed in Food Preparation & Serving in Bothell, WA?
Percentage of Population Employed in Food Preparation & Serving in Bothell is 4.2%.
What is the Percentage of Population Employed in Food Preparation & Serving in Washington?
Percentage of Population Employed in Food Preparation & Serving in Washington is 5.1%.
What is the Percentage of Population Employed in Food Preparation & Serving in the United States?
Percentage of Population Employed in Food Preparation & Serving in the United States is 5.3%.