Zip Codes with the Highest Percentage of Population Employed in Arts, Entertainment & Recreation in Winchester, VA
RELATED REPORTS & OPTIONS
Arts, Entertainment & Recreation
Winchester
Compare Zip Codes
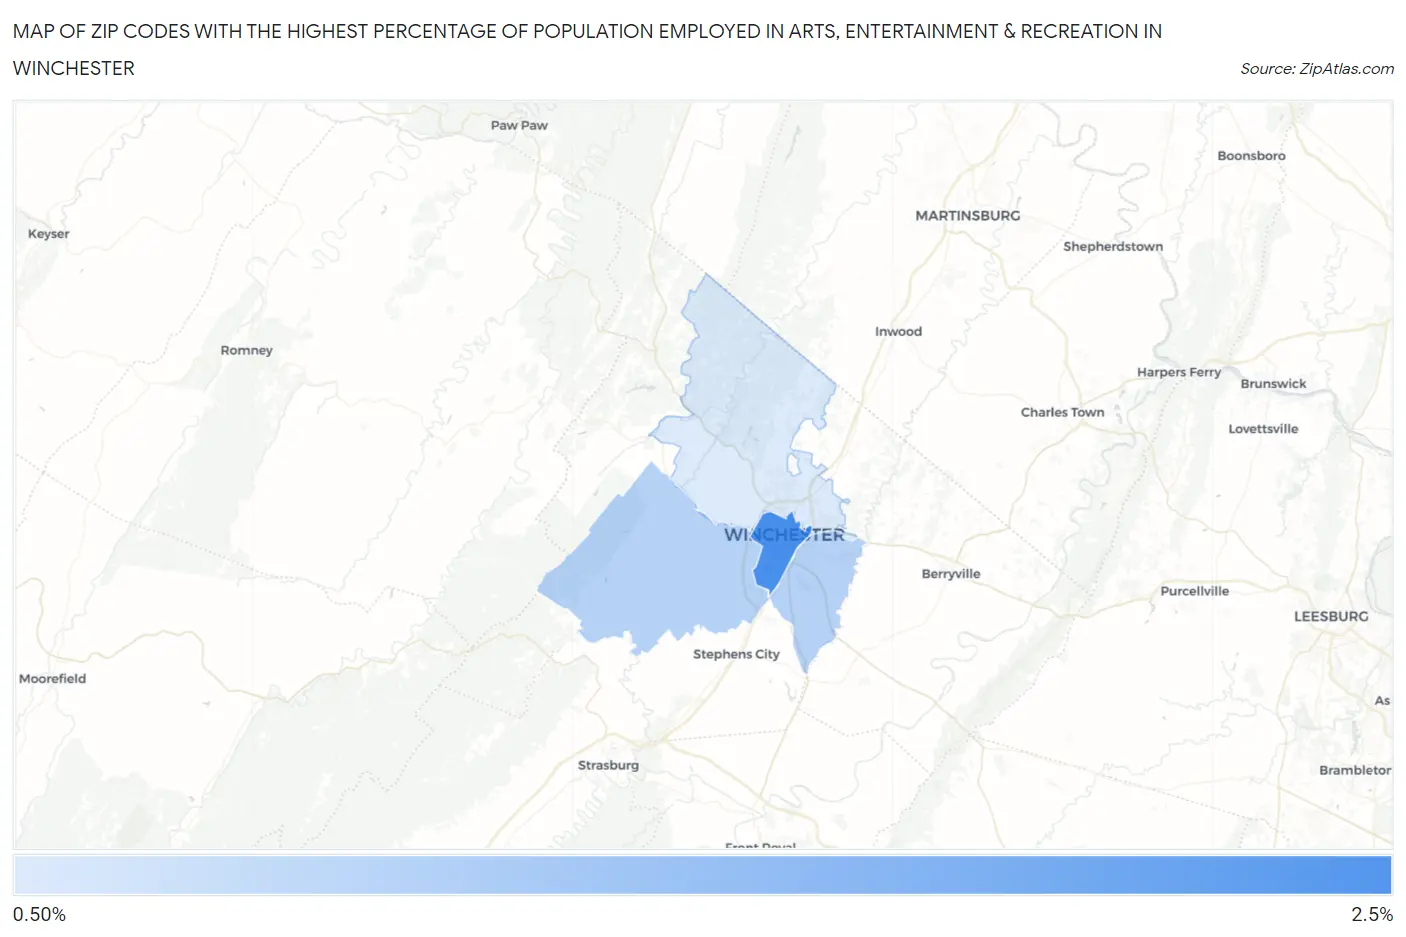
Map of Zip Codes with the Highest Percentage of Population Employed in Arts, Entertainment & Recreation in Winchester
0.0%
2.5%
Zip Codes with the Highest Percentage of Population Employed in Arts, Entertainment & Recreation in Winchester, VA
| Zip Code | % Employed | vs State | vs National | |
| 1. | 22601 | 2.3% | 1.9%(+0.427)#198 | 2.1%(+0.195)#8,234 |
| 2. | 22602 | 1.0% | 1.9%(-0.818)#427 | 2.1%(-1.05)#16,705 |
| 3. | 22603 | 0.60% | 1.9%(-1.25)#493 | 2.1%(-1.48)#19,825 |
1
Common Questions
What are the Top Zip Codes with the Highest Percentage of Population Employed in Arts, Entertainment & Recreation in Winchester, VA?
Top Zip Codes with the Highest Percentage of Population Employed in Arts, Entertainment & Recreation in Winchester, VA are:
What zip code has the Highest Percentage of Population Employed in Arts, Entertainment & Recreation in Winchester, VA?
22601 has the Highest Percentage of Population Employed in Arts, Entertainment & Recreation in Winchester, VA with 2.3%.
What is the Percentage of Population Employed in Arts, Entertainment & Recreation in Winchester, VA?
Percentage of Population Employed in Arts, Entertainment & Recreation in Winchester is 2.1%.
What is the Percentage of Population Employed in Arts, Entertainment & Recreation in Virginia?
Percentage of Population Employed in Arts, Entertainment & Recreation in Virginia is 1.9%.
What is the Percentage of Population Employed in Arts, Entertainment & Recreation in the United States?
Percentage of Population Employed in Arts, Entertainment & Recreation in the United States is 2.1%.