Zip Codes with the Highest Percentage of Population Employed in Professional & Scientific Services in Warrenton, VA
RELATED REPORTS & OPTIONS
Professional & Scientific Services
Warrenton
Compare Zip Codes
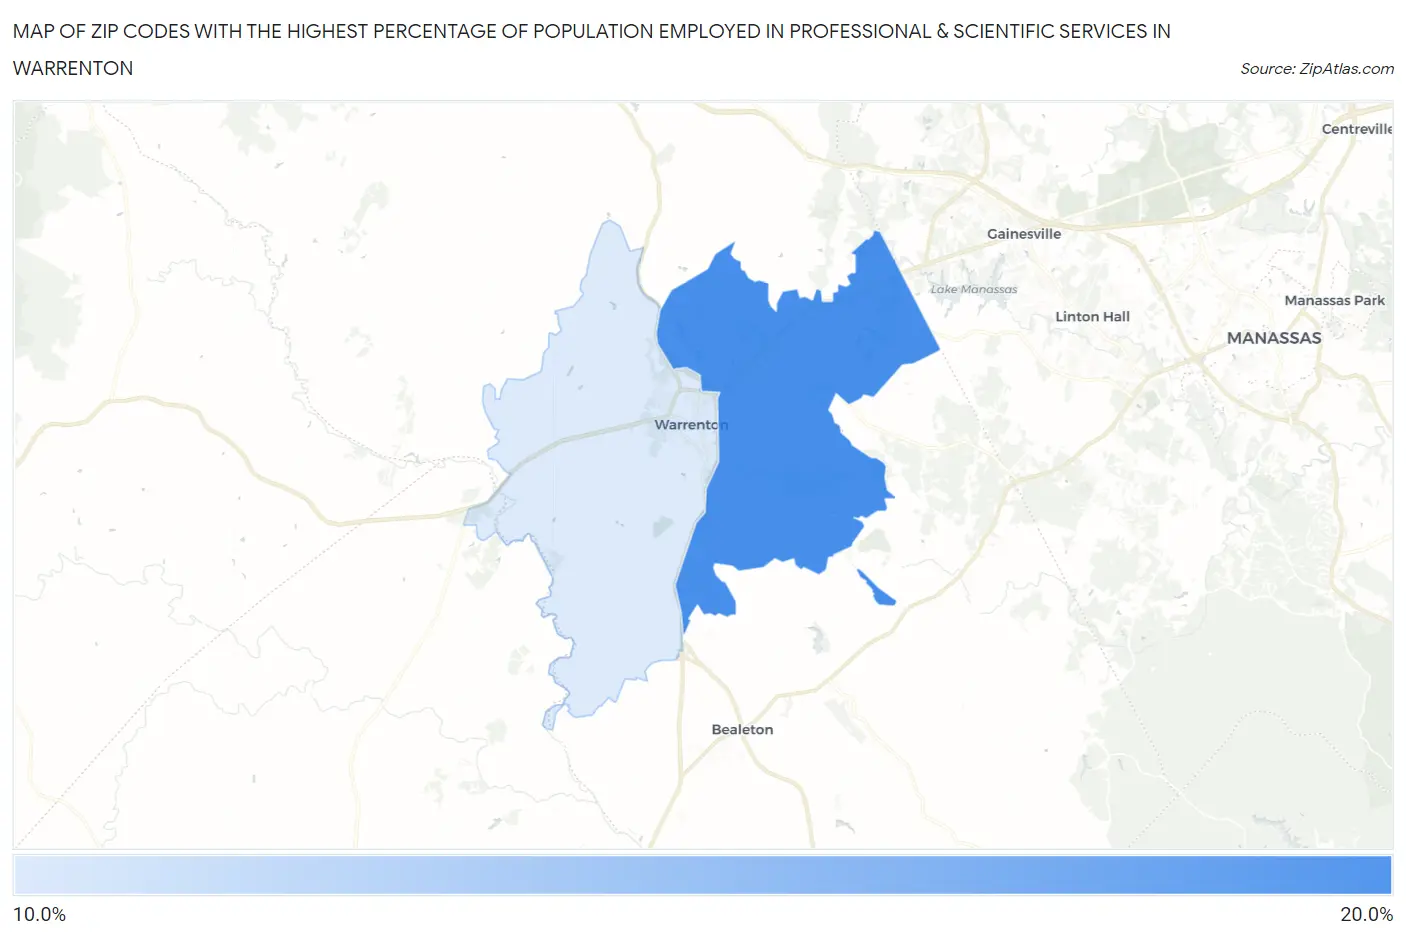
Map of Zip Codes with the Highest Percentage of Population Employed in Professional & Scientific Services in Warrenton
15.1%
17.3%
Zip Codes with the Highest Percentage of Population Employed in Professional & Scientific Services in Warrenton, VA
| Zip Code | % Employed | vs State | vs National | |
| 1. | 20187 | 17.3% | 12.2%(+5.13)#89 | 7.8%(+9.48)#1,282 |
| 2. | 20186 | 15.1% | 12.2%(+2.89)#109 | 7.8%(+7.24)#1,871 |
1
Common Questions
What are the Top Zip Codes with the Highest Percentage of Population Employed in Professional & Scientific Services in Warrenton, VA?
Top Zip Codes with the Highest Percentage of Population Employed in Professional & Scientific Services in Warrenton, VA are:
What zip code has the Highest Percentage of Population Employed in Professional & Scientific Services in Warrenton, VA?
20187 has the Highest Percentage of Population Employed in Professional & Scientific Services in Warrenton, VA with 17.3%.
What is the Percentage of Population Employed in Professional & Scientific Services in Warrenton, VA?
Percentage of Population Employed in Professional & Scientific Services in Warrenton is 13.7%.
What is the Percentage of Population Employed in Professional & Scientific Services in Virginia?
Percentage of Population Employed in Professional & Scientific Services in Virginia is 12.2%.
What is the Percentage of Population Employed in Professional & Scientific Services in the United States?
Percentage of Population Employed in Professional & Scientific Services in the United States is 7.8%.