Zip Codes with the Highest Percentage of Population Employed in Finance & Insurance in Warrenton, VA
RELATED REPORTS & OPTIONS
Finance & Insurance
Warrenton
Compare Zip Codes
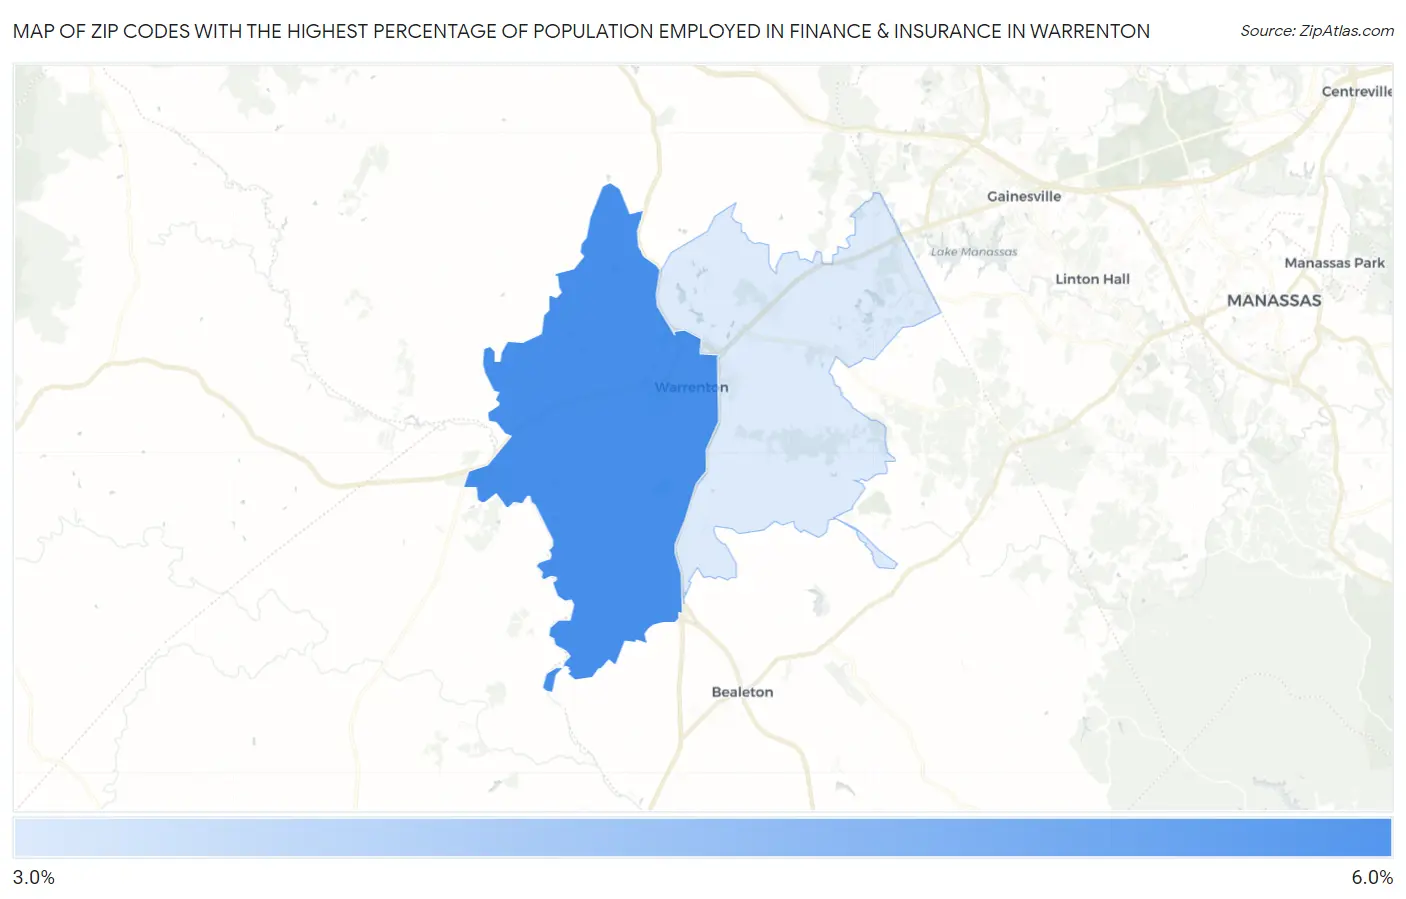
Map of Zip Codes with the Highest Percentage of Population Employed in Finance & Insurance in Warrenton
3.8%
6.0%
Zip Codes with the Highest Percentage of Population Employed in Finance & Insurance in Warrenton, VA
| Zip Code | % Employed | vs State | vs National | |
| 1. | 20186 | 6.0% | 4.6%(+1.37)#135 | 4.8%(+1.19)#5,952 |
| 2. | 20187 | 3.8% | 4.6%(-0.743)#306 | 4.8%(-0.922)#12,210 |
1
Common Questions
What are the Top Zip Codes with the Highest Percentage of Population Employed in Finance & Insurance in Warrenton, VA?
Top Zip Codes with the Highest Percentage of Population Employed in Finance & Insurance in Warrenton, VA are:
What zip code has the Highest Percentage of Population Employed in Finance & Insurance in Warrenton, VA?
20186 has the Highest Percentage of Population Employed in Finance & Insurance in Warrenton, VA with 6.0%.
What is the Percentage of Population Employed in Finance & Insurance in Warrenton, VA?
Percentage of Population Employed in Finance & Insurance in Warrenton is 6.5%.
What is the Percentage of Population Employed in Finance & Insurance in Virginia?
Percentage of Population Employed in Finance & Insurance in Virginia is 4.6%.
What is the Percentage of Population Employed in Finance & Insurance in the United States?
Percentage of Population Employed in Finance & Insurance in the United States is 4.8%.