Zip Codes with the Highest Percentage of Population Employed in Agriculture, Fishing & Hunting in Roanoke, VA
RELATED REPORTS & OPTIONS
Agriculture, Fishing & Hunting
Roanoke
Compare Zip Codes
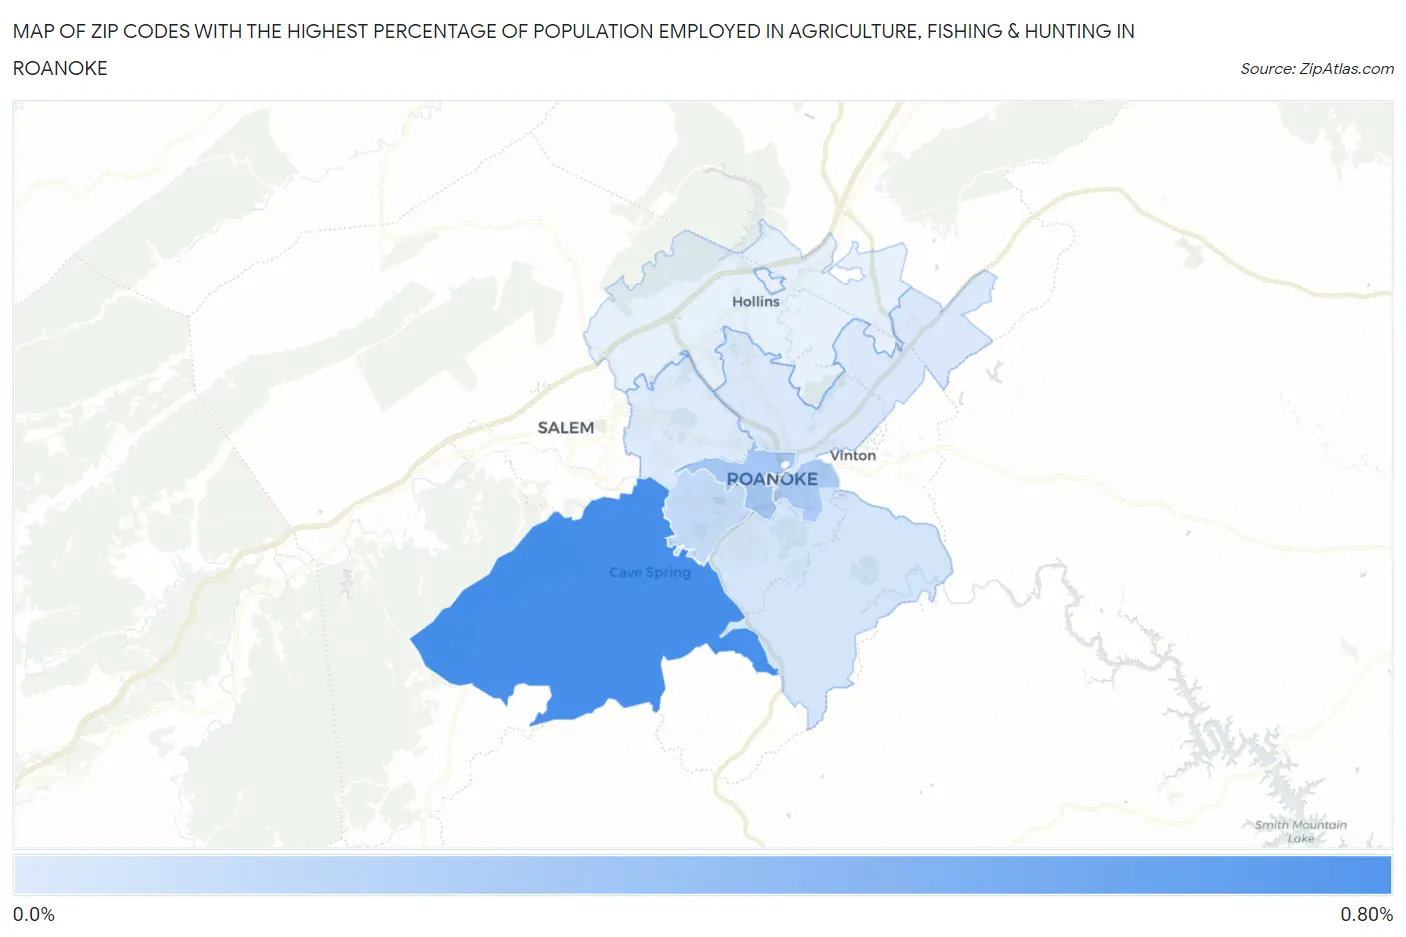
Map of Zip Codes with the Highest Percentage of Population Employed in Agriculture, Fishing & Hunting in Roanoke
0.0%
0.80%
Zip Codes with the Highest Percentage of Population Employed in Agriculture, Fishing & Hunting in Roanoke, VA
| Zip Code | % Employed | vs State | vs National | |
| 1. | 24018 | 0.70% | 0.69%(+0.015)#367 | 1.2%(-0.499)#17,839 |
| 2. | 24016 | 0.37% | 0.69%(-0.318)#433 | 1.2%(-0.831)#20,456 |
| 3. | 24013 | 0.34% | 0.69%(-0.343)#441 | 1.2%(-0.856)#20,714 |
| 4. | 24015 | 0.25% | 0.69%(-0.435)#467 | 1.2%(-0.948)#21,751 |
| 5. | 24014 | 0.19% | 0.69%(-0.498)#486 | 1.2%(-1.01)#22,499 |
| 6. | 24012 | 0.17% | 0.69%(-0.520)#500 | 1.2%(-1.03)#22,786 |
| 7. | 24017 | 0.16% | 0.69%(-0.529)#505 | 1.2%(-1.04)#22,912 |
1
Common Questions
What are the Top 5 Zip Codes with the Highest Percentage of Population Employed in Agriculture, Fishing & Hunting in Roanoke, VA?
Top 5 Zip Codes with the Highest Percentage of Population Employed in Agriculture, Fishing & Hunting in Roanoke, VA are:
What zip code has the Highest Percentage of Population Employed in Agriculture, Fishing & Hunting in Roanoke, VA?
24018 has the Highest Percentage of Population Employed in Agriculture, Fishing & Hunting in Roanoke, VA with 0.70%.
What is the Percentage of Population Employed in Agriculture, Fishing & Hunting in Roanoke, VA?
Percentage of Population Employed in Agriculture, Fishing & Hunting in Roanoke is 0.29%.
What is the Percentage of Population Employed in Agriculture, Fishing & Hunting in Virginia?
Percentage of Population Employed in Agriculture, Fishing & Hunting in Virginia is 0.69%.
What is the Percentage of Population Employed in Agriculture, Fishing & Hunting in the United States?
Percentage of Population Employed in Agriculture, Fishing & Hunting in the United States is 1.2%.