Zip Codes with the Highest Percentage of Population Employed in Agriculture, Fishing & Hunting in Norfolk, VA
RELATED REPORTS & OPTIONS
Agriculture, Fishing & Hunting
Norfolk
Compare Zip Codes
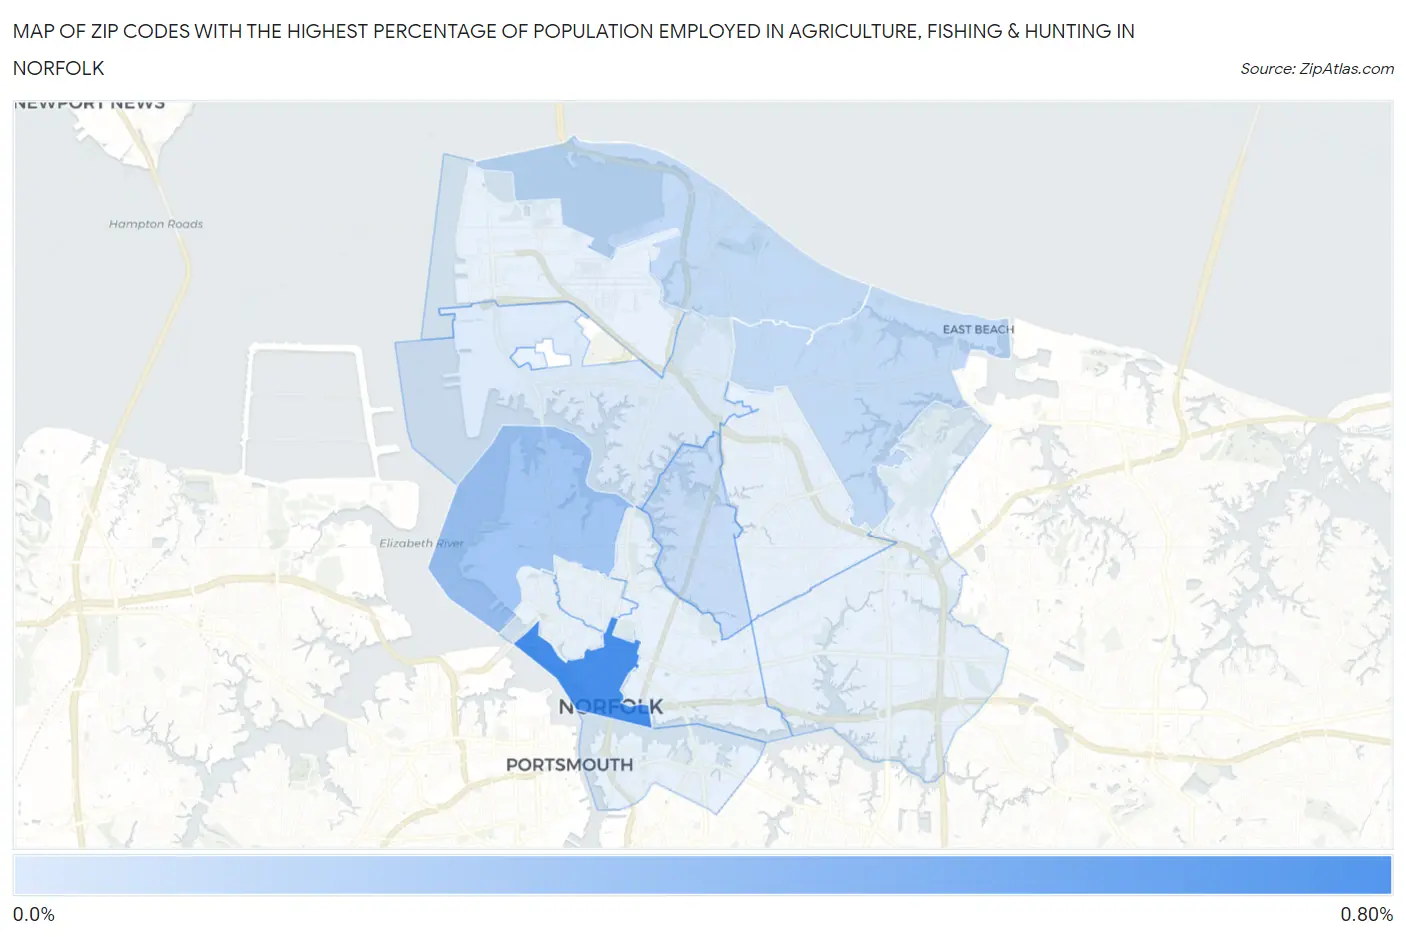
Map of Zip Codes with the Highest Percentage of Population Employed in Agriculture, Fishing & Hunting in Norfolk
0.036%
0.72%
Zip Codes with the Highest Percentage of Population Employed in Agriculture, Fishing & Hunting in Norfolk, VA
| Zip Code | % Employed | vs State | vs National | |
| 1. | 23510 | 0.72% | 0.69%(+0.036)#363 | 1.2%(-0.478)#17,722 |
| 2. | 23508 | 0.30% | 0.69%(-0.385)#457 | 1.2%(-0.898)#21,156 |
| 3. | 23518 | 0.15% | 0.69%(-0.532)#508 | 1.2%(-1.04)#22,954 |
| 4. | 23503 | 0.15% | 0.69%(-0.538)#509 | 1.2%(-1.05)#23,040 |
| 5. | 23509 | 0.13% | 0.69%(-0.554)#514 | 1.2%(-1.07)#23,253 |
| 6. | 23505 | 0.036% | 0.69%(-0.650)#560 | 1.2%(-1.16)#24,487 |
1
Common Questions
What are the Top 10 Zip Codes with the Highest Percentage of Population Employed in Agriculture, Fishing & Hunting in Norfolk, VA?
Top 10 Zip Codes with the Highest Percentage of Population Employed in Agriculture, Fishing & Hunting in Norfolk, VA are:
What zip code has the Highest Percentage of Population Employed in Agriculture, Fishing & Hunting in Norfolk, VA?
23510 has the Highest Percentage of Population Employed in Agriculture, Fishing & Hunting in Norfolk, VA with 0.72%.
What is the Percentage of Population Employed in Agriculture, Fishing & Hunting in Norfolk, VA?
Percentage of Population Employed in Agriculture, Fishing & Hunting in Norfolk is 0.11%.
What is the Percentage of Population Employed in Agriculture, Fishing & Hunting in Virginia?
Percentage of Population Employed in Agriculture, Fishing & Hunting in Virginia is 0.69%.
What is the Percentage of Population Employed in Agriculture, Fishing & Hunting in the United States?
Percentage of Population Employed in Agriculture, Fishing & Hunting in the United States is 1.2%.