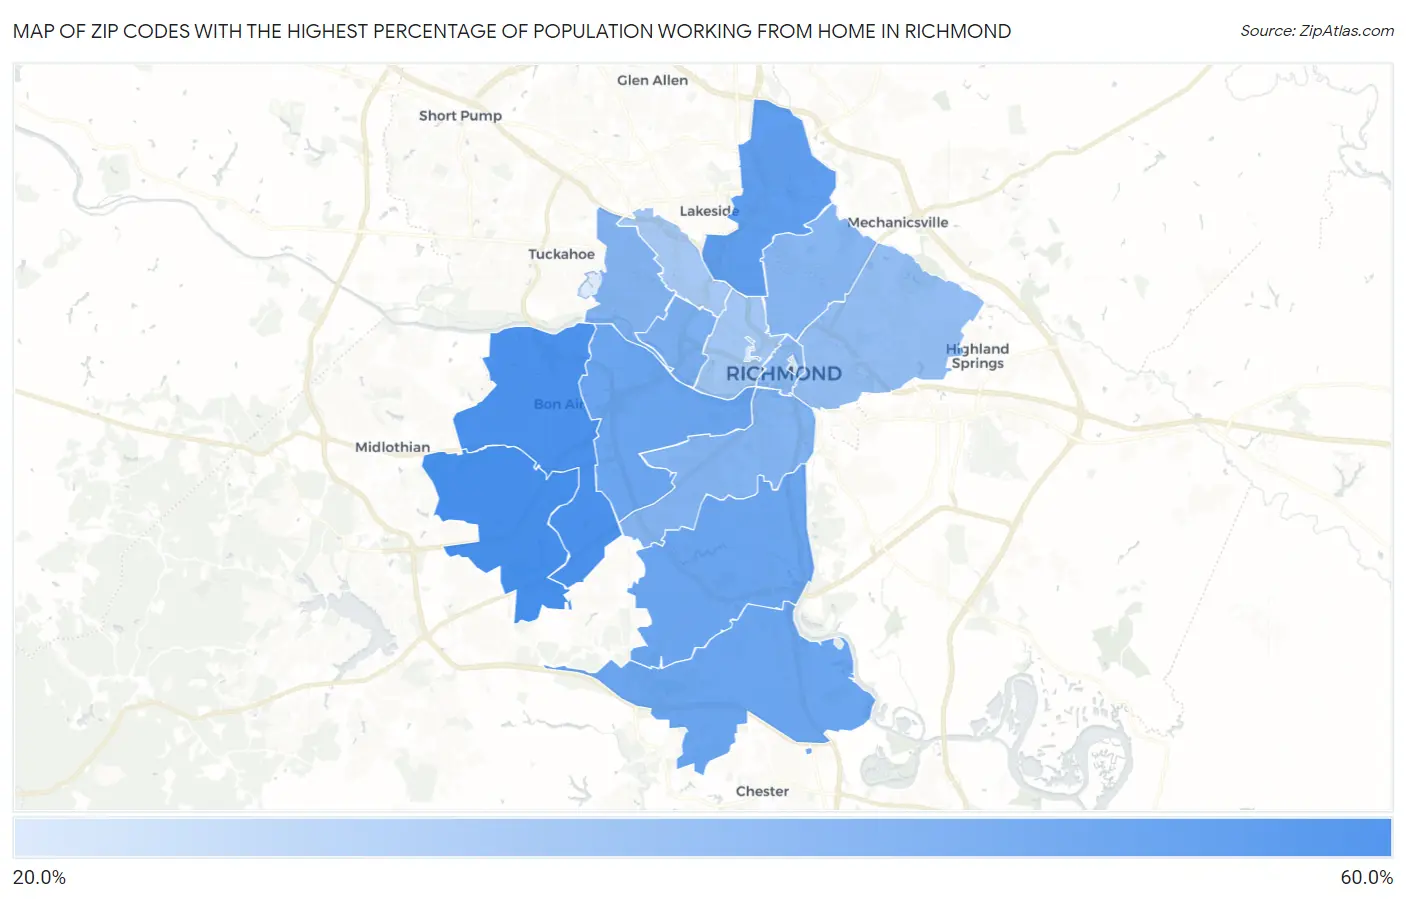
Zip Codes with the Highest Percentage of Population Working from Home in Richmond, VA
RELATED REPORTS & OPTIONS
Work from Home
Richmond
Compare Zip Codes
Map of Zip Codes with the Highest Percentage of Population Working from Home in Richmond
20.3%
51.0%
Zip Codes with the Highest Percentage of Population Working from Home in Richmond, VA
| Zip Code | % Work from Home | vs State | vs National | |
| 1. | 23236 | 51.0% | 43.9%(+7.10)#190 | 44.0%(+7.00)#7,559 |
| 2. | 23235 | 49.8% | 43.9%(+5.90)#215 | 44.0%(+5.80)#8,753 |
| 3. | 23227 | 45.2% | 43.9%(+1.30)#348 | 44.0%(+1.20)#14,116 |
| 4. | 23225 | 42.8% | 43.9%(-1.10)#408 | 44.0%(-1.20)#16,832 |
| 5. | 23237 | 42.8% | 43.9%(-1.10)#412 | 44.0%(-1.20)#16,851 |
| 6. | 23234 | 42.6% | 43.9%(-1.30)#422 | 44.0%(-1.40)#17,071 |
| 7. | 23221 | 39.3% | 43.9%(-4.60)#497 | 44.0%(-4.70)#20,209 |
| 8. | 23224 | 38.0% | 43.9%(-5.90)#514 | 44.0%(-6.00)#21,043 |
| 9. | 23226 | 38.0% | 43.9%(-5.90)#517 | 44.0%(-6.00)#21,060 |
| 10. | 23222 | 36.7% | 43.9%(-7.20)#536 | 44.0%(-7.30)#21,835 |
| 11. | 23219 | 35.4% | 43.9%(-8.50)#555 | 44.0%(-8.60)#22,497 |
| 12. | 23223 | 34.4% | 43.9%(-9.50)#560 | 44.0%(-9.60)#22,839 |
| 13. | 23220 | 31.2% | 43.9%(-12.7)#587 | 44.0%(-12.8)#23,686 |
| 14. | 23230 | 30.8% | 43.9%(-13.1)#591 | 44.0%(-13.2)#23,773 |
| 15. | 23298 | 20.9% | 43.9%(-23.0)#609 | 44.0%(-23.1)#24,615 |
| 16. | 23173 | 20.3% | 43.9%(-23.6)#616 | 44.0%(-23.7)#24,699 |
| 17. | 23284 | 20.3% | 43.9%(-23.6)#617 | 44.0%(-23.7)#24,701 |
1
Common Questions
What are the Top 10 Zip Codes with the Highest Percentage of Population Working from Home in Richmond, VA?
Top 10 Zip Codes with the Highest Percentage of Population Working from Home in Richmond, VA are:
What zip code has the Highest Percentage of Population Working from Home in Richmond, VA?
23236 has the Highest Percentage of Population Working from Home in Richmond, VA with 51.0%.
What is the Percentage of Population Working from Home in Richmond, VA?
Percentage of Population Working from Home in Richmond is 37.4%.
What is the Percentage of Population Working from Home in Virginia?
Percentage of Population Working from Home in Virginia is 43.9%.
What is the Percentage of Population Working from Home in the United States?
Percentage of Population Working from Home in the United States is 44.0%.