Zip Codes with the Highest Percentage of Population Employed in Life, Physical & Social Science in Herndon, VA

RELATED REPORTS & OPTIONS

Life, Physical & Social Science
Population
Families and Households
Female Fertility
Race (Community Size)
Race (Percentage)
Ancestry (Community Size)
AfghanAfricanAlbanianAmericanApacheArabArgentineanArmenianAustrianBarbadianBhutaneseBolivianBrazilianBritishBurmeseCentral AmericanCentral American IndianCherokeeColombianCosta RicanCroatianCubanCzechDanishDominicanDutchEastern EuropeanEcuadorianEgyptianEnglishEthiopianEuropeanFilipinoFinnishFrenchFrench CanadianGermanGreekGuatemalanHaitianHonduranHungarianIndian (Asian)IranianIraqiIrishItalianJamaicanJapaneseJordanianKoreanLaotianLatvianLebaneseLithuanianMalaysianMexicanNative HawaiianNicaraguanNigerianNorthern EuropeanNorwegianPakistaniPalestinianPanamanianParaguayanPennsylvania GermanPeruvianPolishPortuguesePuerto RicanRomanianRussianSalvadoranScandinavianScotch-IrishScottishSlavicSlovakSloveneSouth AmericanSpaniardSpanishSri LankanSubsaharan AfricanSudaneseSwedishSwissThaiTrinidadian and TobagonianTurkishUkrainianVenezuelanWelshWest Indian
Ancestry (Percentage)
AfghanAfricanAlbanianAmericanApacheArabArgentineanArmenianAustrianBarbadianBhutaneseBolivianBrazilianBritishBurmeseCentral AmericanCentral American IndianCherokeeColombianCosta RicanCroatianCubanCzechDanishDominicanDutchEastern EuropeanEcuadorianEgyptianEnglishEthiopianEuropeanFilipinoFinnishFrenchFrench CanadianGermanGreekGuatemalanHaitianHonduranHungarianIndian (Asian)IranianIraqiIrishItalianJamaicanJapaneseJordanianKoreanLaotianLatvianLebaneseLithuanianMalaysianMexicanNative HawaiianNicaraguanNigerianNorthern EuropeanNorwegianPakistaniPalestinianPanamanianParaguayanPennsylvania GermanPeruvianPolishPortuguesePuerto RicanRomanianRussianSalvadoranScandinavianScotch-IrishScottishSlavicSlovakSloveneSouth AmericanSpaniardSpanishSri LankanSubsaharan AfricanSudaneseSwedishSwissThaiTrinidadian and TobagonianTurkishUkrainianVenezuelanWelshWest Indian
Immigrant Origin (Total)
Immigrant Origin (Percentage)
Income
Income (Families)
Income (Households)
Poverty
Poverty (Families)
Unemployment
Employment Occupations
Employment Industries
Employer Class
Commute Time
Commute Means
School Enrollment
Education by Degree Field
Occupancy
Finances
Physical Characteristics
Herndon
Compare Zip Codes
Comparison Subject

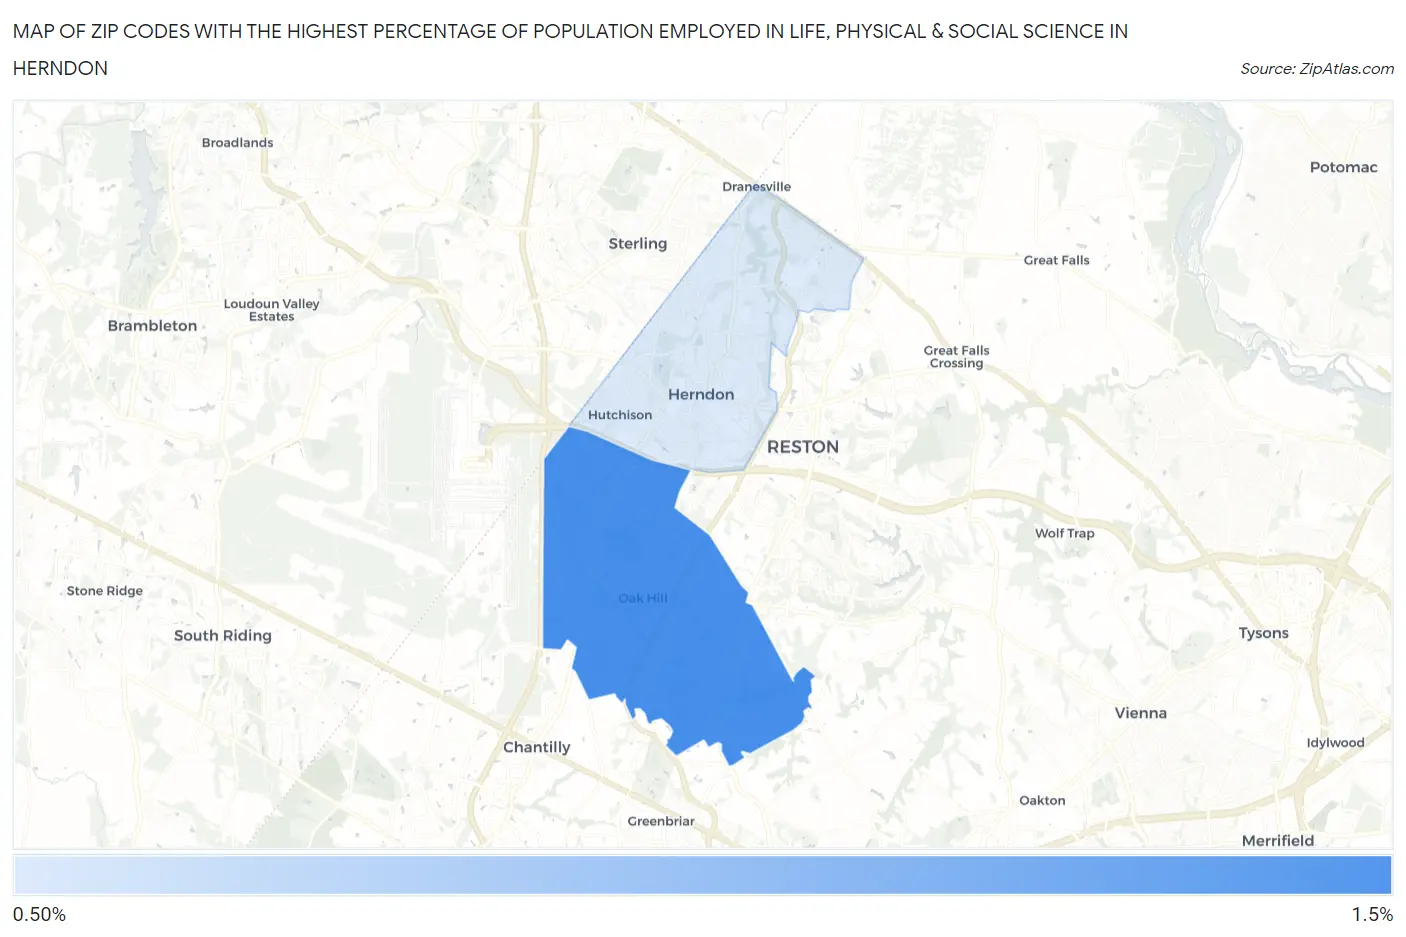
Map of Zip Codes with the Highest Percentage of Population Employed in Life, Physical & Social Science in Herndon

0.0%
1.5%
Zip Codes with the Highest Percentage of Population Employed in Life, Physical & Social Science in Herndon Map

Zip Codes with the Highest Percentage of Population Employed in Life, Physical & Social Science in Herndon, VA

Zip Code % Employed vs State vs National
1.201711.5%1.3%(+0.181)#1751.1%(+0.367)#5,879
2.201700.91%1.3%(-0.362)#2791.1%(-0.176)#9,819

Common Questions

What are the Top Zip Codes with the Highest Percentage of Population Employed in Life, Physical & Social Science in Herndon, VA?
Top Zip Codes with the Highest Percentage of Population Employed in Life, Physical & Social Science in Herndon, VA are:
#1
1.5%
#2
0.91%
What zip code has the Highest Percentage of Population Employed in Life, Physical & Social Science in Herndon, VA?
20171 has the Highest Percentage of Population Employed in Life, Physical & Social Science in Herndon, VA with 1.5%.
What is the Percentage of Population Employed in Life, Physical & Social Science in Herndon, VA?
Percentage of Population Employed in Life, Physical & Social Science in Herndon is 0.60%.
What is the Percentage of Population Employed in Life, Physical & Social Science in Virginia?
Percentage of Population Employed in Life, Physical & Social Science in Virginia is 1.3%.
What is the Percentage of Population Employed in Life, Physical & Social Science in the United States?
Percentage of Population Employed in Life, Physical & Social Science in the United States is 1.1%.