Zip Codes with the Highest Percentage of Population Employed in Agriculture, Fishing & Hunting in Chesapeake, VA
RELATED REPORTS & OPTIONS
Agriculture, Fishing & Hunting
Chesapeake
Compare Zip Codes
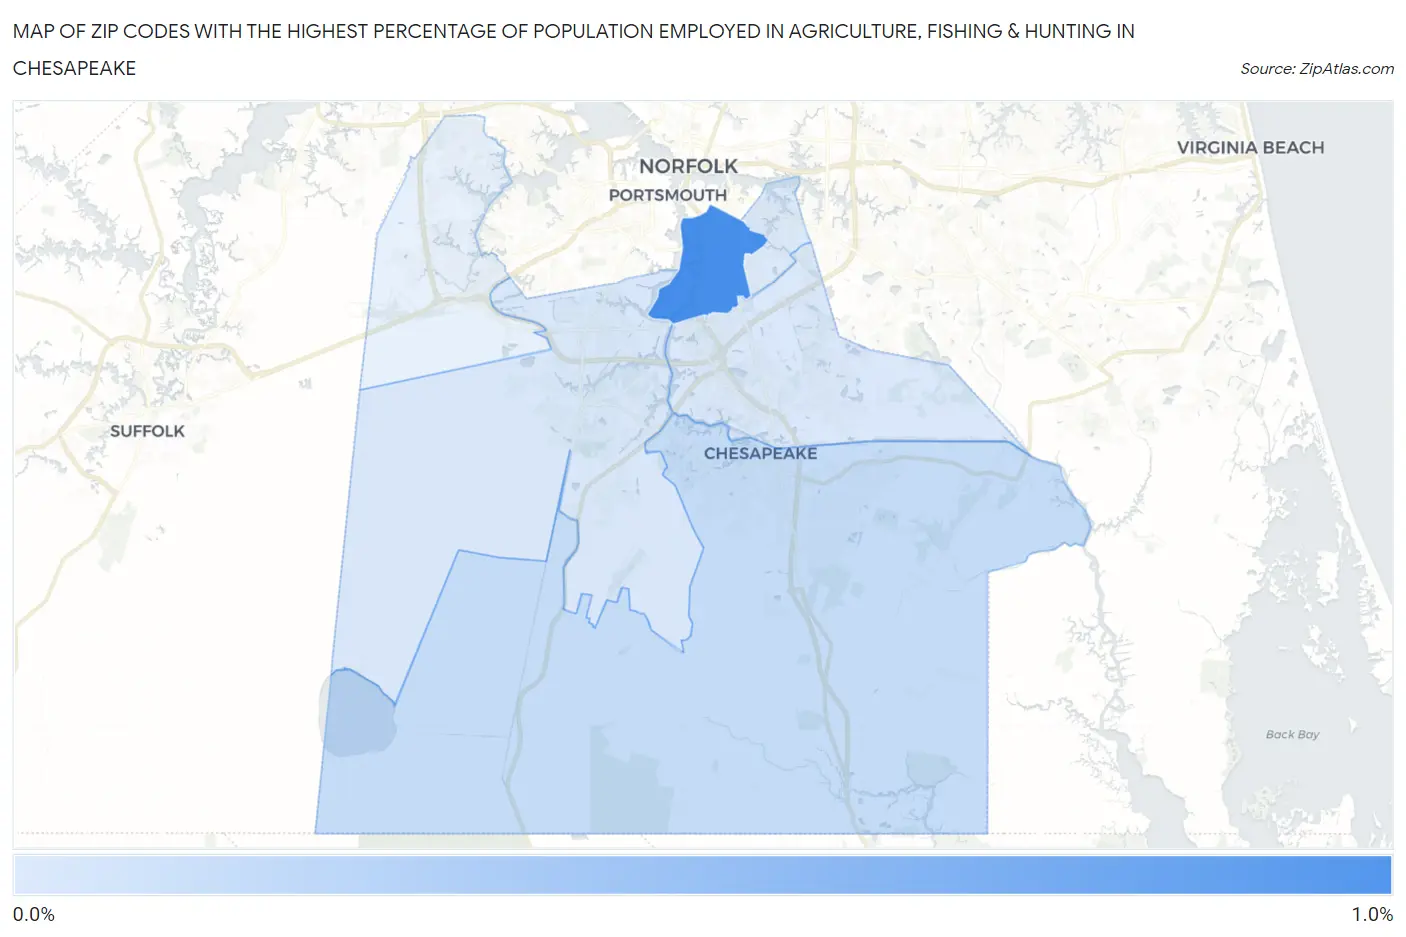
Map of Zip Codes with the Highest Percentage of Population Employed in Agriculture, Fishing & Hunting in Chesapeake
0.0%
1.0%
Zip Codes with the Highest Percentage of Population Employed in Agriculture, Fishing & Hunting in Chesapeake, VA
| Zip Code | % Employed | vs State | vs National | |
| 1. | 23324 | 0.93% | 0.69%(+0.242)#331 | 1.2%(-0.271)#16,568 |
| 2. | 23322 | 0.17% | 0.69%(-0.512)#493 | 1.2%(-1.03)#22,667 |
| 3. | 23323 | 0.057% | 0.69%(-0.629)#554 | 1.2%(-1.14)#24,262 |
| 4. | 23320 | 0.049% | 0.69%(-0.637)#557 | 1.2%(-1.15)#24,360 |
| 5. | 23325 | 0.034% | 0.69%(-0.652)#562 | 1.2%(-1.17)#24,503 |
1
Common Questions
What are the Top 5 Zip Codes with the Highest Percentage of Population Employed in Agriculture, Fishing & Hunting in Chesapeake, VA?
Top 5 Zip Codes with the Highest Percentage of Population Employed in Agriculture, Fishing & Hunting in Chesapeake, VA are:
What zip code has the Highest Percentage of Population Employed in Agriculture, Fishing & Hunting in Chesapeake, VA?
23324 has the Highest Percentage of Population Employed in Agriculture, Fishing & Hunting in Chesapeake, VA with 0.93%.
What is the Percentage of Population Employed in Agriculture, Fishing & Hunting in Chesapeake, VA?
Percentage of Population Employed in Agriculture, Fishing & Hunting in Chesapeake is 0.14%.
What is the Percentage of Population Employed in Agriculture, Fishing & Hunting in Virginia?
Percentage of Population Employed in Agriculture, Fishing & Hunting in Virginia is 0.69%.
What is the Percentage of Population Employed in Agriculture, Fishing & Hunting in the United States?
Percentage of Population Employed in Agriculture, Fishing & Hunting in the United States is 1.2%.