Zip Codes with the Highest Percentage of Population Employed in Transportation & Warehousing in Chantilly, VA
RELATED REPORTS & OPTIONS
Transportation & Warehousing
Chantilly
Compare Zip Codes
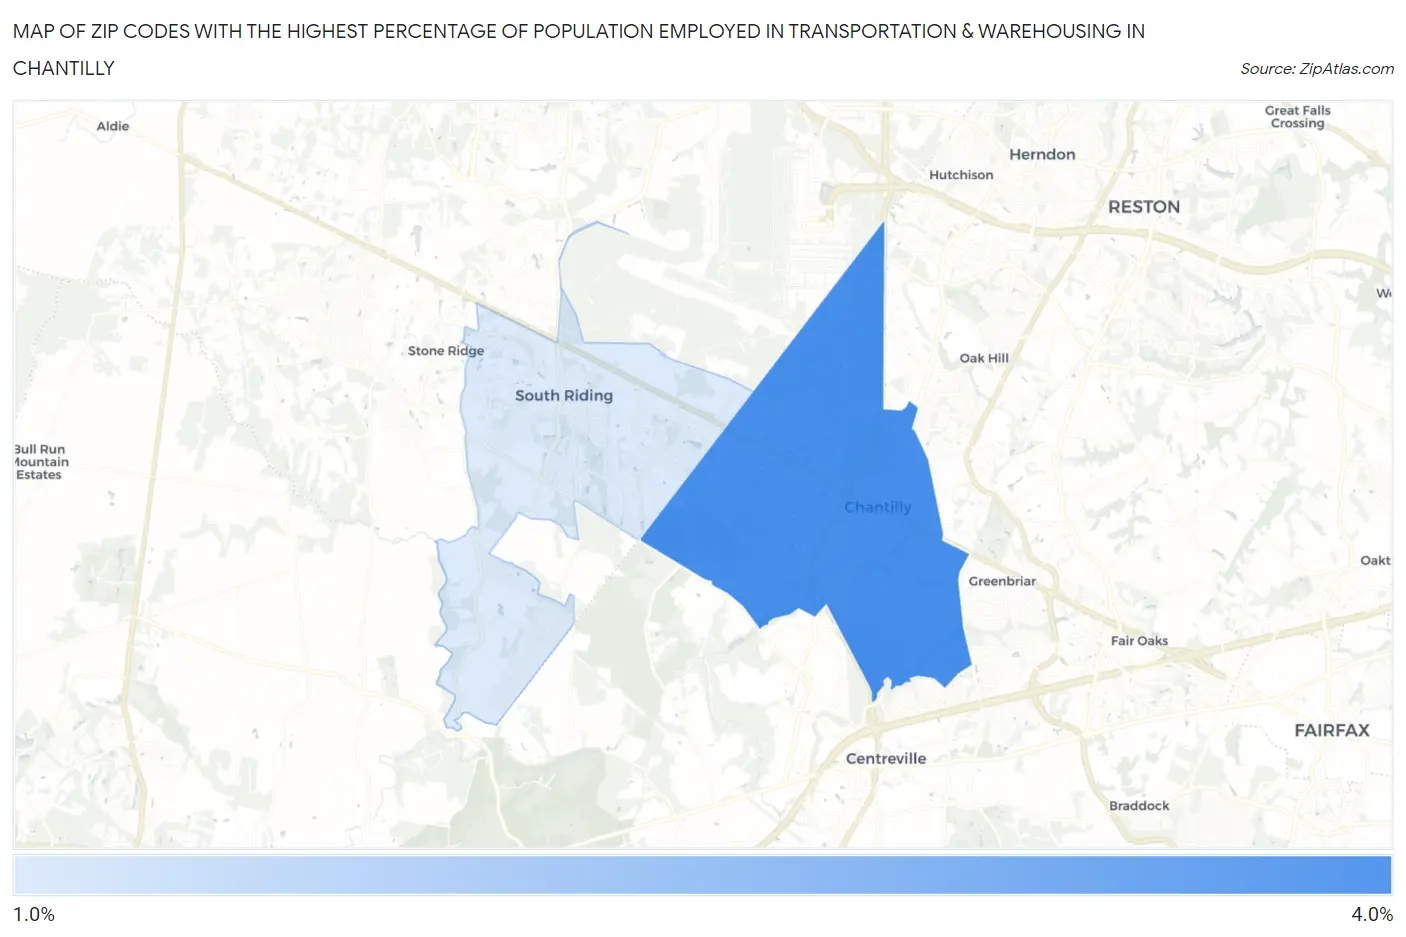
Map of Zip Codes with the Highest Percentage of Population Employed in Transportation & Warehousing in Chantilly
1.9%
3.1%
Zip Codes with the Highest Percentage of Population Employed in Transportation & Warehousing in Chantilly, VA
| Zip Code | % Employed | vs State | vs National | |
| 1. | 20151 | 3.1% | 4.0%(-0.866)#453 | 4.9%(-1.81)#19,635 |
| 2. | 20152 | 1.9% | 4.0%(-2.08)#604 | 4.9%(-3.02)#24,520 |
1
Common Questions
What are the Top Zip Codes with the Highest Percentage of Population Employed in Transportation & Warehousing in Chantilly, VA?
Top Zip Codes with the Highest Percentage of Population Employed in Transportation & Warehousing in Chantilly, VA are:
What zip code has the Highest Percentage of Population Employed in Transportation & Warehousing in Chantilly, VA?
20151 has the Highest Percentage of Population Employed in Transportation & Warehousing in Chantilly, VA with 3.1%.
What is the Percentage of Population Employed in Transportation & Warehousing in Chantilly, VA?
Percentage of Population Employed in Transportation & Warehousing in Chantilly is 3.0%.
What is the Percentage of Population Employed in Transportation & Warehousing in Virginia?
Percentage of Population Employed in Transportation & Warehousing in Virginia is 4.0%.
What is the Percentage of Population Employed in Transportation & Warehousing in the United States?
Percentage of Population Employed in Transportation & Warehousing in the United States is 4.9%.