Zip Codes with the Highest Percentage of Population Employed in Arts, Entertainment & Recreation in Chantilly, VA
RELATED REPORTS & OPTIONS
Arts, Entertainment & Recreation
Chantilly
Compare Zip Codes
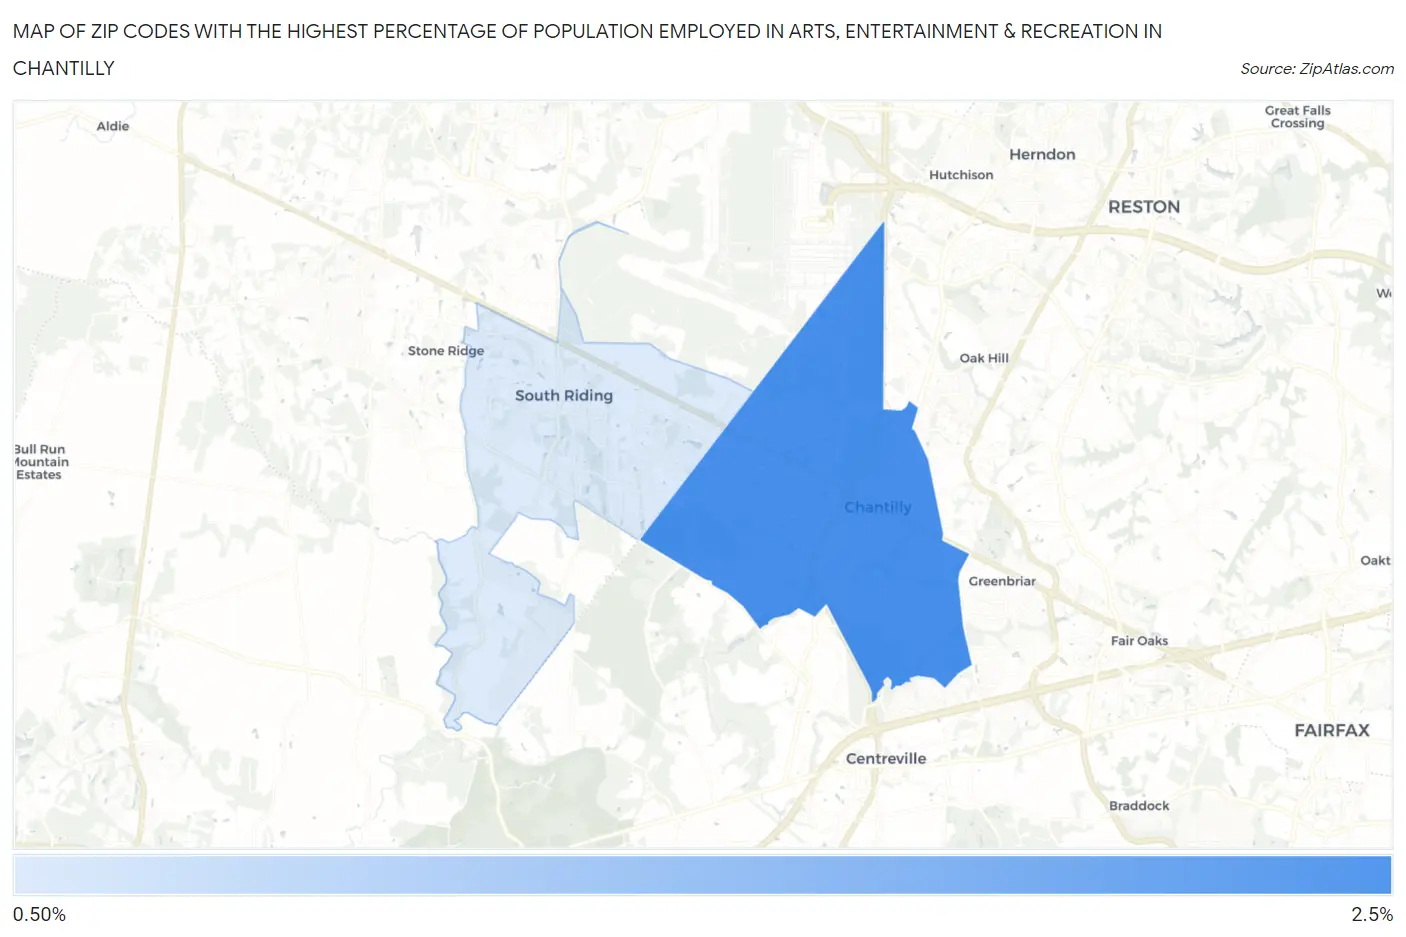
Map of Zip Codes with the Highest Percentage of Population Employed in Arts, Entertainment & Recreation in Chantilly
0.0%
2.5%
Zip Codes with the Highest Percentage of Population Employed in Arts, Entertainment & Recreation in Chantilly, VA
| Zip Code | % Employed | vs State | vs National | |
| 1. | 20151 | 2.1% | 1.9%(+0.203)#234 | 2.1%(-0.029)#9,476 |
| 2. | 20152 | 1.2% | 1.9%(-0.685)#397 | 2.1%(-0.918)#15,748 |
1
Common Questions
What are the Top Zip Codes with the Highest Percentage of Population Employed in Arts, Entertainment & Recreation in Chantilly, VA?
Top Zip Codes with the Highest Percentage of Population Employed in Arts, Entertainment & Recreation in Chantilly, VA are:
What zip code has the Highest Percentage of Population Employed in Arts, Entertainment & Recreation in Chantilly, VA?
20151 has the Highest Percentage of Population Employed in Arts, Entertainment & Recreation in Chantilly, VA with 2.1%.
What is the Percentage of Population Employed in Arts, Entertainment & Recreation in Chantilly, VA?
Percentage of Population Employed in Arts, Entertainment & Recreation in Chantilly is 1.9%.
What is the Percentage of Population Employed in Arts, Entertainment & Recreation in Virginia?
Percentage of Population Employed in Arts, Entertainment & Recreation in Virginia is 1.9%.
What is the Percentage of Population Employed in Arts, Entertainment & Recreation in the United States?
Percentage of Population Employed in Arts, Entertainment & Recreation in the United States is 2.1%.