Zip Codes with the Highest Percentage of Population Employed in Food Preparation & Serving in Park City, UT
RELATED REPORTS & OPTIONS
Food Preparation & Serving
Park City
Compare Zip Codes
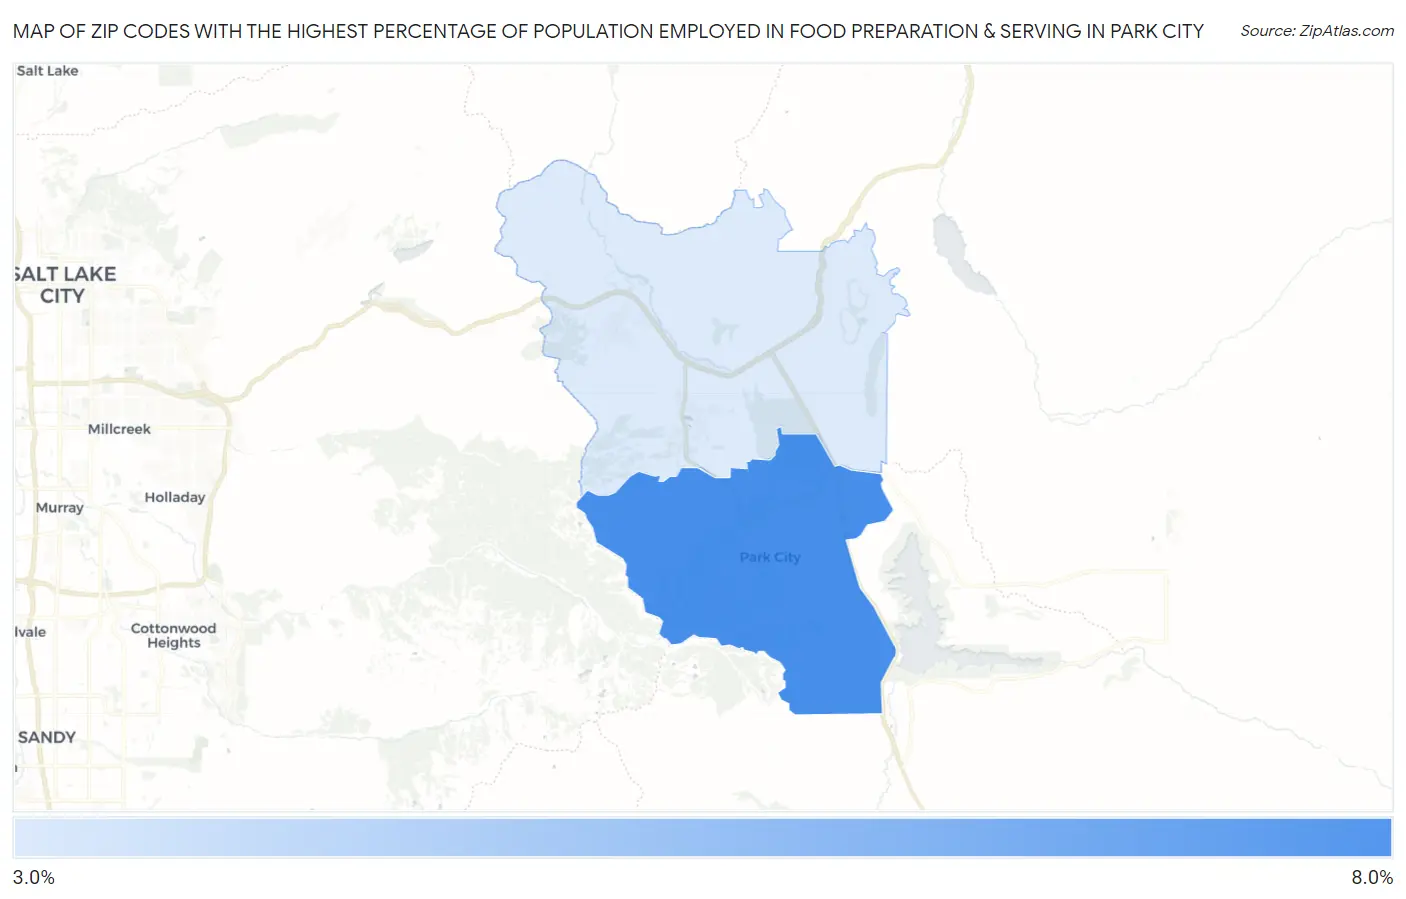
Map of Zip Codes with the Highest Percentage of Population Employed in Food Preparation & Serving in Park City
4.0%
7.7%
Zip Codes with the Highest Percentage of Population Employed in Food Preparation & Serving in Park City, UT
| Zip Code | % Employed | vs State | vs National | |
| 1. | 84060 | 7.7% | 4.5%(+3.20)#34 | 5.3%(+2.45)#5,160 |
| 2. | 84098 | 4.0% | 4.5%(-0.565)#127 | 5.3%(-1.31)#17,226 |
1
Common Questions
What are the Top Zip Codes with the Highest Percentage of Population Employed in Food Preparation & Serving in Park City, UT?
Top Zip Codes with the Highest Percentage of Population Employed in Food Preparation & Serving in Park City, UT are:
What zip code has the Highest Percentage of Population Employed in Food Preparation & Serving in Park City, UT?
84060 has the Highest Percentage of Population Employed in Food Preparation & Serving in Park City, UT with 7.7%.
What is the Percentage of Population Employed in Food Preparation & Serving in Park City, UT?
Percentage of Population Employed in Food Preparation & Serving in Park City is 8.0%.
What is the Percentage of Population Employed in Food Preparation & Serving in Utah?
Percentage of Population Employed in Food Preparation & Serving in Utah is 4.5%.
What is the Percentage of Population Employed in Food Preparation & Serving in the United States?
Percentage of Population Employed in Food Preparation & Serving in the United States is 5.3%.