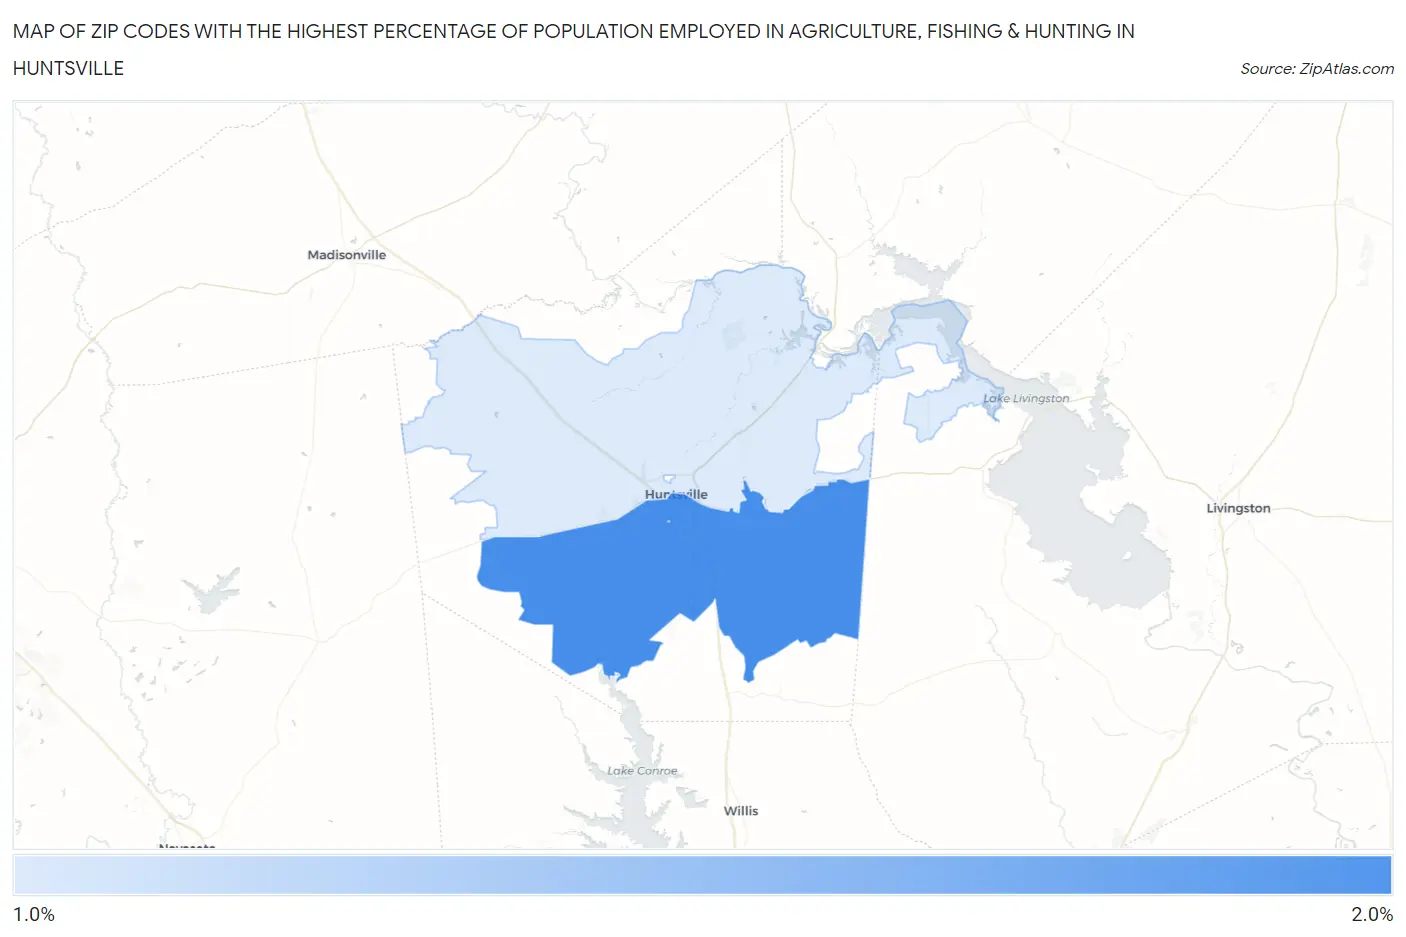
Zip Codes with the Highest Percentage of Population Employed in Agriculture, Fishing & Hunting in Huntsville, TX
RELATED REPORTS & OPTIONS
Agriculture, Fishing & Hunting
Huntsville
Compare Zip Codes
Map of Zip Codes with the Highest Percentage of Population Employed in Agriculture, Fishing & Hunting in Huntsville
0.0%
2.0%
Zip Codes with the Highest Percentage of Population Employed in Agriculture, Fishing & Hunting in Huntsville, TX
| Zip Code | % Employed | vs State | vs National | |
| 1. | 77340 | 1.5% | 0.75%(+0.784)#747 | 1.2%(+0.336)#14,184 |
| 2. | 77320 | 1.2% | 0.75%(+0.438)#816 | 1.2%(-0.010)#15,430 |
1
Common Questions
What are the Top Zip Codes with the Highest Percentage of Population Employed in Agriculture, Fishing & Hunting in Huntsville, TX?
Top Zip Codes with the Highest Percentage of Population Employed in Agriculture, Fishing & Hunting in Huntsville, TX are:
What zip code has the Highest Percentage of Population Employed in Agriculture, Fishing & Hunting in Huntsville, TX?
77340 has the Highest Percentage of Population Employed in Agriculture, Fishing & Hunting in Huntsville, TX with 1.5%.
What is the Percentage of Population Employed in Agriculture, Fishing & Hunting in Huntsville, TX?
Percentage of Population Employed in Agriculture, Fishing & Hunting in Huntsville is 1.4%.
What is the Percentage of Population Employed in Agriculture, Fishing & Hunting in Texas?
Percentage of Population Employed in Agriculture, Fishing & Hunting in Texas is 0.75%.
What is the Percentage of Population Employed in Agriculture, Fishing & Hunting in the United States?
Percentage of Population Employed in Agriculture, Fishing & Hunting in the United States is 1.2%.