Zip Codes with the Highest Percentage of Population Employed in Agriculture, Fishing & Hunting in Grand Prairie, TX
RELATED REPORTS & OPTIONS
Agriculture, Fishing & Hunting
Grand Prairie
Compare Zip Codes
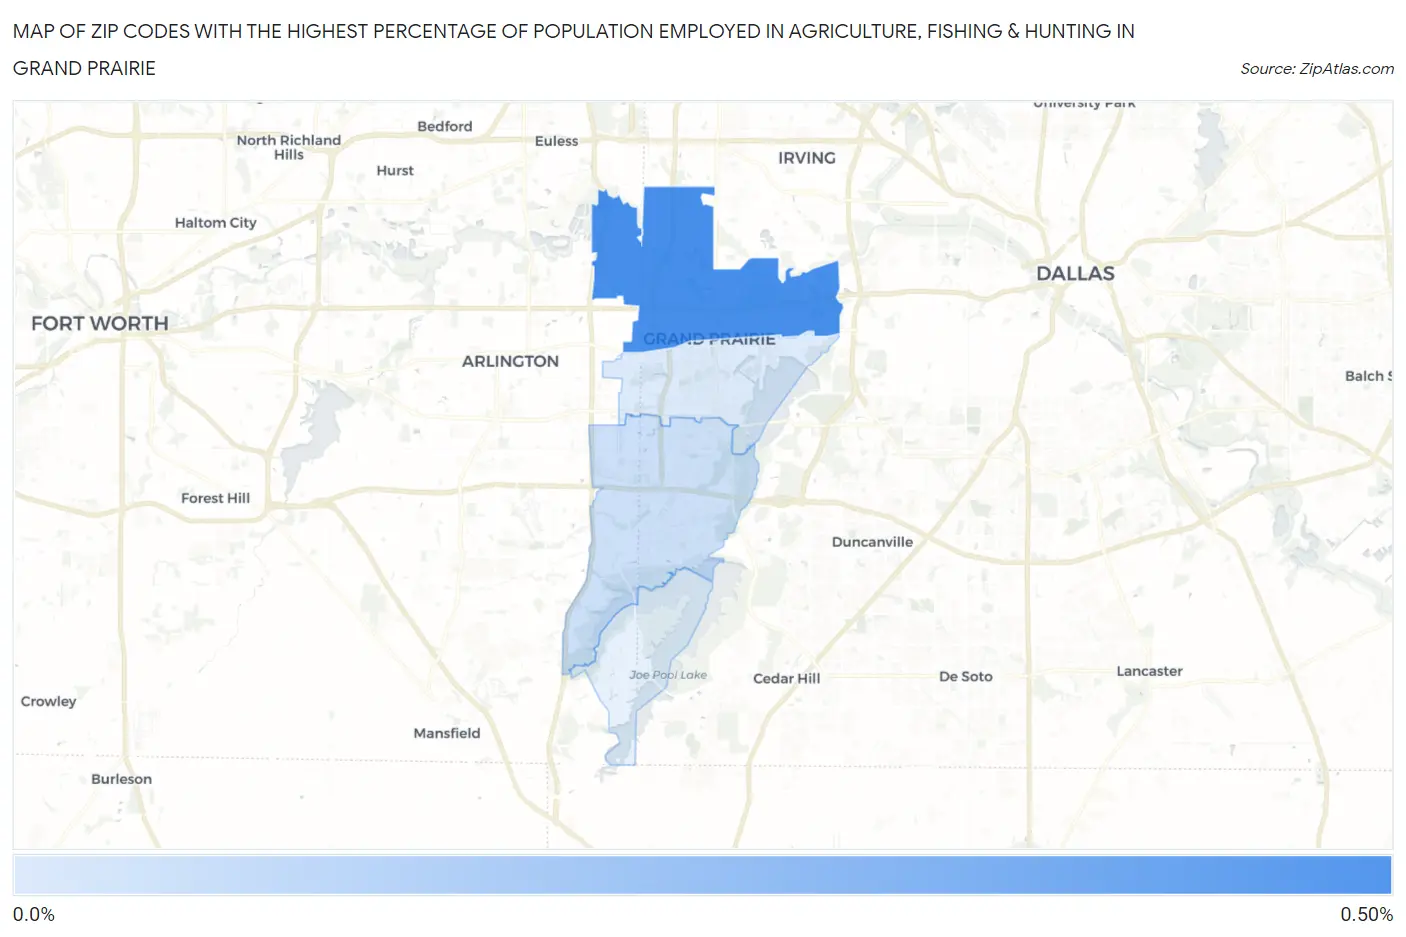
Map of Zip Codes with the Highest Percentage of Population Employed in Agriculture, Fishing & Hunting in Grand Prairie
0.0%
0.50%
Zip Codes with the Highest Percentage of Population Employed in Agriculture, Fishing & Hunting in Grand Prairie, TX
| Zip Code | % Employed | vs State | vs National | |
| 1. | 75050 | 0.42% | 0.75%(-0.335)#1,083 | 1.2%(-0.782)#20,006 |
| 2. | 75052 | 0.096% | 0.75%(-0.655)#1,359 | 1.2%(-1.10)#23,724 |
| 3. | 75051 | 0.060% | 0.75%(-0.691)#1,418 | 1.2%(-1.14)#24,221 |
1
Common Questions
What are the Top 3 Zip Codes with the Highest Percentage of Population Employed in Agriculture, Fishing & Hunting in Grand Prairie, TX?
Top 3 Zip Codes with the Highest Percentage of Population Employed in Agriculture, Fishing & Hunting in Grand Prairie, TX are:
What zip code has the Highest Percentage of Population Employed in Agriculture, Fishing & Hunting in Grand Prairie, TX?
75050 has the Highest Percentage of Population Employed in Agriculture, Fishing & Hunting in Grand Prairie, TX with 0.42%.
What is the Percentage of Population Employed in Agriculture, Fishing & Hunting in Grand Prairie, TX?
Percentage of Population Employed in Agriculture, Fishing & Hunting in Grand Prairie is 0.16%.
What is the Percentage of Population Employed in Agriculture, Fishing & Hunting in Texas?
Percentage of Population Employed in Agriculture, Fishing & Hunting in Texas is 0.75%.
What is the Percentage of Population Employed in Agriculture, Fishing & Hunting in the United States?
Percentage of Population Employed in Agriculture, Fishing & Hunting in the United States is 1.2%.