Zip Codes with the Highest Percentage of Households Heated by Bottled Gas / Liquid Propane in Sevierville, TN
RELATED REPORTS & OPTIONS
Bottled Gas / LP Heating
Sevierville
Compare Zip Codes
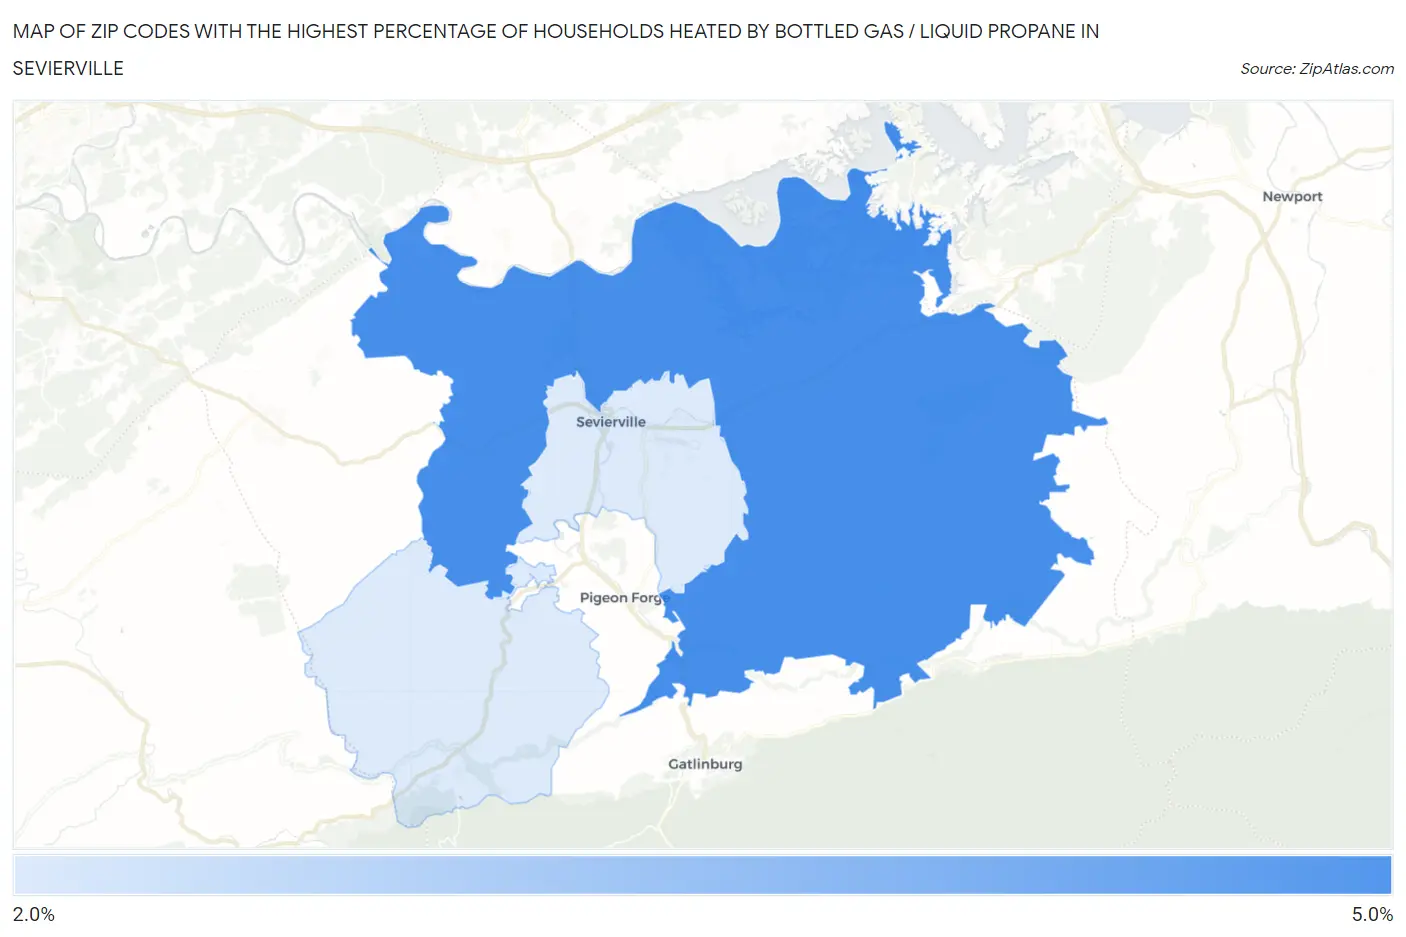
Map of Zip Codes with the Highest Percentage of Households Heated by Bottled Gas / Liquid Propane in Sevierville
2.8%
4.1%
Zip Codes with the Highest Percentage of Households Heated by Bottled Gas / Liquid Propane in Sevierville, TN
| Zip Code | Bottled Gas / LP Heating | vs State | vs National | |
| 1. | 37876 | 4.1% | 3.6%(+0.500)#353 | 4.9%(-0.800)#19,505 |
| 2. | 37862 | 2.8% | 3.6%(-0.800)#410 | 4.9%(-2.10)#21,376 |
1
Common Questions
What are the Top Zip Codes with the Highest Percentage of Households Heated by Bottled Gas / Liquid Propane in Sevierville, TN?
Top Zip Codes with the Highest Percentage of Households Heated by Bottled Gas / Liquid Propane in Sevierville, TN are:
What zip code has the Highest Percentage of Households Heated by Bottled Gas / Liquid Propane in Sevierville, TN?
37876 has the Highest Percentage of Households Heated by Bottled Gas / Liquid Propane in Sevierville, TN with 4.1%.
What is the Percentage of Households Heated by Bottled Gas / Liquid Propane in Sevierville, TN?
Percentage of Households Heated by Bottled Gas / Liquid Propane in Sevierville is 0.20%.
What is the Percentage of Households Heated by Bottled Gas / Liquid Propane in Tennessee?
Percentage of Households Heated by Bottled Gas / Liquid Propane in Tennessee is 3.6%.
What is the Percentage of Households Heated by Bottled Gas / Liquid Propane in the United States?
Percentage of Households Heated by Bottled Gas / Liquid Propane in the United States is 4.9%.