Zip Codes with the Highest Percentage of Owner-Occupied Units in Chattanooga, TN

RELATED REPORTS & OPTIONS

Highest Owner-Occupied
Population
Families and Households
Female Fertility
Female Fertility (Unmarried)
Race (Community Size)
Race (Percentage)
Ancestry (Community Size)
AfricanAmericanArabArgentineanArmenianAustralianAustrianBelgianBhutaneseBlackfeetBrazilianBritishBurmeseCajunCanadianCelticCentral AmericanCherokeeChileanChippewaChoctawColombianCreekCroatianCubanCzechCzechoslovakianDanishDominicanDutchDutch West IndianEastern EuropeanEgyptianEnglishEthiopianEuropeanFilipinoFinnishFrenchFrench American IndianFrench CanadianGermanGreekGuamanian / ChamorroGuatemalanHaitianHonduranHungarianIcelanderIndian (Asian)IranianIrishIsraeliItalianJamaicanJapaneseKoreanLaotianLebaneseLithuanianLuxembourgerMalaysianMalteseMexicanMexican American IndianMoroccanNative HawaiianNew ZealanderNicaraguanNigerianNorthern EuropeanNorwegianPakistaniPalestinianPanamanianPennsylvania GermanPeruvianPolishPortuguesePuerto RicanRomanianRussianSalvadoranSamoanScandinavianScotch-IrishScottishSerbianSiouxSlovakSloveneSouth AfricanSouth AmericanSpaniardSpanishSri LankanSubsaharan AfricanSudaneseSwedishSwissSyrianThaiTurkishUkrainianUruguayanVenezuelanWelshYugoslavian
Ancestry (Percentage)
AfricanAmericanArabArgentineanArmenianAustralianAustrianBelgianBhutaneseBlackfeetBrazilianBritishBurmeseCajunCanadianCelticCentral AmericanCherokeeChileanChippewaChoctawColombianCreekCroatianCubanCzechCzechoslovakianDanishDominicanDutchDutch West IndianEastern EuropeanEgyptianEnglishEthiopianEuropeanFilipinoFinnishFrenchFrench American IndianFrench CanadianGermanGreekGuamanian / ChamorroGuatemalanHaitianHonduranHungarianIcelanderIndian (Asian)IranianIrishIsraeliItalianJamaicanJapaneseKoreanLaotianLebaneseLithuanianLuxembourgerMalaysianMalteseMexicanMexican American IndianMoroccanNative HawaiianNew ZealanderNicaraguanNigerianNorthern EuropeanNorwegianPakistaniPalestinianPanamanianPennsylvania GermanPeruvianPolishPortuguesePuerto RicanRomanianRussianSalvadoranSamoanScandinavianScotch-IrishScottishSerbianSiouxSlovakSloveneSouth AfricanSouth AmericanSpaniardSpanishSri LankanSubsaharan AfricanSudaneseSwedishSwissSyrianThaiTurkishUkrainianUruguayanVenezuelanWelshYugoslavian
Immigrant Origin (Total)
Immigrant Origin (Percentage)
Income
Income (Families)
Income (Households)
Poverty
Poverty (Families)
Unemployment
Employment Occupations
Employment Industries
Employer Class
Commute Time
Commute Means
School Enrollment
Education by Degree Field
Occupancy
Finances
Physical Characteristics
Chattanooga
Compare Zip Codes
Comparison Subject

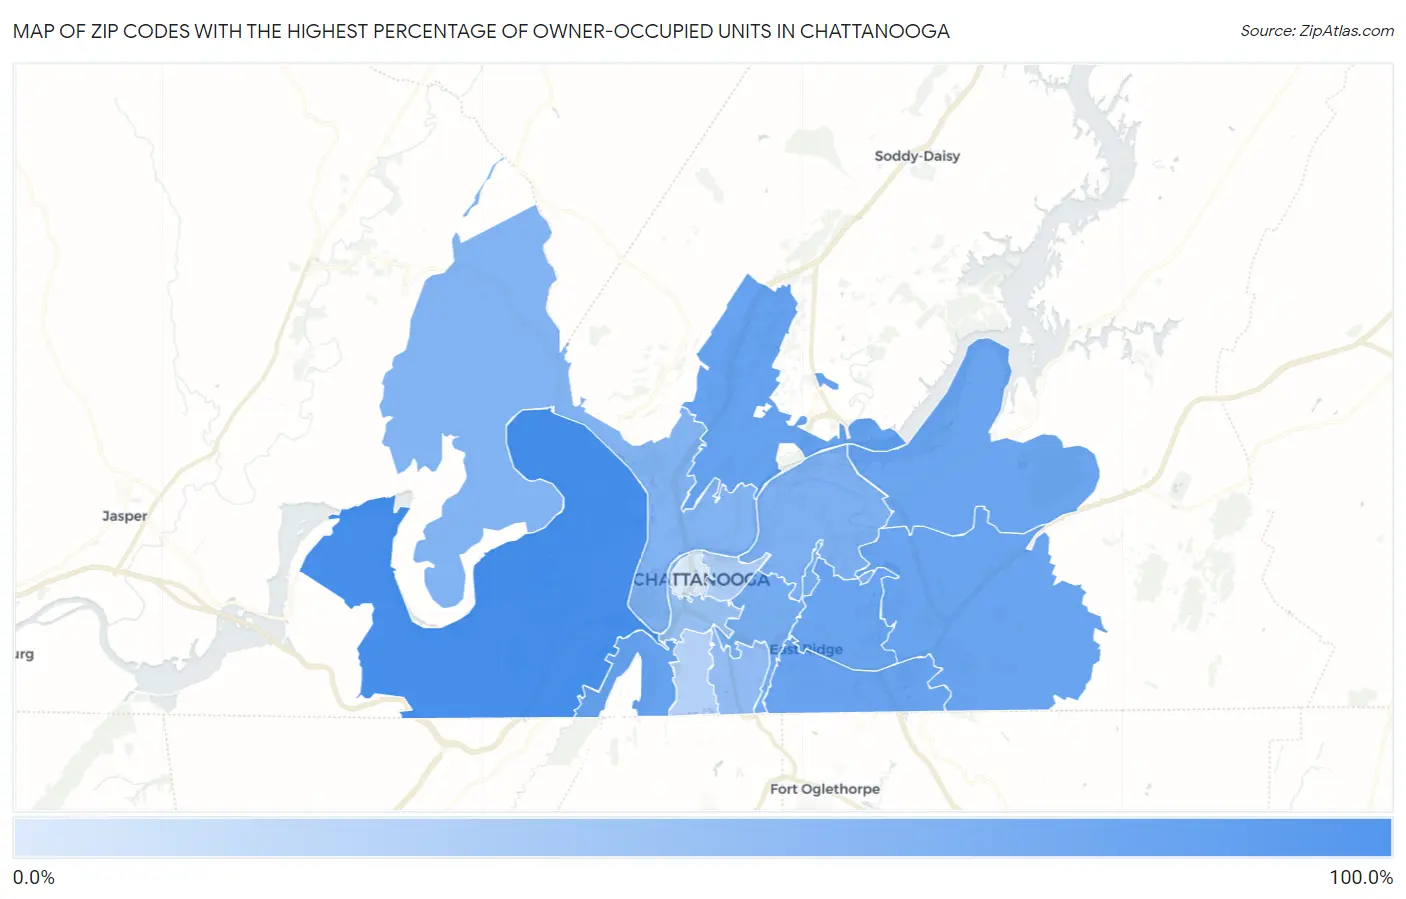
Map of Zip Codes with the Highest Percentage of Owner-Occupied Units in Chattanooga

0.0%
100.0%
Zip Codes with the Highest Percentage of Owner-Occupied Units in Chattanooga Map

Zip Codes with the Highest Percentage of Owner-Occupied Units in Chattanooga, TN

Zip Code % Owner-Occupied vs State vs National
1.3741980.8%67.1%(+13.8)#24064.8%(+16.0)#13,795
2.3740962.4%67.1%(-4.69)#51264.8%(-2.45)#26,592
3.3741562.1%67.1%(-4.96)#51464.8%(-2.72)#26,688
4.3741260.8%67.1%(-6.22)#52564.8%(-3.98)#27,153
5.3741159.5%67.1%(-7.55)#53064.8%(-5.30)#27,566
6.3742159.0%67.1%(-8.03)#53264.8%(-5.78)#27,695
7.3741658.5%67.1%(-8.51)#53564.8%(-6.27)#27,845
8.3740453.4%67.1%(-13.6)#55464.8%(-11.4)#29,103
9.3740649.0%67.1%(-18.0)#56264.8%(-15.8)#29,878
10.3740547.0%67.1%(-20.0)#57364.8%(-17.8)#30,196
11.3740738.0%67.1%(-29.0)#58964.8%(-26.8)#31,185
12.3740834.3%67.1%(-32.8)#59664.8%(-30.6)#31,494
13.3740325.4%67.1%(-41.7)#59964.8%(-39.4)#31,970
14.3741022.1%67.1%(-45.0)#60364.8%(-42.7)#32,076
15.374024.8%67.1%(-62.2)#60864.8%(-60.0)#32,438

Common Questions

What are the Top 10 Zip Codes with the Highest Percentage of Owner-Occupied Units in Chattanooga, TN?
Top 10 Zip Codes with the Highest Percentage of Owner-Occupied Units in Chattanooga, TN are:
#1
80.8%
#2
62.4%
#3
62.1%
#4
60.8%
#5
59.5%
#6
59.0%
#7
58.5%
#8
53.4%
#9
49.0%
#10
47.0%
What zip code has the Highest Percentage of Owner-Occupied Units in Chattanooga, TN?
37419 has the Highest Percentage of Owner-Occupied Units in Chattanooga, TN with 80.8%.
What is the Percentage of Owner-Occupied Units in Chattanooga, TN?
Percentage of Owner-Occupied Units in Chattanooga is 53.4%.
What is the Percentage of Owner-Occupied Units in Tennessee?
Percentage of Owner-Occupied Units in Tennessee is 67.1%.
What is the Percentage of Owner-Occupied Units in the United States?
Percentage of Owner-Occupied Units in the United States is 64.8%.