Zip Codes with the Highest Percentage of Federal Government Employees in Chattanooga, TN
RELATED REPORTS & OPTIONS
Federal Government Employees
Chattanooga
Compare Zip Codes
Map of Zip Codes with the Highest Percentage of Federal Government Employees in Chattanooga
0.0%
4.0%
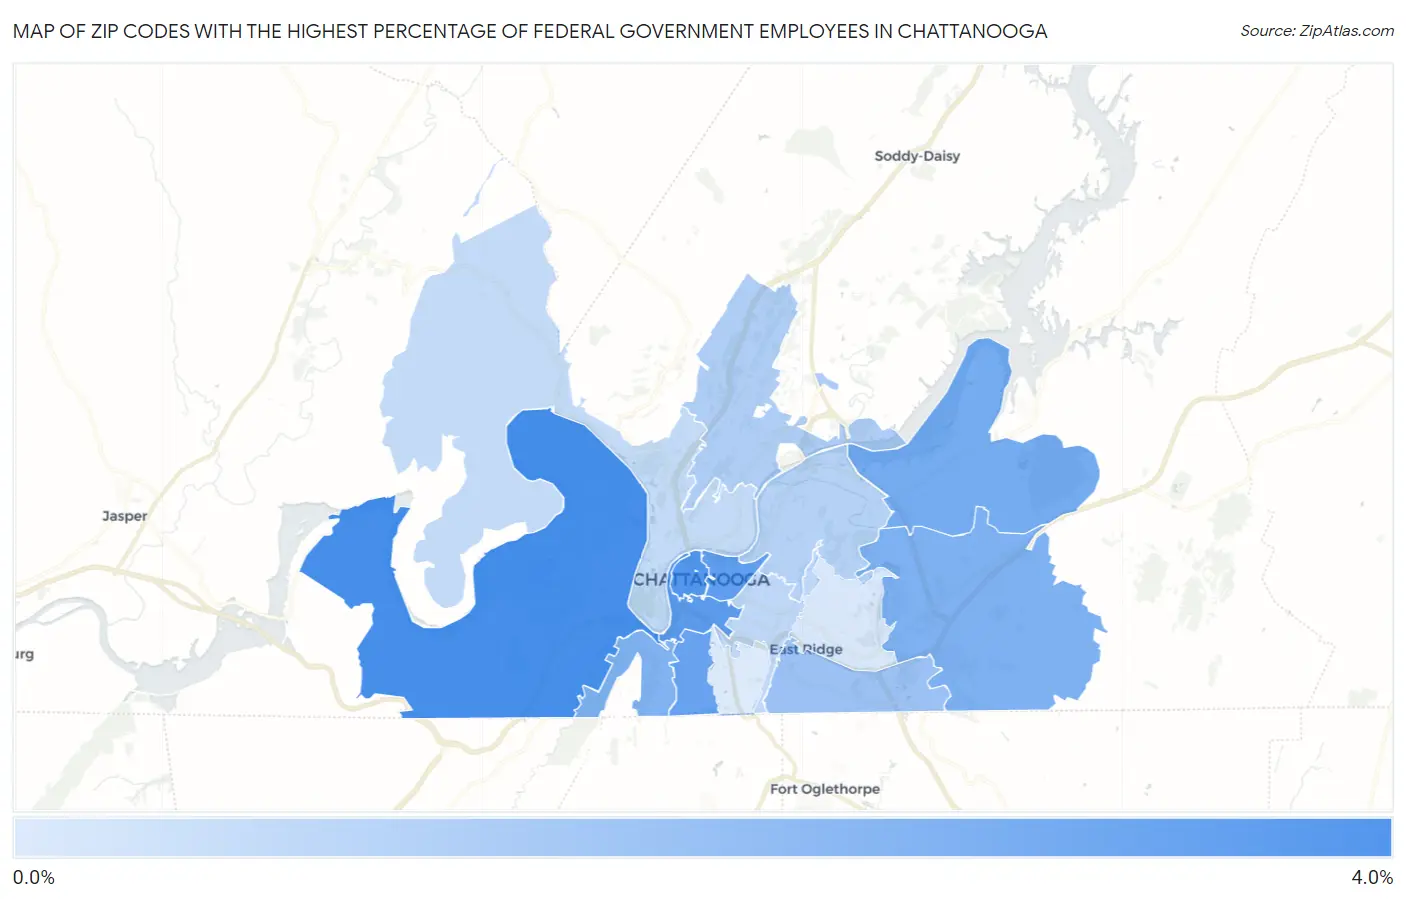
Zip Codes with the Highest Percentage of Federal Government Employees in Chattanooga, TN
| Zip Code | % Federal Government Employees | vs State | vs National | |
| 1. | 37419 | 4.0% | 3.0%(+0.979)#121 | 3.4%(+0.612)#6,482 |
| 2. | 37402 | 3.7% | 3.0%(+0.680)#131 | 3.4%(+0.314)#7,133 |
| 3. | 37408 | 3.5% | 3.0%(+0.506)#138 | 3.4%(+0.140)#7,538 |
| 4. | 37403 | 3.4% | 3.0%(+0.380)#148 | 3.4%(+0.014)#7,866 |
| 5. | 37410 | 3.2% | 3.0%(+0.217)#158 | 3.4%(-0.149)#8,308 |
| 6. | 37416 | 2.9% | 3.0%(-0.133)#181 | 3.4%(-0.499)#9,484 |
| 7. | 37421 | 2.7% | 3.0%(-0.324)#216 | 3.4%(-0.690)#10,201 |
| 8. | 37409 | 2.6% | 3.0%(-0.402)#230 | 3.4%(-0.768)#10,538 |
| 9. | 37412 | 2.0% | 3.0%(-0.972)#301 | 3.4%(-1.34)#13,425 |
| 10. | 37415 | 1.5% | 3.0%(-1.47)#378 | 3.4%(-1.84)#16,719 |
| 11. | 37406 | 1.4% | 3.0%(-1.63)#396 | 3.4%(-1.99)#17,892 |
| 12. | 37404 | 1.1% | 3.0%(-1.88)#426 | 3.4%(-2.25)#19,741 |
| 13. | 37405 | 1.0% | 3.0%(-2.00)#444 | 3.4%(-2.37)#20,618 |
| 14. | 37411 | 0.56% | 3.0%(-2.46)#490 | 3.4%(-2.82)#23,644 |
| 15. | 37407 | 0.45% | 3.0%(-2.56)#499 | 3.4%(-2.93)#24,197 |
1
Common Questions
What are the Top 10 Zip Codes with the Highest Percentage of Federal Government Employees in Chattanooga, TN?
Top 10 Zip Codes with the Highest Percentage of Federal Government Employees in Chattanooga, TN are:
What zip code has the Highest Percentage of Federal Government Employees in Chattanooga, TN?
37419 has the Highest Percentage of Federal Government Employees in Chattanooga, TN with 4.0%.
What is the Percentage of Federal Government Employees in Chattanooga, TN?
Percentage of Federal Government Employees in Chattanooga is 2.2%.
What is the Percentage of Federal Government Employees in Tennessee?
Percentage of Federal Government Employees in Tennessee is 3.0%.
What is the Percentage of Federal Government Employees in the United States?
Percentage of Federal Government Employees in the United States is 3.4%.