Wessington Springs, SD Map & Demographics
Wessington Springs Map
Wessington Springs Overview
$28,864
PER CAPITA INCOME
$67,917
AVG FAMILY INCOME
$42,946
AVG HOUSEHOLD INCOME
32.2%
WAGE / INCOME GAP [ % ]
67.8¢/ $1
WAGE / INCOME GAP [ $ ]
0.40
INEQUALITY / GINI INDEX
659
TOTAL POPULATION
308
MALE POPULATION
351
FEMALE POPULATION
87.75
MALES / 100 FEMALES
113.96
FEMALES / 100 MALES
61.0
MEDIAN AGE
2.6
AVG FAMILY SIZE
1.8
AVG HOUSEHOLD SIZE
312
LABOR FORCE [ PEOPLE ]
54.3%
PERCENT IN LABOR FORCE
Wessington Springs Zip Codes
Wessington Springs Area Codes
Income in Wessington Springs
Income Overview in Wessington Springs
Per Capita Income in Wessington Springs is $28,864, while median incomes of families and households are $67,917 and $42,946 respectively.
| Characteristic | Number | Measure |
| Per Capita Income | 659 | $28,864 |
| Median Family Income | 147 | $67,917 |
| Mean Family Income | 147 | $72,533 |
| Median Household Income | 348 | $42,946 |
| Mean Household Income | 348 | $51,737 |
| Income Deficit | 147 | $0 |
| Wage / Income Gap (%) | 659 | 32.17% |
| Wage / Income Gap ($) | 659 | 67.83¢ per $1 |
| Gini / Inequality Index | 659 | 0.40 |
Earnings by Sex in Wessington Springs
Average Earnings in Wessington Springs are $28,523, $31,667 for men and $21,481 for women, a difference of 32.2%.
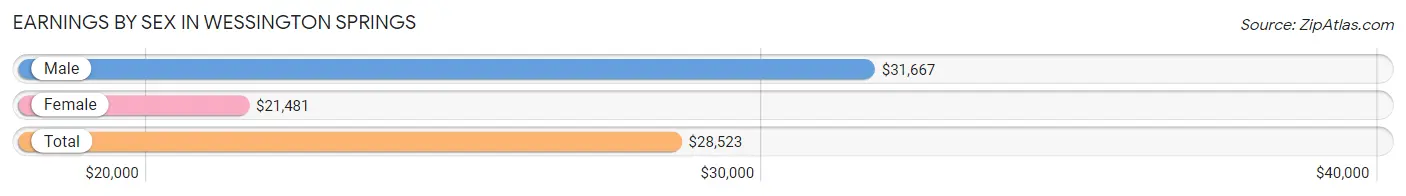
| Sex | Number | Average Earnings |
| Male | 166 (46.9%) | $31,667 |
| Female | 188 (53.1%) | $21,481 |
| Total | 354 (100.0%) | $28,523 |
Earnings by Sex by Income Bracket in Wessington Springs
The most common earnings brackets in Wessington Springs are $75,000 to $99,999 for men (25 | 15.1%) and $2,499 or less for women (31 | 16.5%).
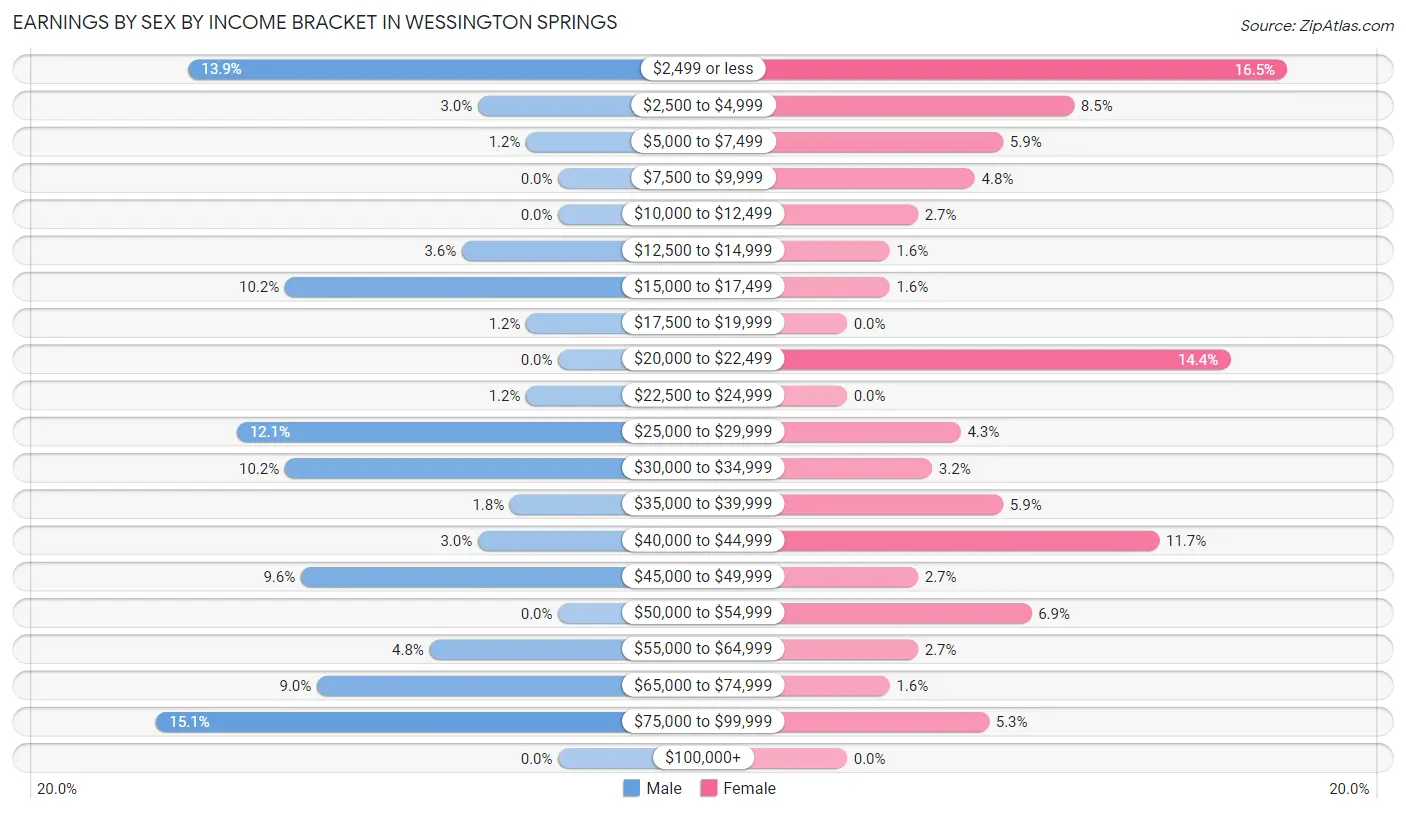
| Income | Male | Female |
| $2,499 or less | 23 (13.9%) | 31 (16.5%) |
| $2,500 to $4,999 | 5 (3.0%) | 16 (8.5%) |
| $5,000 to $7,499 | 2 (1.2%) | 11 (5.9%) |
| $7,500 to $9,999 | 0 (0.0%) | 9 (4.8%) |
| $10,000 to $12,499 | 0 (0.0%) | 5 (2.7%) |
| $12,500 to $14,999 | 6 (3.6%) | 3 (1.6%) |
| $15,000 to $17,499 | 17 (10.2%) | 3 (1.6%) |
| $17,500 to $19,999 | 2 (1.2%) | 0 (0.0%) |
| $20,000 to $22,499 | 0 (0.0%) | 27 (14.4%) |
| $22,500 to $24,999 | 2 (1.2%) | 0 (0.0%) |
| $25,000 to $29,999 | 20 (12.0%) | 8 (4.3%) |
| $30,000 to $34,999 | 17 (10.2%) | 6 (3.2%) |
| $35,000 to $39,999 | 3 (1.8%) | 11 (5.9%) |
| $40,000 to $44,999 | 5 (3.0%) | 22 (11.7%) |
| $45,000 to $49,999 | 16 (9.6%) | 5 (2.7%) |
| $50,000 to $54,999 | 0 (0.0%) | 13 (6.9%) |
| $55,000 to $64,999 | 8 (4.8%) | 5 (2.7%) |
| $65,000 to $74,999 | 15 (9.0%) | 3 (1.6%) |
| $75,000 to $99,999 | 25 (15.1%) | 10 (5.3%) |
| $100,000+ | 0 (0.0%) | 0 (0.0%) |
| Total | 166 (100.0%) | 188 (100.0%) |
Earnings by Sex by Educational Attainment in Wessington Springs
Average earnings in Wessington Springs are $32,969 for men and $21,944 for women, a difference of 33.4%. Men with an educational attainment of bachelor's degree enjoy the highest average annual earnings of $53,750, while those with college or associate's degree education earn the least with $28,000. Women with an educational attainment of graduate degree earn the most with the average annual earnings of $83,000, while those with high school diploma education have the smallest earnings of $20,278.
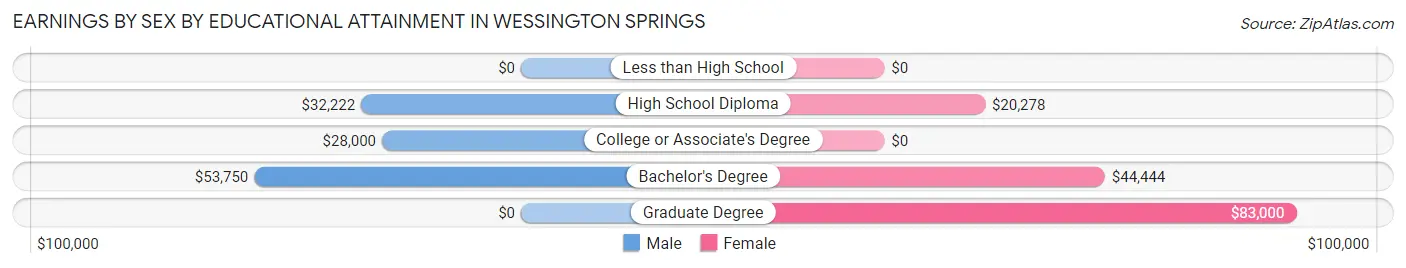
| Educational Attainment | Male Income | Female Income |
| Less than High School | - | - |
| High School Diploma | $32,222 | $20,278 |
| College or Associate's Degree | $28,000 | $0 |
| Bachelor's Degree | $53,750 | $44,444 |
| Graduate Degree | - | - |
| Total | $32,969 | $21,944 |
Family Income in Wessington Springs
Family Income Brackets in Wessington Springs
According to the Wessington Springs family income data, there are 42 families falling into the $35,000 to $49,999 income range, which is the most common income bracket and makes up 28.6% of all families.
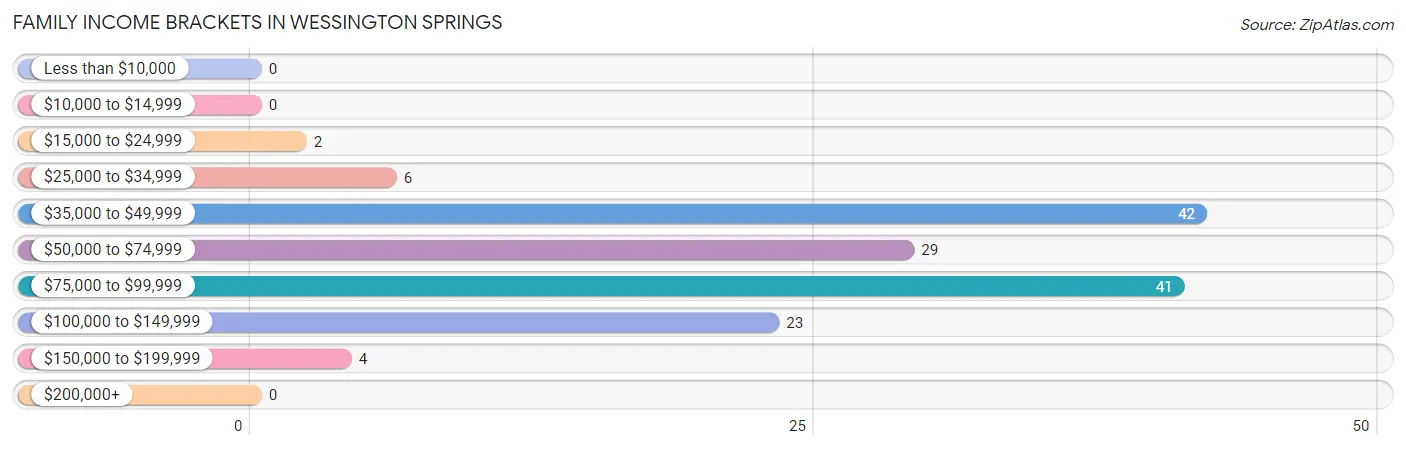
| Income Bracket | # Families | % Families |
| Less than $10,000 | 0 | 0.0% |
| $10,000 to $14,999 | 0 | 0.0% |
| $15,000 to $24,999 | 2 | 1.4% |
| $25,000 to $34,999 | 6 | 4.1% |
| $35,000 to $49,999 | 42 | 28.6% |
| $50,000 to $74,999 | 29 | 19.7% |
| $75,000 to $99,999 | 41 | 27.9% |
| $100,000 to $149,999 | 23 | 15.6% |
| $150,000 to $199,999 | 4 | 2.7% |
| $200,000+ | 0 | 0.0% |
Family Income by Famaliy Size in Wessington Springs
3-person families (17 | 11.6%) account for the highest median family income in Wessington Springs with $105,938 per family, while 3-person families (17 | 11.6%) have the highest median income of $35,313 per family member.
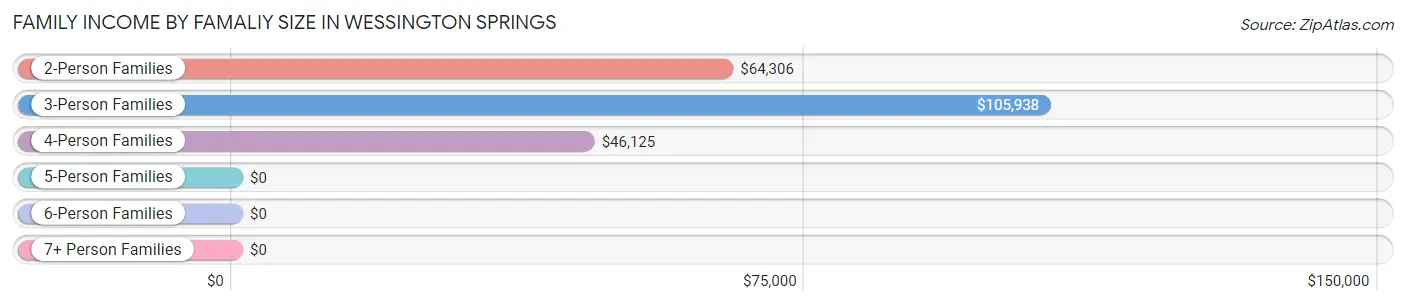
| Income Bracket | # Families | Median Income |
| 2-Person Families | 97 (66.0%) | $64,306 |
| 3-Person Families | 17 (11.6%) | $105,938 |
| 4-Person Families | 21 (14.3%) | $46,125 |
| 5-Person Families | 11 (7.5%) | $0 |
| 6-Person Families | 0 (0.0%) | $0 |
| 7+ Person Families | 1 (0.7%) | $0 |
| Total | 147 (100.0%) | $67,917 |
Family Income by Number of Earners in Wessington Springs
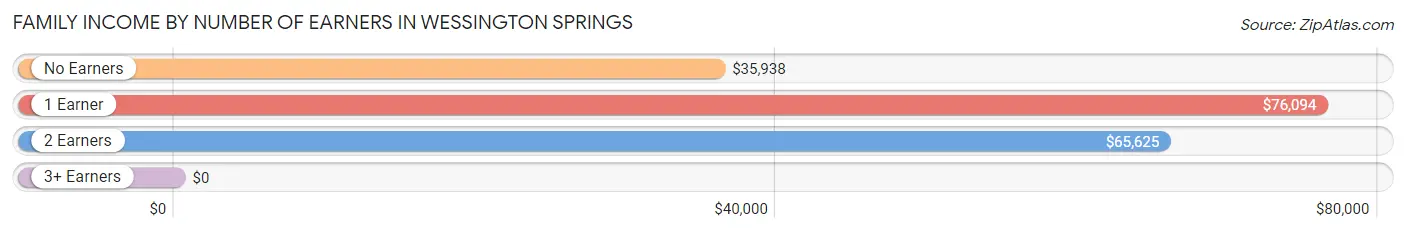
| Number of Earners | # Families | Median Income |
| No Earners | 19 (12.9%) | $35,938 |
| 1 Earner | 39 (26.5%) | $76,094 |
| 2 Earners | 87 (59.2%) | $65,625 |
| 3+ Earners | 2 (1.4%) | $0 |
| Total | 147 (100.0%) | $67,917 |
Household Income in Wessington Springs
Household Income Brackets in Wessington Springs
With 78 households falling in the category, the $75,000 to $99,999 income range is the most frequent in Wessington Springs, accounting for 22.4% of all households. In contrast, only 3 households (0.9%) fall into the $200,000+ income bracket, making it the least populous group.
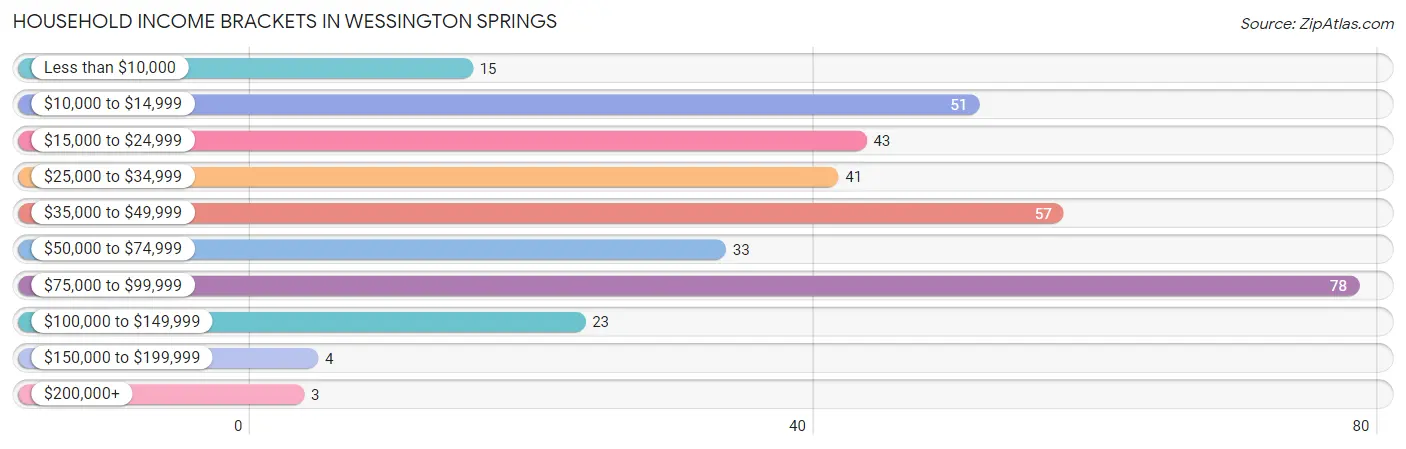
| Income Bracket | # Households | % Households |
| Less than $10,000 | 15 | 4.3% |
| $10,000 to $14,999 | 51 | 14.7% |
| $15,000 to $24,999 | 43 | 12.4% |
| $25,000 to $34,999 | 41 | 11.8% |
| $35,000 to $49,999 | 57 | 16.4% |
| $50,000 to $74,999 | 33 | 9.5% |
| $75,000 to $99,999 | 78 | 22.4% |
| $100,000 to $149,999 | 23 | 6.6% |
| $150,000 to $199,999 | 4 | 1.1% |
| $200,000+ | 3 | 0.9% |
Household Income by Householder Age in Wessington Springs
The median household income in Wessington Springs is $42,946, with the highest median household income of $75,156 found in the 45 to 64 years age bracket for the primary householder. A total of 99 households (28.4%) fall into this category. Meanwhile, the 15 to 24 years age bracket for the primary householder has the lowest median household income of $0, with 4 households (1.1%) in this group.
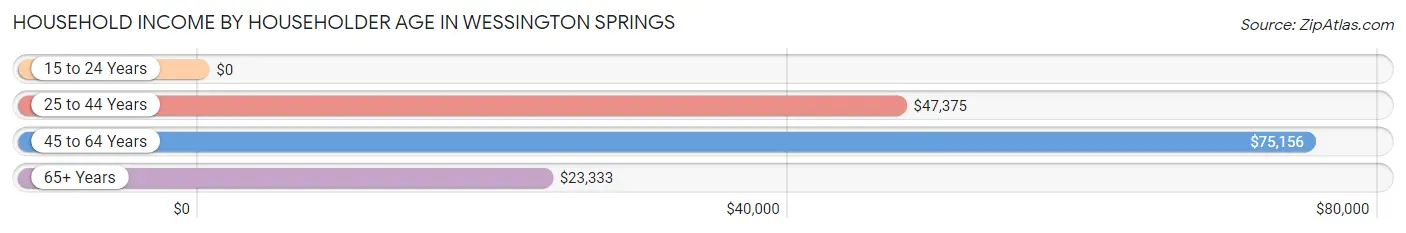
| Income Bracket | # Households | Median Income |
| 15 to 24 Years | 4 (1.1%) | $0 |
| 25 to 44 Years | 83 (23.8%) | $47,375 |
| 45 to 64 Years | 99 (28.4%) | $75,156 |
| 65+ Years | 162 (46.6%) | $23,333 |
| Total | 348 (100.0%) | $42,946 |
Poverty in Wessington Springs
Income Below Poverty by Sex and Age in Wessington Springs
With 5.5% poverty level for males and 19.3% for females among the residents of Wessington Springs, 35 to 44 year old males and 18 to 24 year old females are the most vulnerable to poverty, with 10 males (27.0%) and 3 females (50.0%) in their respective age groups living below the poverty level.
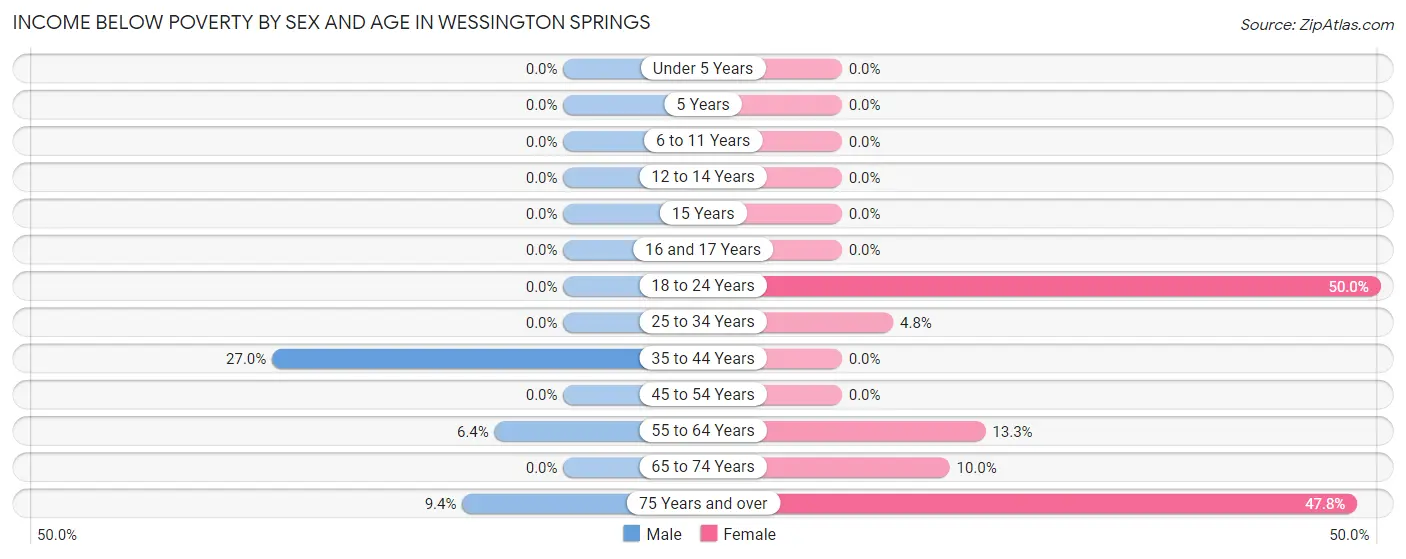
| Age Bracket | Male | Female |
| Under 5 Years | 0 (0.0%) | 0 (0.0%) |
| 5 Years | 0 (0.0%) | 0 (0.0%) |
| 6 to 11 Years | 0 (0.0%) | 0 (0.0%) |
| 12 to 14 Years | 0 (0.0%) | 0 (0.0%) |
| 15 Years | 0 (0.0%) | 0 (0.0%) |
| 16 and 17 Years | 0 (0.0%) | 0 (0.0%) |
| 18 to 24 Years | 0 (0.0%) | 3 (50.0%) |
| 25 to 34 Years | 0 (0.0%) | 2 (4.8%) |
| 35 to 44 Years | 10 (27.0%) | 0 (0.0%) |
| 45 to 54 Years | 0 (0.0%) | 0 (0.0%) |
| 55 to 64 Years | 3 (6.4%) | 8 (13.3%) |
| 65 to 74 Years | 0 (0.0%) | 5 (10.0%) |
| 75 Years and over | 3 (9.4%) | 44 (47.8%) |
| Total | 16 (5.5%) | 62 (19.3%) |
Income Above Poverty by Sex and Age in Wessington Springs
According to the poverty statistics in Wessington Springs, males aged under 5 years and females aged under 5 years are the age groups that are most secure financially, with 100.0% of males and 100.0% of females in these age groups living above the poverty line.
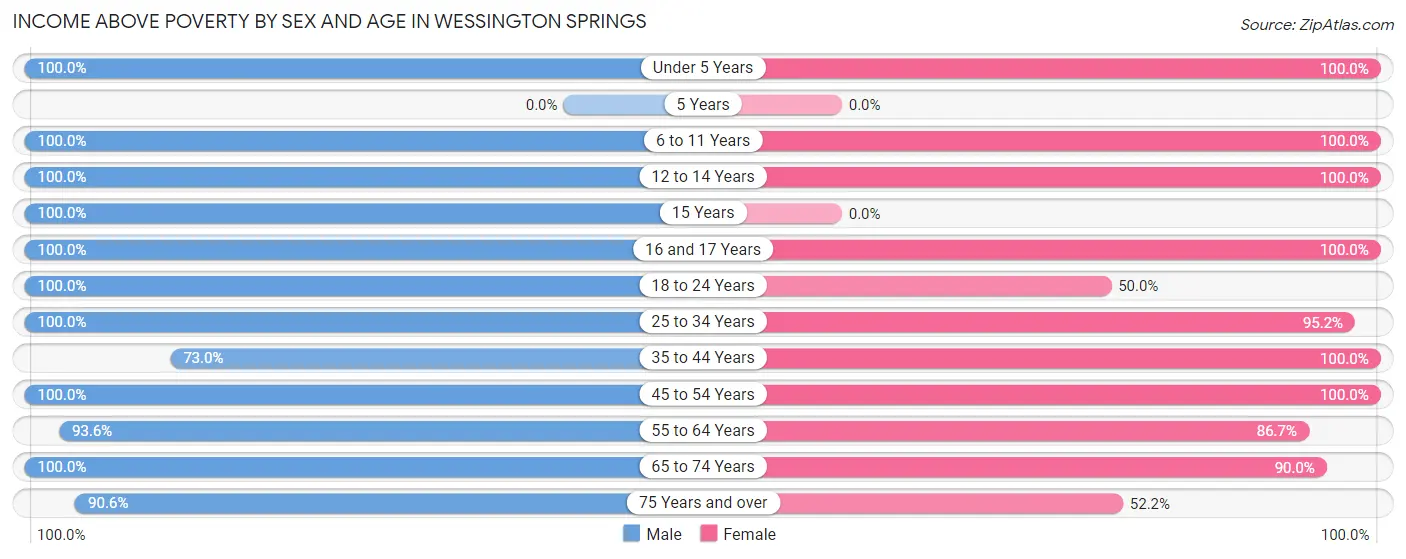
| Age Bracket | Male | Female |
| Under 5 Years | 13 (100.0%) | 10 (100.0%) |
| 5 Years | 0 (0.0%) | 0 (0.0%) |
| 6 to 11 Years | 16 (100.0%) | 16 (100.0%) |
| 12 to 14 Years | 14 (100.0%) | 8 (100.0%) |
| 15 Years | 7 (100.0%) | 0 (0.0%) |
| 16 and 17 Years | 12 (100.0%) | 4 (100.0%) |
| 18 to 24 Years | 1 (100.0%) | 3 (50.0%) |
| 25 to 34 Years | 31 (100.0%) | 40 (95.2%) |
| 35 to 44 Years | 27 (73.0%) | 15 (100.0%) |
| 45 to 54 Years | 13 (100.0%) | 18 (100.0%) |
| 55 to 64 Years | 44 (93.6%) | 52 (86.7%) |
| 65 to 74 Years | 69 (100.0%) | 45 (90.0%) |
| 75 Years and over | 29 (90.6%) | 48 (52.2%) |
| Total | 276 (94.5%) | 259 (80.7%) |
Income Below Poverty Among Married-Couple Families in Wessington Springs
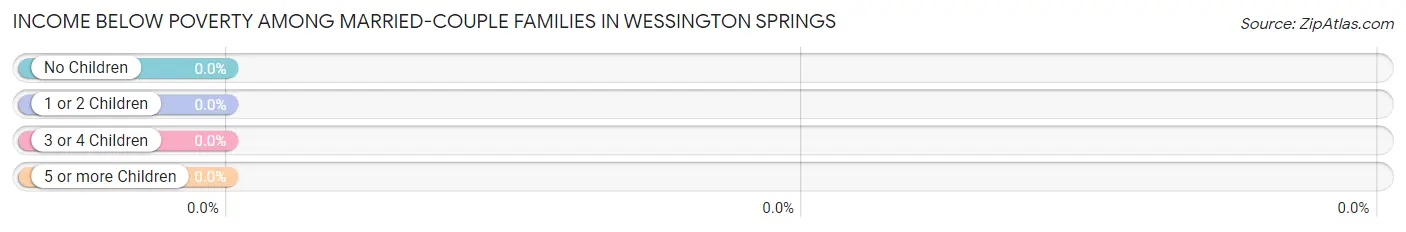
| Children | Above Poverty | Below Poverty |
| No Children | 97 (100.0%) | 0 (0.0%) |
| 1 or 2 Children | 25 (100.0%) | 0 (0.0%) |
| 3 or 4 Children | 11 (100.0%) | 0 (0.0%) |
| 5 or more Children | 1 (100.0%) | 0 (0.0%) |
| Total | 134 (100.0%) | 0 (0.0%) |
Income Below Poverty Among Single-Parent Households in Wessington Springs
| Children | Single Father | Single Mother |
| No Children | 0 (0.0%) | 0 (0.0%) |
| 1 or 2 Children | 0 (0.0%) | 0 (0.0%) |
| 3 or 4 Children | 0 (0.0%) | 0 (0.0%) |
| 5 or more Children | 0 (0.0%) | 0 (0.0%) |
| Total | 0 (0.0%) | 0 (0.0%) |
Income Below Poverty Among Married-Couple vs Single-Parent Households in Wessington Springs
| Children | Married-Couple Families | Single-Parent Households |
| No Children | 0 (0.0%) | 0 (0.0%) |
| 1 or 2 Children | 0 (0.0%) | 0 (0.0%) |
| 3 or 4 Children | 0 (0.0%) | 0 (0.0%) |
| 5 or more Children | 0 (0.0%) | 0 (0.0%) |
| Total | 0 (0.0%) | 0 (0.0%) |
Race in Wessington Springs
The most populous races in Wessington Springs are White / Caucasian (628 | 95.3%), Two or more Races (25 | 3.8%), and Native / Alaskan (6 | 0.9%).
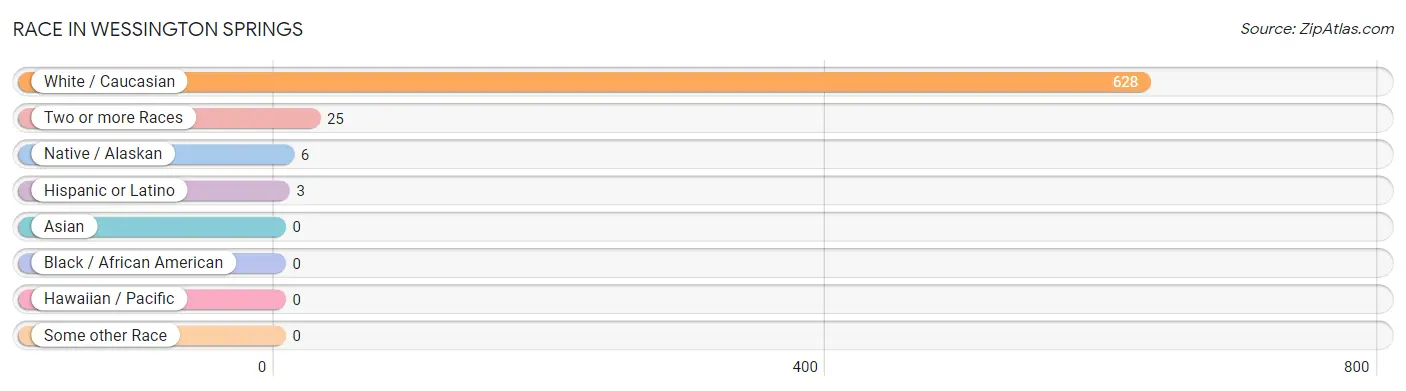
| Race | # Population | % Population |
| Asian | 0 | 0.0% |
| Black / African American | 0 | 0.0% |
| Hawaiian / Pacific | 0 | 0.0% |
| Hispanic or Latino | 3 | 0.5% |
| Native / Alaskan | 6 | 0.9% |
| White / Caucasian | 628 | 95.3% |
| Two or more Races | 25 | 3.8% |
| Some other Race | 0 | 0.0% |
| Total | 659 | 100.0% |
Ancestry in Wessington Springs
The most populous ancestries reported in Wessington Springs are German (270 | 41.0%), American (104 | 15.8%), English (87 | 13.2%), Norwegian (62 | 9.4%), and Irish (49 | 7.4%), together accounting for 86.8% of all Wessington Springs residents.
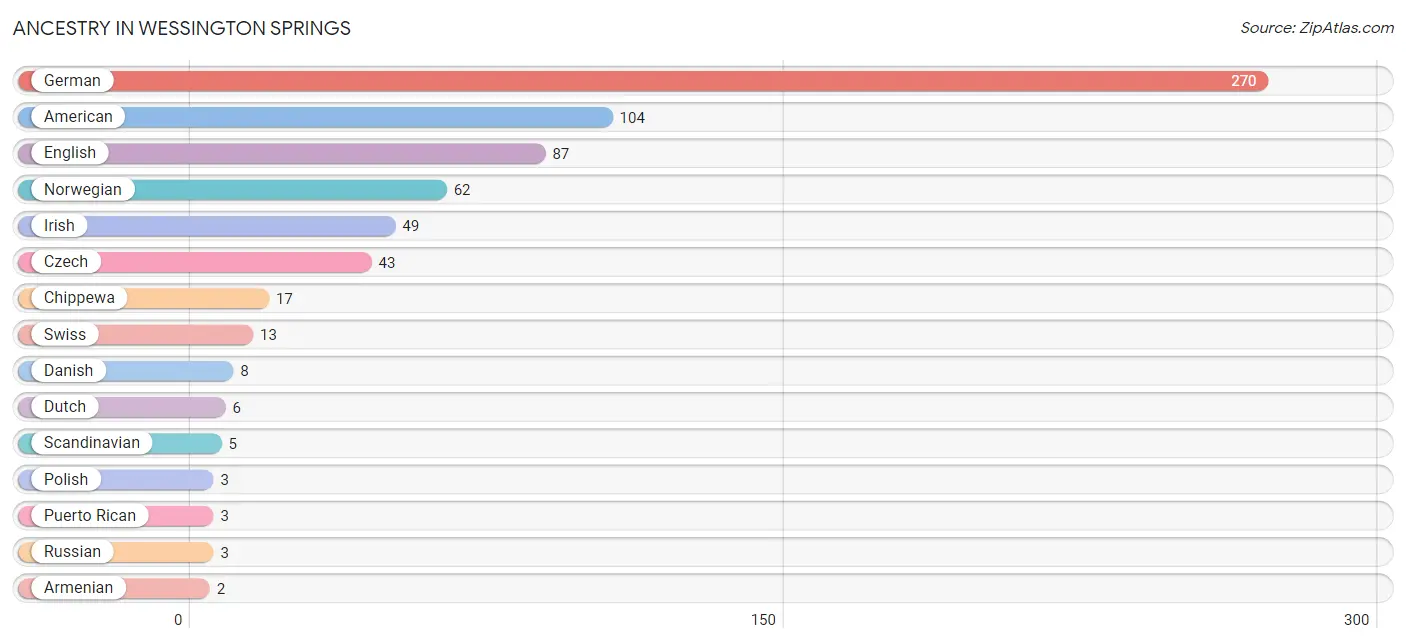
| Ancestry | # Population | % Population |
| American | 104 | 15.8% |
| Armenian | 2 | 0.3% |
| Chippewa | 17 | 2.6% |
| Czech | 43 | 6.5% |
| Danish | 8 | 1.2% |
| Dutch | 6 | 0.9% |
| English | 87 | 13.2% |
| French | 1 | 0.2% |
| German | 270 | 41.0% |
| Irish | 49 | 7.4% |
| Norwegian | 62 | 9.4% |
| Polish | 3 | 0.5% |
| Puerto Rican | 3 | 0.5% |
| Russian | 3 | 0.5% |
| Scandinavian | 5 | 0.8% |
| Swiss | 13 | 2.0% | View All 16 Rows |
Immigrants in Wessington Springs
The most numerous immigrant groups reported in Wessington Springs came from Armenia (2 | 0.3%), Asia (2 | 0.3%), Western Asia (2 | 0.3%), Europe (1 | 0.2%), and Northern Europe (1 | 0.2%), together accounting for 1.2% of all Wessington Springs residents.
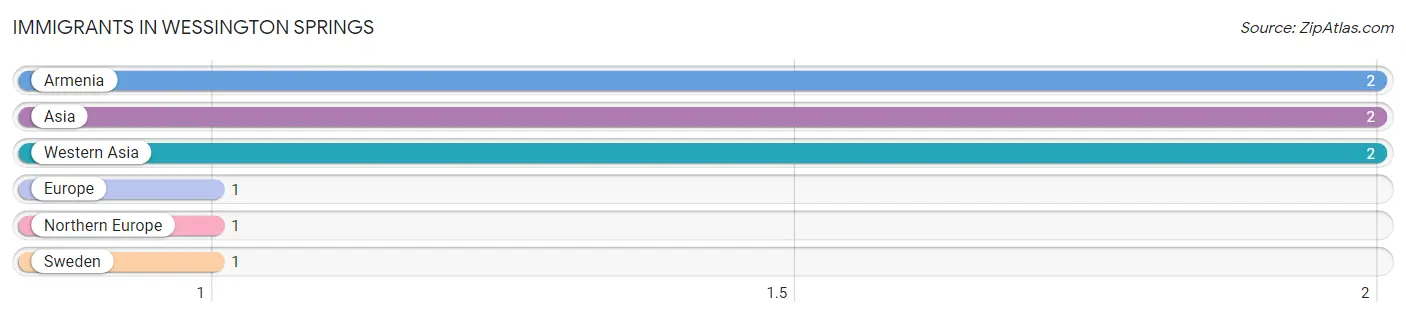
| Immigration Origin | # Population | % Population |
| Armenia | 2 | 0.3% |
| Asia | 2 | 0.3% |
| Europe | 1 | 0.2% |
| Northern Europe | 1 | 0.2% |
| Sweden | 1 | 0.2% |
| Western Asia | 2 | 0.3% | View All 6 Rows |
Sex and Age in Wessington Springs
Sex and Age in Wessington Springs
The most populous age groups in Wessington Springs are 65 to 69 Years (44 | 14.3%) for men and 85 Years and over (56 | 16.0%) for women.
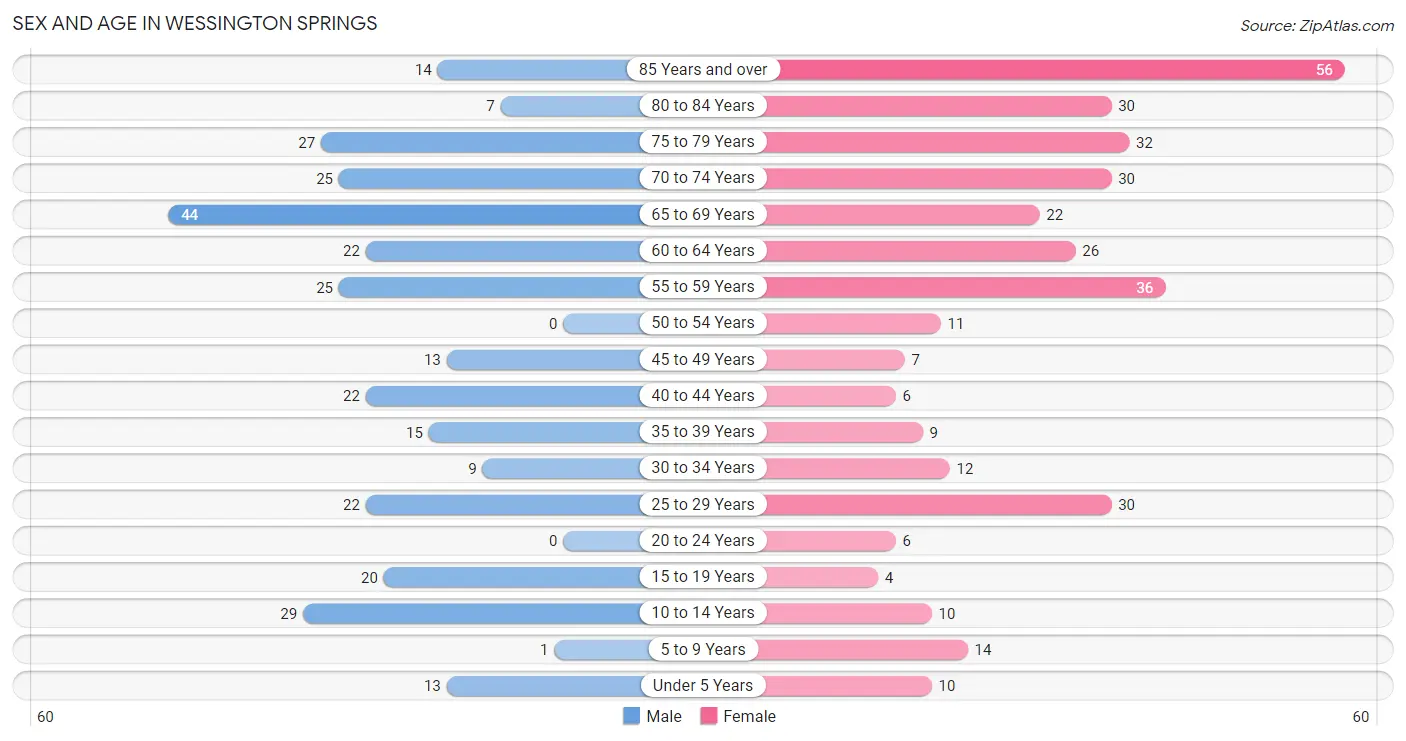
| Age Bracket | Male | Female |
| Under 5 Years | 13 (4.2%) | 10 (2.9%) |
| 5 to 9 Years | 1 (0.3%) | 14 (4.0%) |
| 10 to 14 Years | 29 (9.4%) | 10 (2.9%) |
| 15 to 19 Years | 20 (6.5%) | 4 (1.1%) |
| 20 to 24 Years | 0 (0.0%) | 6 (1.7%) |
| 25 to 29 Years | 22 (7.1%) | 30 (8.6%) |
| 30 to 34 Years | 9 (2.9%) | 12 (3.4%) |
| 35 to 39 Years | 15 (4.9%) | 9 (2.6%) |
| 40 to 44 Years | 22 (7.1%) | 6 (1.7%) |
| 45 to 49 Years | 13 (4.2%) | 7 (2.0%) |
| 50 to 54 Years | 0 (0.0%) | 11 (3.1%) |
| 55 to 59 Years | 25 (8.1%) | 36 (10.3%) |
| 60 to 64 Years | 22 (7.1%) | 26 (7.4%) |
| 65 to 69 Years | 44 (14.3%) | 22 (6.3%) |
| 70 to 74 Years | 25 (8.1%) | 30 (8.6%) |
| 75 to 79 Years | 27 (8.8%) | 32 (9.1%) |
| 80 to 84 Years | 7 (2.3%) | 30 (8.6%) |
| 85 Years and over | 14 (4.5%) | 56 (16.0%) |
| Total | 308 (100.0%) | 351 (100.0%) |
Families and Households in Wessington Springs
Median Family Size in Wessington Springs
The median family size in Wessington Springs is 2.64 persons per family, with single male/father families (3 | 2.0%) accounting for the largest median family size of 4 persons per family. On the other hand, married-couple families (134 | 91.2%) represent the smallest median family size with 2.57 persons per family.
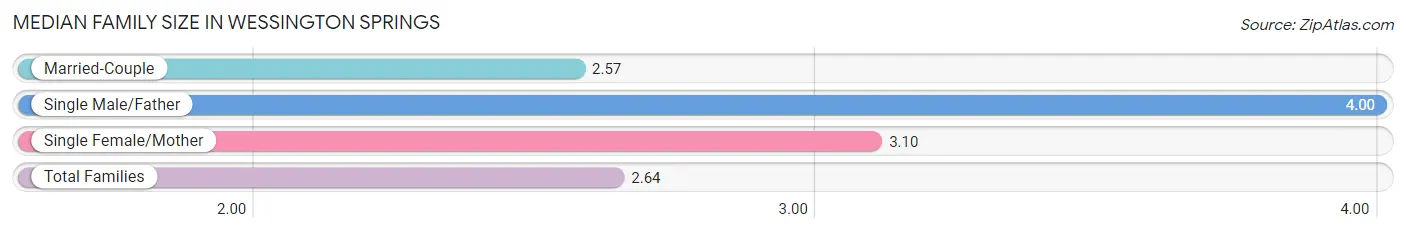
| Family Type | # Families | Family Size |
| Married-Couple | 134 (91.2%) | 2.57 |
| Single Male/Father | 3 (2.0%) | 4.00 |
| Single Female/Mother | 10 (6.8%) | 3.10 |
| Total Families | 147 (100.0%) | 2.64 |
Median Household Size in Wessington Springs
The median household size in Wessington Springs is 1.76 persons per household, with single male/father households (3 | 0.9%) accounting for the largest median household size of 4 persons per household. non-family households (201 | 57.8%) represent the smallest median household size with 1.09 persons per household.
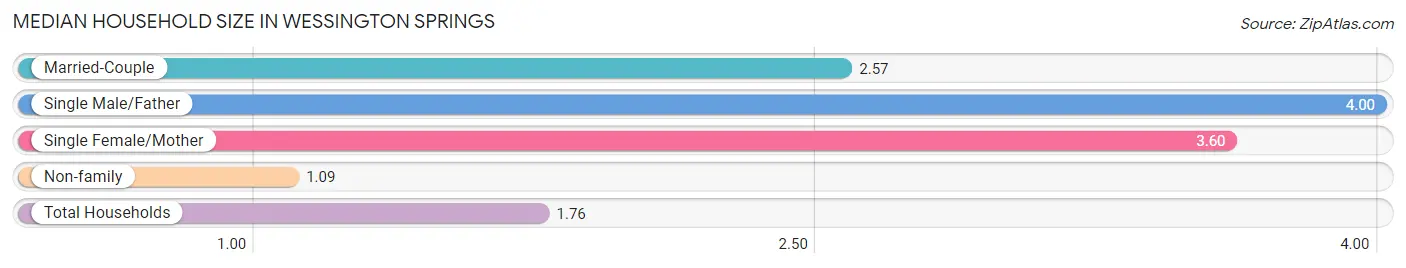
| Household Type | # Households | Household Size |
| Married-Couple | 134 (38.5%) | 2.57 |
| Single Male/Father | 3 (0.9%) | 4.00 |
| Single Female/Mother | 10 (2.9%) | 3.60 |
| Non-family | 201 (57.8%) | 1.09 |
| Total Households | 348 (100.0%) | 1.76 |
Household Size by Marriage Status in Wessington Springs
Out of a total of 348 households in Wessington Springs, 147 (42.2%) are family households, while 201 (57.8%) are nonfamily households. The most numerous type of family households are 2-person households, comprising 97, and the most common type of nonfamily households are 1-person households, comprising 177.
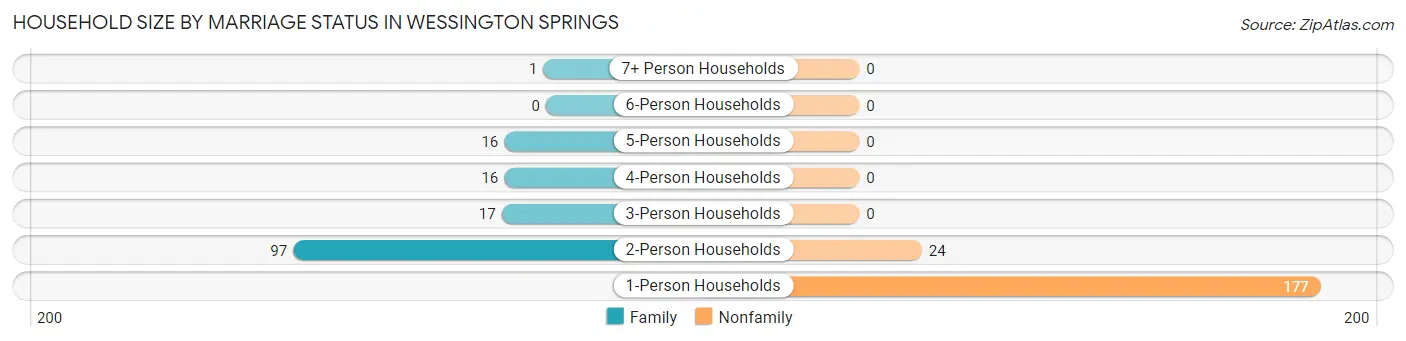
| Household Size | Family Households | Nonfamily Households |
| 1-Person Households | - | 177 (50.9%) |
| 2-Person Households | 97 (27.9%) | 24 (6.9%) |
| 3-Person Households | 17 (4.9%) | 0 (0.0%) |
| 4-Person Households | 16 (4.6%) | 0 (0.0%) |
| 5-Person Households | 16 (4.6%) | 0 (0.0%) |
| 6-Person Households | 0 (0.0%) | 0 (0.0%) |
| 7+ Person Households | 1 (0.3%) | 0 (0.0%) |
| Total | 147 (42.2%) | 201 (57.8%) |
Female Fertility in Wessington Springs
Fertility by Age in Wessington Springs
Average fertility rate in Wessington Springs is 89.0 births per 1,000 women. Women in the age bracket of 35 to 50 years have the highest fertility rate with 148.0 births per 1,000 women. Women in the age bracket of 35 to 50 years acount for 57.1% of all women with births.
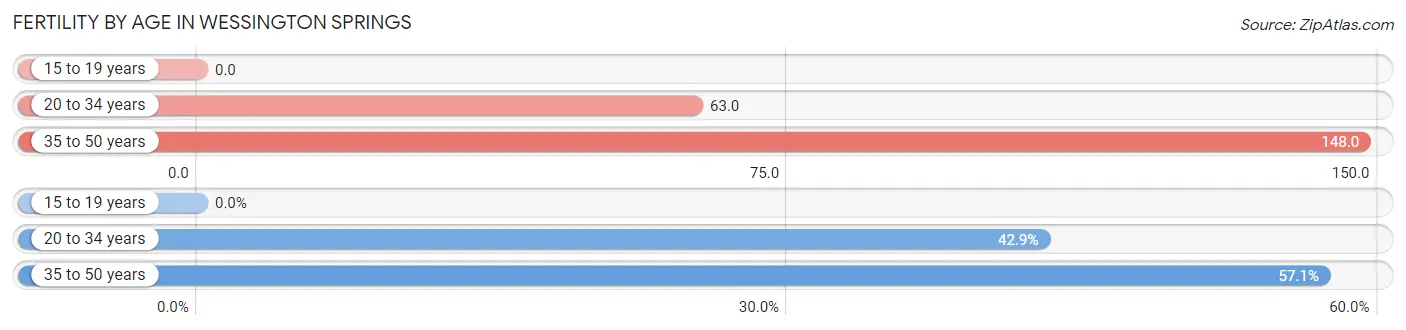
| Age Bracket | Women with Births | Births / 1,000 Women |
| 15 to 19 years | 0 (0.0%) | 0.0 |
| 20 to 34 years | 3 (42.9%) | 63.0 |
| 35 to 50 years | 4 (57.1%) | 148.0 |
| Total | 7 (100.0%) | 89.0 |
Fertility by Age by Marriage Status in Wessington Springs
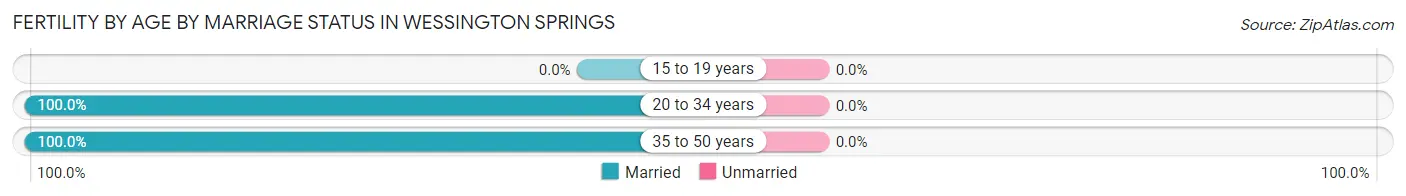
| Age Bracket | Married | Unmarried |
| 15 to 19 years | 0 (0.0%) | 0 (0.0%) |
| 20 to 34 years | 3 (100.0%) | 0 (0.0%) |
| 35 to 50 years | 4 (100.0%) | 0 (0.0%) |
| Total | 7 (100.0%) | 0 (0.0%) |
Fertility by Education in Wessington Springs
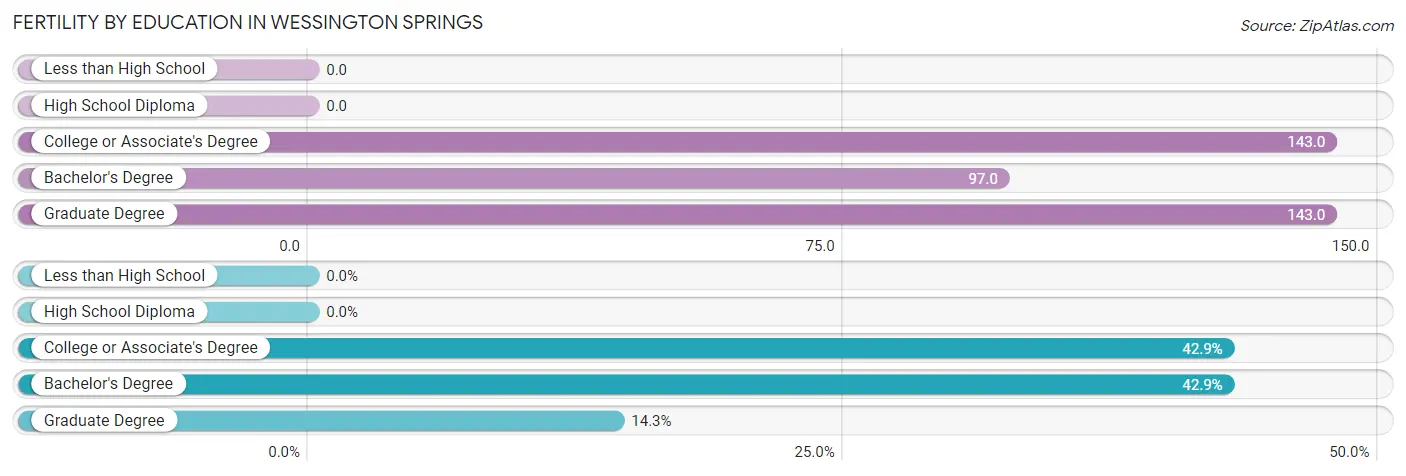
| Educational Attainment | Women with Births | Births / 1,000 Women |
| Less than High School | 0 (0.0%) | 0.0 |
| High School Diploma | 0 (0.0%) | 0.0 |
| College or Associate's Degree | 3 (42.9%) | 143.0 |
| Bachelor's Degree | 3 (42.9%) | 97.0 |
| Graduate Degree | 1 (14.3%) | 143.0 |
| Total | 7 (100.0%) | 89.0 |
Fertility by Education by Marriage Status in Wessington Springs
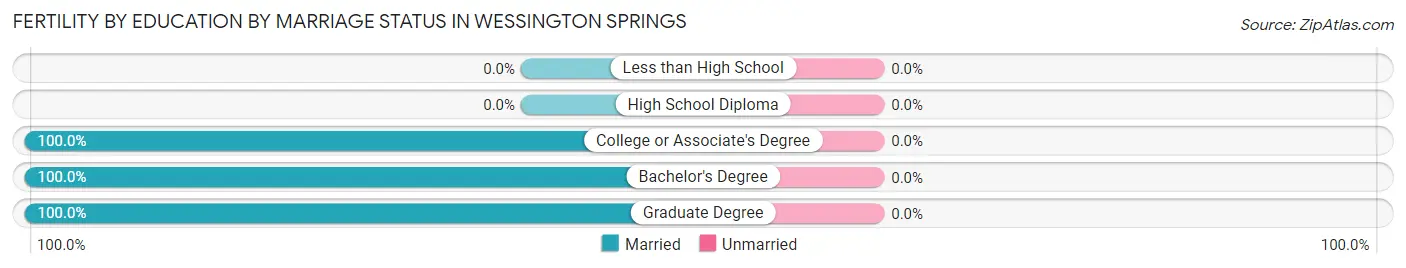
| Educational Attainment | Married | Unmarried |
| Less than High School | 0 (0.0%) | 0 (0.0%) |
| High School Diploma | 0 (0.0%) | 0 (0.0%) |
| College or Associate's Degree | 3 (100.0%) | 0 (0.0%) |
| Bachelor's Degree | 3 (100.0%) | 0 (0.0%) |
| Graduate Degree | 1 (100.0%) | 0 (0.0%) |
| Total | 7 (100.0%) | 0 (0.0%) |
Employment Characteristics in Wessington Springs
Employment by Class of Employer in Wessington Springs
Among the 307 employed individuals in Wessington Springs, private company employees (189 | 61.6%), local government employees (51 | 16.6%), and self-employed (not incorporated) (34 | 11.1%) make up the most common classes of employment.
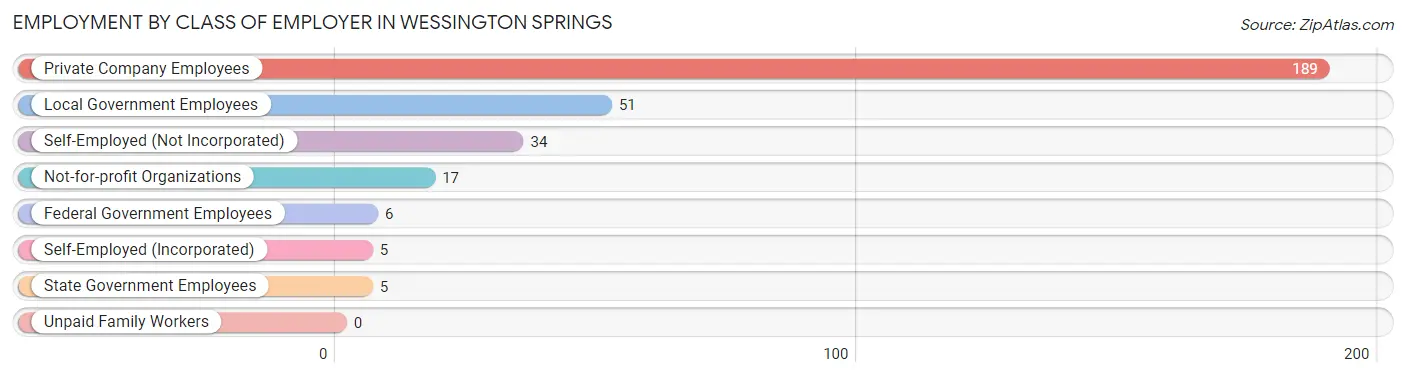
| Employer Class | # Employees | % Employees |
| Private Company Employees | 189 | 61.6% |
| Self-Employed (Incorporated) | 5 | 1.6% |
| Self-Employed (Not Incorporated) | 34 | 11.1% |
| Not-for-profit Organizations | 17 | 5.5% |
| Local Government Employees | 51 | 16.6% |
| State Government Employees | 5 | 1.6% |
| Federal Government Employees | 6 | 1.9% |
| Unpaid Family Workers | 0 | 0.0% |
| Total | 307 | 100.0% |
Employment Status by Age in Wessington Springs
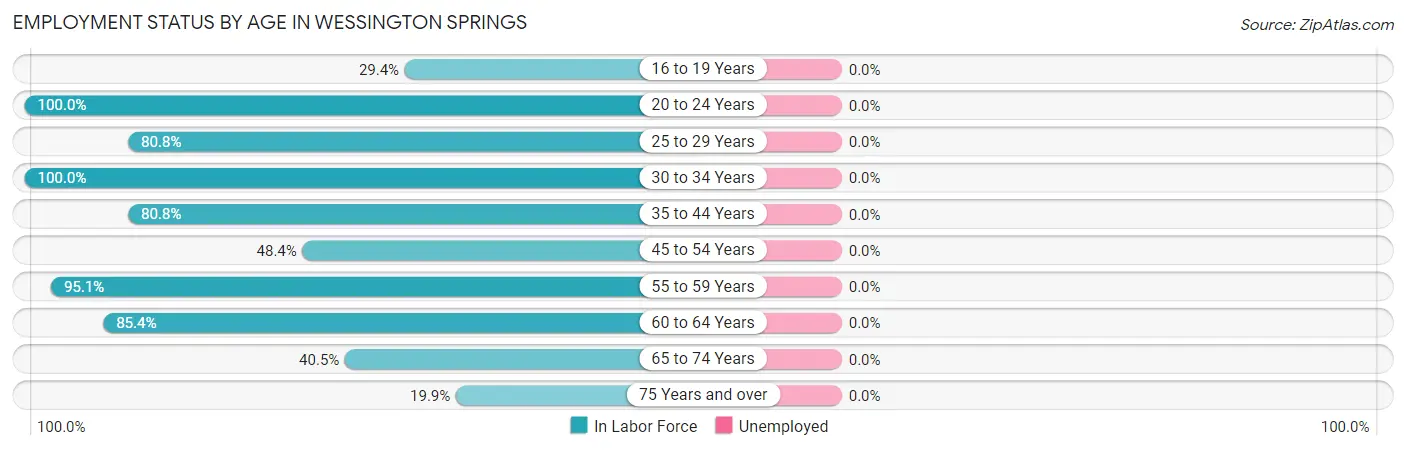
| Age Bracket | In Labor Force | Unemployed |
| 16 to 19 Years | 5 (29.4%) | 0 (0.0%) |
| 20 to 24 Years | 6 (100.0%) | 0 (0.0%) |
| 25 to 29 Years | 42 (80.8%) | 0 (0.0%) |
| 30 to 34 Years | 21 (100.0%) | 0 (0.0%) |
| 35 to 44 Years | 42 (80.8%) | 0 (0.0%) |
| 45 to 54 Years | 15 (48.4%) | 0 (0.0%) |
| 55 to 59 Years | 58 (95.1%) | 0 (0.0%) |
| 60 to 64 Years | 41 (85.4%) | 0 (0.0%) |
| 65 to 74 Years | 49 (40.5%) | 0 (0.0%) |
| 75 Years and over | 33 (19.9%) | 0 (0.0%) |
| Total | 312 (54.3%) | 0 (0.0%) |
Employment Status by Educational Attainment in Wessington Springs
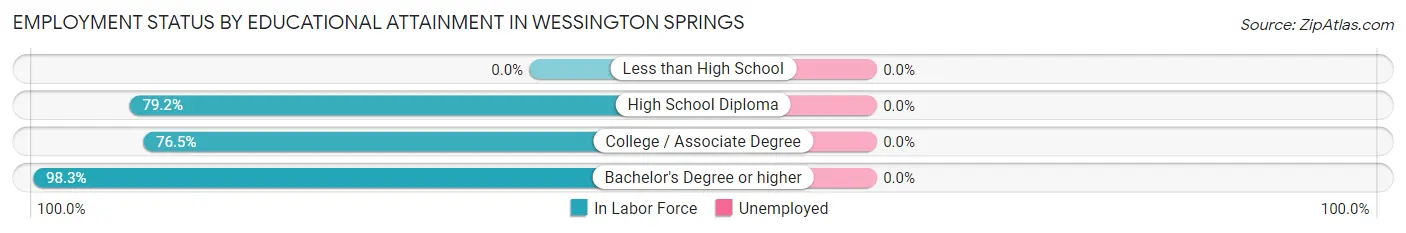
| Educational Attainment | In Labor Force | Unemployed |
| Less than High School | 0 (0.0%) | 0 (0.0%) |
| High School Diploma | 95 (79.2%) | 0 (0.0%) |
| College / Associate Degree | 65 (76.5%) | 0 (0.0%) |
| Bachelor's Degree or higher | 59 (98.3%) | 0 (0.0%) |
| Total | 219 (82.6%) | 0 (0.0%) |
Employment Occupations by Sex in Wessington Springs
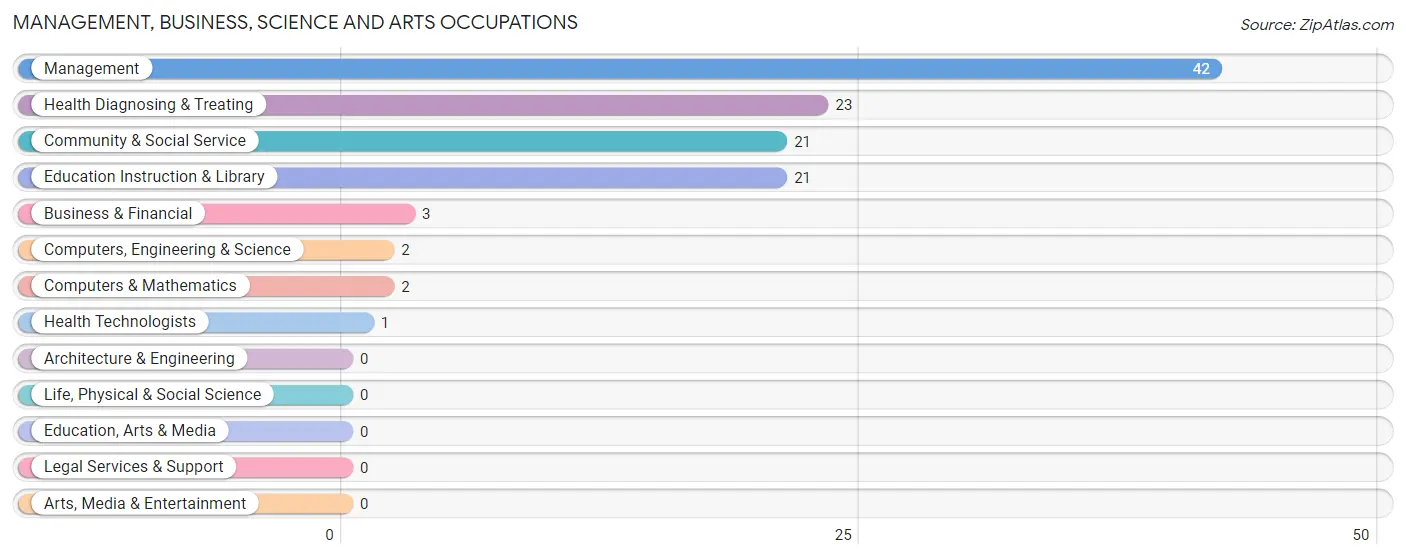
Management, Business, Science and Arts Occupations
The most common Management, Business, Science and Arts occupations in Wessington Springs are Management (42 | 13.5%), Health Diagnosing & Treating (23 | 7.4%), Community & Social Service (21 | 6.7%), Education Instruction & Library (21 | 6.7%), and Business & Financial (3 | 1.0%).
Management, Business, Science and Arts Occupations by Sex
Within the Management, Business, Science and Arts occupations in Wessington Springs, the most male-oriented occupations are Computers, Engineering & Science (100.0%), Computers & Mathematics (100.0%), and Management (66.7%), while the most female-oriented occupations are Business & Financial (100.0%), Health Diagnosing & Treating (100.0%), and Health Technologists (100.0%).
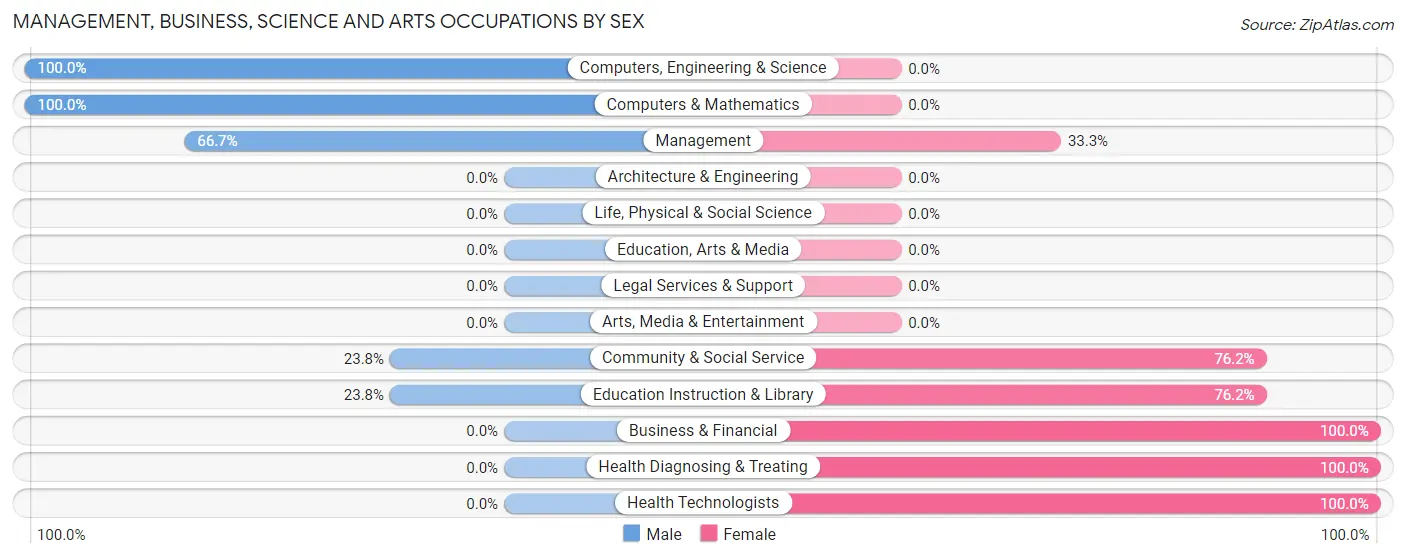
| Occupation | Male | Female |
| Management | 28 (66.7%) | 14 (33.3%) |
| Business & Financial | 0 (0.0%) | 3 (100.0%) |
| Computers, Engineering & Science | 2 (100.0%) | 0 (0.0%) |
| Computers & Mathematics | 2 (100.0%) | 0 (0.0%) |
| Architecture & Engineering | 0 (0.0%) | 0 (0.0%) |
| Life, Physical & Social Science | 0 (0.0%) | 0 (0.0%) |
| Community & Social Service | 5 (23.8%) | 16 (76.2%) |
| Education, Arts & Media | 0 (0.0%) | 0 (0.0%) |
| Legal Services & Support | 0 (0.0%) | 0 (0.0%) |
| Education Instruction & Library | 5 (23.8%) | 16 (76.2%) |
| Arts, Media & Entertainment | 0 (0.0%) | 0 (0.0%) |
| Health Diagnosing & Treating | 0 (0.0%) | 23 (100.0%) |
| Health Technologists | 0 (0.0%) | 1 (100.0%) |
| Total (Category) | 35 (38.5%) | 56 (61.5%) |
| Total (Overall) | 134 (42.9%) | 178 (57.1%) |
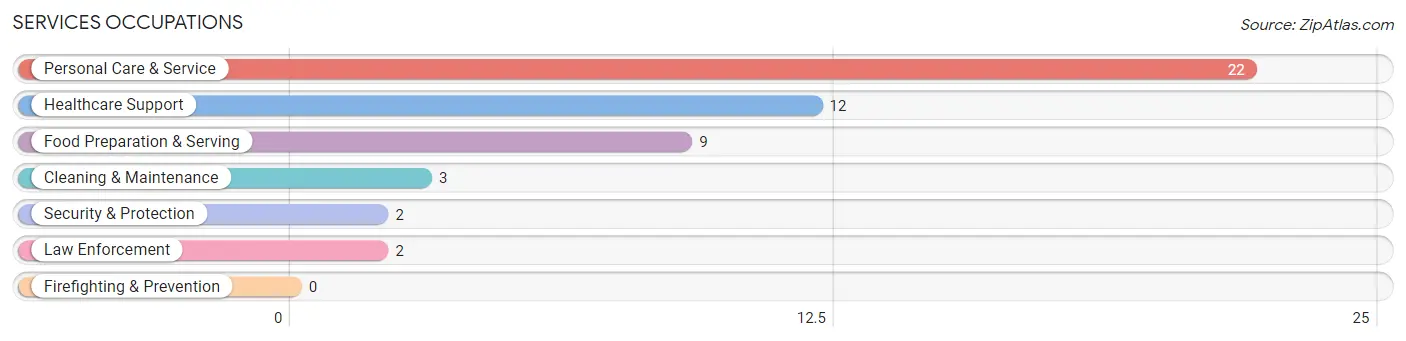
Services Occupations
The most common Services occupations in Wessington Springs are Personal Care & Service (22 | 7.0%), Healthcare Support (12 | 3.8%), Food Preparation & Serving (9 | 2.9%), Cleaning & Maintenance (3 | 1.0%), and Security & Protection (2 | 0.6%).
Services Occupations by Sex
Within the Services occupations in Wessington Springs, the most male-oriented occupations are Security & Protection (100.0%), Law Enforcement (100.0%), and Cleaning & Maintenance (100.0%), while the most female-oriented occupations are Healthcare Support (100.0%), Food Preparation & Serving (100.0%), and Personal Care & Service (59.1%).
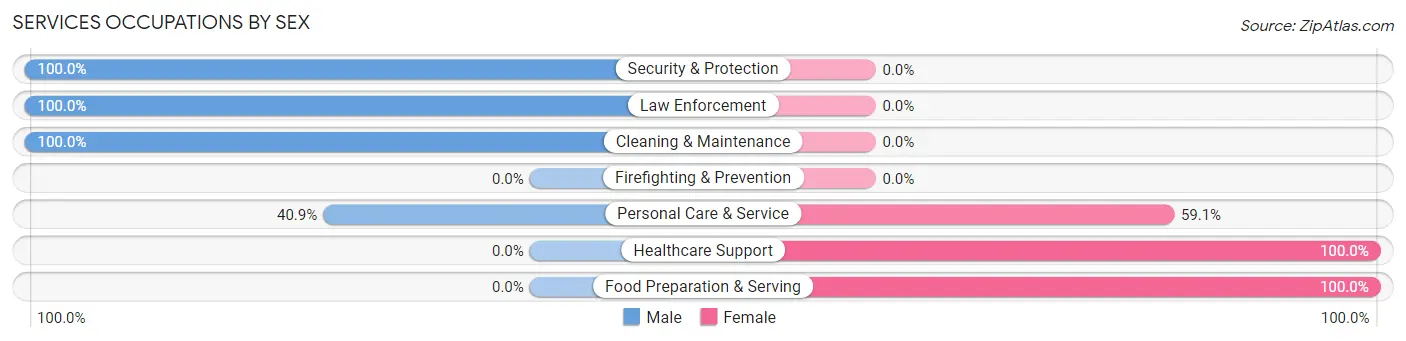
| Occupation | Male | Female |
| Healthcare Support | 0 (0.0%) | 12 (100.0%) |
| Security & Protection | 2 (100.0%) | 0 (0.0%) |
| Firefighting & Prevention | 0 (0.0%) | 0 (0.0%) |
| Law Enforcement | 2 (100.0%) | 0 (0.0%) |
| Food Preparation & Serving | 0 (0.0%) | 9 (100.0%) |
| Cleaning & Maintenance | 3 (100.0%) | 0 (0.0%) |
| Personal Care & Service | 9 (40.9%) | 13 (59.1%) |
| Total (Category) | 14 (29.2%) | 34 (70.8%) |
| Total (Overall) | 134 (42.9%) | 178 (57.1%) |
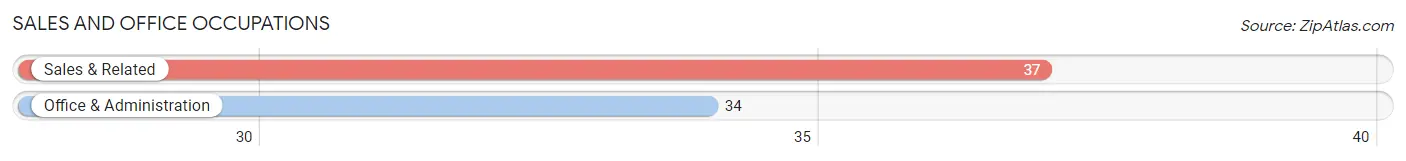
Sales and Office Occupations
The most common Sales and Office occupations in Wessington Springs are Sales & Related (37 | 11.9%), and Office & Administration (34 | 10.9%).
Sales and Office Occupations by Sex
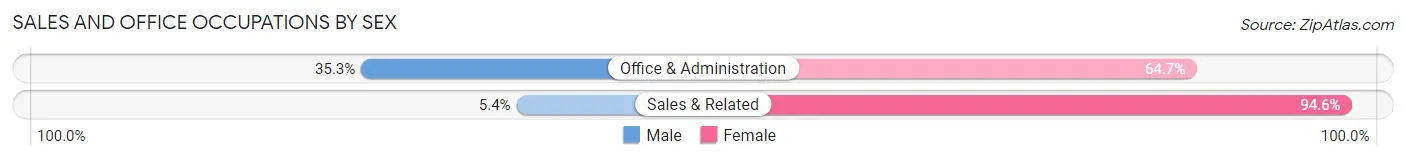
| Occupation | Male | Female |
| Sales & Related | 2 (5.4%) | 35 (94.6%) |
| Office & Administration | 12 (35.3%) | 22 (64.7%) |
| Total (Category) | 14 (19.7%) | 57 (80.3%) |
| Total (Overall) | 134 (42.9%) | 178 (57.1%) |
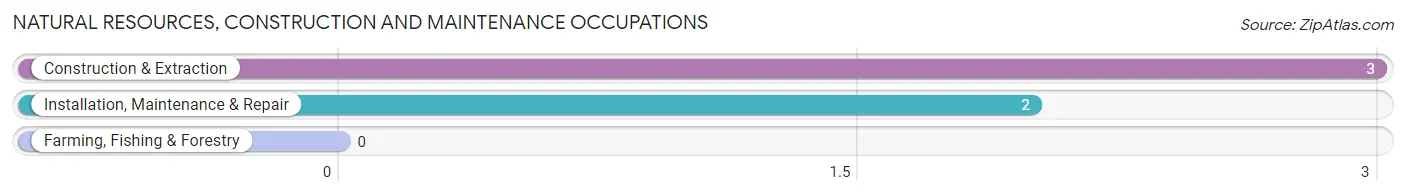
Natural Resources, Construction and Maintenance Occupations
The most common Natural Resources, Construction and Maintenance occupations in Wessington Springs are Construction & Extraction (3 | 1.0%), and Installation, Maintenance & Repair (2 | 0.6%).
Natural Resources, Construction and Maintenance Occupations by Sex
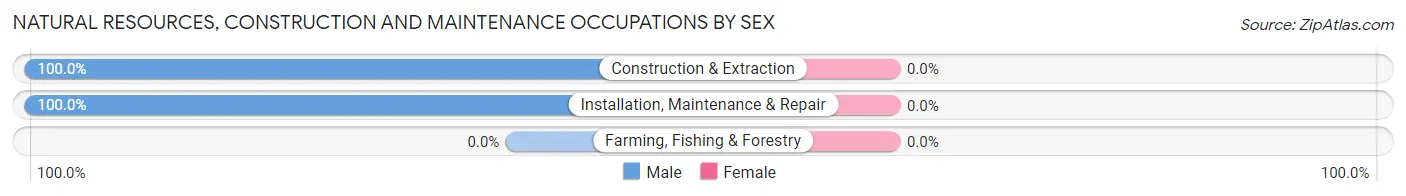
| Occupation | Male | Female |
| Farming, Fishing & Forestry | 0 (0.0%) | 0 (0.0%) |
| Construction & Extraction | 3 (100.0%) | 0 (0.0%) |
| Installation, Maintenance & Repair | 2 (100.0%) | 0 (0.0%) |
| Total (Category) | 5 (100.0%) | 0 (0.0%) |
| Total (Overall) | 134 (42.9%) | 178 (57.1%) |
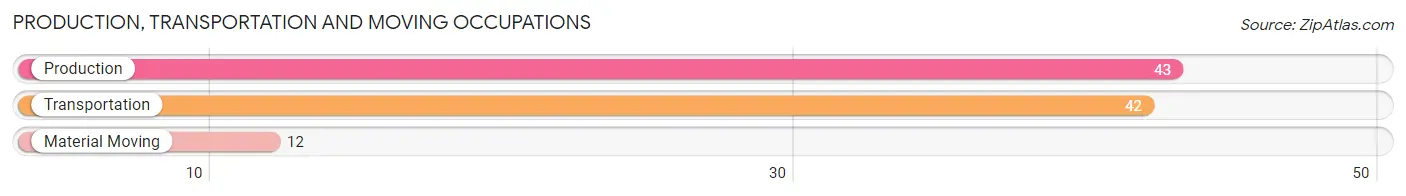
Production, Transportation and Moving Occupations
The most common Production, Transportation and Moving occupations in Wessington Springs are Production (43 | 13.8%), Transportation (42 | 13.5%), and Material Moving (12 | 3.8%).
Production, Transportation and Moving Occupations by Sex
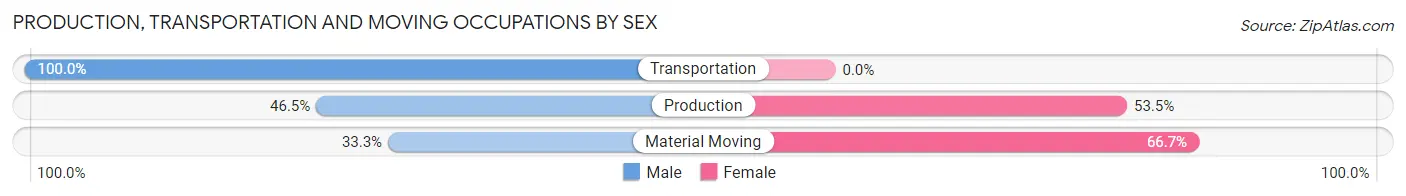
| Occupation | Male | Female |
| Production | 20 (46.5%) | 23 (53.5%) |
| Transportation | 42 (100.0%) | 0 (0.0%) |
| Material Moving | 4 (33.3%) | 8 (66.7%) |
| Total (Category) | 66 (68.0%) | 31 (32.0%) |
| Total (Overall) | 134 (42.9%) | 178 (57.1%) |
Employment Industries by Sex in Wessington Springs
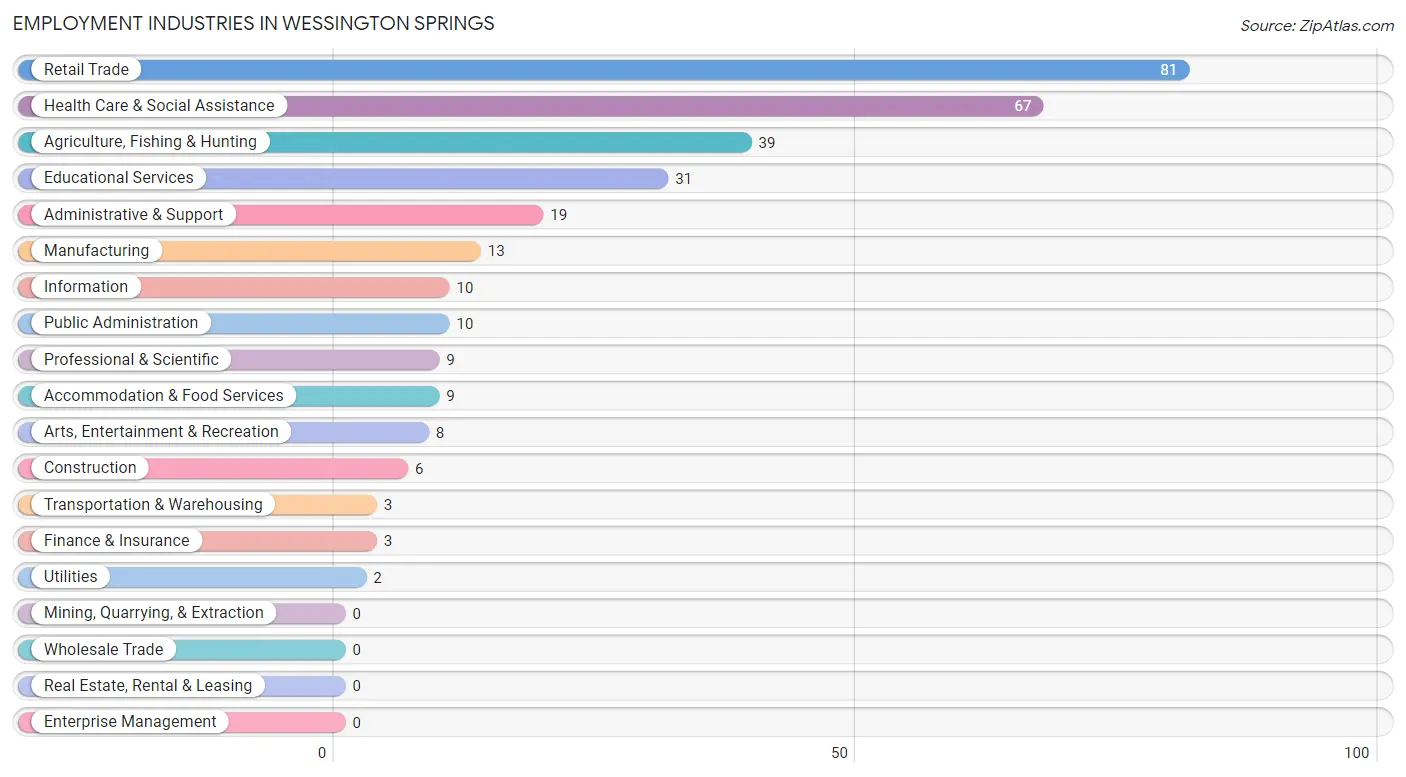
Employment Industries in Wessington Springs
The major employment industries in Wessington Springs include Retail Trade (81 | 26.0%), Health Care & Social Assistance (67 | 21.5%), Agriculture, Fishing & Hunting (39 | 12.5%), Educational Services (31 | 9.9%), and Administrative & Support (19 | 6.1%).
Employment Industries by Sex in Wessington Springs
The Wessington Springs industries that see more men than women are Transportation & Warehousing (100.0%), Utilities (100.0%), and Finance & Insurance (100.0%), whereas the industries that tend to have a higher number of women are Information (100.0%), Health Care & Social Assistance (100.0%), and Accommodation & Food Services (100.0%).
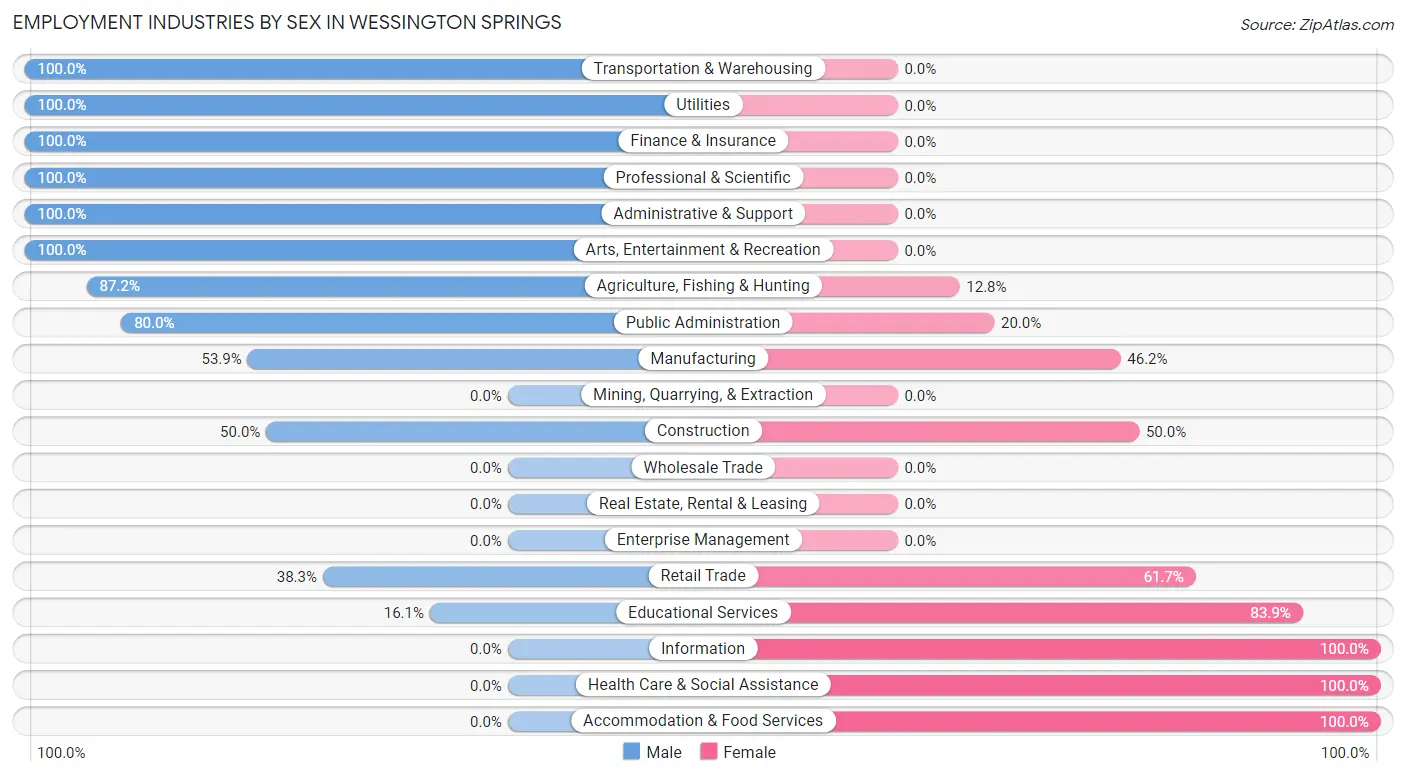
| Industry | Male | Female |
| Agriculture, Fishing & Hunting | 34 (87.2%) | 5 (12.8%) |
| Mining, Quarrying, & Extraction | 0 (0.0%) | 0 (0.0%) |
| Construction | 3 (50.0%) | 3 (50.0%) |
| Manufacturing | 7 (53.8%) | 6 (46.2%) |
| Wholesale Trade | 0 (0.0%) | 0 (0.0%) |
| Retail Trade | 31 (38.3%) | 50 (61.7%) |
| Transportation & Warehousing | 3 (100.0%) | 0 (0.0%) |
| Utilities | 2 (100.0%) | 0 (0.0%) |
| Information | 0 (0.0%) | 10 (100.0%) |
| Finance & Insurance | 3 (100.0%) | 0 (0.0%) |
| Real Estate, Rental & Leasing | 0 (0.0%) | 0 (0.0%) |
| Professional & Scientific | 9 (100.0%) | 0 (0.0%) |
| Enterprise Management | 0 (0.0%) | 0 (0.0%) |
| Administrative & Support | 19 (100.0%) | 0 (0.0%) |
| Educational Services | 5 (16.1%) | 26 (83.9%) |
| Health Care & Social Assistance | 0 (0.0%) | 67 (100.0%) |
| Arts, Entertainment & Recreation | 8 (100.0%) | 0 (0.0%) |
| Accommodation & Food Services | 0 (0.0%) | 9 (100.0%) |
| Public Administration | 8 (80.0%) | 2 (20.0%) |
| Total | 134 (42.9%) | 178 (57.1%) |
Education in Wessington Springs
School Enrollment in Wessington Springs
The most common levels of schooling among the 79 students in Wessington Springs are middle school (37 | 46.8%), high school (21 | 26.6%), and college / undergraduate (8 | 10.1%).
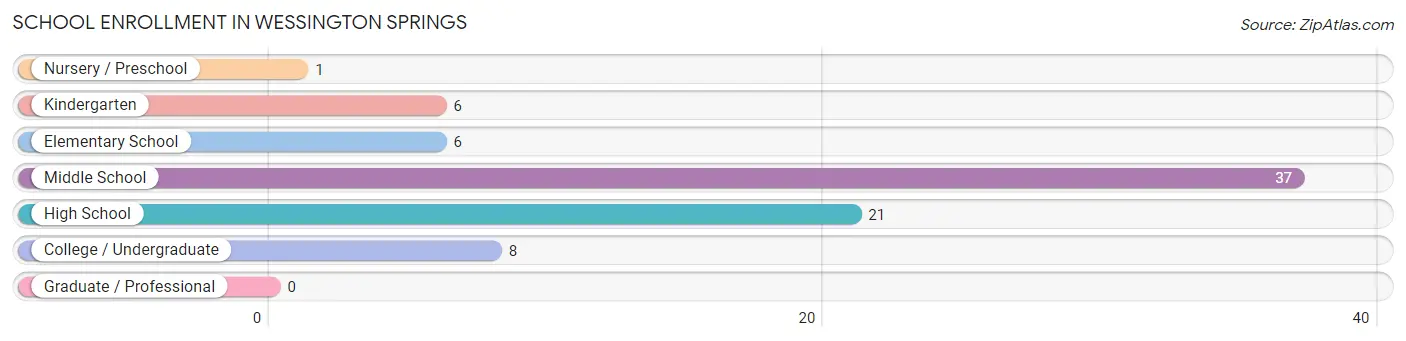
| School Level | # Students | % Students |
| Nursery / Preschool | 1 | 1.3% |
| Kindergarten | 6 | 7.6% |
| Elementary School | 6 | 7.6% |
| Middle School | 37 | 46.8% |
| High School | 21 | 26.6% |
| College / Undergraduate | 8 | 10.1% |
| Graduate / Professional | 0 | 0.0% |
| Total | 79 | 100.0% |
School Enrollment by Age by Funding Source in Wessington Springs
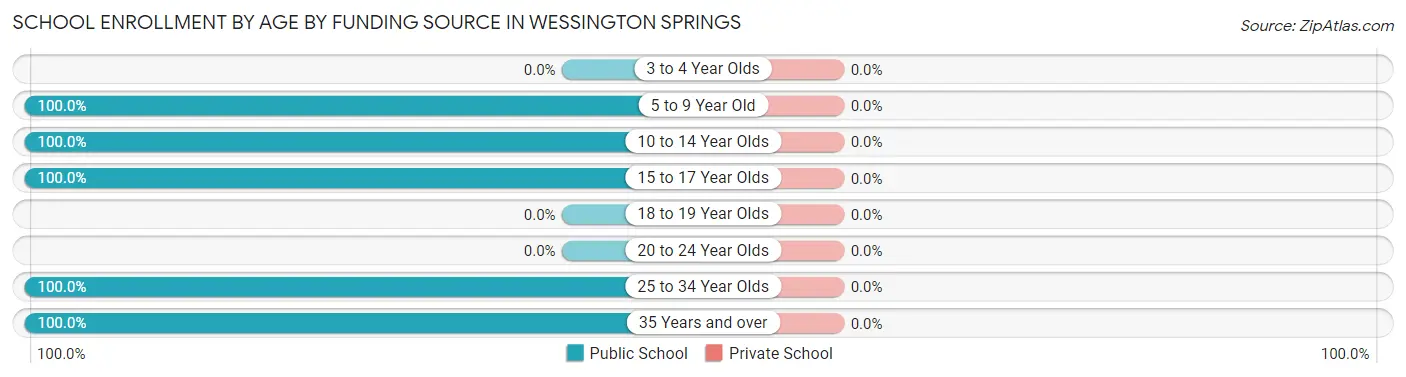
| Age Bracket | Public School | Private School |
| 3 to 4 Year Olds | 0 (0.0%) | 0 (0.0%) |
| 5 to 9 Year Old | 13 (100.0%) | 0 (0.0%) |
| 10 to 14 Year Olds | 39 (100.0%) | 0 (0.0%) |
| 15 to 17 Year Olds | 19 (100.0%) | 0 (0.0%) |
| 18 to 19 Year Olds | 0 (0.0%) | 0 (0.0%) |
| 20 to 24 Year Olds | 0 (0.0%) | 0 (0.0%) |
| 25 to 34 Year Olds | 7 (100.0%) | 0 (0.0%) |
| 35 Years and over | 1 (100.0%) | 0 (0.0%) |
| Total | 79 (100.0%) | 0 (0.0%) |
Educational Attainment by Field of Study in Wessington Springs
Education (35 | 41.2%), science & technology (15 | 17.6%), business (9 | 10.6%), literature & languages (9 | 10.6%), and arts & humanities (8 | 9.4%) are the most common fields of study among 85 individuals in Wessington Springs who have obtained a bachelor's degree or higher.
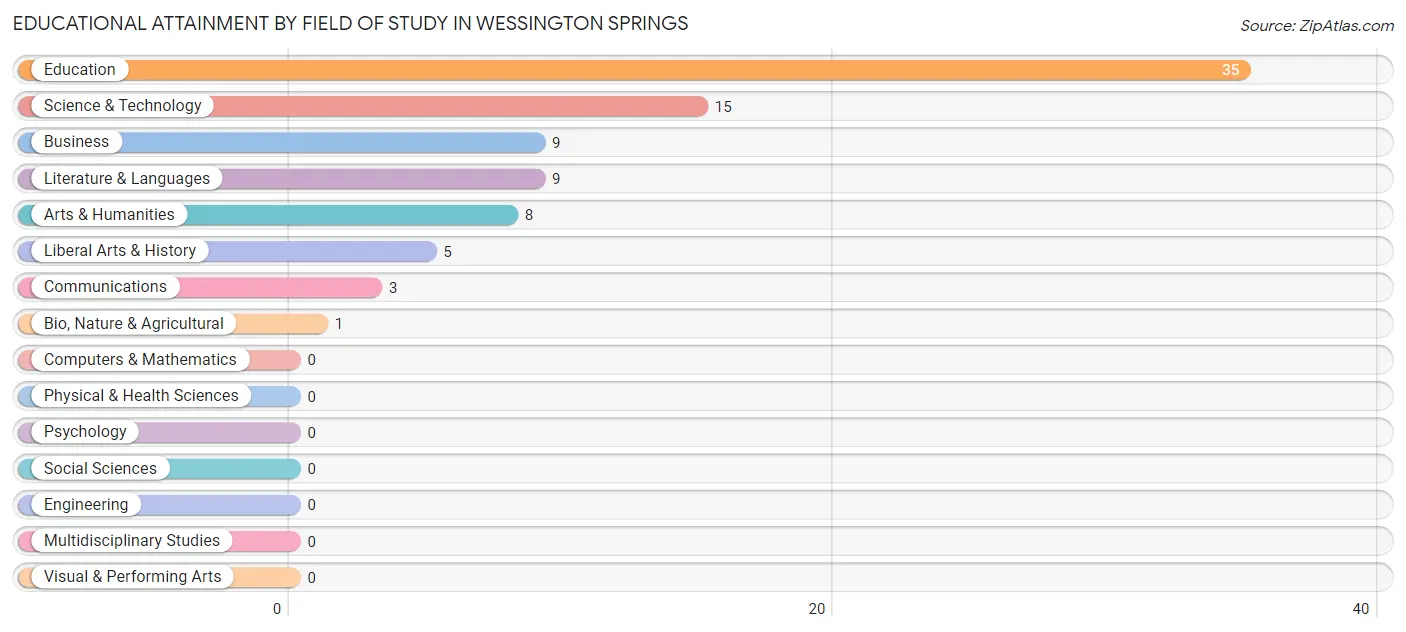
| Field of Study | # Graduates | % Graduates |
| Computers & Mathematics | 0 | 0.0% |
| Bio, Nature & Agricultural | 1 | 1.2% |
| Physical & Health Sciences | 0 | 0.0% |
| Psychology | 0 | 0.0% |
| Social Sciences | 0 | 0.0% |
| Engineering | 0 | 0.0% |
| Multidisciplinary Studies | 0 | 0.0% |
| Science & Technology | 15 | 17.6% |
| Business | 9 | 10.6% |
| Education | 35 | 41.2% |
| Literature & Languages | 9 | 10.6% |
| Liberal Arts & History | 5 | 5.9% |
| Visual & Performing Arts | 0 | 0.0% |
| Communications | 3 | 3.5% |
| Arts & Humanities | 8 | 9.4% |
| Total | 85 | 100.0% |
Transportation & Commute in Wessington Springs
Vehicle Availability by Sex in Wessington Springs
The most prevalent vehicle ownership categories in Wessington Springs are males with 2 vehicles (57, accounting for 42.5%) and females with 2 vehicles (74, making up 33.0%).
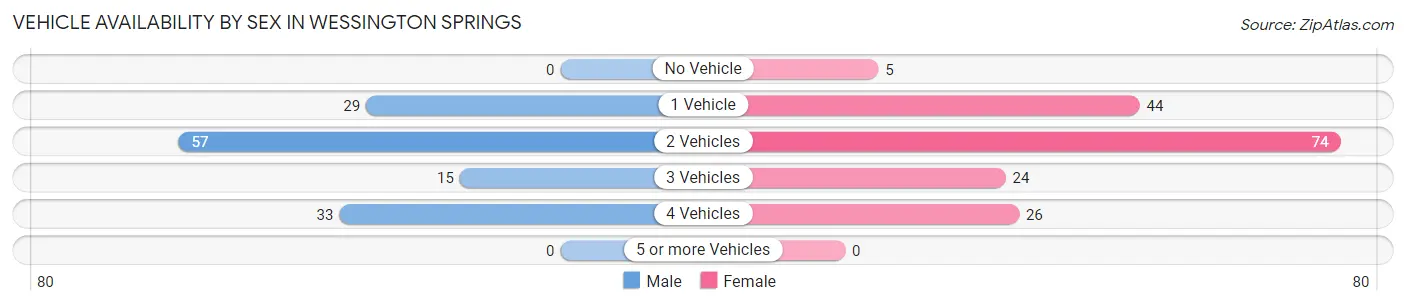
| Vehicles Available | Male | Female |
| No Vehicle | 0 (0.0%) | 5 (2.9%) |
| 1 Vehicle | 29 (21.6%) | 44 (25.4%) |
| 2 Vehicles | 57 (42.5%) | 74 (42.8%) |
| 3 Vehicles | 15 (11.2%) | 24 (13.9%) |
| 4 Vehicles | 33 (24.6%) | 26 (15.0%) |
| 5 or more Vehicles | 0 (0.0%) | 0 (0.0%) |
| Total | 134 (100.0%) | 173 (100.0%) |
Commute Time in Wessington Springs
The most frequently occuring commute durations in Wessington Springs are 5 to 9 minutes (125 commuters, 47.5%), 15 to 19 minutes (35 commuters, 13.3%), and less than 5 minutes (34 commuters, 12.9%).
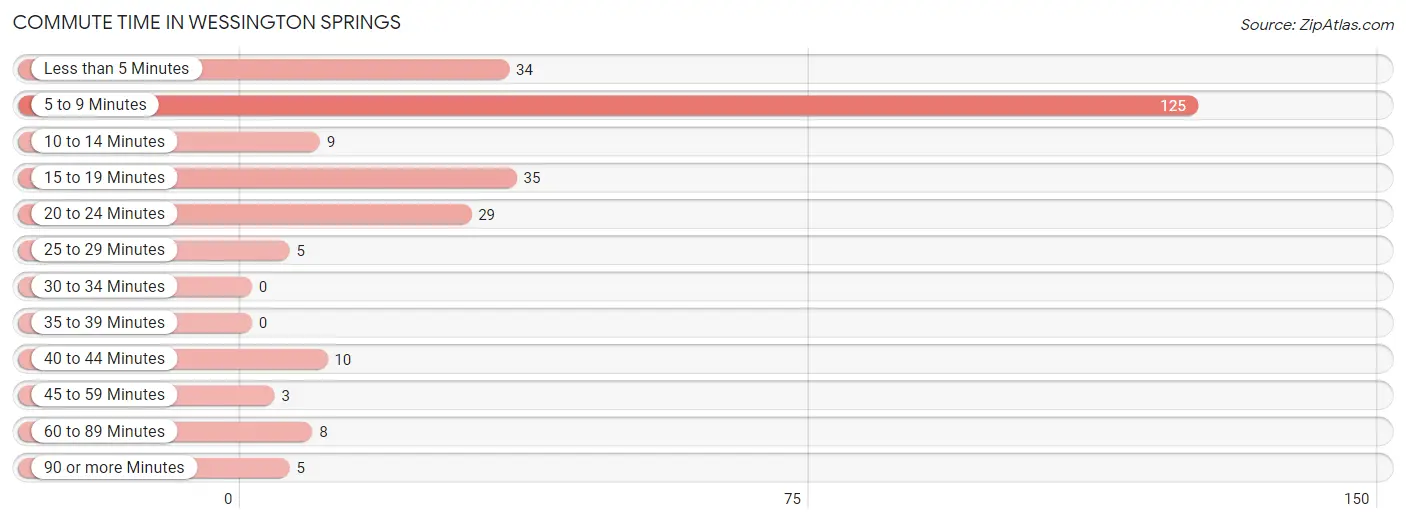
| Commute Time | # Commuters | % Commuters |
| Less than 5 Minutes | 34 | 12.9% |
| 5 to 9 Minutes | 125 | 47.5% |
| 10 to 14 Minutes | 9 | 3.4% |
| 15 to 19 Minutes | 35 | 13.3% |
| 20 to 24 Minutes | 29 | 11.0% |
| 25 to 29 Minutes | 5 | 1.9% |
| 30 to 34 Minutes | 0 | 0.0% |
| 35 to 39 Minutes | 0 | 0.0% |
| 40 to 44 Minutes | 10 | 3.8% |
| 45 to 59 Minutes | 3 | 1.1% |
| 60 to 89 Minutes | 8 | 3.0% |
| 90 or more Minutes | 5 | 1.9% |
Commute Time by Sex in Wessington Springs
The most common commute times in Wessington Springs are 5 to 9 minutes (59 commuters, 45.7%) for males and 5 to 9 minutes (66 commuters, 49.2%) for females.
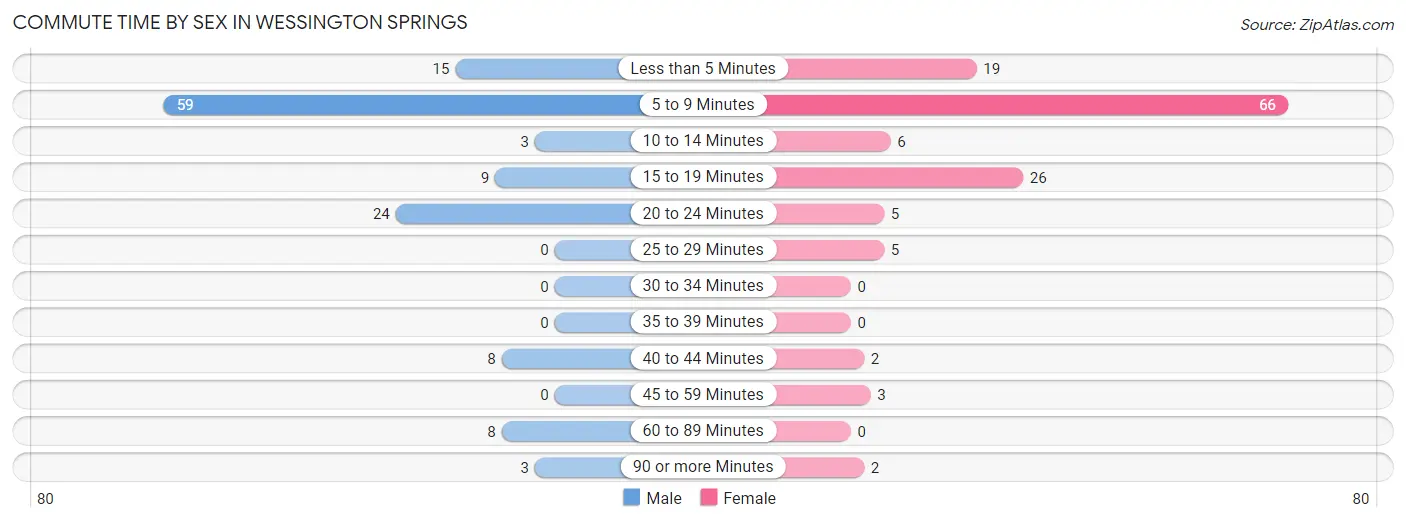
| Commute Time | Male | Female |
| Less than 5 Minutes | 15 (11.6%) | 19 (14.2%) |
| 5 to 9 Minutes | 59 (45.7%) | 66 (49.2%) |
| 10 to 14 Minutes | 3 (2.3%) | 6 (4.5%) |
| 15 to 19 Minutes | 9 (7.0%) | 26 (19.4%) |
| 20 to 24 Minutes | 24 (18.6%) | 5 (3.7%) |
| 25 to 29 Minutes | 0 (0.0%) | 5 (3.7%) |
| 30 to 34 Minutes | 0 (0.0%) | 0 (0.0%) |
| 35 to 39 Minutes | 0 (0.0%) | 0 (0.0%) |
| 40 to 44 Minutes | 8 (6.2%) | 2 (1.5%) |
| 45 to 59 Minutes | 0 (0.0%) | 3 (2.2%) |
| 60 to 89 Minutes | 8 (6.2%) | 0 (0.0%) |
| 90 or more Minutes | 3 (2.3%) | 2 (1.5%) |
Time of Departure to Work by Sex in Wessington Springs
The most frequent times of departure to work in Wessington Springs are 7:00 AM to 7:29 AM (39, 30.2%) for males and 7:30 AM to 7:59 AM (46, 34.3%) for females.
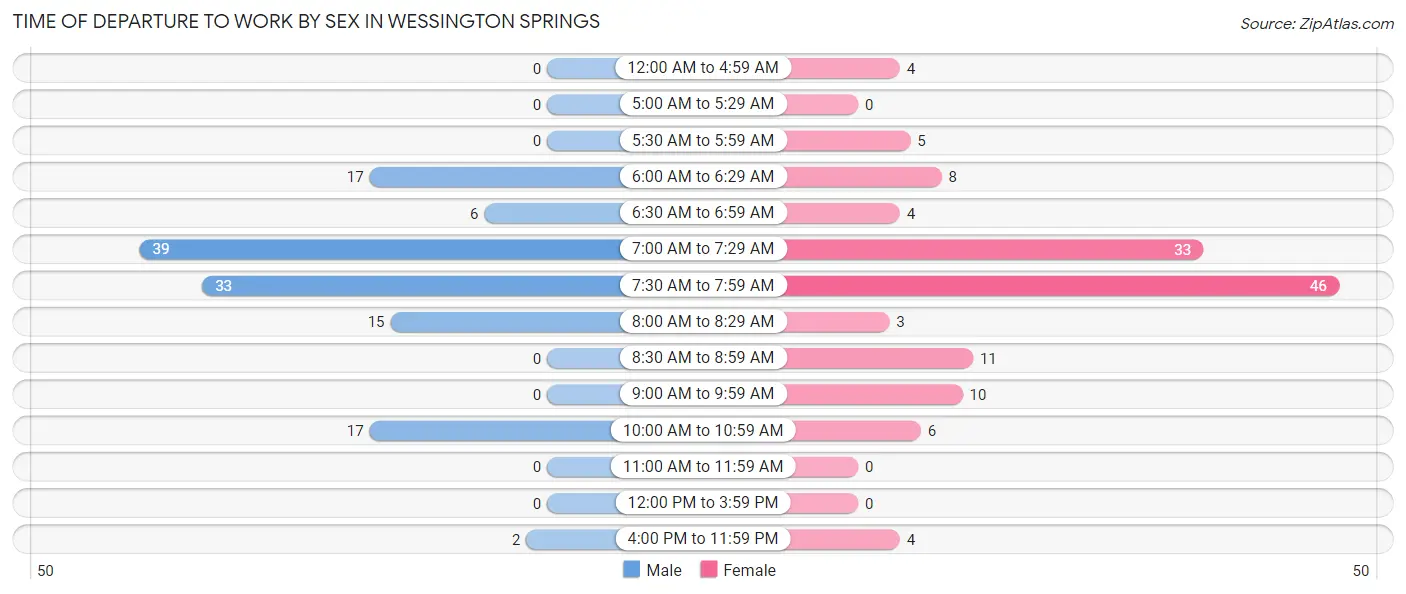
| Time of Departure | Male | Female |
| 12:00 AM to 4:59 AM | 0 (0.0%) | 4 (3.0%) |
| 5:00 AM to 5:29 AM | 0 (0.0%) | 0 (0.0%) |
| 5:30 AM to 5:59 AM | 0 (0.0%) | 5 (3.7%) |
| 6:00 AM to 6:29 AM | 17 (13.2%) | 8 (6.0%) |
| 6:30 AM to 6:59 AM | 6 (4.6%) | 4 (3.0%) |
| 7:00 AM to 7:29 AM | 39 (30.2%) | 33 (24.6%) |
| 7:30 AM to 7:59 AM | 33 (25.6%) | 46 (34.3%) |
| 8:00 AM to 8:29 AM | 15 (11.6%) | 3 (2.2%) |
| 8:30 AM to 8:59 AM | 0 (0.0%) | 11 (8.2%) |
| 9:00 AM to 9:59 AM | 0 (0.0%) | 10 (7.5%) |
| 10:00 AM to 10:59 AM | 17 (13.2%) | 6 (4.5%) |
| 11:00 AM to 11:59 AM | 0 (0.0%) | 0 (0.0%) |
| 12:00 PM to 3:59 PM | 0 (0.0%) | 0 (0.0%) |
| 4:00 PM to 11:59 PM | 2 (1.5%) | 4 (3.0%) |
| Total | 129 (100.0%) | 134 (100.0%) |
Housing Occupancy in Wessington Springs
Occupancy by Ownership in Wessington Springs
Of the total 348 dwellings in Wessington Springs, owner-occupied units account for 276 (79.3%), while renter-occupied units make up 72 (20.7%).
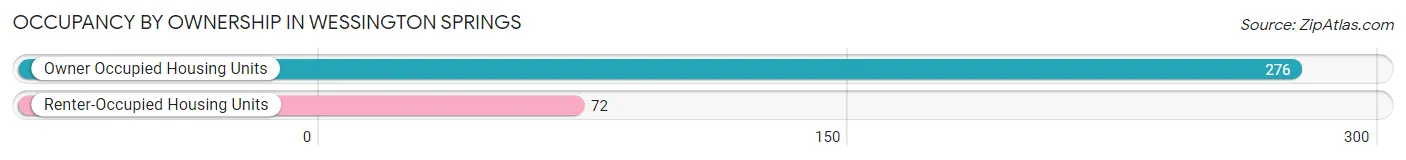
| Occupancy | # Housing Units | % Housing Units |
| Owner Occupied Housing Units | 276 | 79.3% |
| Renter-Occupied Housing Units | 72 | 20.7% |
| Total Occupied Housing Units | 348 | 100.0% |
Occupancy by Household Size in Wessington Springs
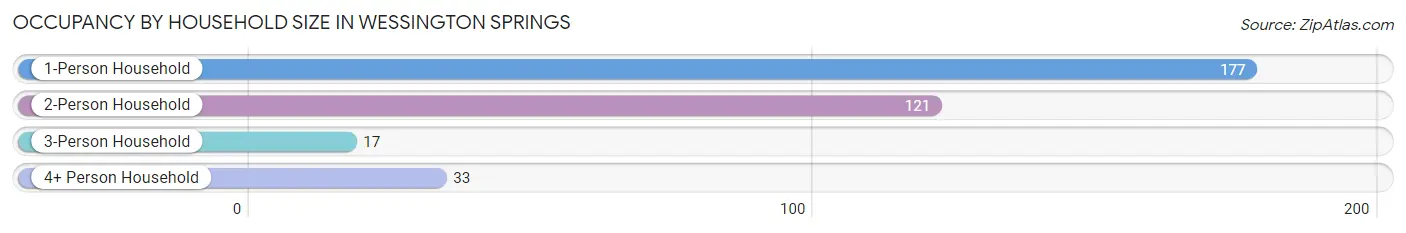
| Household Size | # Housing Units | % Housing Units |
| 1-Person Household | 177 | 50.9% |
| 2-Person Household | 121 | 34.8% |
| 3-Person Household | 17 | 4.9% |
| 4+ Person Household | 33 | 9.5% |
| Total Housing Units | 348 | 100.0% |
Occupancy by Ownership by Household Size in Wessington Springs
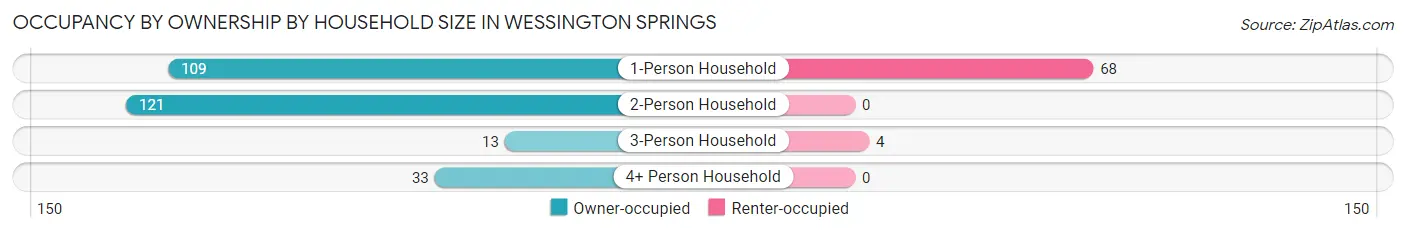
| Household Size | Owner-occupied | Renter-occupied |
| 1-Person Household | 109 (61.6%) | 68 (38.4%) |
| 2-Person Household | 121 (100.0%) | 0 (0.0%) |
| 3-Person Household | 13 (76.5%) | 4 (23.5%) |
| 4+ Person Household | 33 (100.0%) | 0 (0.0%) |
| Total Housing Units | 276 (79.3%) | 72 (20.7%) |
Occupancy by Educational Attainment in Wessington Springs
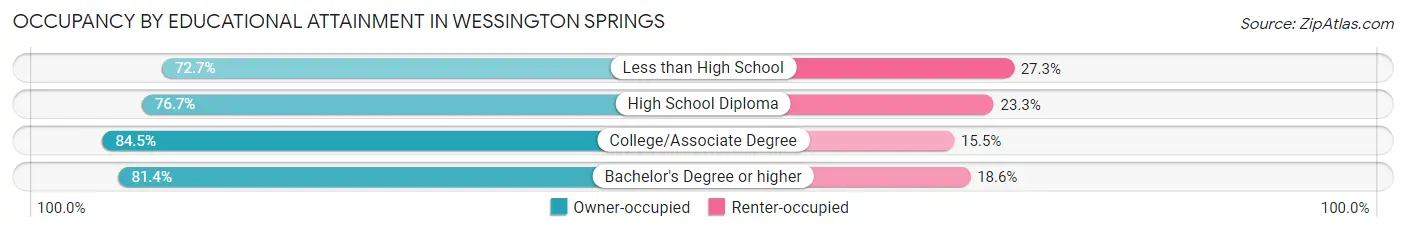
| Household Size | Owner-occupied | Renter-occupied |
| Less than High School | 24 (72.7%) | 9 (27.3%) |
| High School Diploma | 122 (76.7%) | 37 (23.3%) |
| College/Associate Degree | 82 (84.5%) | 15 (15.5%) |
| Bachelor's Degree or higher | 48 (81.4%) | 11 (18.6%) |
Occupancy by Age of Householder in Wessington Springs
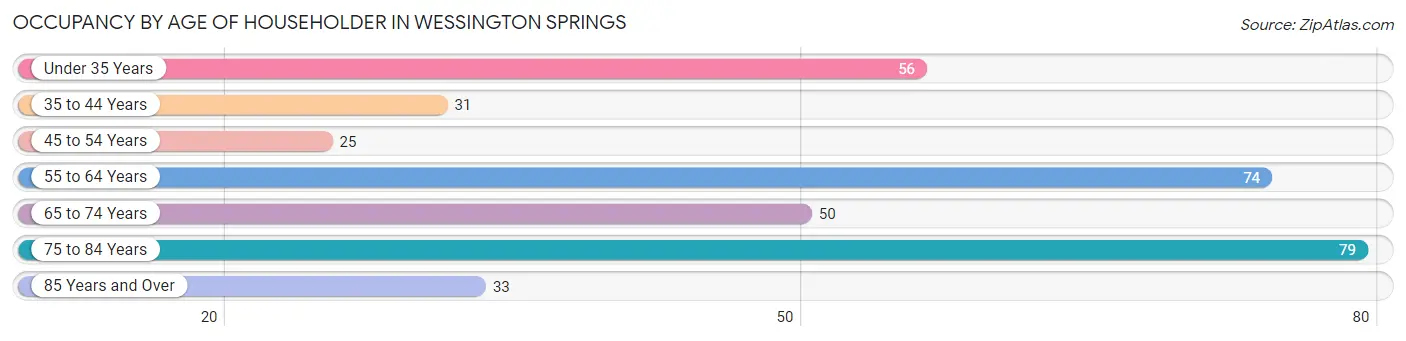
| Age Bracket | # Households | % Households |
| Under 35 Years | 56 | 16.1% |
| 35 to 44 Years | 31 | 8.9% |
| 45 to 54 Years | 25 | 7.2% |
| 55 to 64 Years | 74 | 21.3% |
| 65 to 74 Years | 50 | 14.4% |
| 75 to 84 Years | 79 | 22.7% |
| 85 Years and Over | 33 | 9.5% |
| Total | 348 | 100.0% |
Housing Finances in Wessington Springs
Median Income by Occupancy in Wessington Springs
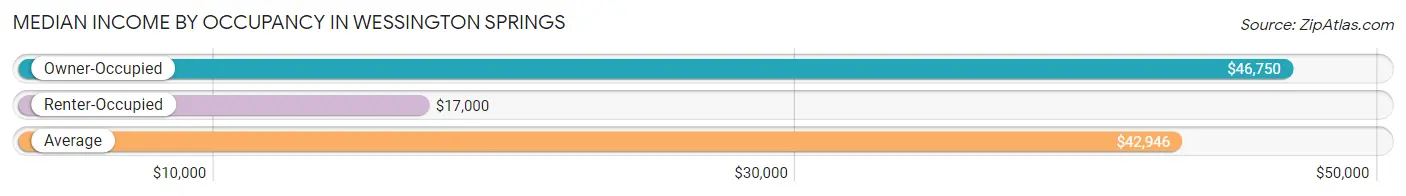
| Occupancy Type | # Households | Median Income |
| Owner-Occupied | 276 (79.3%) | $46,750 |
| Renter-Occupied | 72 (20.7%) | $17,000 |
| Average | 348 (100.0%) | $42,946 |
Occupancy by Householder Income Bracket in Wessington Springs
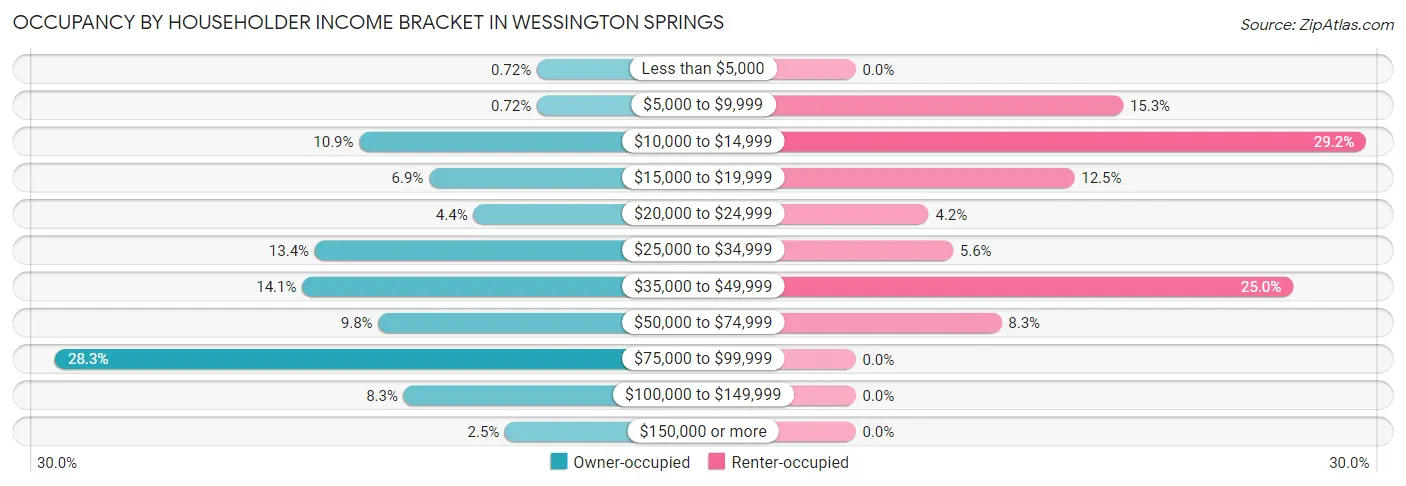
| Income Bracket | Owner-occupied | Renter-occupied |
| Less than $5,000 | 2 (0.7%) | 0 (0.0%) |
| $5,000 to $9,999 | 2 (0.7%) | 11 (15.3%) |
| $10,000 to $14,999 | 30 (10.9%) | 21 (29.2%) |
| $15,000 to $19,999 | 19 (6.9%) | 9 (12.5%) |
| $20,000 to $24,999 | 12 (4.3%) | 3 (4.2%) |
| $25,000 to $34,999 | 37 (13.4%) | 4 (5.6%) |
| $35,000 to $49,999 | 39 (14.1%) | 18 (25.0%) |
| $50,000 to $74,999 | 27 (9.8%) | 6 (8.3%) |
| $75,000 to $99,999 | 78 (28.3%) | 0 (0.0%) |
| $100,000 to $149,999 | 23 (8.3%) | 0 (0.0%) |
| $150,000 or more | 7 (2.5%) | 0 (0.0%) |
| Total | 276 (100.0%) | 72 (100.0%) |
Monthly Housing Cost Tiers in Wessington Springs
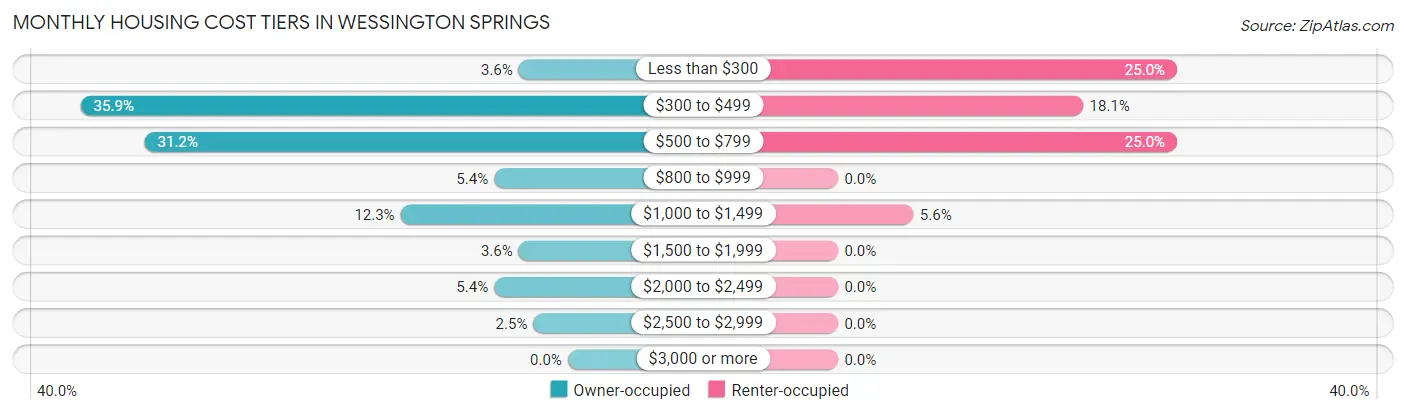
| Monthly Cost | Owner-occupied | Renter-occupied |
| Less than $300 | 10 (3.6%) | 18 (25.0%) |
| $300 to $499 | 99 (35.9%) | 13 (18.1%) |
| $500 to $799 | 86 (31.2%) | 18 (25.0%) |
| $800 to $999 | 15 (5.4%) | 0 (0.0%) |
| $1,000 to $1,499 | 34 (12.3%) | 4 (5.6%) |
| $1,500 to $1,999 | 10 (3.6%) | 0 (0.0%) |
| $2,000 to $2,499 | 15 (5.4%) | 0 (0.0%) |
| $2,500 to $2,999 | 7 (2.5%) | 0 (0.0%) |
| $3,000 or more | 0 (0.0%) | 0 (0.0%) |
| Total | 276 (100.0%) | 72 (100.0%) |
Physical Housing Characteristics in Wessington Springs
Housing Structures in Wessington Springs
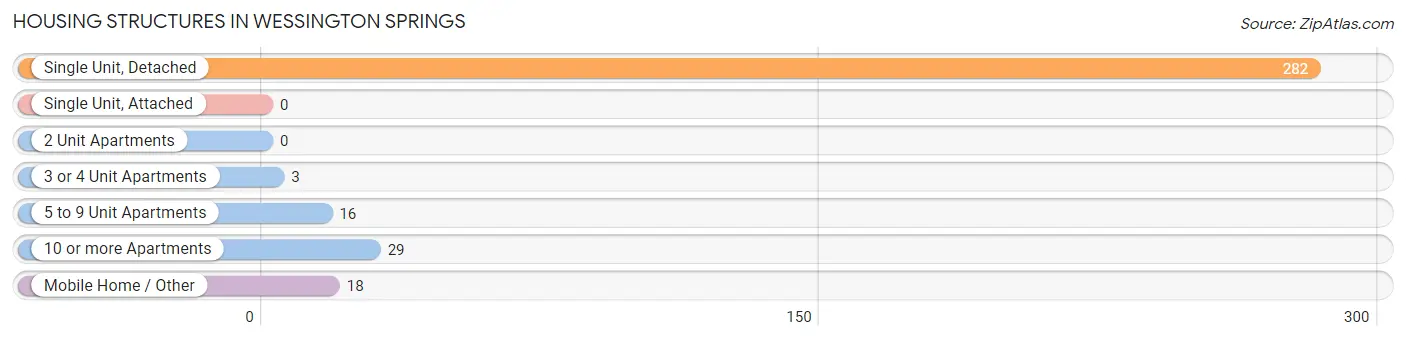
| Structure Type | # Housing Units | % Housing Units |
| Single Unit, Detached | 282 | 81.0% |
| Single Unit, Attached | 0 | 0.0% |
| 2 Unit Apartments | 0 | 0.0% |
| 3 or 4 Unit Apartments | 3 | 0.9% |
| 5 to 9 Unit Apartments | 16 | 4.6% |
| 10 or more Apartments | 29 | 8.3% |
| Mobile Home / Other | 18 | 5.2% |
| Total | 348 | 100.0% |
Housing Structures by Occupancy in Wessington Springs
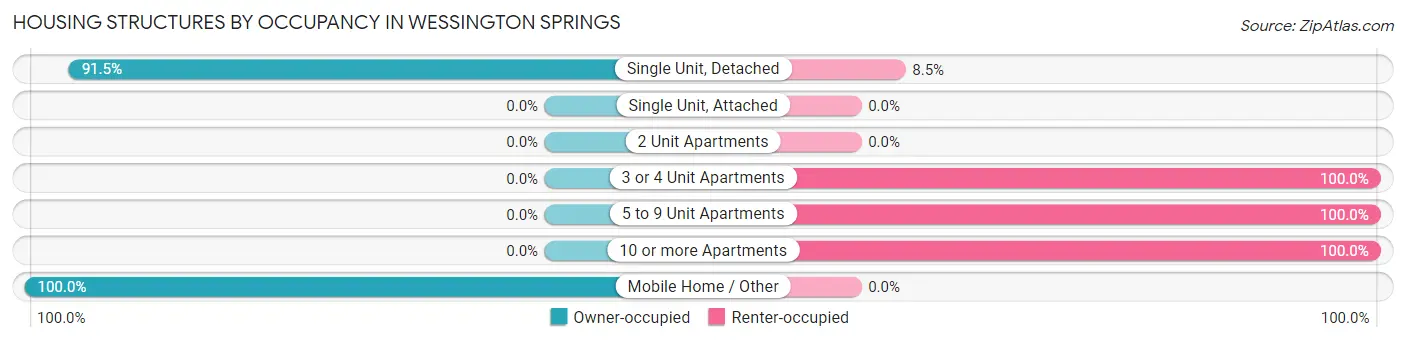
| Structure Type | Owner-occupied | Renter-occupied |
| Single Unit, Detached | 258 (91.5%) | 24 (8.5%) |
| Single Unit, Attached | 0 (0.0%) | 0 (0.0%) |
| 2 Unit Apartments | 0 (0.0%) | 0 (0.0%) |
| 3 or 4 Unit Apartments | 0 (0.0%) | 3 (100.0%) |
| 5 to 9 Unit Apartments | 0 (0.0%) | 16 (100.0%) |
| 10 or more Apartments | 0 (0.0%) | 29 (100.0%) |
| Mobile Home / Other | 18 (100.0%) | 0 (0.0%) |
| Total | 276 (79.3%) | 72 (20.7%) |
Housing Structures by Number of Rooms in Wessington Springs
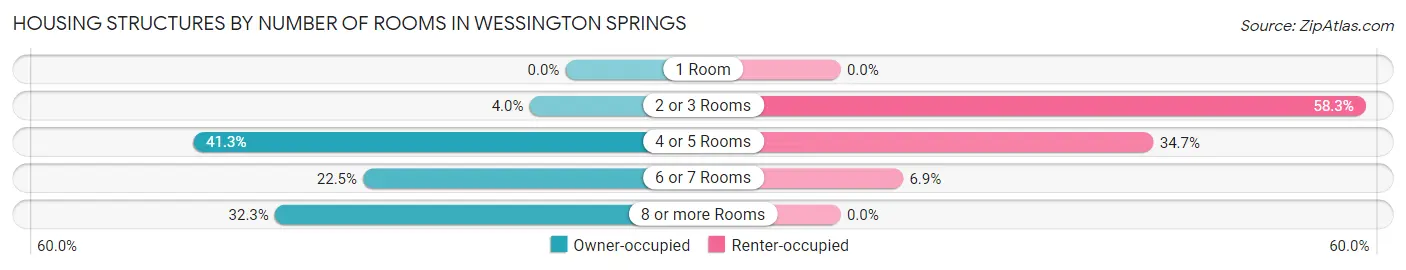
| Number of Rooms | Owner-occupied | Renter-occupied |
| 1 Room | 0 (0.0%) | 0 (0.0%) |
| 2 or 3 Rooms | 11 (4.0%) | 42 (58.3%) |
| 4 or 5 Rooms | 114 (41.3%) | 25 (34.7%) |
| 6 or 7 Rooms | 62 (22.5%) | 5 (6.9%) |
| 8 or more Rooms | 89 (32.3%) | 0 (0.0%) |
| Total | 276 (100.0%) | 72 (100.0%) |
Housing Structure by Heating Type in Wessington Springs
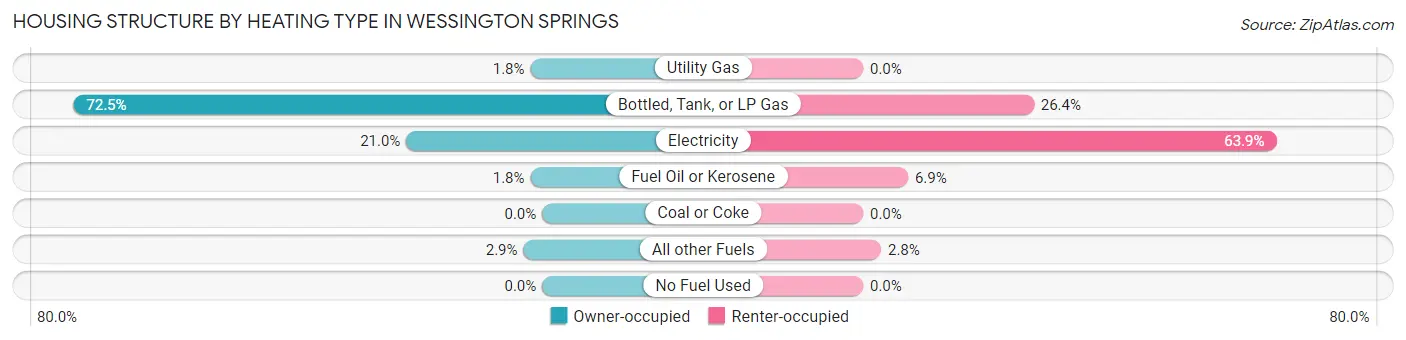
| Heating Type | Owner-occupied | Renter-occupied |
| Utility Gas | 5 (1.8%) | 0 (0.0%) |
| Bottled, Tank, or LP Gas | 200 (72.5%) | 19 (26.4%) |
| Electricity | 58 (21.0%) | 46 (63.9%) |
| Fuel Oil or Kerosene | 5 (1.8%) | 5 (6.9%) |
| Coal or Coke | 0 (0.0%) | 0 (0.0%) |
| All other Fuels | 8 (2.9%) | 2 (2.8%) |
| No Fuel Used | 0 (0.0%) | 0 (0.0%) |
| Total | 276 (100.0%) | 72 (100.0%) |
Household Vehicle Usage in Wessington Springs
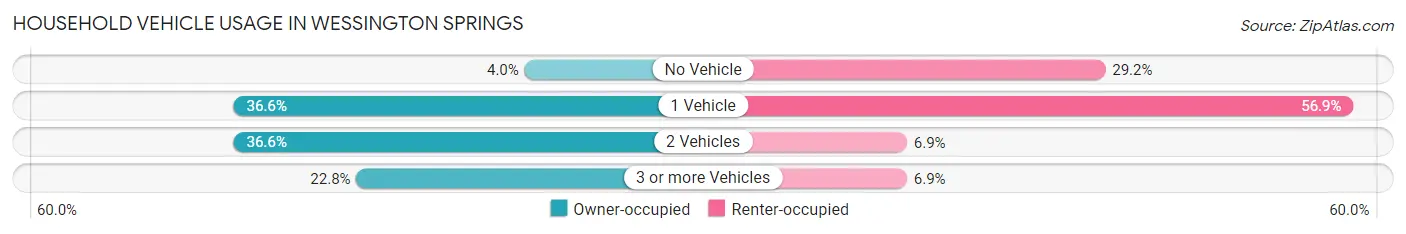
| Vehicles per Household | Owner-occupied | Renter-occupied |
| No Vehicle | 11 (4.0%) | 21 (29.2%) |
| 1 Vehicle | 101 (36.6%) | 41 (56.9%) |
| 2 Vehicles | 101 (36.6%) | 5 (6.9%) |
| 3 or more Vehicles | 63 (22.8%) | 5 (6.9%) |
| Total | 276 (100.0%) | 72 (100.0%) |
Real Estate & Mortgages in Wessington Springs
Real Estate and Mortgage Overview in Wessington Springs
| Characteristic | Without Mortgage | With Mortgage |
| Housing Units | 163 | 113 |
| Median Property Value | $82,300 | $125,900 |
| Median Household Income | $36,458 | $4 |
| Monthly Housing Costs | $474 | $0 |
| Real Estate Taxes | $882 | $0 |
Property Value by Mortgage Status in Wessington Springs
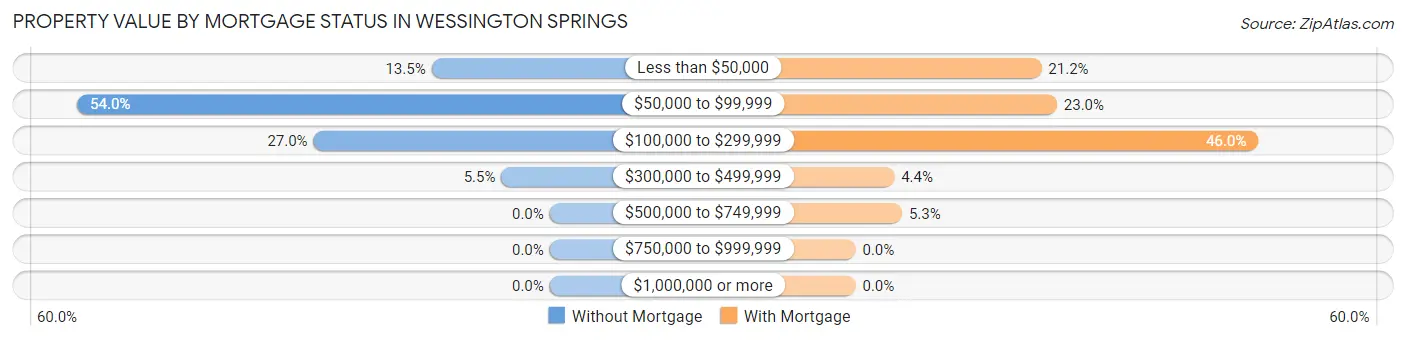
| Property Value | Without Mortgage | With Mortgage |
| Less than $50,000 | 22 (13.5%) | 24 (21.2%) |
| $50,000 to $99,999 | 88 (54.0%) | 26 (23.0%) |
| $100,000 to $299,999 | 44 (27.0%) | 52 (46.0%) |
| $300,000 to $499,999 | 9 (5.5%) | 5 (4.4%) |
| $500,000 to $749,999 | 0 (0.0%) | 6 (5.3%) |
| $750,000 to $999,999 | 0 (0.0%) | 0 (0.0%) |
| $1,000,000 or more | 0 (0.0%) | 0 (0.0%) |
| Total | 163 (100.0%) | 113 (100.0%) |
Household Income by Mortgage Status in Wessington Springs
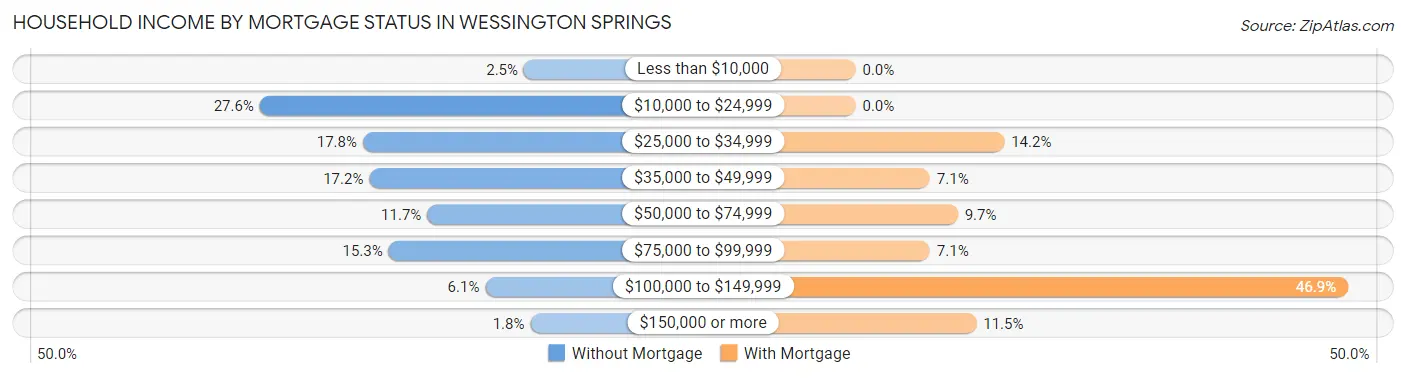
| Household Income | Without Mortgage | With Mortgage |
| Less than $10,000 | 4 (2.5%) | 0 (0.0%) |
| $10,000 to $24,999 | 45 (27.6%) | 0 (0.0%) |
| $25,000 to $34,999 | 29 (17.8%) | 16 (14.2%) |
| $35,000 to $49,999 | 28 (17.2%) | 8 (7.1%) |
| $50,000 to $74,999 | 19 (11.7%) | 11 (9.7%) |
| $75,000 to $99,999 | 25 (15.3%) | 8 (7.1%) |
| $100,000 to $149,999 | 10 (6.1%) | 53 (46.9%) |
| $150,000 or more | 3 (1.8%) | 13 (11.5%) |
| Total | 163 (100.0%) | 113 (100.0%) |
Property Value to Household Income Ratio in Wessington Springs
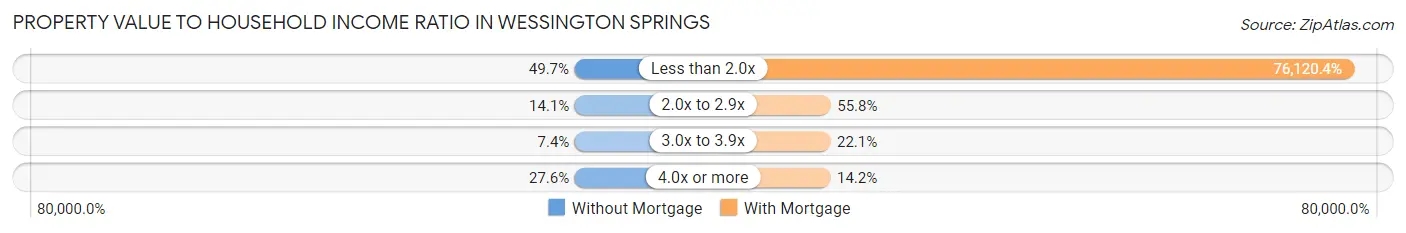
| Value-to-Income Ratio | Without Mortgage | With Mortgage |
| Less than 2.0x | 81 (49.7%) | 86,016 (76,120.3%) |
| 2.0x to 2.9x | 23 (14.1%) | 63 (55.7%) |
| 3.0x to 3.9x | 12 (7.4%) | 25 (22.1%) |
| 4.0x or more | 45 (27.6%) | 16 (14.2%) |
| Total | 163 (100.0%) | 113 (100.0%) |
Real Estate Taxes by Mortgage Status in Wessington Springs
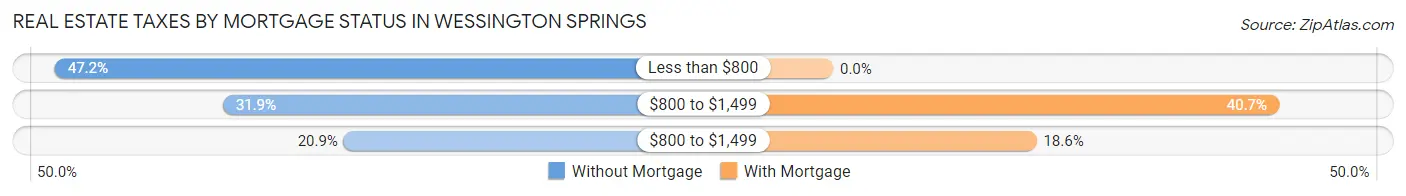
| Property Taxes | Without Mortgage | With Mortgage |
| Less than $800 | 77 (47.2%) | 0 (0.0%) |
| $800 to $1,499 | 52 (31.9%) | 46 (40.7%) |
| $800 to $1,499 | 34 (20.9%) | 21 (18.6%) |
| Total | 163 (100.0%) | 113 (100.0%) |
Health & Disability in Wessington Springs
Health Insurance Coverage by Age in Wessington Springs
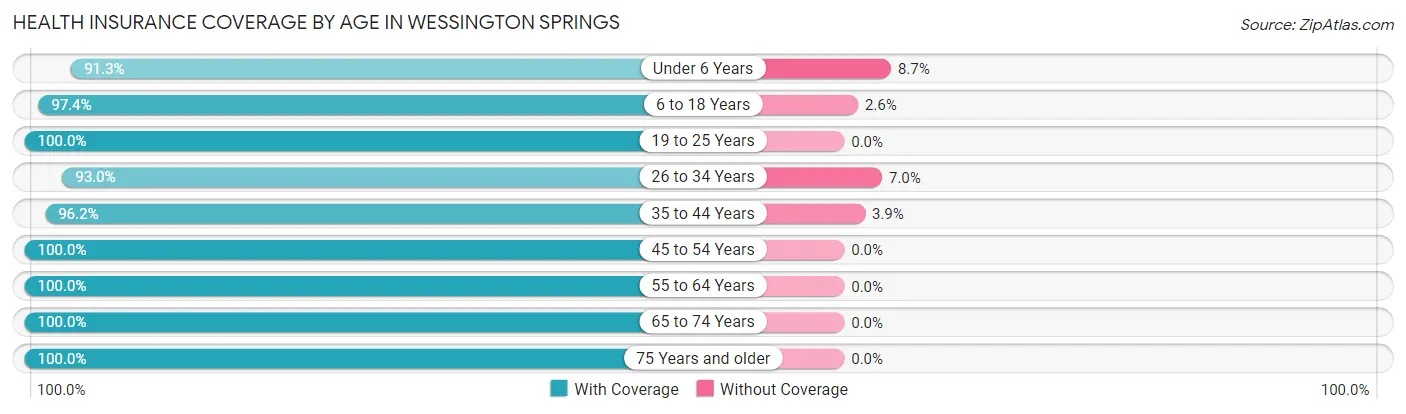
| Age Bracket | With Coverage | Without Coverage |
| Under 6 Years | 21 (91.3%) | 2 (8.7%) |
| 6 to 18 Years | 76 (97.4%) | 2 (2.6%) |
| 19 to 25 Years | 8 (100.0%) | 0 (0.0%) |
| 26 to 34 Years | 66 (93.0%) | 5 (7.0%) |
| 35 to 44 Years | 50 (96.2%) | 2 (3.8%) |
| 45 to 54 Years | 31 (100.0%) | 0 (0.0%) |
| 55 to 64 Years | 107 (100.0%) | 0 (0.0%) |
| 65 to 74 Years | 119 (100.0%) | 0 (0.0%) |
| 75 Years and older | 124 (100.0%) | 0 (0.0%) |
| Total | 602 (98.2%) | 11 (1.8%) |
Health Insurance Coverage by Citizenship Status in Wessington Springs
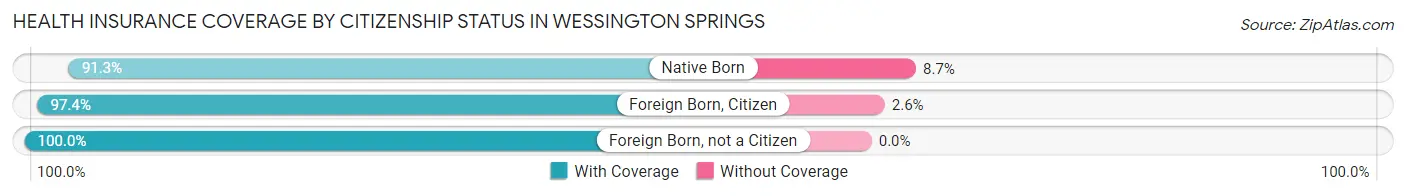
| Citizenship Status | With Coverage | Without Coverage |
| Native Born | 21 (91.3%) | 2 (8.7%) |
| Foreign Born, Citizen | 76 (97.4%) | 2 (2.6%) |
| Foreign Born, not a Citizen | 8 (100.0%) | 0 (0.0%) |
Health Insurance Coverage by Household Income in Wessington Springs
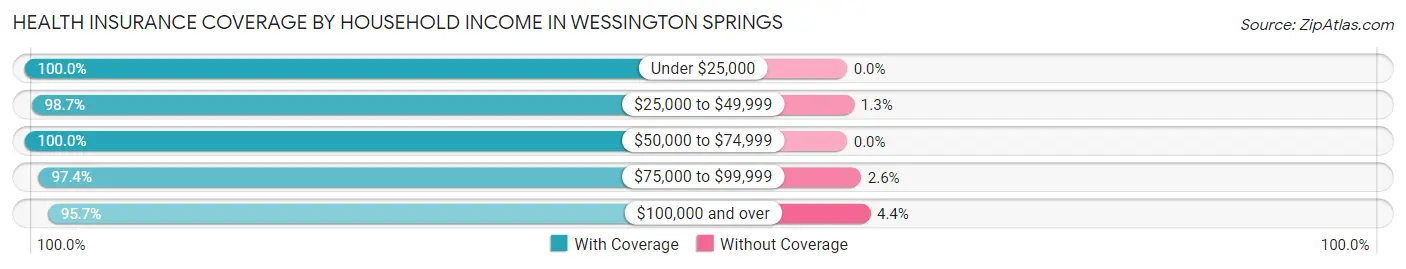
| Household Income | With Coverage | Without Coverage |
| Under $25,000 | 114 (100.0%) | 0 (0.0%) |
| $25,000 to $49,999 | 148 (98.7%) | 2 (1.3%) |
| $50,000 to $74,999 | 67 (100.0%) | 0 (0.0%) |
| $75,000 to $99,999 | 185 (97.4%) | 5 (2.6%) |
| $100,000 and over | 88 (95.7%) | 4 (4.3%) |
Public vs Private Health Insurance Coverage by Age in Wessington Springs
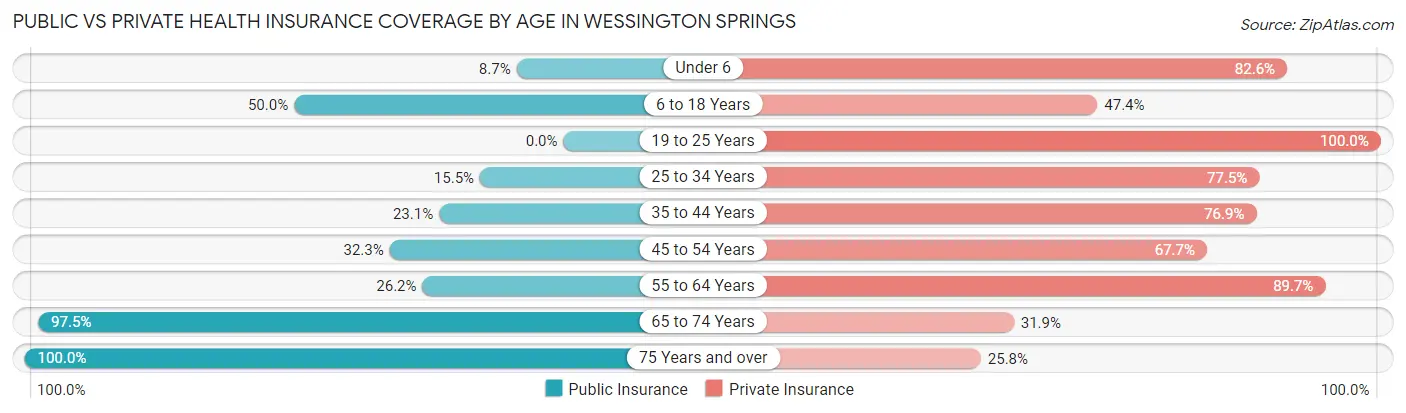
| Age Bracket | Public Insurance | Private Insurance |
| Under 6 | 2 (8.7%) | 19 (82.6%) |
| 6 to 18 Years | 39 (50.0%) | 37 (47.4%) |
| 19 to 25 Years | 0 (0.0%) | 8 (100.0%) |
| 25 to 34 Years | 11 (15.5%) | 55 (77.5%) |
| 35 to 44 Years | 12 (23.1%) | 40 (76.9%) |
| 45 to 54 Years | 10 (32.3%) | 21 (67.7%) |
| 55 to 64 Years | 28 (26.2%) | 96 (89.7%) |
| 65 to 74 Years | 116 (97.5%) | 38 (31.9%) |
| 75 Years and over | 124 (100.0%) | 32 (25.8%) |
| Total | 342 (55.8%) | 346 (56.4%) |
Disability Status by Sex by Age in Wessington Springs
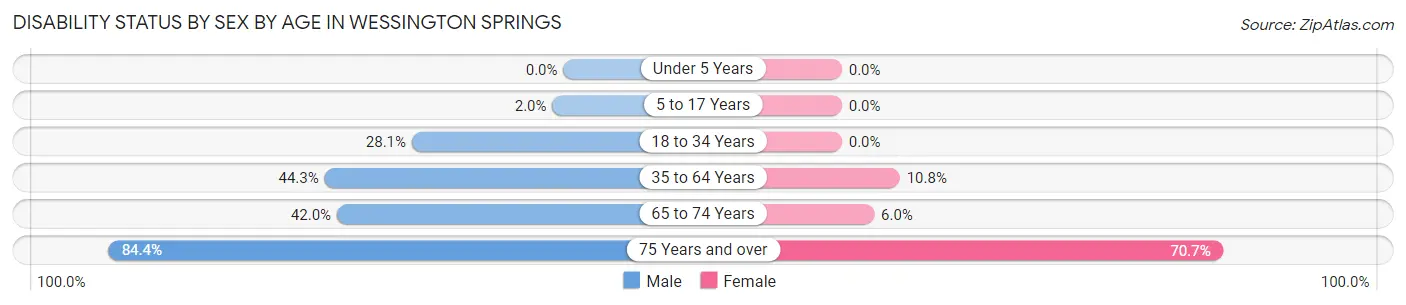
| Age Bracket | Male | Female |
| Under 5 Years | 0 (0.0%) | 0 (0.0%) |
| 5 to 17 Years | 1 (2.0%) | 0 (0.0%) |
| 18 to 34 Years | 9 (28.1%) | 0 (0.0%) |
| 35 to 64 Years | 43 (44.3%) | 10 (10.7%) |
| 65 to 74 Years | 29 (42.0%) | 3 (6.0%) |
| 75 Years and over | 27 (84.4%) | 65 (70.7%) |
Disability Class by Sex by Age in Wessington Springs
Disability Class: Hearing Difficulty
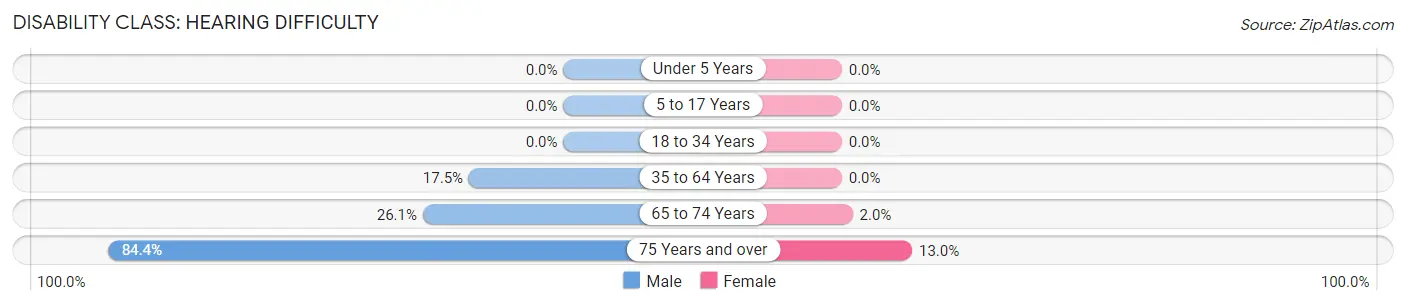
| Age Bracket | Male | Female |
| Under 5 Years | 0 (0.0%) | 0 (0.0%) |
| 5 to 17 Years | 0 (0.0%) | 0 (0.0%) |
| 18 to 34 Years | 0 (0.0%) | 0 (0.0%) |
| 35 to 64 Years | 17 (17.5%) | 0 (0.0%) |
| 65 to 74 Years | 18 (26.1%) | 1 (2.0%) |
| 75 Years and over | 27 (84.4%) | 12 (13.0%) |
Disability Class: Vision Difficulty
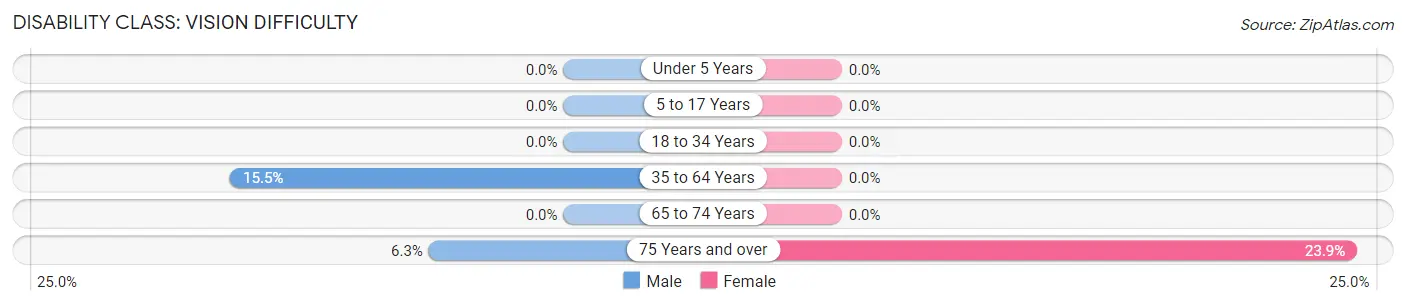
| Age Bracket | Male | Female |
| Under 5 Years | 0 (0.0%) | 0 (0.0%) |
| 5 to 17 Years | 0 (0.0%) | 0 (0.0%) |
| 18 to 34 Years | 0 (0.0%) | 0 (0.0%) |
| 35 to 64 Years | 15 (15.5%) | 0 (0.0%) |
| 65 to 74 Years | 0 (0.0%) | 0 (0.0%) |
| 75 Years and over | 2 (6.2%) | 22 (23.9%) |
Disability Class: Cognitive Difficulty
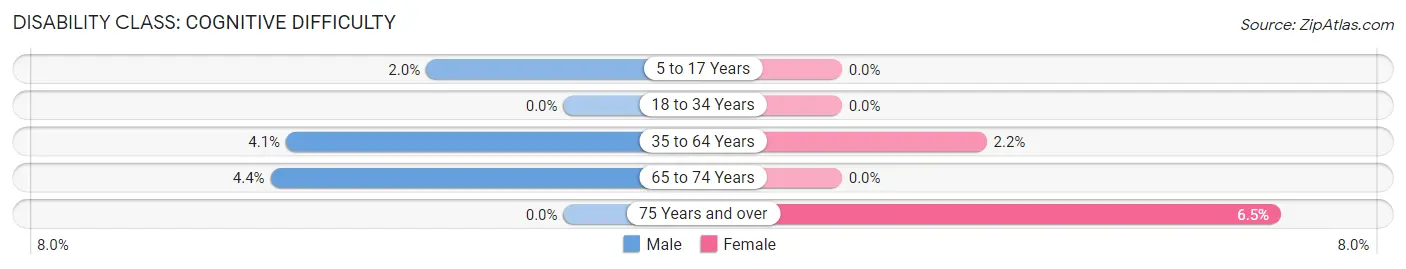
| Age Bracket | Male | Female |
| 5 to 17 Years | 1 (2.0%) | 0 (0.0%) |
| 18 to 34 Years | 0 (0.0%) | 0 (0.0%) |
| 35 to 64 Years | 4 (4.1%) | 2 (2.1%) |
| 65 to 74 Years | 3 (4.3%) | 0 (0.0%) |
| 75 Years and over | 0 (0.0%) | 6 (6.5%) |
Disability Class: Ambulatory Difficulty
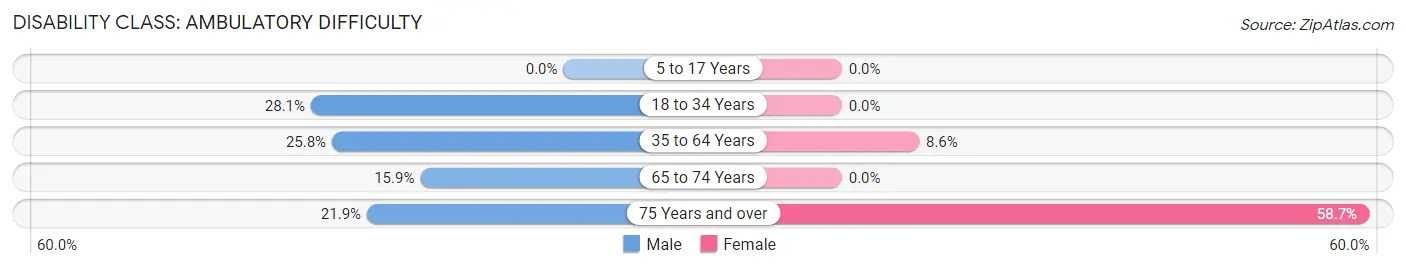
| Age Bracket | Male | Female |
| 5 to 17 Years | 0 (0.0%) | 0 (0.0%) |
| 18 to 34 Years | 9 (28.1%) | 0 (0.0%) |
| 35 to 64 Years | 25 (25.8%) | 8 (8.6%) |
| 65 to 74 Years | 11 (15.9%) | 0 (0.0%) |
| 75 Years and over | 7 (21.9%) | 54 (58.7%) |
Disability Class: Self-Care Difficulty
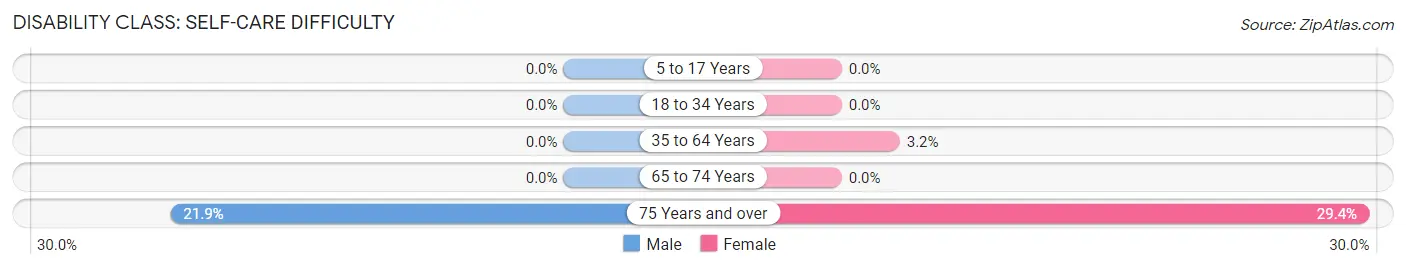
| Age Bracket | Male | Female |
| 5 to 17 Years | 0 (0.0%) | 0 (0.0%) |
| 18 to 34 Years | 0 (0.0%) | 0 (0.0%) |
| 35 to 64 Years | 0 (0.0%) | 3 (3.2%) |
| 65 to 74 Years | 0 (0.0%) | 0 (0.0%) |
| 75 Years and over | 7 (21.9%) | 27 (29.3%) |
Technology Access in Wessington Springs
Computing Device Access in Wessington Springs
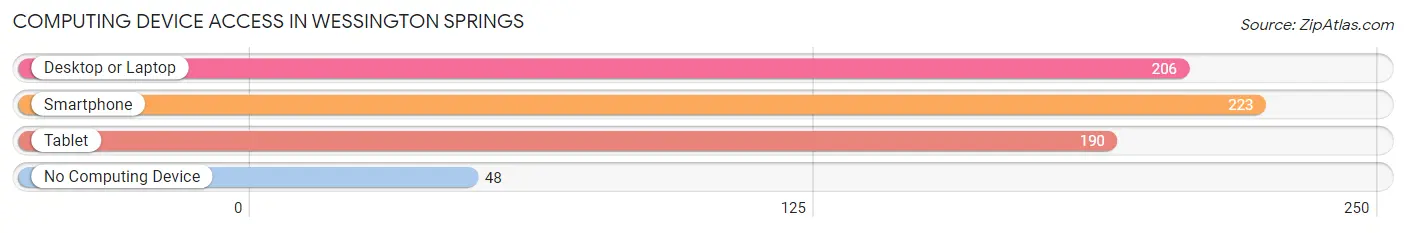
| Device Type | # Households | % Households |
| Desktop or Laptop | 206 | 59.2% |
| Smartphone | 223 | 64.1% |
| Tablet | 190 | 54.6% |
| No Computing Device | 48 | 13.8% |
| Total | 348 | 100.0% |
Internet Access in Wessington Springs
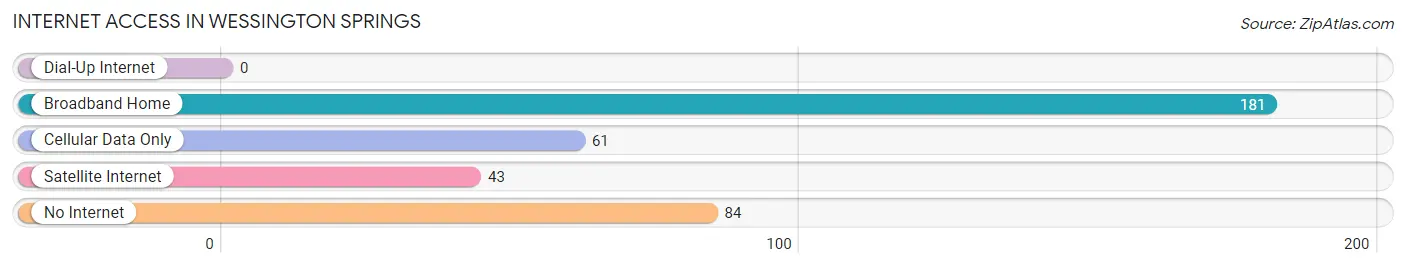
| Internet Type | # Households | % Households |
| Dial-Up Internet | 0 | 0.0% |
| Broadband Home | 181 | 52.0% |
| Cellular Data Only | 61 | 17.5% |
| Satellite Internet | 43 | 12.4% |
| No Internet | 84 | 24.1% |
| Total | 348 | 100.0% |
Wessington Springs Summary
Wessington Springs is a small town located in Jerauld County, South Dakota. It is situated in the southeastern part of the state, about 50 miles from the state capital of Pierre. The town has a population of approximately 1,000 people and is the county seat of Jerauld County.
History
Wessington Springs was founded in 1883 by a group of settlers from Wisconsin. The town was named after the nearby Wessington Springs, which was a popular destination for settlers in the area. The town was incorporated in 1887 and quickly became a thriving agricultural center. The town was home to a variety of businesses, including a bank, a hotel, a newspaper, and a variety of stores.
In the early 1900s, Wessington Springs was a popular destination for tourists. The town was known for its natural beauty and its abundance of outdoor activities. In the 1920s, the town was home to a popular dance hall, which attracted visitors from all over the region.
In the 1930s, the Great Depression hit the town hard. Many businesses closed and the population declined. However, the town was able to survive and eventually began to recover. In the 1950s, the town was revitalized with the construction of a new school and a new hospital.
Geography
Wessington Springs is located in the southeastern part of South Dakota, about 50 miles from the state capital of Pierre. The town is situated in the rolling hills of the Missouri Plateau. The town is surrounded by farmland and is located near the Wessington Springs National Wildlife Refuge.
The climate in Wessington Springs is generally mild, with hot summers and cold winters. The average temperature in the summer is around 75 degrees Fahrenheit, while the average temperature in the winter is around 25 degrees Fahrenheit.
Economy
The economy of Wessington Springs is largely based on agriculture. The town is home to a variety of farms, including dairy farms, beef farms, and grain farms. The town is also home to a variety of businesses, including a bank, a hotel, a newspaper, and a variety of stores.
The town is also home to a variety of manufacturing businesses, including a furniture factory and a metal fabrication plant. The town is also home to a variety of service businesses, including a hospital, a nursing home, and a variety of restaurants.
Demographics
As of the 2010 census, the population of Wessington Springs was 1,000 people. The racial makeup of the town was 97.2% White, 0.7% African American, 0.2% Native American, 0.2% Asian, 0.2% from other races, and 1.7% from two or more races. The median household income in the town was $37,500.
Conclusion
Wessington Springs is a small town located in Jerauld County, South Dakota. It is situated in the southeastern part of the state, about 50 miles from the state capital of Pierre. The town has a population of approximately 1,000 people and is the county seat of Jerauld County. The town has a long history and is home to a variety of businesses and industries. The economy of the town is largely based on agriculture, and the town is home to a variety of manufacturing businesses and service businesses. The population of the town is predominantly White, with a small percentage of African Americans, Native Americans, and Asians.
Common Questions
What is Per Capita Income in Wessington Springs?
Per Capita income in Wessington Springs is $28,864.
What is the Median Family Income in Wessington Springs?
Median Family Income in Wessington Springs is $67,917.
What is the Median Household income in Wessington Springs?
Median Household Income in Wessington Springs is $42,946.
What is Income or Wage Gap in Wessington Springs?
Income or Wage Gap in Wessington Springs is 32.2%.
Women in Wessington Springs earn 67.8 cents for every dollar earned by a man.
What is Inequality or Gini Index in Wessington Springs?
Inequality or Gini Index in Wessington Springs is 0.40.
What is the Total Population of Wessington Springs?
Total Population of Wessington Springs is 659.
What is the Total Male Population of Wessington Springs?
Total Male Population of Wessington Springs is 308.
What is the Total Female Population of Wessington Springs?
Total Female Population of Wessington Springs is 351.
What is the Ratio of Males per 100 Females in Wessington Springs?
There are 87.75 Males per 100 Females in Wessington Springs.
What is the Ratio of Females per 100 Males in Wessington Springs?
There are 113.96 Females per 100 Males in Wessington Springs.
What is the Median Population Age in Wessington Springs?
Median Population Age in Wessington Springs is 61.0 Years.
What is the Average Family Size in Wessington Springs
Average Family Size in Wessington Springs is 2.6 People.
What is the Average Household Size in Wessington Springs
Average Household Size in Wessington Springs is 1.8 People.
How Large is the Labor Force in Wessington Springs?
There are 312 People in the Labor Forcein in Wessington Springs.
What is the Percentage of People in the Labor Force in Wessington Springs?
54.3% of People are in the Labor Force in Wessington Springs.