Webster, SD Map & Demographics
Webster Map
Webster Overview
$32,367
PER CAPITA INCOME
$81,750
AVG FAMILY INCOME
$50,500
AVG HOUSEHOLD INCOME
43.9%
WAGE / INCOME GAP [ % ]
56.1¢/ $1
WAGE / INCOME GAP [ $ ]
0.42
INEQUALITY / GINI INDEX
1,805
TOTAL POPULATION
911
MALE POPULATION
894
FEMALE POPULATION
101.90
MALES / 100 FEMALES
98.13
FEMALES / 100 MALES
42.8
MEDIAN AGE
3.1
AVG FAMILY SIZE
2.1
AVG HOUSEHOLD SIZE
900
LABOR FORCE [ PEOPLE ]
59.1%
PERCENT IN LABOR FORCE
1.3%
UNEMPLOYMENT RATE
Webster Zip Codes
Webster Area Codes
Income in Webster
Income Overview in Webster
Per Capita Income in Webster is $32,367, while median incomes of families and households are $81,750 and $50,500 respectively.
| Characteristic | Number | Measure |
| Per Capita Income | 1,805 | $32,367 |
| Median Family Income | 348 | $81,750 |
| Mean Family Income | 348 | $91,426 |
| Median Household Income | 834 | $50,500 |
| Mean Household Income | 834 | $66,157 |
| Income Deficit | 348 | $0 |
| Wage / Income Gap (%) | 1,805 | 43.93% |
| Wage / Income Gap ($) | 1,805 | 56.07¢ per $1 |
| Gini / Inequality Index | 1,805 | 0.42 |
Earnings by Sex in Webster
Average Earnings in Webster are $29,905, $42,784 for men and $23,990 for women, a difference of 43.9%.
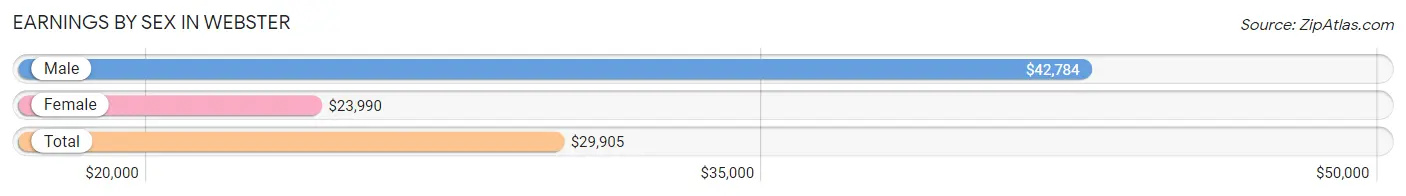
| Sex | Number | Average Earnings |
| Male | 597 (55.8%) | $42,784 |
| Female | 473 (44.2%) | $23,990 |
| Total | 1,070 (100.0%) | $29,905 |
Earnings by Sex by Income Bracket in Webster
The most common earnings brackets in Webster are $40,000 to $44,999 for men (72 | 12.1%) and $25,000 to $29,999 for women (69 | 14.6%).
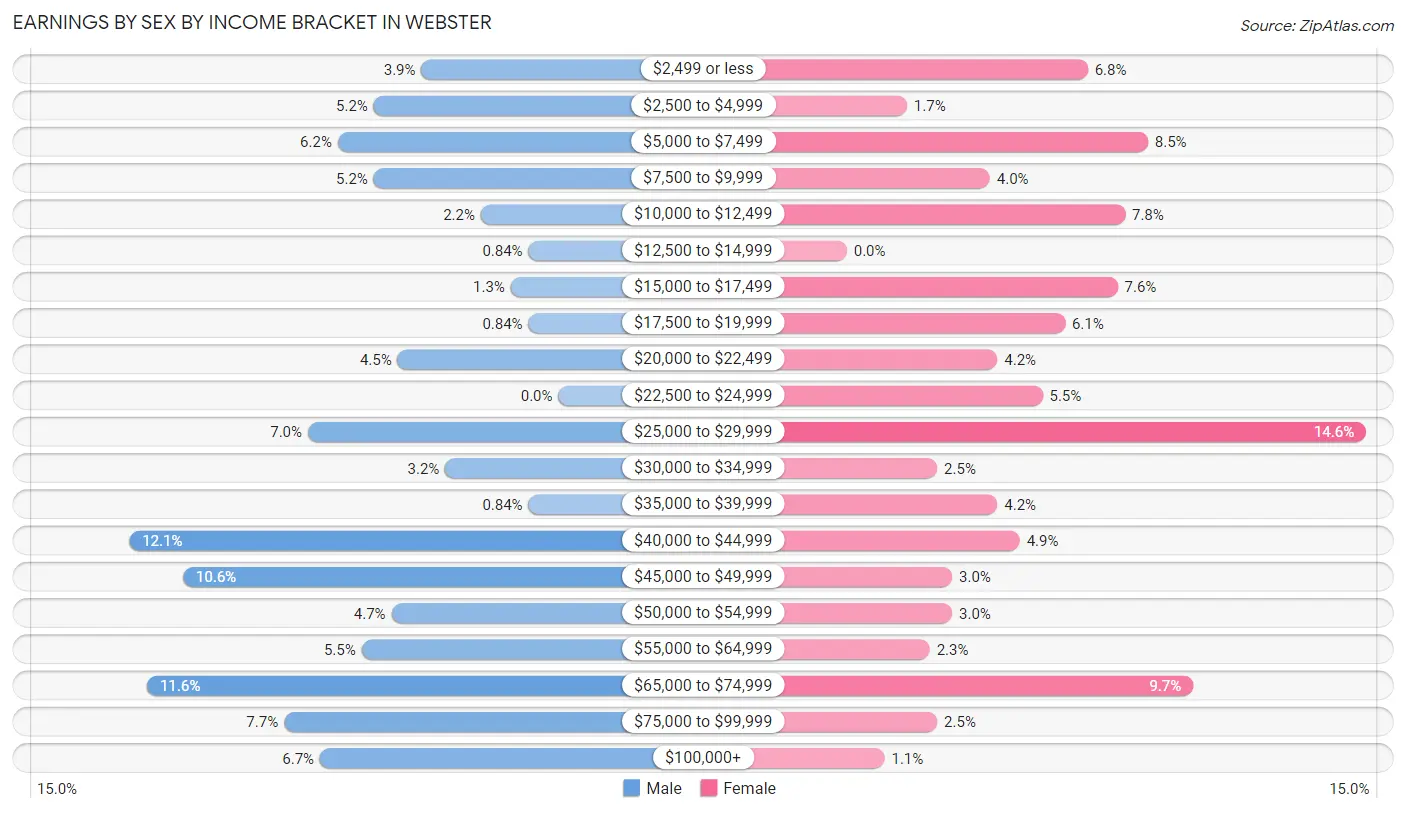
| Income | Male | Female |
| $2,499 or less | 23 (3.8%) | 32 (6.8%) |
| $2,500 to $4,999 | 31 (5.2%) | 8 (1.7%) |
| $5,000 to $7,499 | 37 (6.2%) | 40 (8.5%) |
| $7,500 to $9,999 | 31 (5.2%) | 19 (4.0%) |
| $10,000 to $12,499 | 13 (2.2%) | 37 (7.8%) |
| $12,500 to $14,999 | 5 (0.8%) | 0 (0.0%) |
| $15,000 to $17,499 | 8 (1.3%) | 36 (7.6%) |
| $17,500 to $19,999 | 5 (0.8%) | 29 (6.1%) |
| $20,000 to $22,499 | 27 (4.5%) | 20 (4.2%) |
| $22,500 to $24,999 | 0 (0.0%) | 26 (5.5%) |
| $25,000 to $29,999 | 42 (7.0%) | 69 (14.6%) |
| $30,000 to $34,999 | 19 (3.2%) | 12 (2.5%) |
| $35,000 to $39,999 | 5 (0.8%) | 20 (4.2%) |
| $40,000 to $44,999 | 72 (12.1%) | 23 (4.9%) |
| $45,000 to $49,999 | 63 (10.5%) | 14 (3.0%) |
| $50,000 to $54,999 | 28 (4.7%) | 14 (3.0%) |
| $55,000 to $64,999 | 33 (5.5%) | 11 (2.3%) |
| $65,000 to $74,999 | 69 (11.6%) | 46 (9.7%) |
| $75,000 to $99,999 | 46 (7.7%) | 12 (2.5%) |
| $100,000+ | 40 (6.7%) | 5 (1.1%) |
| Total | 597 (100.0%) | 473 (100.0%) |
Earnings by Sex by Educational Attainment in Webster
Average earnings in Webster are $46,458 for men and $27,216 for women, a difference of 41.4%. Men with an educational attainment of college or associate's degree enjoy the highest average annual earnings of $50,469, while those with graduate degree education earn the least with $28,833. Women with an educational attainment of bachelor's degree earn the most with the average annual earnings of $43,523, while those with college or associate's degree education have the smallest earnings of $23,317.
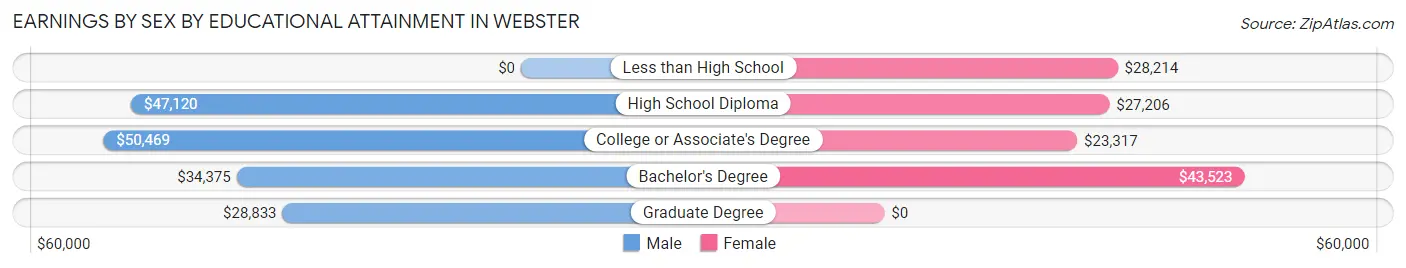
| Educational Attainment | Male Income | Female Income |
| Less than High School | - | - |
| High School Diploma | $47,120 | $27,206 |
| College or Associate's Degree | $50,469 | $23,317 |
| Bachelor's Degree | $34,375 | $43,523 |
| Graduate Degree | $28,833 | $0 |
| Total | $46,458 | $27,216 |
Family Income in Webster
Family Income Brackets in Webster
According to the Webster family income data, there are 142 families falling into the $100,000 to $149,999 income range, which is the most common income bracket and makes up 40.8% of all families. Conversely, the less than $10,000 income bracket is the least frequent group with only 4 families (1.1%) belonging to this category.
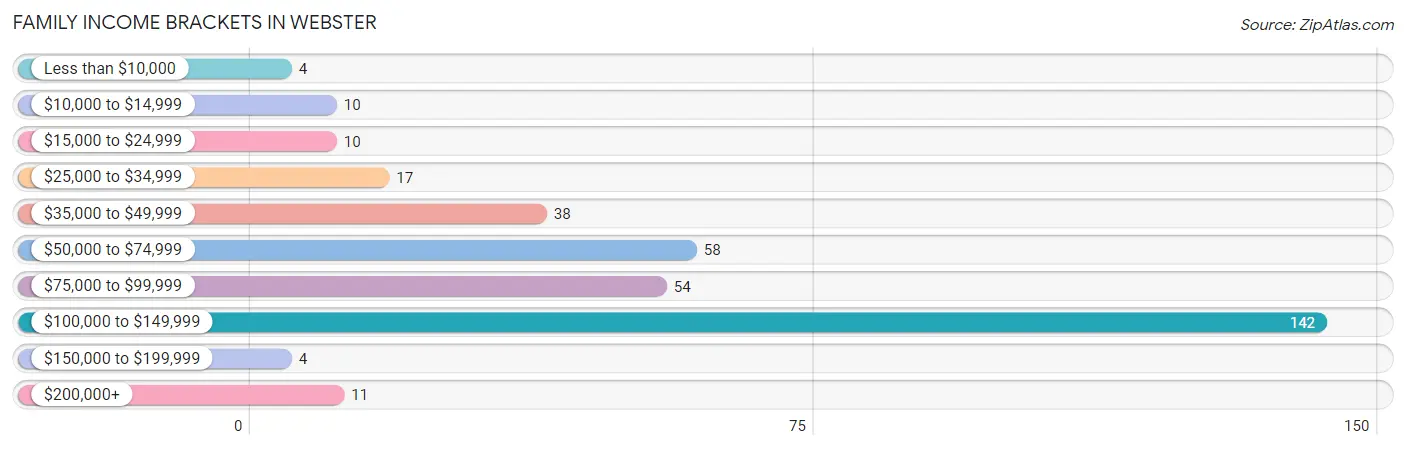
| Income Bracket | # Families | % Families |
| Less than $10,000 | 4 | 1.1% |
| $10,000 to $14,999 | 10 | 2.9% |
| $15,000 to $24,999 | 10 | 2.9% |
| $25,000 to $34,999 | 17 | 4.9% |
| $35,000 to $49,999 | 38 | 10.9% |
| $50,000 to $74,999 | 58 | 16.7% |
| $75,000 to $99,999 | 54 | 15.5% |
| $100,000 to $149,999 | 142 | 40.8% |
| $150,000 to $199,999 | 4 | 1.1% |
| $200,000+ | 11 | 3.2% |
Family Income by Famaliy Size in Webster
5-person families (11 | 3.2%) account for the highest median family income in Webster with $134,063 per family, while 2-person families (169 | 48.6%) have the highest median income of $39,125 per family member.
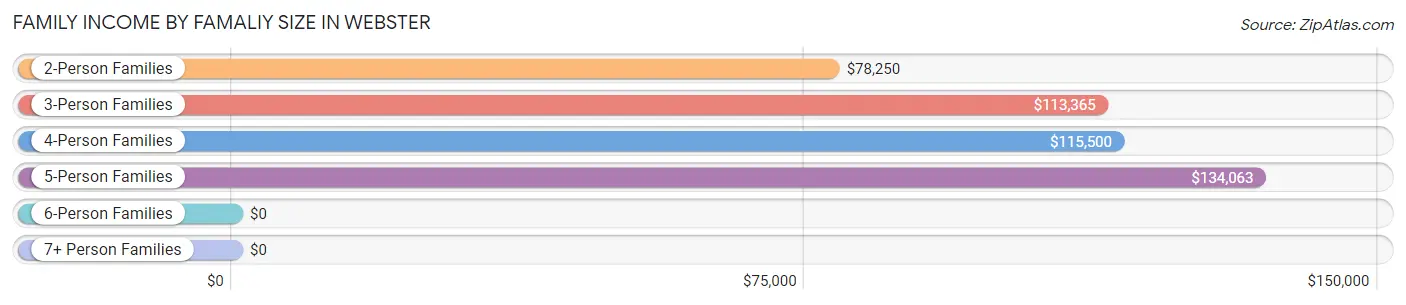
| Income Bracket | # Families | Median Income |
| 2-Person Families | 169 (48.6%) | $78,250 |
| 3-Person Families | 98 (28.2%) | $113,365 |
| 4-Person Families | 48 (13.8%) | $115,500 |
| 5-Person Families | 11 (3.2%) | $134,063 |
| 6-Person Families | 7 (2.0%) | $0 |
| 7+ Person Families | 15 (4.3%) | $0 |
| Total | 348 (100.0%) | $81,750 |
Family Income by Number of Earners in Webster
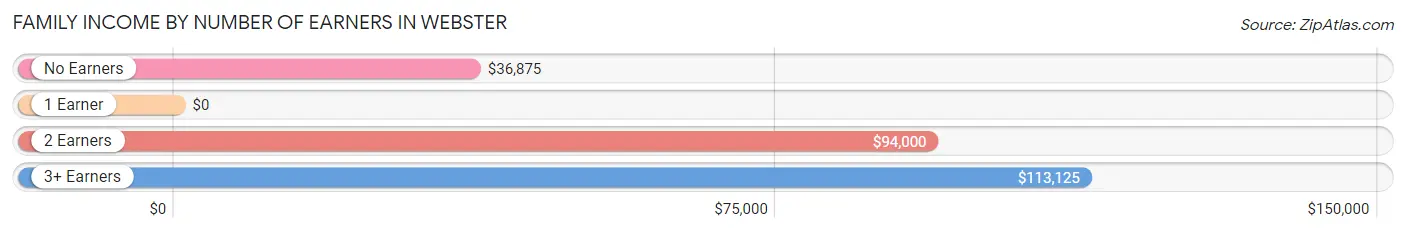
| Number of Earners | # Families | Median Income |
| No Earners | 52 (14.9%) | $36,875 |
| 1 Earner | 71 (20.4%) | $0 |
| 2 Earners | 160 (46.0%) | $94,000 |
| 3+ Earners | 65 (18.7%) | $113,125 |
| Total | 348 (100.0%) | $81,750 |
Household Income in Webster
Household Income Brackets in Webster
With 151 households falling in the category, the $35,000 to $49,999 income range is the most frequent in Webster, accounting for 18.1% of all households. In contrast, only 16 households (1.9%) fall into the $200,000+ income bracket, making it the least populous group.
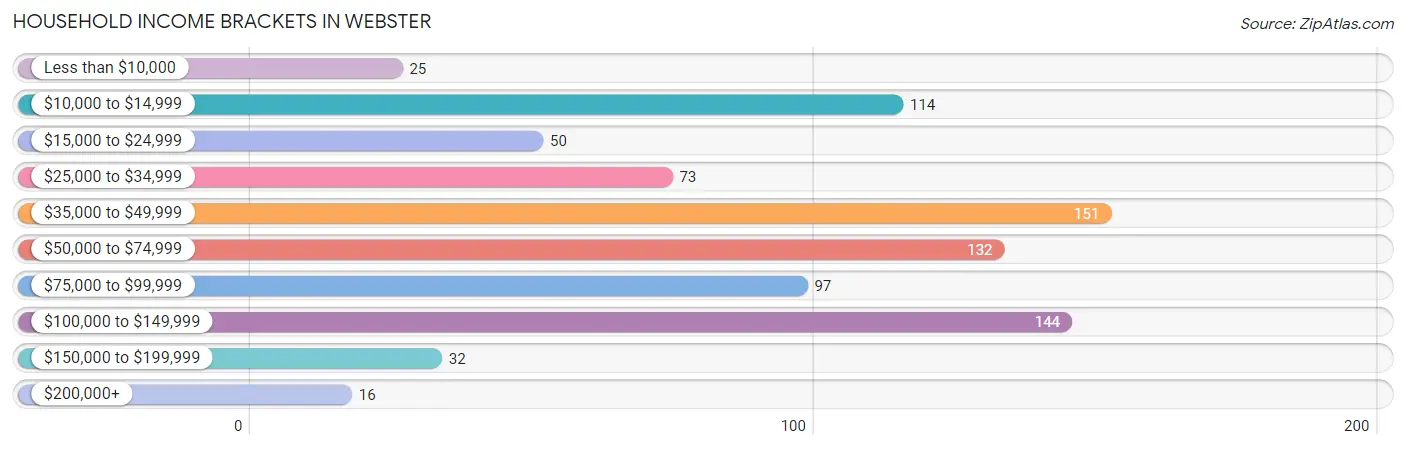
| Income Bracket | # Households | % Households |
| Less than $10,000 | 25 | 3.0% |
| $10,000 to $14,999 | 114 | 13.7% |
| $15,000 to $24,999 | 50 | 6.0% |
| $25,000 to $34,999 | 73 | 8.8% |
| $35,000 to $49,999 | 151 | 18.1% |
| $50,000 to $74,999 | 132 | 15.8% |
| $75,000 to $99,999 | 97 | 11.6% |
| $100,000 to $149,999 | 144 | 17.3% |
| $150,000 to $199,999 | 32 | 3.8% |
| $200,000+ | 16 | 1.9% |
Household Income by Householder Age in Webster
The median household income in Webster is $50,500, with the highest median household income of $93,409 found in the 45 to 64 years age bracket for the primary householder. A total of 248 households (29.7%) fall into this category. Meanwhile, the 15 to 24 years age bracket for the primary householder has the lowest median household income of $0, with 53 households (6.4%) in this group.
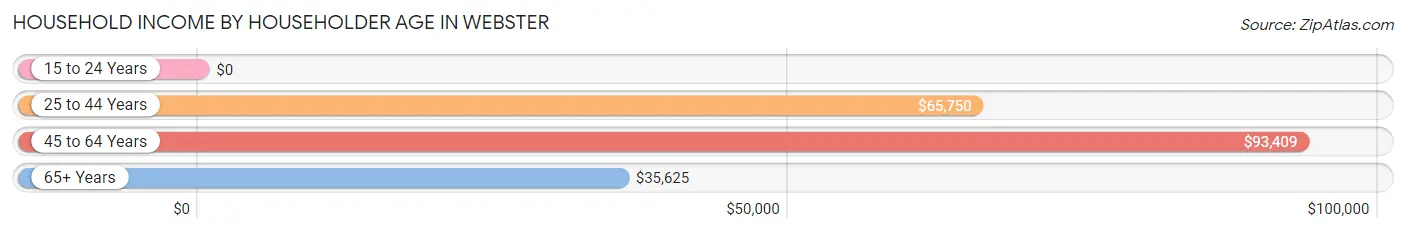
| Income Bracket | # Households | Median Income |
| 15 to 24 Years | 53 (6.4%) | $0 |
| 25 to 44 Years | 227 (27.2%) | $65,750 |
| 45 to 64 Years | 248 (29.7%) | $93,409 |
| 65+ Years | 306 (36.7%) | $35,625 |
| Total | 834 (100.0%) | $50,500 |
Poverty in Webster
Income Below Poverty by Sex and Age in Webster
With 14.9% poverty level for males and 18.8% for females among the residents of Webster, 12 to 14 year old males and 65 to 74 year old females are the most vulnerable to poverty, with 12 males (63.2%) and 41 females (36.9%) in their respective age groups living below the poverty level.
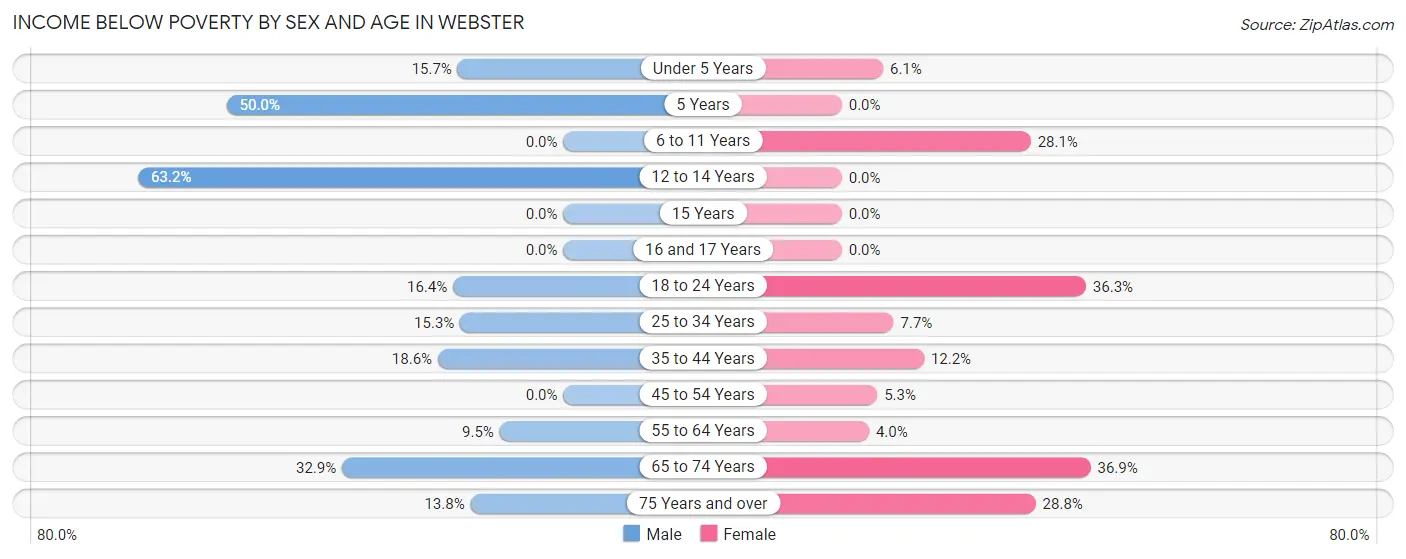
| Age Bracket | Male | Female |
| Under 5 Years | 8 (15.7%) | 3 (6.1%) |
| 5 Years | 6 (50.0%) | 0 (0.0%) |
| 6 to 11 Years | 0 (0.0%) | 23 (28.1%) |
| 12 to 14 Years | 12 (63.2%) | 0 (0.0%) |
| 15 Years | 0 (0.0%) | 0 (0.0%) |
| 16 and 17 Years | 0 (0.0%) | 0 (0.0%) |
| 18 to 24 Years | 19 (16.4%) | 29 (36.2%) |
| 25 to 34 Years | 19 (15.3%) | 6 (7.7%) |
| 35 to 44 Years | 19 (18.6%) | 10 (12.2%) |
| 45 to 54 Years | 0 (0.0%) | 5 (5.3%) |
| 55 to 64 Years | 12 (9.5%) | 5 (4.0%) |
| 65 to 74 Years | 23 (32.9%) | 41 (36.9%) |
| 75 Years and over | 12 (13.8%) | 38 (28.8%) |
| Total | 130 (14.9%) | 160 (18.8%) |
Income Above Poverty by Sex and Age in Webster
According to the poverty statistics in Webster, males aged 6 to 11 years and females aged 12 to 14 years are the age groups that are most secure financially, with 100.0% of males and 100.0% of females in these age groups living above the poverty line.
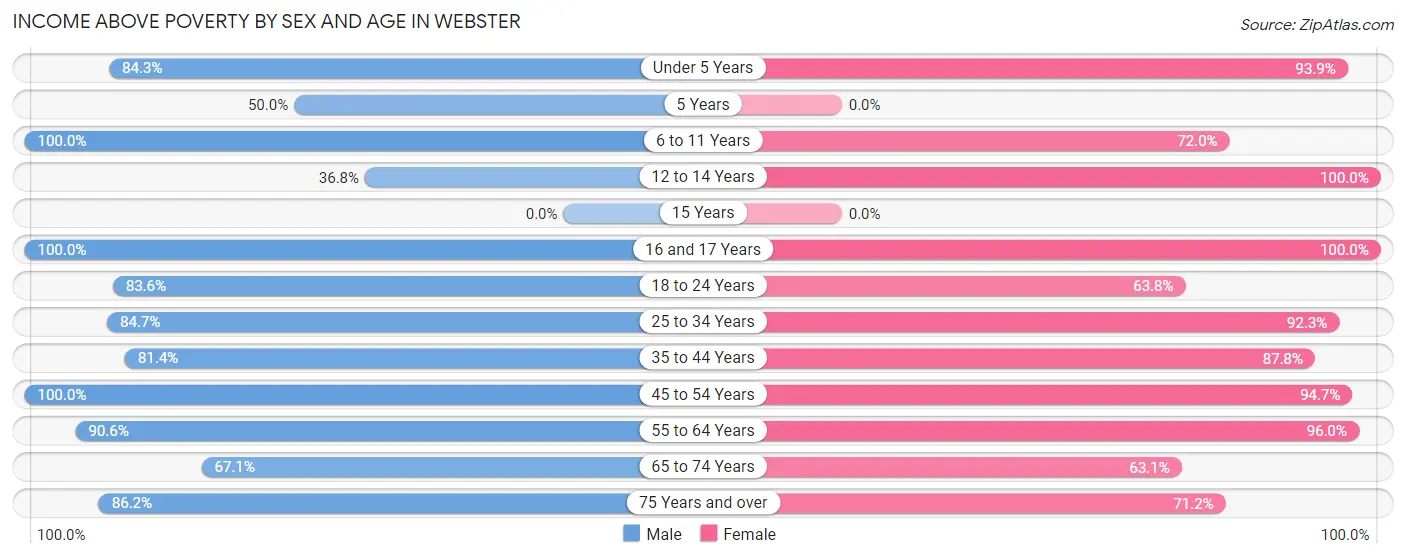
| Age Bracket | Male | Female |
| Under 5 Years | 43 (84.3%) | 46 (93.9%) |
| 5 Years | 6 (50.0%) | 0 (0.0%) |
| 6 to 11 Years | 58 (100.0%) | 59 (72.0%) |
| 12 to 14 Years | 7 (36.8%) | 11 (100.0%) |
| 15 Years | 0 (0.0%) | 0 (0.0%) |
| 16 and 17 Years | 36 (100.0%) | 8 (100.0%) |
| 18 to 24 Years | 97 (83.6%) | 51 (63.7%) |
| 25 to 34 Years | 105 (84.7%) | 72 (92.3%) |
| 35 to 44 Years | 83 (81.4%) | 72 (87.8%) |
| 45 to 54 Years | 71 (100.0%) | 90 (94.7%) |
| 55 to 64 Years | 115 (90.5%) | 119 (96.0%) |
| 65 to 74 Years | 47 (67.1%) | 70 (63.1%) |
| 75 Years and over | 75 (86.2%) | 94 (71.2%) |
| Total | 743 (85.1%) | 692 (81.2%) |
Income Below Poverty Among Married-Couple Families in Webster
The poverty statistics for married-couple families in Webster show that 7.5% or 19 of the total 253 families live below the poverty line. Families with 5 or more children have the highest poverty rate of 100.0%, comprising of 6 families. On the other hand, families with 1 or 2 children have the lowest poverty rate of 0.0%, which includes 0 families.
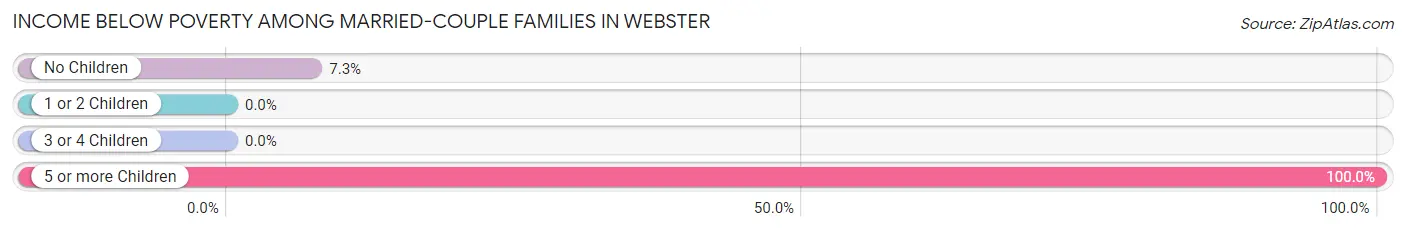
| Children | Above Poverty | Below Poverty |
| No Children | 164 (92.7%) | 13 (7.3%) |
| 1 or 2 Children | 63 (100.0%) | 0 (0.0%) |
| 3 or 4 Children | 7 (100.0%) | 0 (0.0%) |
| 5 or more Children | 0 (0.0%) | 6 (100.0%) |
| Total | 234 (92.5%) | 19 (7.5%) |
Income Below Poverty Among Single-Parent Households in Webster
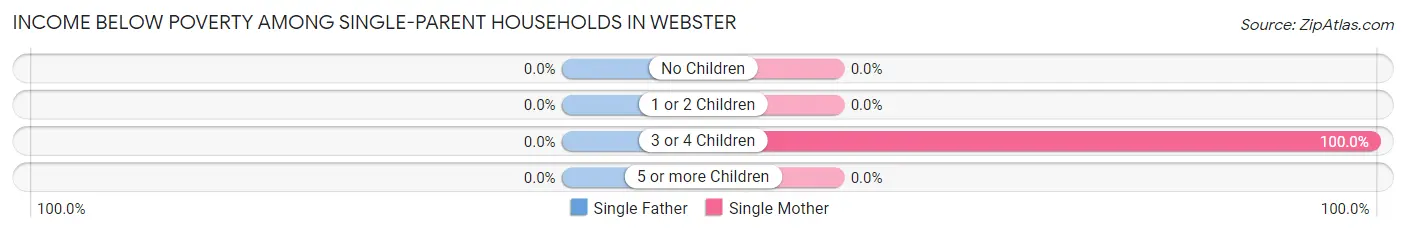
| Children | Single Father | Single Mother |
| No Children | 0 (0.0%) | 0 (0.0%) |
| 1 or 2 Children | 0 (0.0%) | 0 (0.0%) |
| 3 or 4 Children | 0 (0.0%) | 6 (100.0%) |
| 5 or more Children | 0 (0.0%) | 0 (0.0%) |
| Total | 0 (0.0%) | 6 (22.2%) |
Income Below Poverty Among Married-Couple vs Single-Parent Households in Webster
The poverty data for Webster shows that 19 of the married-couple family households (7.5%) and 6 of the single-parent households (6.3%) are living below the poverty level. Within the married-couple family households, those with 5 or more children have the highest poverty rate, with 6 households (100.0%) falling below the poverty line. Among the single-parent households, those with 3 or 4 children have the highest poverty rate, with 6 household (100.0%) living below poverty.
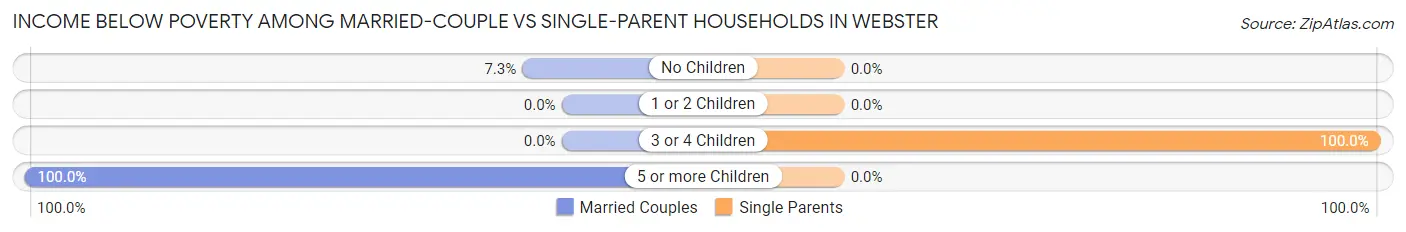
| Children | Married-Couple Families | Single-Parent Households |
| No Children | 13 (7.3%) | 0 (0.0%) |
| 1 or 2 Children | 0 (0.0%) | 0 (0.0%) |
| 3 or 4 Children | 0 (0.0%) | 6 (100.0%) |
| 5 or more Children | 6 (100.0%) | 0 (0.0%) |
| Total | 19 (7.5%) | 6 (6.3%) |
Race in Webster
The most populous races in Webster are White / Caucasian (1,730 | 95.8%), Hispanic or Latino (43 | 2.4%), and Native / Alaskan (30 | 1.7%).
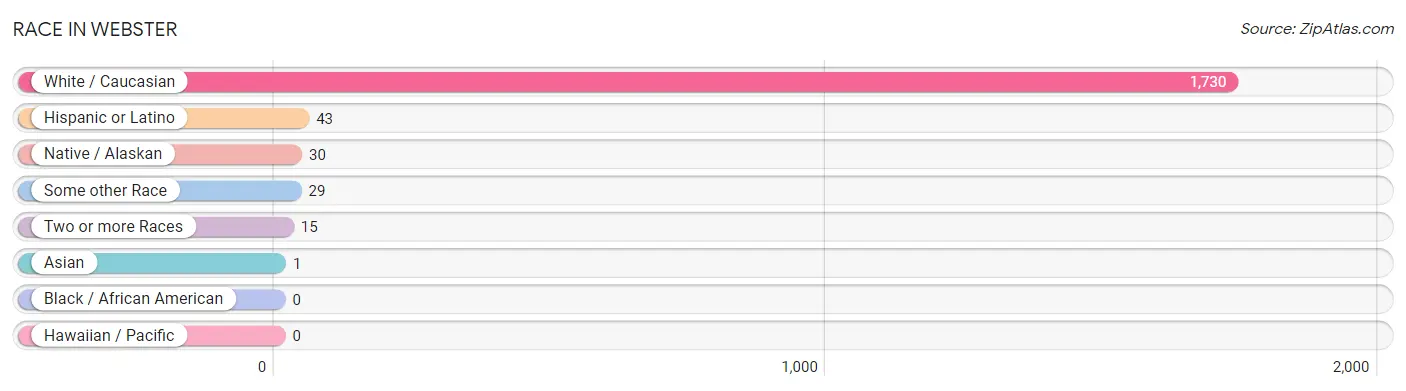
| Race | # Population | % Population |
| Asian | 1 | 0.1% |
| Black / African American | 0 | 0.0% |
| Hawaiian / Pacific | 0 | 0.0% |
| Hispanic or Latino | 43 | 2.4% |
| Native / Alaskan | 30 | 1.7% |
| White / Caucasian | 1,730 | 95.8% |
| Two or more Races | 15 | 0.8% |
| Some other Race | 29 | 1.6% |
| Total | 1,805 | 100.0% |
Ancestry in Webster
The most populous ancestries reported in Webster are German (759 | 42.0%), Norwegian (371 | 20.5%), Polish (154 | 8.5%), American (126 | 7.0%), and Russian (116 | 6.4%), together accounting for 84.5% of all Webster residents.
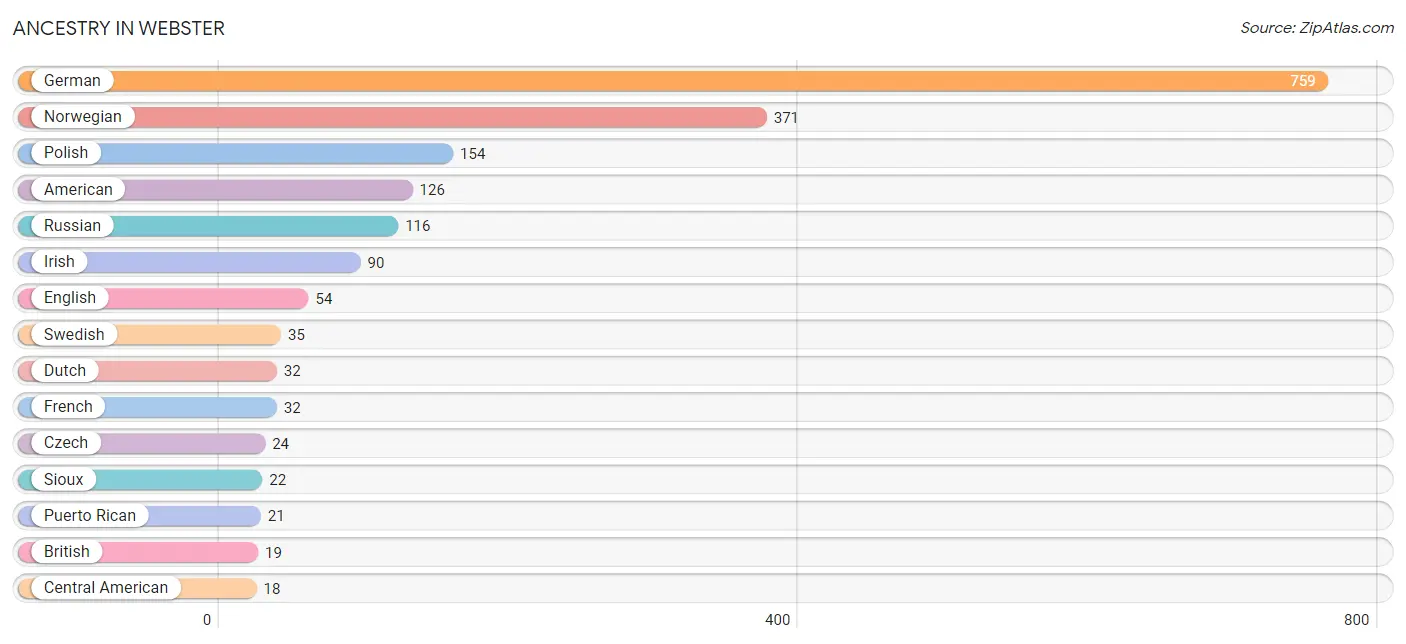
| Ancestry | # Population | % Population |
| American | 126 | 7.0% |
| British | 19 | 1.1% |
| Central American | 18 | 1.0% |
| Central American Indian | 11 | 0.6% |
| Czech | 24 | 1.3% |
| Dutch | 32 | 1.8% |
| Eastern European | 10 | 0.5% |
| English | 54 | 3.0% |
| European | 4 | 0.2% |
| Finnish | 7 | 0.4% |
| French | 32 | 1.8% |
| French Canadian | 13 | 0.7% |
| German | 759 | 42.0% |
| Greek | 5 | 0.3% |
| Guatemalan | 18 | 1.0% |
| Indonesian | 1 | 0.1% |
| Irish | 90 | 5.0% |
| Italian | 13 | 0.7% |
| Mexican | 4 | 0.2% |
| Norwegian | 371 | 20.5% |
| Pennsylvania German | 7 | 0.4% |
| Polish | 154 | 8.5% |
| Portuguese | 6 | 0.3% |
| Puerto Rican | 21 | 1.2% |
| Russian | 116 | 6.4% |
| Scandinavian | 13 | 0.7% |
| Scotch-Irish | 10 | 0.5% |
| Scottish | 4 | 0.2% |
| Sioux | 22 | 1.2% |
| Swedish | 35 | 1.9% |
| Welsh | 11 | 0.6% |
| Yugoslavian | 3 | 0.2% | View All 32 Rows |
Immigrants in Webster
The most numerous immigrant groups reported in Webster came from Central America (14 | 0.8%), Latin America (14 | 0.8%), Mexico (14 | 0.8%), Asia (1 | 0.1%), and South Eastern Asia (1 | 0.1%), together accounting for 2.5% of all Webster residents.
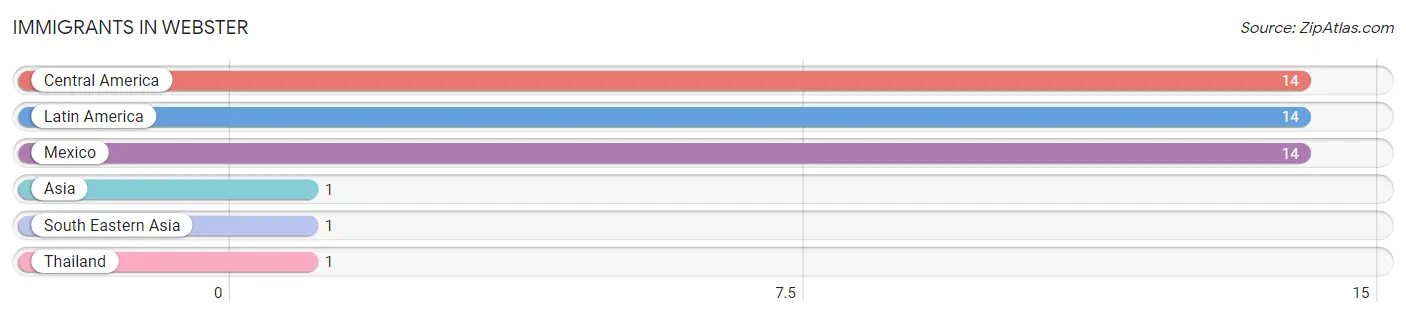
| Immigration Origin | # Population | % Population |
| Asia | 1 | 0.1% |
| Central America | 14 | 0.8% |
| Latin America | 14 | 0.8% |
| Mexico | 14 | 0.8% |
| South Eastern Asia | 1 | 0.1% |
| Thailand | 1 | 0.1% | View All 6 Rows |
Sex and Age in Webster
Sex and Age in Webster
The most populous age groups in Webster are 40 to 44 Years (88 | 9.7%) for men and 85 Years and over (100 | 11.2%) for women.
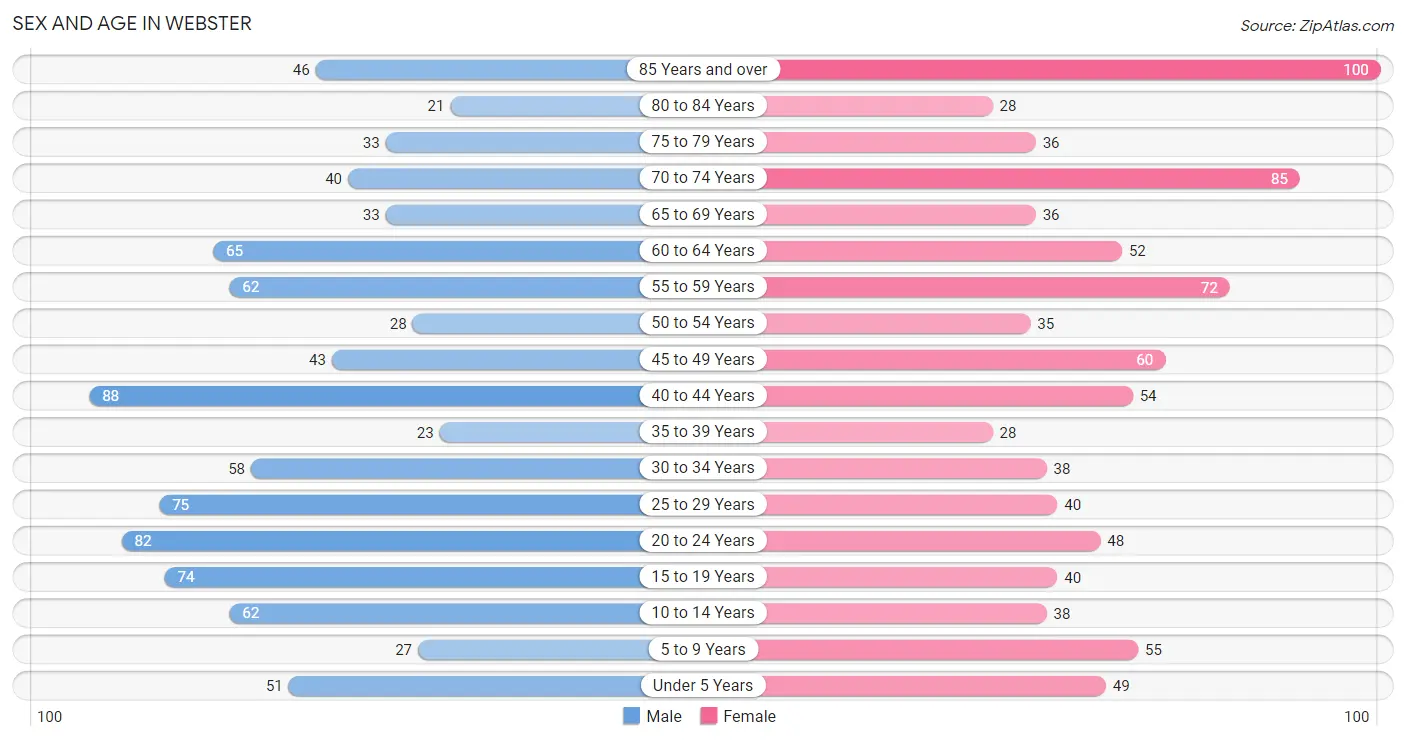
| Age Bracket | Male | Female |
| Under 5 Years | 51 (5.6%) | 49 (5.5%) |
| 5 to 9 Years | 27 (3.0%) | 55 (6.1%) |
| 10 to 14 Years | 62 (6.8%) | 38 (4.3%) |
| 15 to 19 Years | 74 (8.1%) | 40 (4.5%) |
| 20 to 24 Years | 82 (9.0%) | 48 (5.4%) |
| 25 to 29 Years | 75 (8.2%) | 40 (4.5%) |
| 30 to 34 Years | 58 (6.4%) | 38 (4.3%) |
| 35 to 39 Years | 23 (2.5%) | 28 (3.1%) |
| 40 to 44 Years | 88 (9.7%) | 54 (6.0%) |
| 45 to 49 Years | 43 (4.7%) | 60 (6.7%) |
| 50 to 54 Years | 28 (3.1%) | 35 (3.9%) |
| 55 to 59 Years | 62 (6.8%) | 72 (8.1%) |
| 60 to 64 Years | 65 (7.1%) | 52 (5.8%) |
| 65 to 69 Years | 33 (3.6%) | 36 (4.0%) |
| 70 to 74 Years | 40 (4.4%) | 85 (9.5%) |
| 75 to 79 Years | 33 (3.6%) | 36 (4.0%) |
| 80 to 84 Years | 21 (2.3%) | 28 (3.1%) |
| 85 Years and over | 46 (5.1%) | 100 (11.2%) |
| Total | 911 (100.0%) | 894 (100.0%) |
Families and Households in Webster
Median Family Size in Webster
The median family size in Webster is 3.09 persons per family, with single male/father families (68 | 19.5%) accounting for the largest median family size of 3.32 persons per family. On the other hand, single female/mother families (27 | 7.8%) represent the smallest median family size with 2.70 persons per family.
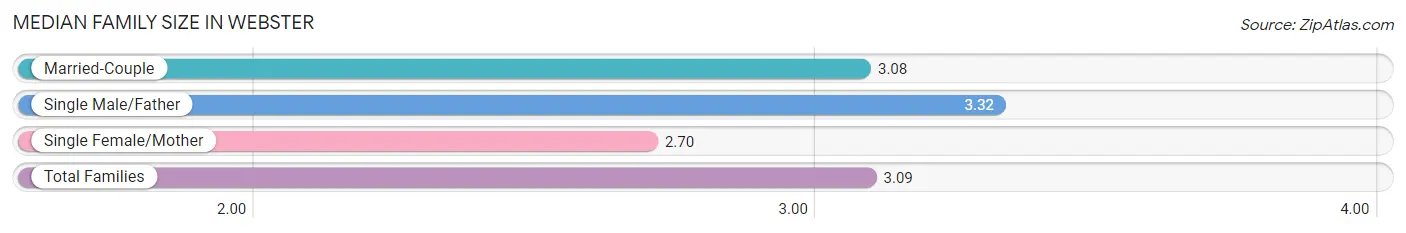
| Family Type | # Families | Family Size |
| Married-Couple | 253 (72.7%) | 3.08 |
| Single Male/Father | 68 (19.5%) | 3.32 |
| Single Female/Mother | 27 (7.8%) | 2.70 |
| Total Families | 348 (100.0%) | 3.09 |
Median Household Size in Webster
The median household size in Webster is 2.07 persons per household, with single male/father households (68 | 8.2%) accounting for the largest median household size of 4.43 persons per household. non-family households (486 | 58.3%) represent the smallest median household size with 1.13 persons per household.
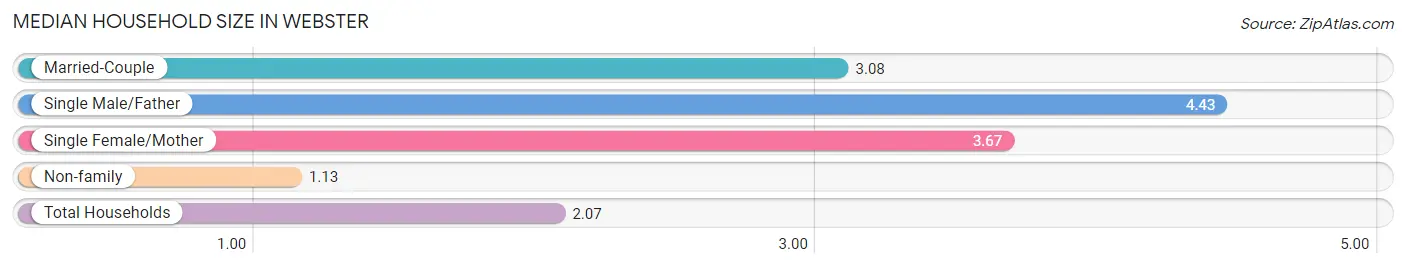
| Household Type | # Households | Household Size |
| Married-Couple | 253 (30.3%) | 3.08 |
| Single Male/Father | 68 (8.2%) | 4.43 |
| Single Female/Mother | 27 (3.2%) | 3.67 |
| Non-family | 486 (58.3%) | 1.13 |
| Total Households | 834 (100.0%) | 2.07 |
Household Size by Marriage Status in Webster
Out of a total of 834 households in Webster, 348 (41.7%) are family households, while 486 (58.3%) are nonfamily households. The most numerous type of family households are 2-person households, comprising 157, and the most common type of nonfamily households are 1-person households, comprising 427.
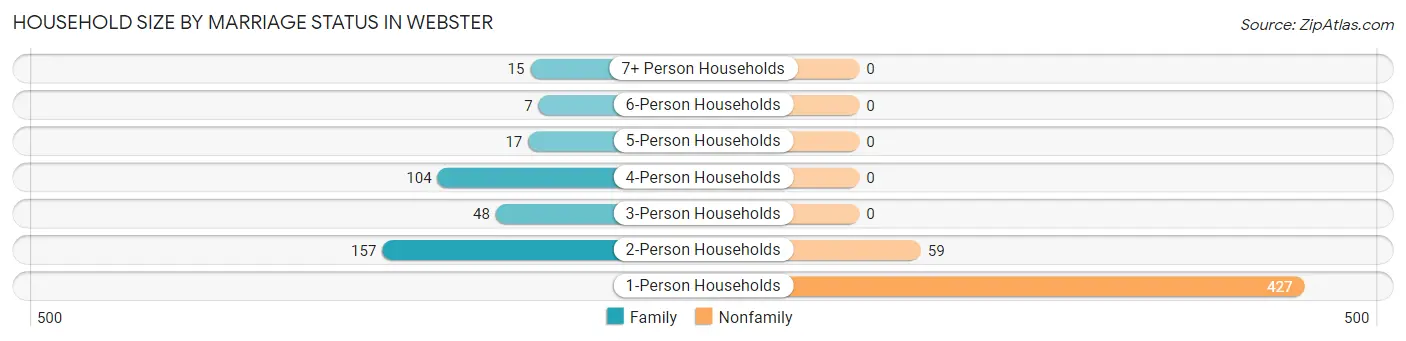
| Household Size | Family Households | Nonfamily Households |
| 1-Person Households | - | 427 (51.2%) |
| 2-Person Households | 157 (18.8%) | 59 (7.1%) |
| 3-Person Households | 48 (5.8%) | 0 (0.0%) |
| 4-Person Households | 104 (12.5%) | 0 (0.0%) |
| 5-Person Households | 17 (2.0%) | 0 (0.0%) |
| 6-Person Households | 7 (0.8%) | 0 (0.0%) |
| 7+ Person Households | 15 (1.8%) | 0 (0.0%) |
| Total | 348 (41.7%) | 486 (58.3%) |
Female Fertility in Webster
Fertility by Age in Webster
Average fertility rate in Webster is 180.0 births per 1,000 women. Women in the age bracket of 35 to 50 years have the highest fertility rate with 224.0 births per 1,000 women. Women in the age bracket of 35 to 50 years acount for 60.3% of all women with births.
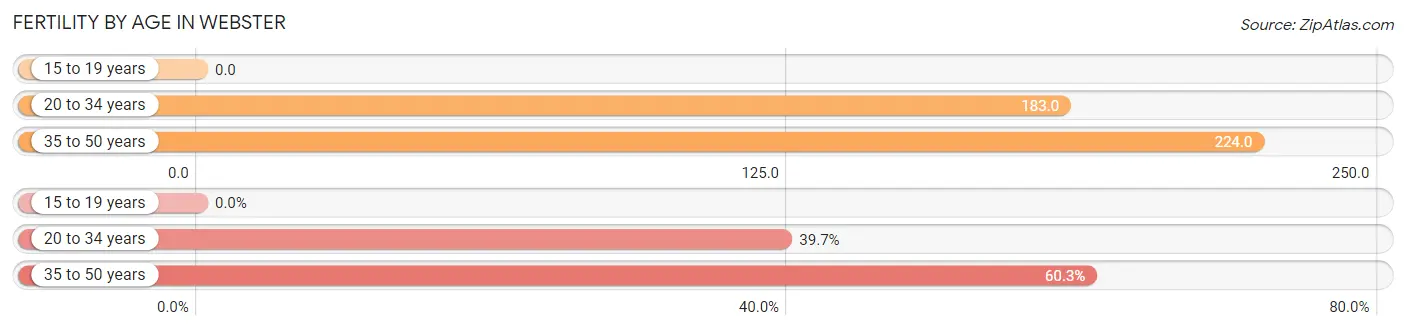
| Age Bracket | Women with Births | Births / 1,000 Women |
| 15 to 19 years | 0 (0.0%) | 0.0 |
| 20 to 34 years | 23 (39.7%) | 183.0 |
| 35 to 50 years | 35 (60.3%) | 224.0 |
| Total | 58 (100.0%) | 180.0 |
Fertility by Age by Marriage Status in Webster
24.1% of women with births (58) in Webster are married. The highest percentage of unmarried women with births falls into 35 to 50 years age bracket with 82.9% of them unmarried at the time of birth, while the lowest percentage of unmarried women with births belong to 20 to 34 years age bracket with 65.2% of them unmarried.
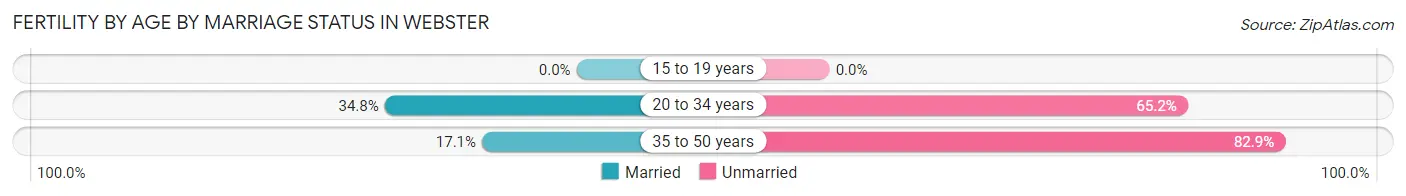
| Age Bracket | Married | Unmarried |
| 15 to 19 years | 0 (0.0%) | 0 (0.0%) |
| 20 to 34 years | 8 (34.8%) | 15 (65.2%) |
| 35 to 50 years | 6 (17.1%) | 29 (82.9%) |
| Total | 14 (24.1%) | 44 (75.9%) |
Fertility by Education in Webster
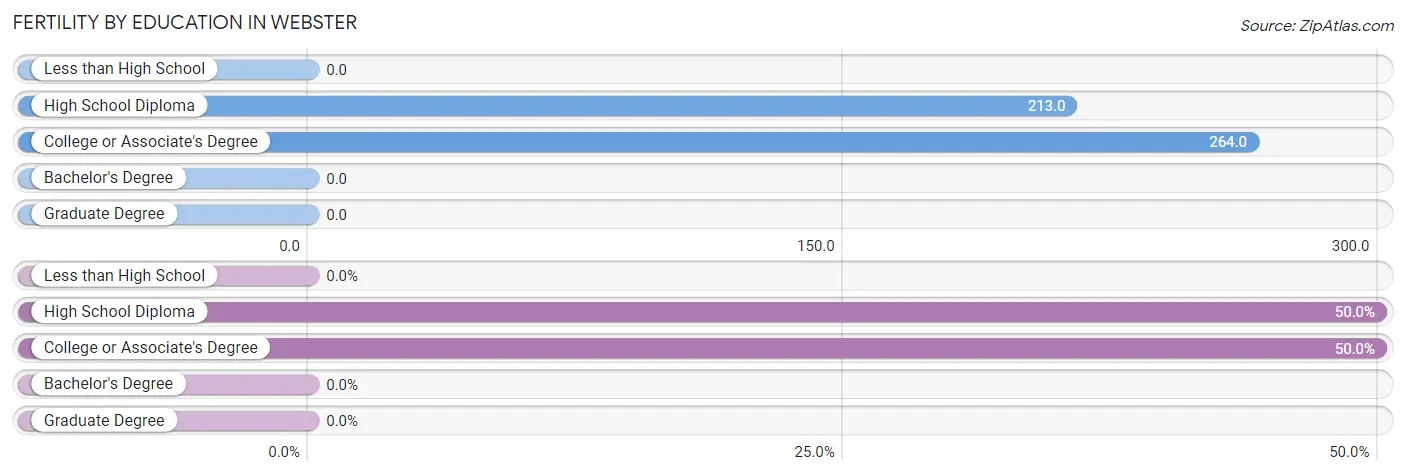
| Educational Attainment | Women with Births | Births / 1,000 Women |
| Less than High School | 0 (0.0%) | 0.0 |
| High School Diploma | 29 (50.0%) | 213.0 |
| College or Associate's Degree | 29 (50.0%) | 264.0 |
| Bachelor's Degree | 0 (0.0%) | 0.0 |
| Graduate Degree | 0 (0.0%) | 0.0 |
| Total | 58 (100.0%) | 180.0 |
Fertility by Education by Marriage Status in Webster
75.9% of women with births in Webster are unmarried. Women with the educational attainment of high school diploma are most likely to be married with 48.3% of them married at childbirth, while women with the educational attainment of college or associate's degree are least likely to be married with 100.0% of them unmarried at childbirth.
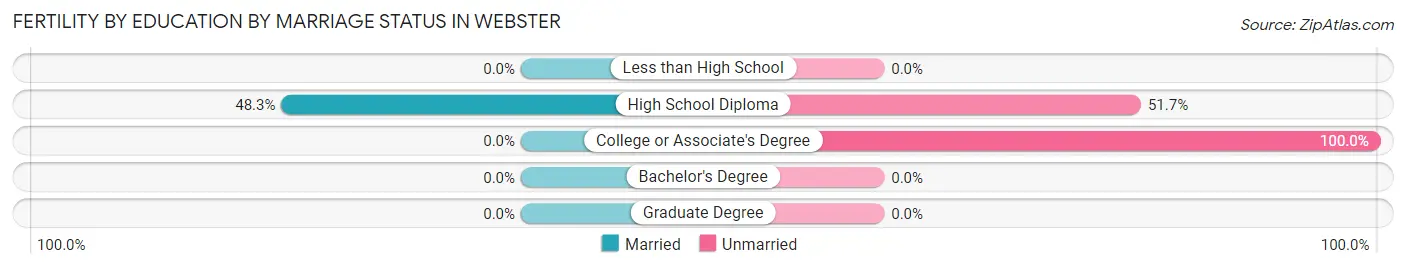
| Educational Attainment | Married | Unmarried |
| Less than High School | 0 (0.0%) | 0 (0.0%) |
| High School Diploma | 14 (48.3%) | 15 (51.7%) |
| College or Associate's Degree | 0 (0.0%) | 29 (100.0%) |
| Bachelor's Degree | 0 (0.0%) | 0 (0.0%) |
| Graduate Degree | 0 (0.0%) | 0 (0.0%) |
| Total | 14 (24.1%) | 44 (75.9%) |
Employment Characteristics in Webster
Employment by Class of Employer in Webster
Among the 861 employed individuals in Webster, private company employees (547 | 63.5%), self-employed (incorporated) (87 | 10.1%), and not-for-profit organizations (80 | 9.3%) make up the most common classes of employment.
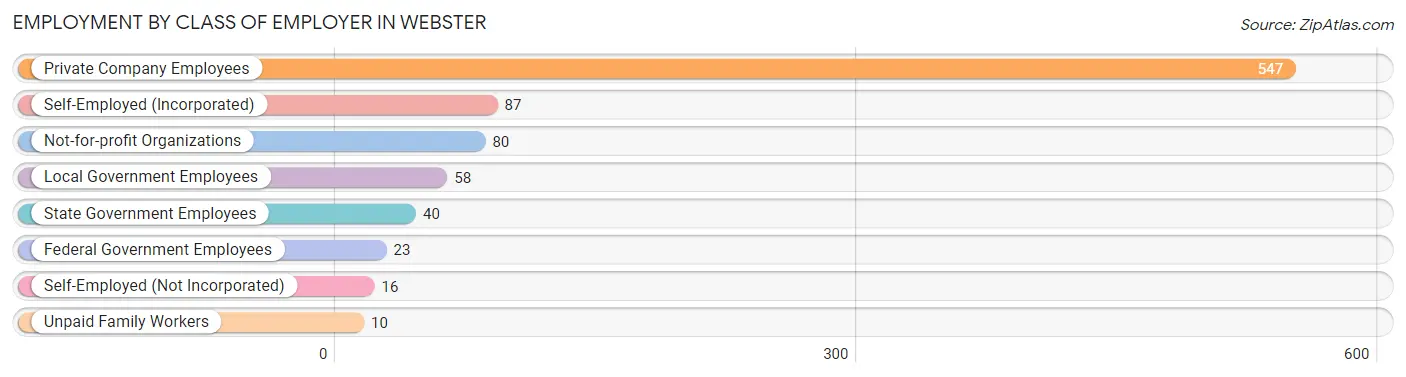
| Employer Class | # Employees | % Employees |
| Private Company Employees | 547 | 63.5% |
| Self-Employed (Incorporated) | 87 | 10.1% |
| Self-Employed (Not Incorporated) | 16 | 1.9% |
| Not-for-profit Organizations | 80 | 9.3% |
| Local Government Employees | 58 | 6.7% |
| State Government Employees | 40 | 4.6% |
| Federal Government Employees | 23 | 2.7% |
| Unpaid Family Workers | 10 | 1.2% |
| Total | 861 | 100.0% |
Employment Status by Age in Webster
According to the labor force statistics for Webster, out of the total population over 16 years of age (1,523), 59.1% or 900 individuals are in the labor force, with 1.3% or 12 of them unemployed. The age group with the highest labor force participation rate is 55 to 59 years, with 89.6% or 120 individuals in the labor force. Within the labor force, the 16 to 19 years age range has the highest percentage of unemployed individuals, with 13.2% or 7 of them being unemployed.
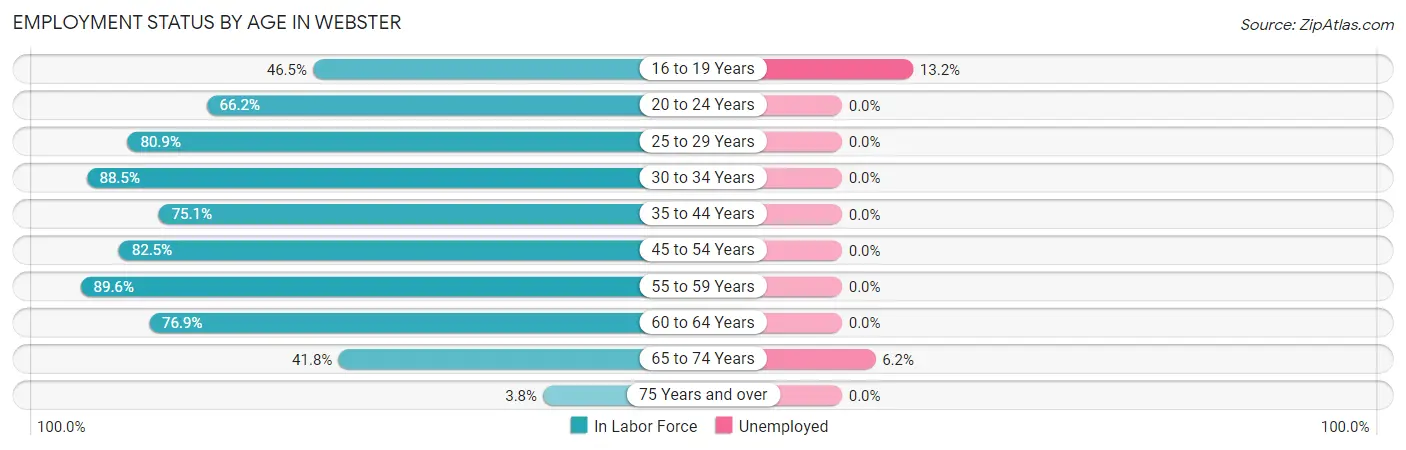
| Age Bracket | In Labor Force | Unemployed |
| 16 to 19 Years | 53 (46.5%) | 7 (13.2%) |
| 20 to 24 Years | 86 (66.2%) | 0 (0.0%) |
| 25 to 29 Years | 93 (80.9%) | 0 (0.0%) |
| 30 to 34 Years | 85 (88.5%) | 0 (0.0%) |
| 35 to 44 Years | 145 (75.1%) | 0 (0.0%) |
| 45 to 54 Years | 137 (82.5%) | 0 (0.0%) |
| 55 to 59 Years | 120 (89.6%) | 0 (0.0%) |
| 60 to 64 Years | 90 (76.9%) | 0 (0.0%) |
| 65 to 74 Years | 81 (41.8%) | 5 (6.2%) |
| 75 Years and over | 10 (3.8%) | 0 (0.0%) |
| Total | 900 (59.1%) | 12 (1.3%) |
Employment Status by Educational Attainment in Webster
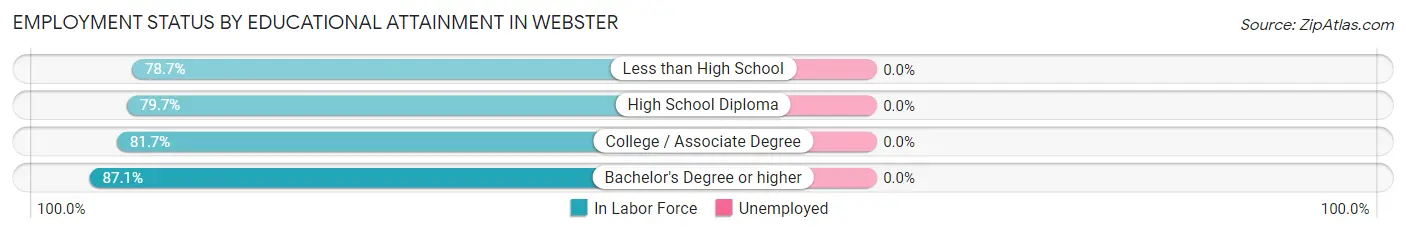
| Educational Attainment | In Labor Force | Unemployed |
| Less than High School | 37 (78.7%) | 0 (0.0%) |
| High School Diploma | 243 (79.7%) | 0 (0.0%) |
| College / Associate Degree | 282 (81.7%) | 0 (0.0%) |
| Bachelor's Degree or higher | 108 (87.1%) | 0 (0.0%) |
| Total | 670 (81.6%) | 0 (0.0%) |
Employment Occupations by Sex in Webster
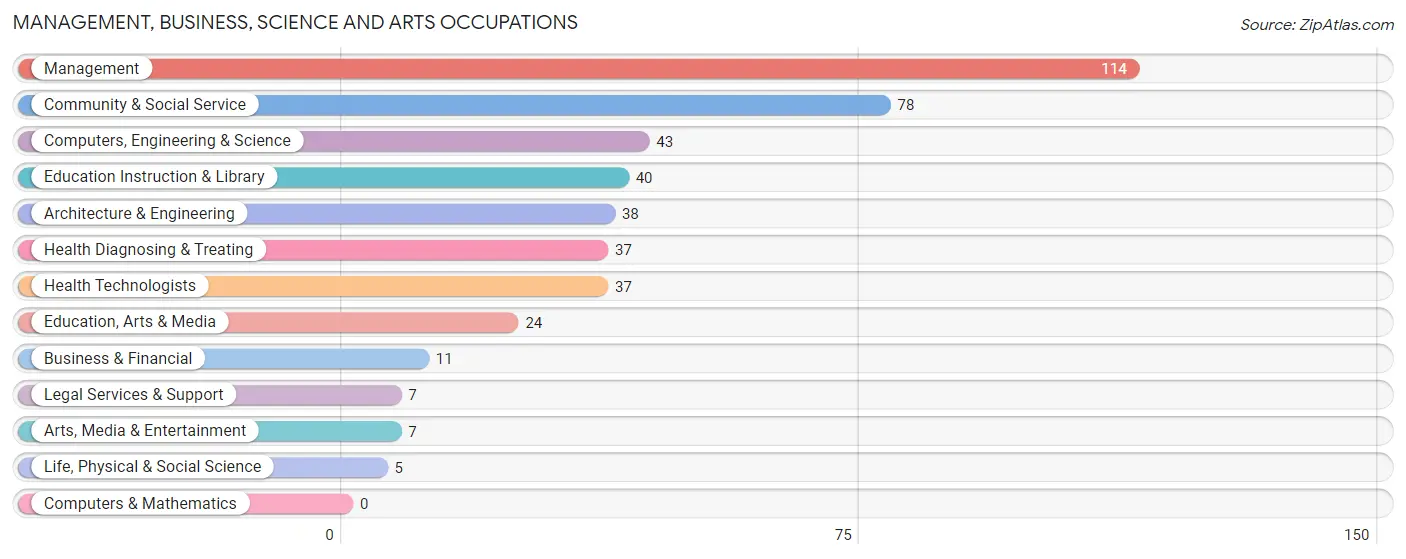
Management, Business, Science and Arts Occupations
The most common Management, Business, Science and Arts occupations in Webster are Management (114 | 12.8%), Community & Social Service (78 | 8.8%), Computers, Engineering & Science (43 | 4.8%), Education Instruction & Library (40 | 4.5%), and Architecture & Engineering (38 | 4.3%).
Management, Business, Science and Arts Occupations by Sex
Within the Management, Business, Science and Arts occupations in Webster, the most male-oriented occupations are Computers, Engineering & Science (100.0%), Architecture & Engineering (100.0%), and Life, Physical & Social Science (100.0%), while the most female-oriented occupations are Business & Financial (100.0%), Legal Services & Support (100.0%), and Education Instruction & Library (100.0%).
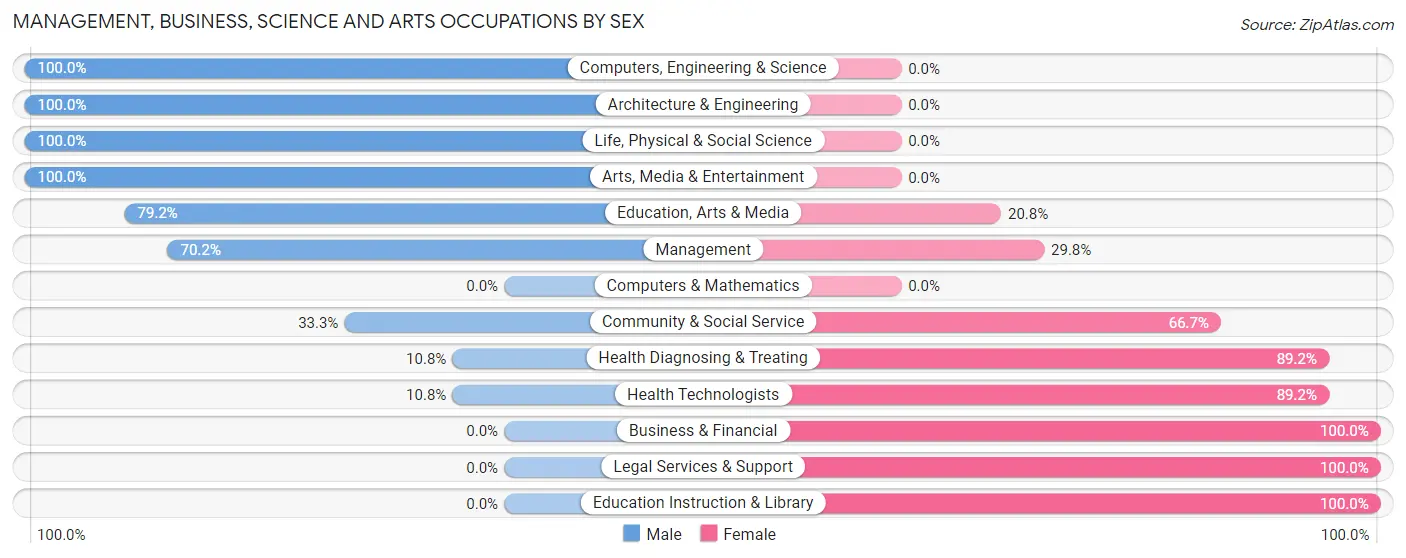
| Occupation | Male | Female |
| Management | 80 (70.2%) | 34 (29.8%) |
| Business & Financial | 0 (0.0%) | 11 (100.0%) |
| Computers, Engineering & Science | 43 (100.0%) | 0 (0.0%) |
| Computers & Mathematics | 0 (0.0%) | 0 (0.0%) |
| Architecture & Engineering | 38 (100.0%) | 0 (0.0%) |
| Life, Physical & Social Science | 5 (100.0%) | 0 (0.0%) |
| Community & Social Service | 26 (33.3%) | 52 (66.7%) |
| Education, Arts & Media | 19 (79.2%) | 5 (20.8%) |
| Legal Services & Support | 0 (0.0%) | 7 (100.0%) |
| Education Instruction & Library | 0 (0.0%) | 40 (100.0%) |
| Arts, Media & Entertainment | 7 (100.0%) | 0 (0.0%) |
| Health Diagnosing & Treating | 4 (10.8%) | 33 (89.2%) |
| Health Technologists | 4 (10.8%) | 33 (89.2%) |
| Total (Category) | 153 (54.1%) | 130 (45.9%) |
| Total (Overall) | 504 (56.8%) | 384 (43.2%) |
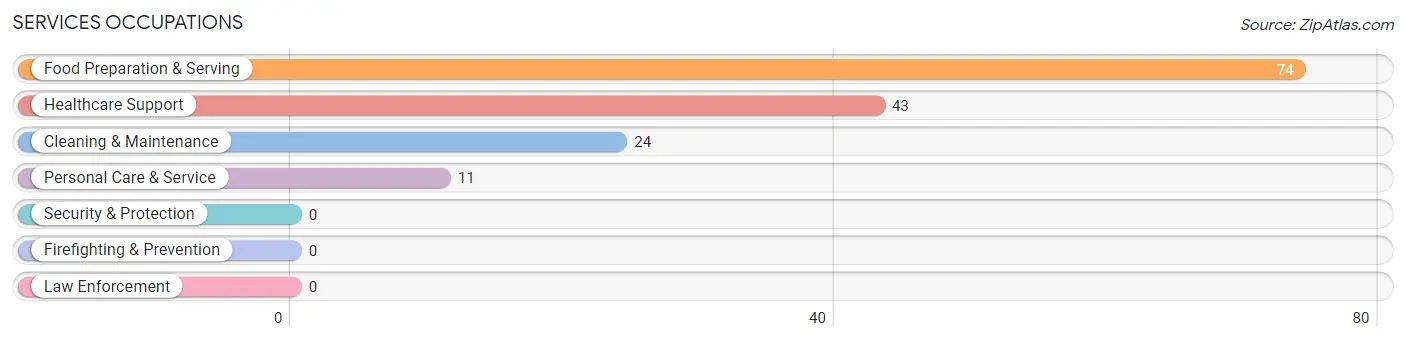
Services Occupations
The most common Services occupations in Webster are Food Preparation & Serving (74 | 8.3%), Healthcare Support (43 | 4.8%), Cleaning & Maintenance (24 | 2.7%), and Personal Care & Service (11 | 1.2%).
Services Occupations by Sex
Within the Services occupations in Webster, the most male-oriented occupations are Cleaning & Maintenance (58.3%), Personal Care & Service (45.5%), and Food Preparation & Serving (33.8%), while the most female-oriented occupations are Healthcare Support (100.0%), Food Preparation & Serving (66.2%), and Personal Care & Service (54.5%).
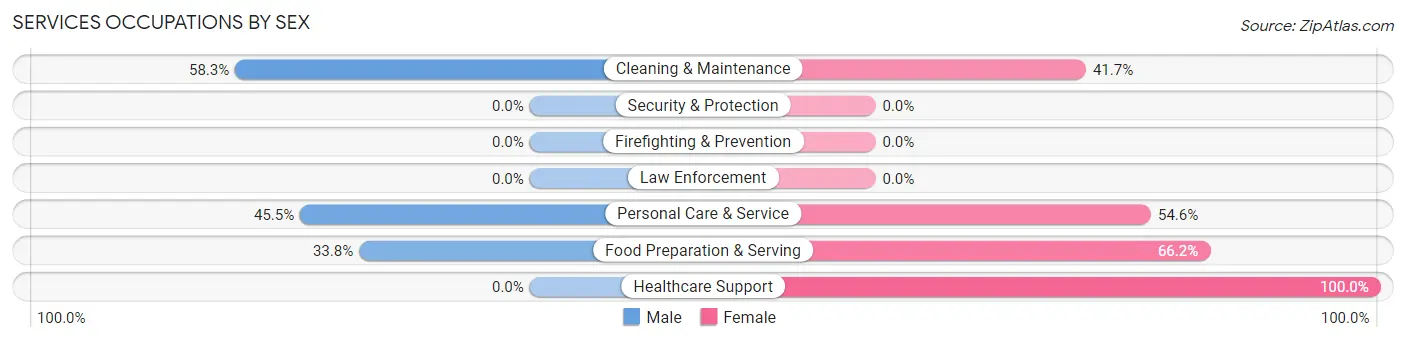
| Occupation | Male | Female |
| Healthcare Support | 0 (0.0%) | 43 (100.0%) |
| Security & Protection | 0 (0.0%) | 0 (0.0%) |
| Firefighting & Prevention | 0 (0.0%) | 0 (0.0%) |
| Law Enforcement | 0 (0.0%) | 0 (0.0%) |
| Food Preparation & Serving | 25 (33.8%) | 49 (66.2%) |
| Cleaning & Maintenance | 14 (58.3%) | 10 (41.7%) |
| Personal Care & Service | 5 (45.5%) | 6 (54.5%) |
| Total (Category) | 44 (28.9%) | 108 (71.1%) |
| Total (Overall) | 504 (56.8%) | 384 (43.2%) |
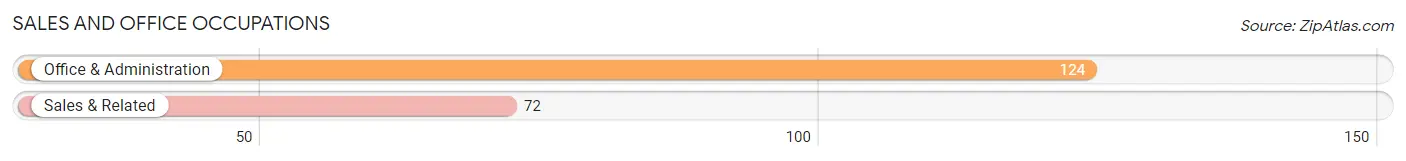
Sales and Office Occupations
The most common Sales and Office occupations in Webster are Office & Administration (124 | 14.0%), and Sales & Related (72 | 8.1%).
Sales and Office Occupations by Sex

| Occupation | Male | Female |
| Sales & Related | 61 (84.7%) | 11 (15.3%) |
| Office & Administration | 18 (14.5%) | 106 (85.5%) |
| Total (Category) | 79 (40.3%) | 117 (59.7%) |
| Total (Overall) | 504 (56.8%) | 384 (43.2%) |
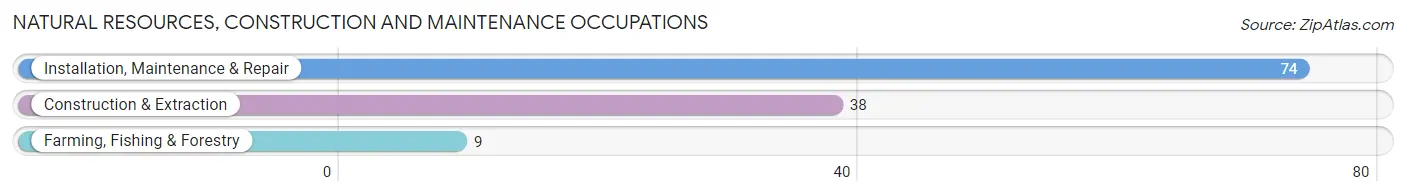
Natural Resources, Construction and Maintenance Occupations
The most common Natural Resources, Construction and Maintenance occupations in Webster are Installation, Maintenance & Repair (74 | 8.3%), Construction & Extraction (38 | 4.3%), and Farming, Fishing & Forestry (9 | 1.0%).
Natural Resources, Construction and Maintenance Occupations by Sex
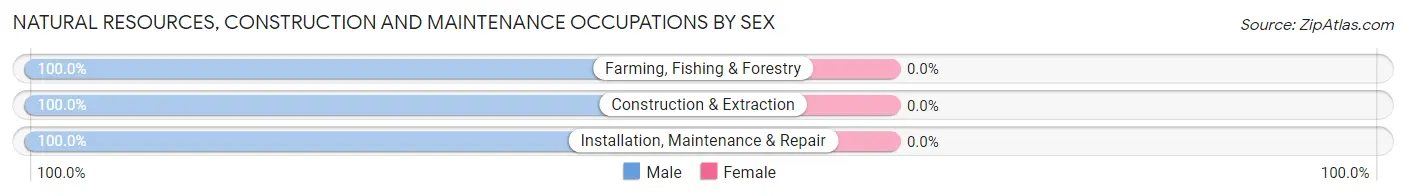
| Occupation | Male | Female |
| Farming, Fishing & Forestry | 9 (100.0%) | 0 (0.0%) |
| Construction & Extraction | 38 (100.0%) | 0 (0.0%) |
| Installation, Maintenance & Repair | 74 (100.0%) | 0 (0.0%) |
| Total (Category) | 121 (100.0%) | 0 (0.0%) |
| Total (Overall) | 504 (56.8%) | 384 (43.2%) |
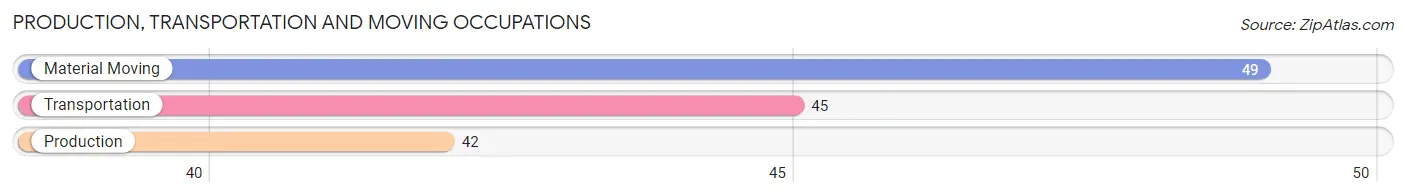
Production, Transportation and Moving Occupations
The most common Production, Transportation and Moving occupations in Webster are Material Moving (49 | 5.5%), Transportation (45 | 5.1%), and Production (42 | 4.7%).
Production, Transportation and Moving Occupations by Sex
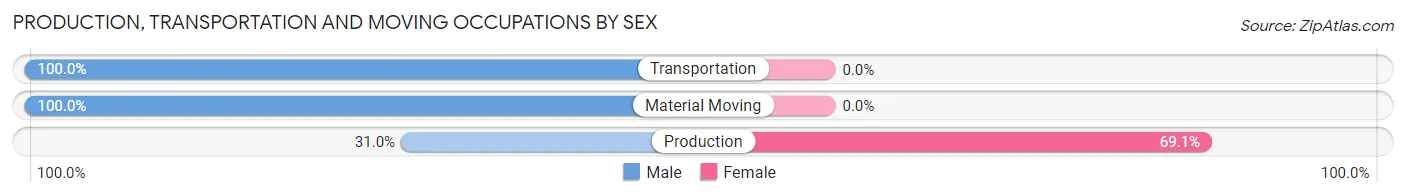
| Occupation | Male | Female |
| Production | 13 (30.9%) | 29 (69.1%) |
| Transportation | 45 (100.0%) | 0 (0.0%) |
| Material Moving | 49 (100.0%) | 0 (0.0%) |
| Total (Category) | 107 (78.7%) | 29 (21.3%) |
| Total (Overall) | 504 (56.8%) | 384 (43.2%) |
Employment Industries by Sex in Webster
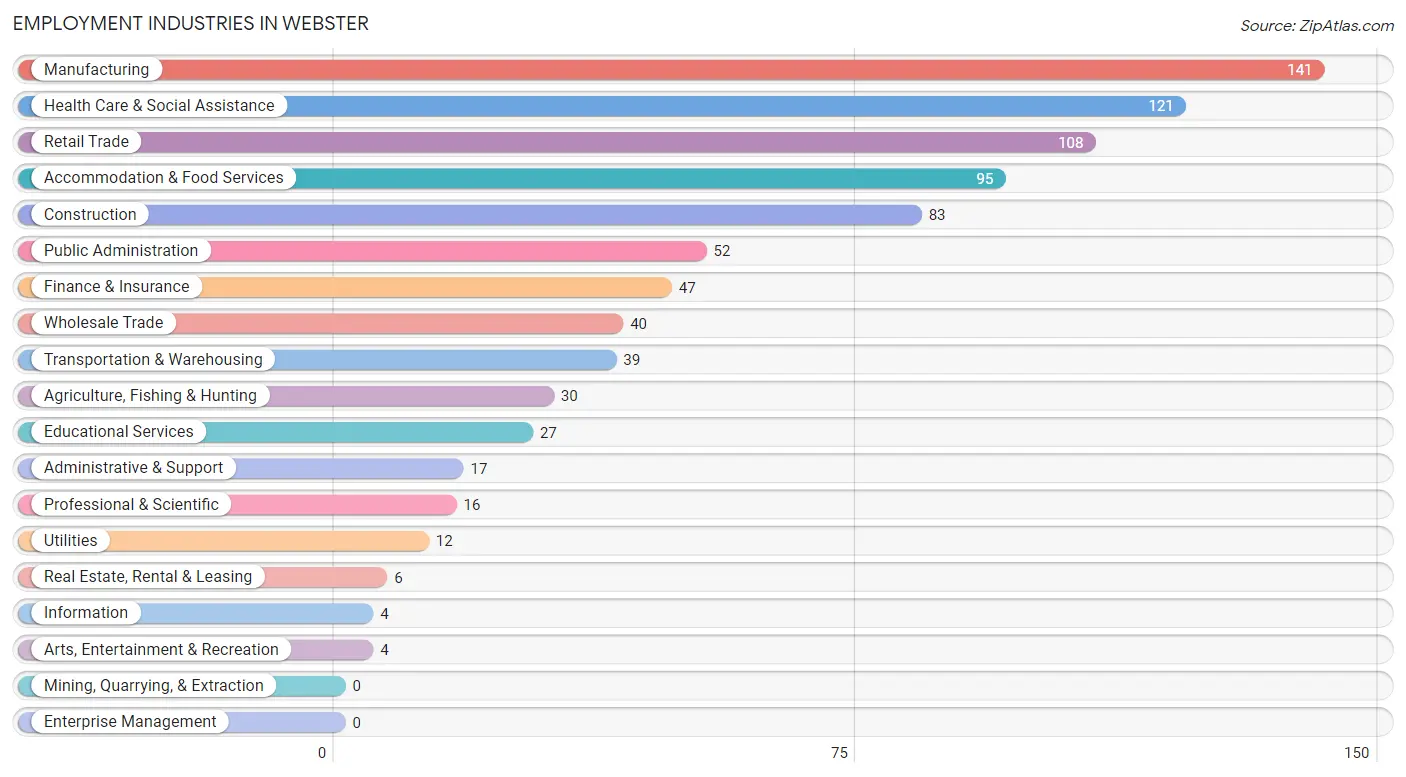
Employment Industries in Webster
The major employment industries in Webster include Manufacturing (141 | 15.9%), Health Care & Social Assistance (121 | 13.6%), Retail Trade (108 | 12.2%), Accommodation & Food Services (95 | 10.7%), and Construction (83 | 9.3%).
Employment Industries by Sex in Webster
The Webster industries that see more men than women are Agriculture, Fishing & Hunting (100.0%), Transportation & Warehousing (100.0%), and Utilities (100.0%), whereas the industries that tend to have a higher number of women are Finance & Insurance (100.0%), Real Estate, Rental & Leasing (100.0%), and Health Care & Social Assistance (90.1%).
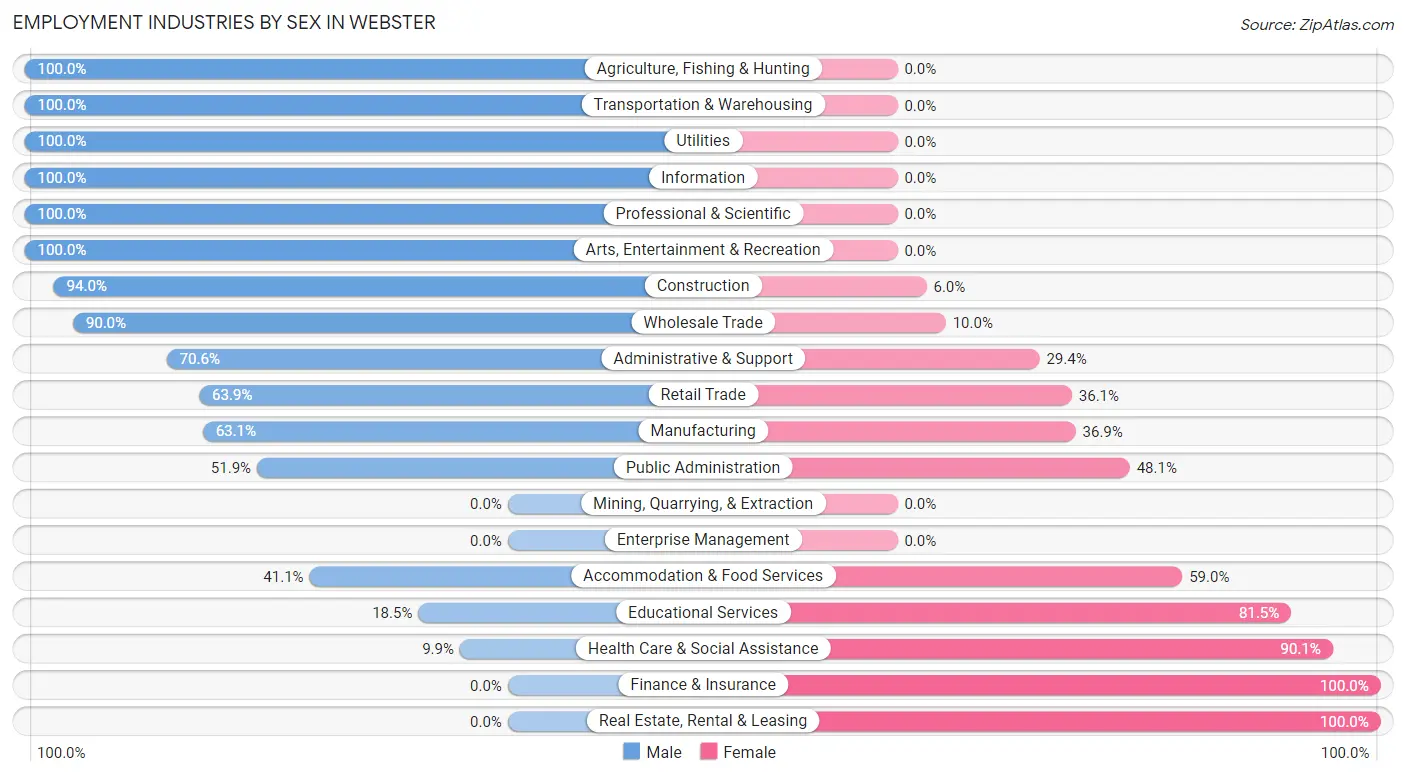
| Industry | Male | Female |
| Agriculture, Fishing & Hunting | 30 (100.0%) | 0 (0.0%) |
| Mining, Quarrying, & Extraction | 0 (0.0%) | 0 (0.0%) |
| Construction | 78 (94.0%) | 5 (6.0%) |
| Manufacturing | 89 (63.1%) | 52 (36.9%) |
| Wholesale Trade | 36 (90.0%) | 4 (10.0%) |
| Retail Trade | 69 (63.9%) | 39 (36.1%) |
| Transportation & Warehousing | 39 (100.0%) | 0 (0.0%) |
| Utilities | 12 (100.0%) | 0 (0.0%) |
| Information | 4 (100.0%) | 0 (0.0%) |
| Finance & Insurance | 0 (0.0%) | 47 (100.0%) |
| Real Estate, Rental & Leasing | 0 (0.0%) | 6 (100.0%) |
| Professional & Scientific | 16 (100.0%) | 0 (0.0%) |
| Enterprise Management | 0 (0.0%) | 0 (0.0%) |
| Administrative & Support | 12 (70.6%) | 5 (29.4%) |
| Educational Services | 5 (18.5%) | 22 (81.5%) |
| Health Care & Social Assistance | 12 (9.9%) | 109 (90.1%) |
| Arts, Entertainment & Recreation | 4 (100.0%) | 0 (0.0%) |
| Accommodation & Food Services | 39 (41.0%) | 56 (59.0%) |
| Public Administration | 27 (51.9%) | 25 (48.1%) |
| Total | 504 (56.8%) | 384 (43.2%) |
Education in Webster
School Enrollment in Webster
The most common levels of schooling among the 319 students in Webster are high school (89 | 27.9%), college / undergraduate (75 | 23.5%), and elementary school (68 | 21.3%).
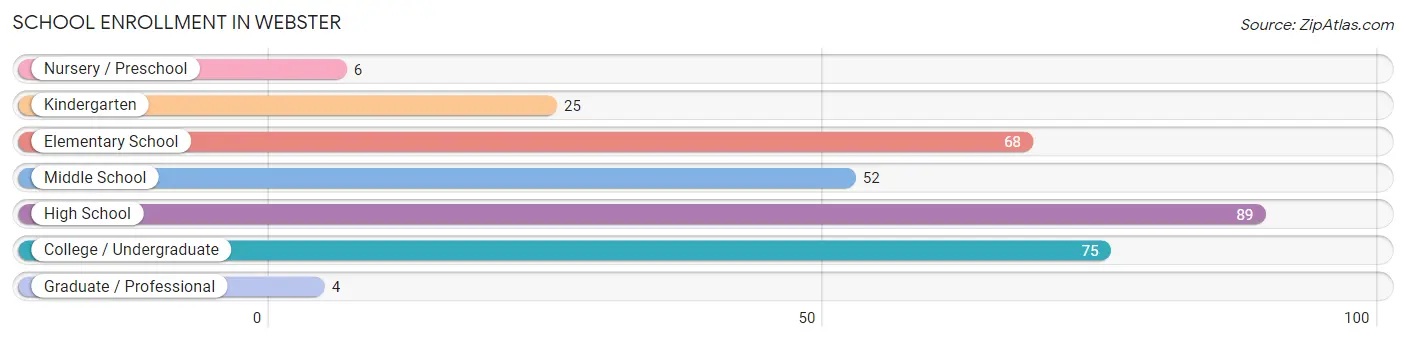
| School Level | # Students | % Students |
| Nursery / Preschool | 6 | 1.9% |
| Kindergarten | 25 | 7.8% |
| Elementary School | 68 | 21.3% |
| Middle School | 52 | 16.3% |
| High School | 89 | 27.9% |
| College / Undergraduate | 75 | 23.5% |
| Graduate / Professional | 4 | 1.3% |
| Total | 319 | 100.0% |
School Enrollment by Age by Funding Source in Webster
Out of a total of 319 students who are enrolled in schools in Webster, 14 (4.4%) attend a private institution, while the remaining 305 (95.6%) are enrolled in public schools. The age group of 25 to 34 year olds has the highest likelihood of being enrolled in private schools, with 4 (100.0% in the age bracket) enrolled. Conversely, the age group of 15 to 17 year olds has the lowest likelihood of being enrolled in a private school, with 44 (100.0% in the age bracket) attending a public institution.
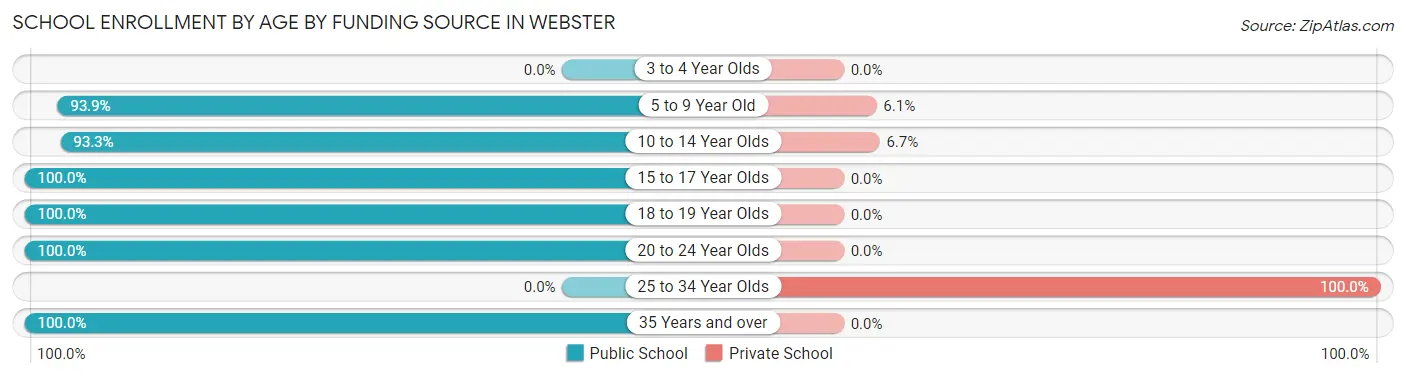
| Age Bracket | Public School | Private School |
| 3 to 4 Year Olds | 0 (0.0%) | 0 (0.0%) |
| 5 to 9 Year Old | 77 (93.9%) | 5 (6.1%) |
| 10 to 14 Year Olds | 70 (93.3%) | 5 (6.7%) |
| 15 to 17 Year Olds | 44 (100.0%) | 0 (0.0%) |
| 18 to 19 Year Olds | 32 (100.0%) | 0 (0.0%) |
| 20 to 24 Year Olds | 56 (100.0%) | 0 (0.0%) |
| 25 to 34 Year Olds | 0 (0.0%) | 4 (100.0%) |
| 35 Years and over | 26 (100.0%) | 0 (0.0%) |
| Total | 305 (95.6%) | 14 (4.4%) |
Educational Attainment by Field of Study in Webster
Education (101 | 35.6%), business (31 | 10.9%), psychology (27 | 9.5%), liberal arts & history (27 | 9.5%), and bio, nature & agricultural (24 | 8.5%) are the most common fields of study among 284 individuals in Webster who have obtained a bachelor's degree or higher.
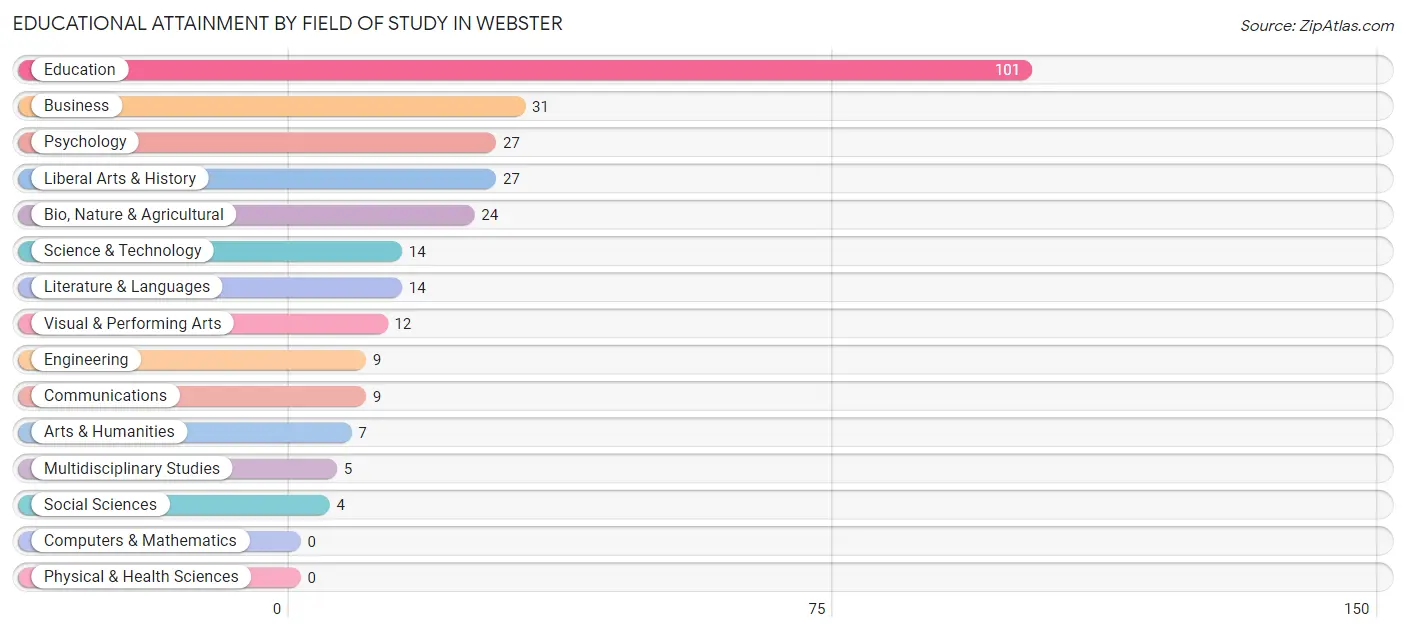
| Field of Study | # Graduates | % Graduates |
| Computers & Mathematics | 0 | 0.0% |
| Bio, Nature & Agricultural | 24 | 8.5% |
| Physical & Health Sciences | 0 | 0.0% |
| Psychology | 27 | 9.5% |
| Social Sciences | 4 | 1.4% |
| Engineering | 9 | 3.2% |
| Multidisciplinary Studies | 5 | 1.8% |
| Science & Technology | 14 | 4.9% |
| Business | 31 | 10.9% |
| Education | 101 | 35.6% |
| Literature & Languages | 14 | 4.9% |
| Liberal Arts & History | 27 | 9.5% |
| Visual & Performing Arts | 12 | 4.2% |
| Communications | 9 | 3.2% |
| Arts & Humanities | 7 | 2.5% |
| Total | 284 | 100.0% |
Transportation & Commute in Webster
Vehicle Availability by Sex in Webster
The most prevalent vehicle ownership categories in Webster are males with 2 vehicles (175, accounting for 36.7%) and females with 2 vehicles (121, making up 45.6%).
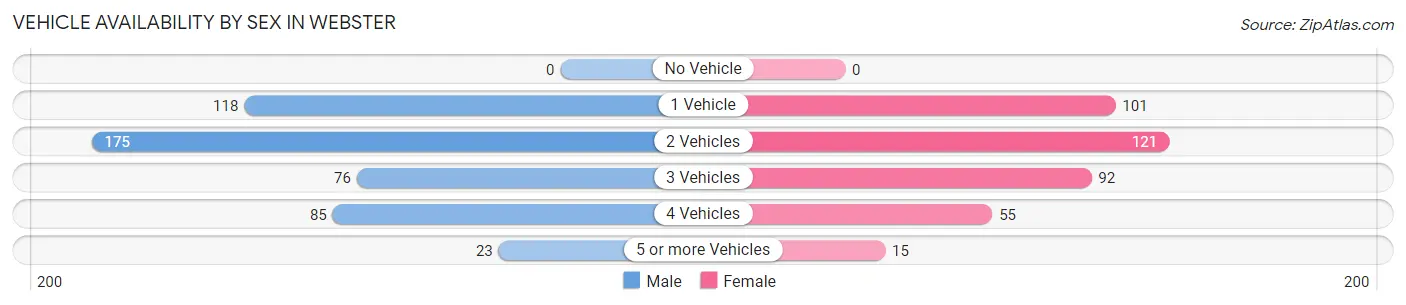
| Vehicles Available | Male | Female |
| No Vehicle | 0 (0.0%) | 0 (0.0%) |
| 1 Vehicle | 118 (24.7%) | 101 (26.3%) |
| 2 Vehicles | 175 (36.7%) | 121 (31.5%) |
| 3 Vehicles | 76 (15.9%) | 92 (24.0%) |
| 4 Vehicles | 85 (17.8%) | 55 (14.3%) |
| 5 or more Vehicles | 23 (4.8%) | 15 (3.9%) |
| Total | 477 (100.0%) | 384 (100.0%) |
Commute Time in Webster
The most frequently occuring commute durations in Webster are 5 to 9 minutes (298 commuters, 36.7%), less than 5 minutes (229 commuters, 28.2%), and 45 to 59 minutes (114 commuters, 14.1%).
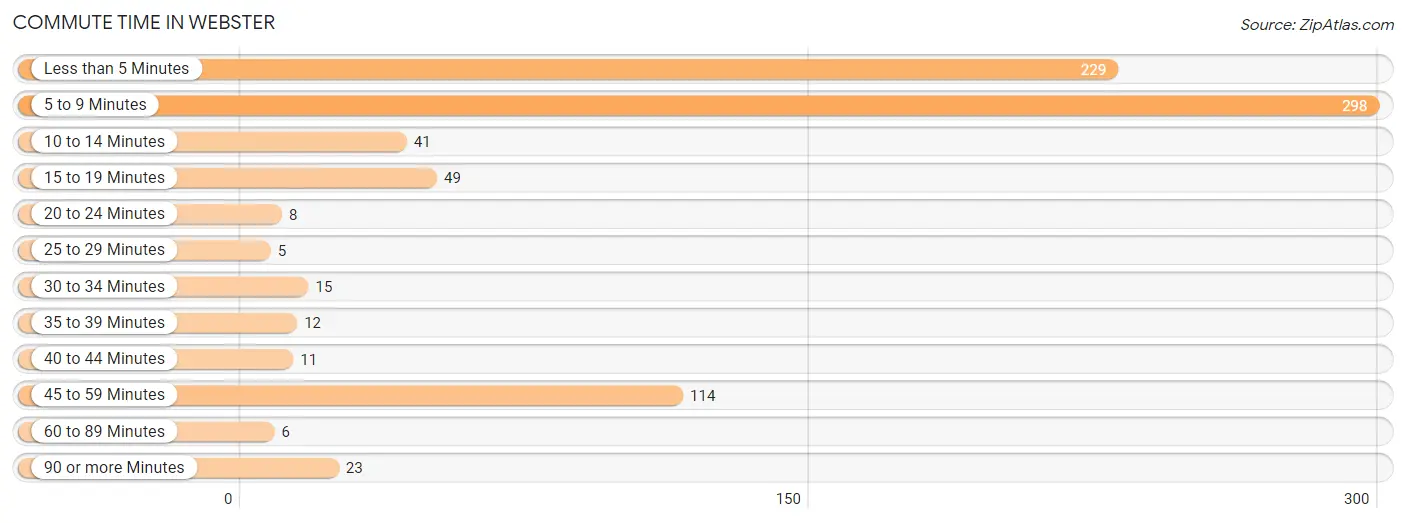
| Commute Time | # Commuters | % Commuters |
| Less than 5 Minutes | 229 | 28.2% |
| 5 to 9 Minutes | 298 | 36.7% |
| 10 to 14 Minutes | 41 | 5.1% |
| 15 to 19 Minutes | 49 | 6.0% |
| 20 to 24 Minutes | 8 | 1.0% |
| 25 to 29 Minutes | 5 | 0.6% |
| 30 to 34 Minutes | 15 | 1.8% |
| 35 to 39 Minutes | 12 | 1.5% |
| 40 to 44 Minutes | 11 | 1.4% |
| 45 to 59 Minutes | 114 | 14.1% |
| 60 to 89 Minutes | 6 | 0.7% |
| 90 or more Minutes | 23 | 2.8% |
Commute Time by Sex in Webster
The most common commute times in Webster are 5 to 9 minutes (133 commuters, 30.4%) for males and 5 to 9 minutes (165 commuters, 44.2%) for females.
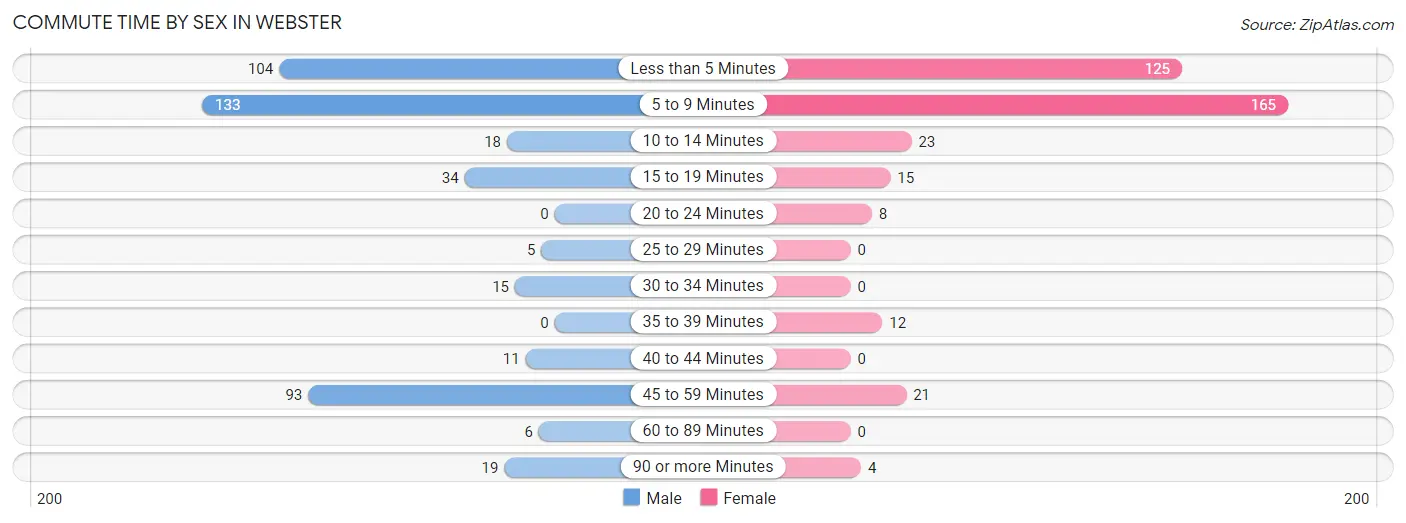
| Commute Time | Male | Female |
| Less than 5 Minutes | 104 (23.7%) | 125 (33.5%) |
| 5 to 9 Minutes | 133 (30.4%) | 165 (44.2%) |
| 10 to 14 Minutes | 18 (4.1%) | 23 (6.2%) |
| 15 to 19 Minutes | 34 (7.8%) | 15 (4.0%) |
| 20 to 24 Minutes | 0 (0.0%) | 8 (2.1%) |
| 25 to 29 Minutes | 5 (1.1%) | 0 (0.0%) |
| 30 to 34 Minutes | 15 (3.4%) | 0 (0.0%) |
| 35 to 39 Minutes | 0 (0.0%) | 12 (3.2%) |
| 40 to 44 Minutes | 11 (2.5%) | 0 (0.0%) |
| 45 to 59 Minutes | 93 (21.2%) | 21 (5.6%) |
| 60 to 89 Minutes | 6 (1.4%) | 0 (0.0%) |
| 90 or more Minutes | 19 (4.3%) | 4 (1.1%) |
Time of Departure to Work by Sex in Webster
The most frequent times of departure to work in Webster are 7:00 AM to 7:29 AM (109, 24.9%) for males and 7:30 AM to 7:59 AM (87, 23.3%) for females.
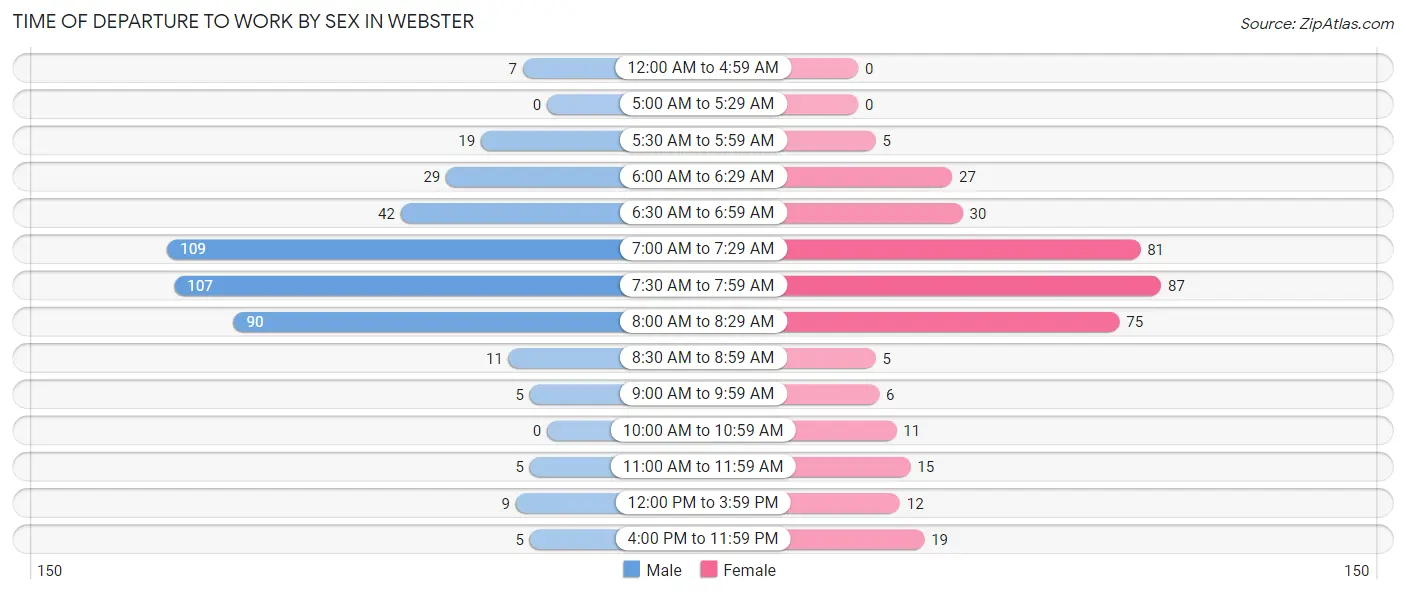
| Time of Departure | Male | Female |
| 12:00 AM to 4:59 AM | 7 (1.6%) | 0 (0.0%) |
| 5:00 AM to 5:29 AM | 0 (0.0%) | 0 (0.0%) |
| 5:30 AM to 5:59 AM | 19 (4.3%) | 5 (1.3%) |
| 6:00 AM to 6:29 AM | 29 (6.6%) | 27 (7.2%) |
| 6:30 AM to 6:59 AM | 42 (9.6%) | 30 (8.0%) |
| 7:00 AM to 7:29 AM | 109 (24.9%) | 81 (21.7%) |
| 7:30 AM to 7:59 AM | 107 (24.4%) | 87 (23.3%) |
| 8:00 AM to 8:29 AM | 90 (20.5%) | 75 (20.1%) |
| 8:30 AM to 8:59 AM | 11 (2.5%) | 5 (1.3%) |
| 9:00 AM to 9:59 AM | 5 (1.1%) | 6 (1.6%) |
| 10:00 AM to 10:59 AM | 0 (0.0%) | 11 (2.9%) |
| 11:00 AM to 11:59 AM | 5 (1.1%) | 15 (4.0%) |
| 12:00 PM to 3:59 PM | 9 (2.1%) | 12 (3.2%) |
| 4:00 PM to 11:59 PM | 5 (1.1%) | 19 (5.1%) |
| Total | 438 (100.0%) | 373 (100.0%) |
Housing Occupancy in Webster
Occupancy by Ownership in Webster
Of the total 834 dwellings in Webster, owner-occupied units account for 543 (65.1%), while renter-occupied units make up 291 (34.9%).
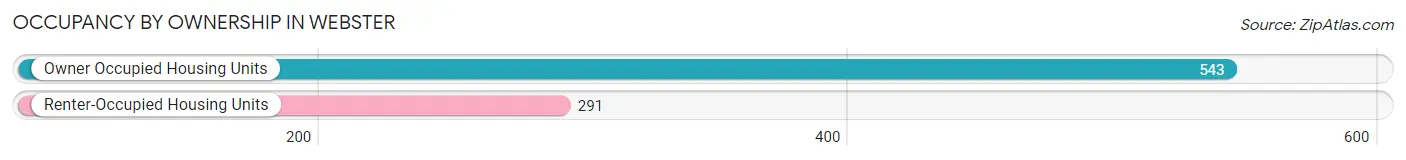
| Occupancy | # Housing Units | % Housing Units |
| Owner Occupied Housing Units | 543 | 65.1% |
| Renter-Occupied Housing Units | 291 | 34.9% |
| Total Occupied Housing Units | 834 | 100.0% |
Occupancy by Household Size in Webster
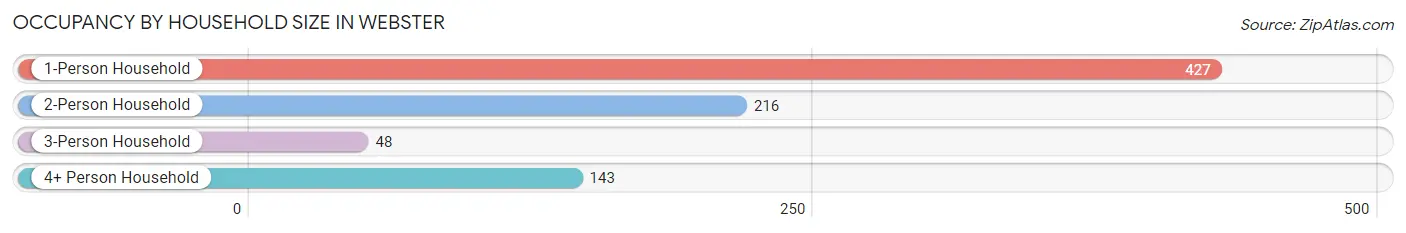
| Household Size | # Housing Units | % Housing Units |
| 1-Person Household | 427 | 51.2% |
| 2-Person Household | 216 | 25.9% |
| 3-Person Household | 48 | 5.8% |
| 4+ Person Household | 143 | 17.2% |
| Total Housing Units | 834 | 100.0% |
Occupancy by Ownership by Household Size in Webster
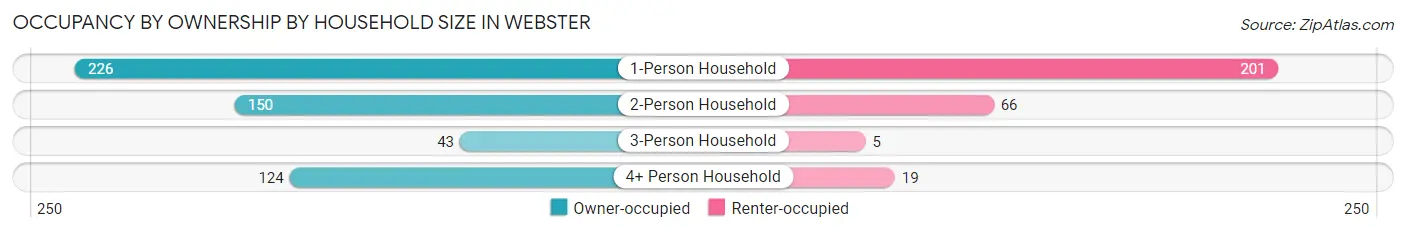
| Household Size | Owner-occupied | Renter-occupied |
| 1-Person Household | 226 (52.9%) | 201 (47.1%) |
| 2-Person Household | 150 (69.4%) | 66 (30.6%) |
| 3-Person Household | 43 (89.6%) | 5 (10.4%) |
| 4+ Person Household | 124 (86.7%) | 19 (13.3%) |
| Total Housing Units | 543 (65.1%) | 291 (34.9%) |
Occupancy by Educational Attainment in Webster
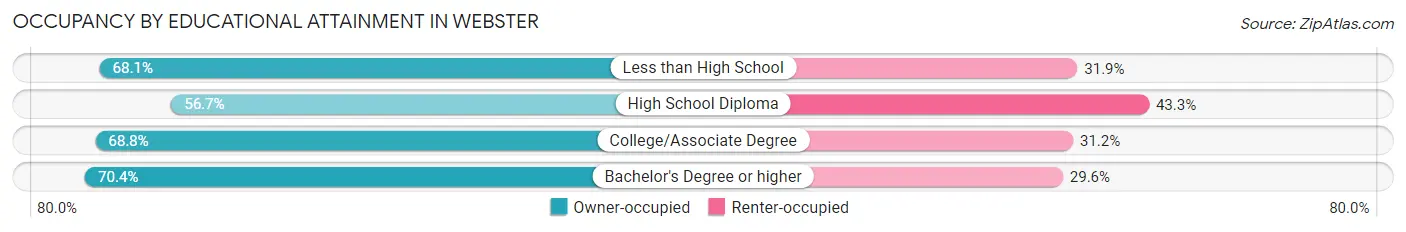
| Household Size | Owner-occupied | Renter-occupied |
| Less than High School | 32 (68.1%) | 15 (31.9%) |
| High School Diploma | 156 (56.7%) | 119 (43.3%) |
| College/Associate Degree | 229 (68.8%) | 104 (31.2%) |
| Bachelor's Degree or higher | 126 (70.4%) | 53 (29.6%) |
Occupancy by Age of Householder in Webster
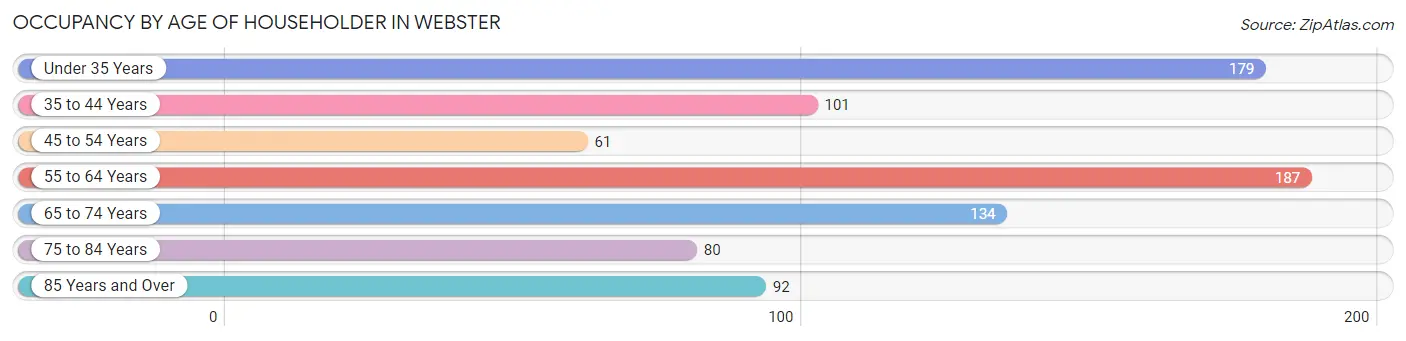
| Age Bracket | # Households | % Households |
| Under 35 Years | 179 | 21.5% |
| 35 to 44 Years | 101 | 12.1% |
| 45 to 54 Years | 61 | 7.3% |
| 55 to 64 Years | 187 | 22.4% |
| 65 to 74 Years | 134 | 16.1% |
| 75 to 84 Years | 80 | 9.6% |
| 85 Years and Over | 92 | 11.0% |
| Total | 834 | 100.0% |
Housing Finances in Webster
Median Income by Occupancy in Webster
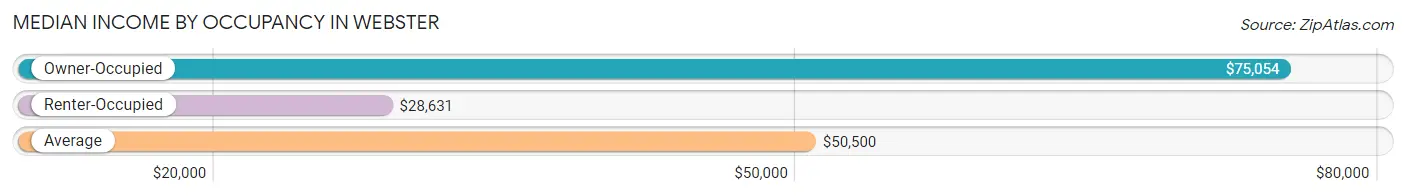
| Occupancy Type | # Households | Median Income |
| Owner-Occupied | 543 (65.1%) | $75,054 |
| Renter-Occupied | 291 (34.9%) | $28,631 |
| Average | 834 (100.0%) | $50,500 |
Occupancy by Householder Income Bracket in Webster
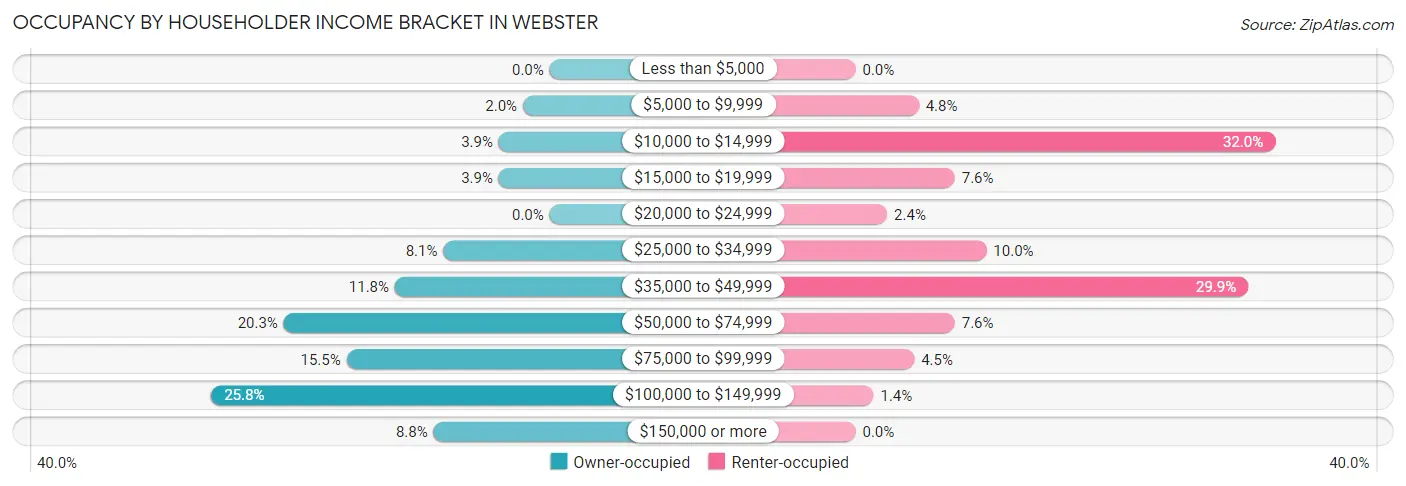
| Income Bracket | Owner-occupied | Renter-occupied |
| Less than $5,000 | 0 (0.0%) | 0 (0.0%) |
| $5,000 to $9,999 | 11 (2.0%) | 14 (4.8%) |
| $10,000 to $14,999 | 21 (3.9%) | 93 (32.0%) |
| $15,000 to $19,999 | 21 (3.9%) | 22 (7.6%) |
| $20,000 to $24,999 | 0 (0.0%) | 7 (2.4%) |
| $25,000 to $34,999 | 44 (8.1%) | 29 (10.0%) |
| $35,000 to $49,999 | 64 (11.8%) | 87 (29.9%) |
| $50,000 to $74,999 | 110 (20.3%) | 22 (7.6%) |
| $75,000 to $99,999 | 84 (15.5%) | 13 (4.5%) |
| $100,000 to $149,999 | 140 (25.8%) | 4 (1.4%) |
| $150,000 or more | 48 (8.8%) | 0 (0.0%) |
| Total | 543 (100.0%) | 291 (100.0%) |
Monthly Housing Cost Tiers in Webster
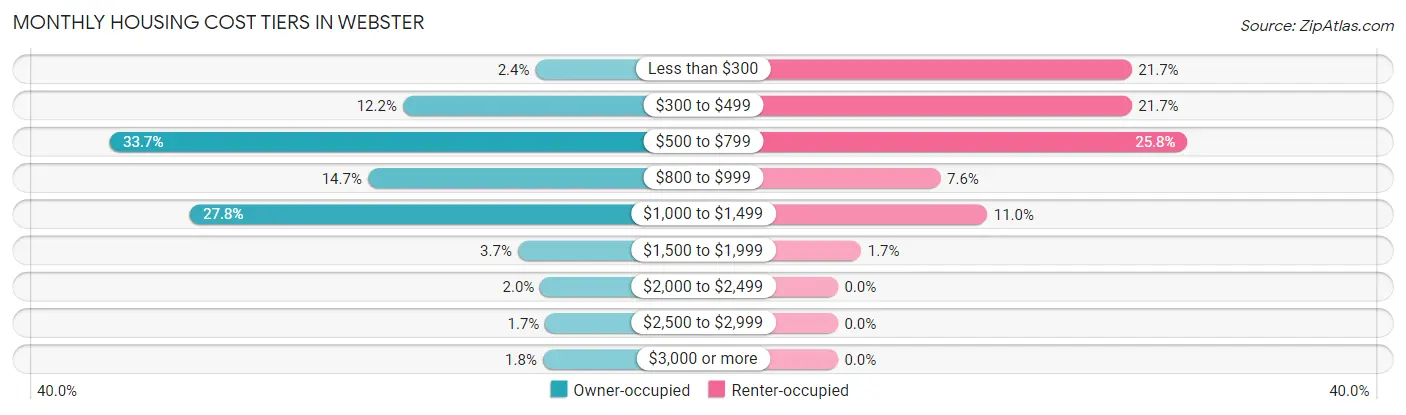
| Monthly Cost | Owner-occupied | Renter-occupied |
| Less than $300 | 13 (2.4%) | 63 (21.6%) |
| $300 to $499 | 66 (12.1%) | 63 (21.6%) |
| $500 to $799 | 183 (33.7%) | 75 (25.8%) |
| $800 to $999 | 80 (14.7%) | 22 (7.6%) |
| $1,000 to $1,499 | 151 (27.8%) | 32 (11.0%) |
| $1,500 to $1,999 | 20 (3.7%) | 5 (1.7%) |
| $2,000 to $2,499 | 11 (2.0%) | 0 (0.0%) |
| $2,500 to $2,999 | 9 (1.7%) | 0 (0.0%) |
| $3,000 or more | 10 (1.8%) | 0 (0.0%) |
| Total | 543 (100.0%) | 291 (100.0%) |
Physical Housing Characteristics in Webster
Housing Structures in Webster
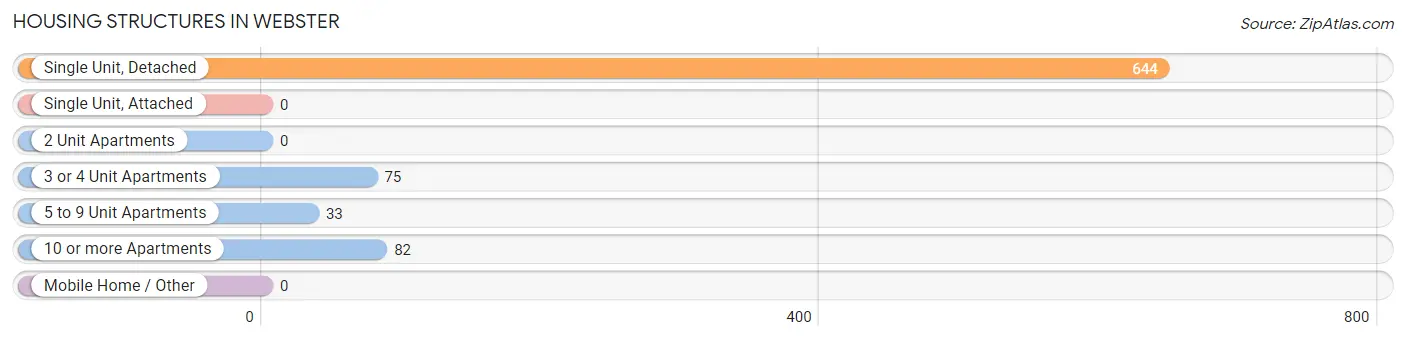
| Structure Type | # Housing Units | % Housing Units |
| Single Unit, Detached | 644 | 77.2% |
| Single Unit, Attached | 0 | 0.0% |
| 2 Unit Apartments | 0 | 0.0% |
| 3 or 4 Unit Apartments | 75 | 9.0% |
| 5 to 9 Unit Apartments | 33 | 4.0% |
| 10 or more Apartments | 82 | 9.8% |
| Mobile Home / Other | 0 | 0.0% |
| Total | 834 | 100.0% |
Housing Structures by Occupancy in Webster
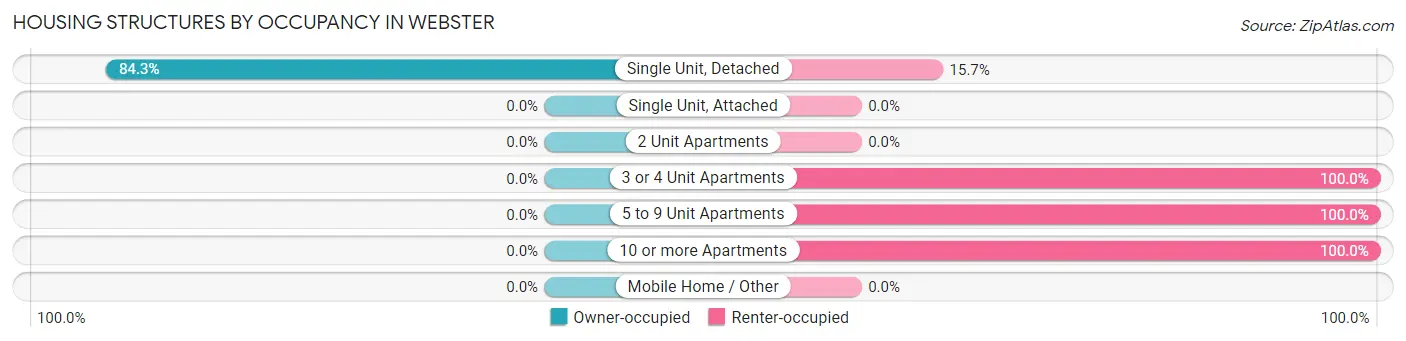
| Structure Type | Owner-occupied | Renter-occupied |
| Single Unit, Detached | 543 (84.3%) | 101 (15.7%) |
| Single Unit, Attached | 0 (0.0%) | 0 (0.0%) |
| 2 Unit Apartments | 0 (0.0%) | 0 (0.0%) |
| 3 or 4 Unit Apartments | 0 (0.0%) | 75 (100.0%) |
| 5 to 9 Unit Apartments | 0 (0.0%) | 33 (100.0%) |
| 10 or more Apartments | 0 (0.0%) | 82 (100.0%) |
| Mobile Home / Other | 0 (0.0%) | 0 (0.0%) |
| Total | 543 (65.1%) | 291 (34.9%) |
Housing Structures by Number of Rooms in Webster
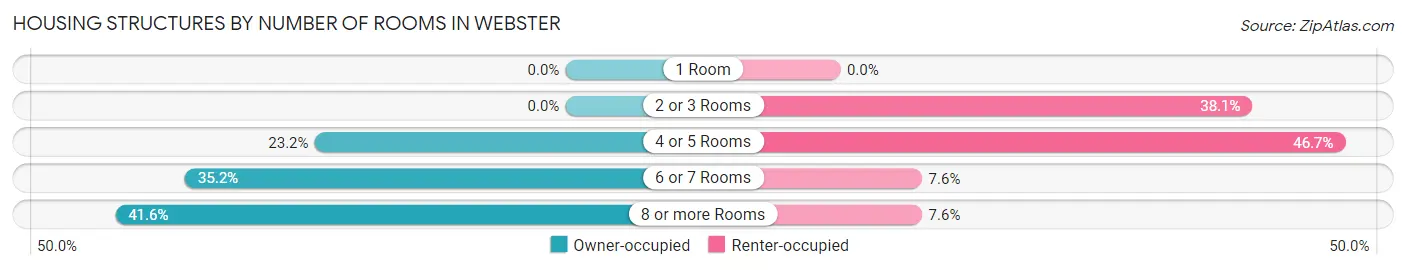
| Number of Rooms | Owner-occupied | Renter-occupied |
| 1 Room | 0 (0.0%) | 0 (0.0%) |
| 2 or 3 Rooms | 0 (0.0%) | 111 (38.1%) |
| 4 or 5 Rooms | 126 (23.2%) | 136 (46.7%) |
| 6 or 7 Rooms | 191 (35.2%) | 22 (7.6%) |
| 8 or more Rooms | 226 (41.6%) | 22 (7.6%) |
| Total | 543 (100.0%) | 291 (100.0%) |
Housing Structure by Heating Type in Webster
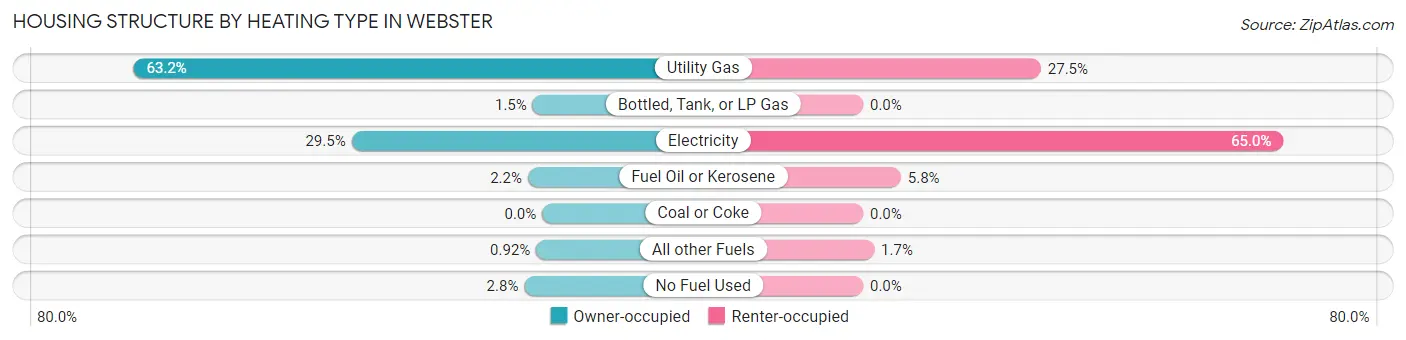
| Heating Type | Owner-occupied | Renter-occupied |
| Utility Gas | 343 (63.2%) | 80 (27.5%) |
| Bottled, Tank, or LP Gas | 8 (1.5%) | 0 (0.0%) |
| Electricity | 160 (29.5%) | 189 (64.9%) |
| Fuel Oil or Kerosene | 12 (2.2%) | 17 (5.8%) |
| Coal or Coke | 0 (0.0%) | 0 (0.0%) |
| All other Fuels | 5 (0.9%) | 5 (1.7%) |
| No Fuel Used | 15 (2.8%) | 0 (0.0%) |
| Total | 543 (100.0%) | 291 (100.0%) |
Household Vehicle Usage in Webster
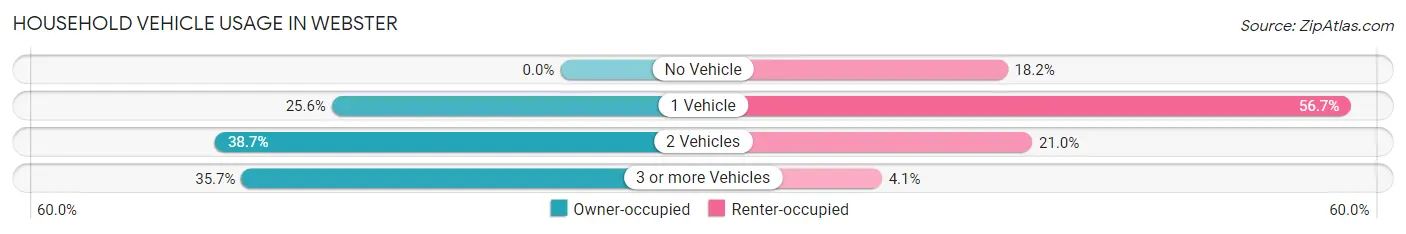
| Vehicles per Household | Owner-occupied | Renter-occupied |
| No Vehicle | 0 (0.0%) | 53 (18.2%) |
| 1 Vehicle | 139 (25.6%) | 165 (56.7%) |
| 2 Vehicles | 210 (38.7%) | 61 (21.0%) |
| 3 or more Vehicles | 194 (35.7%) | 12 (4.1%) |
| Total | 543 (100.0%) | 291 (100.0%) |
Real Estate & Mortgages in Webster
Real Estate and Mortgage Overview in Webster
| Characteristic | Without Mortgage | With Mortgage |
| Housing Units | 225 | 318 |
| Median Property Value | $114,300 | $116,700 |
| Median Household Income | $57,188 | $36 |
| Monthly Housing Costs | $549 | $10 |
| Real Estate Taxes | $1,515 | $0 |
Property Value by Mortgage Status in Webster
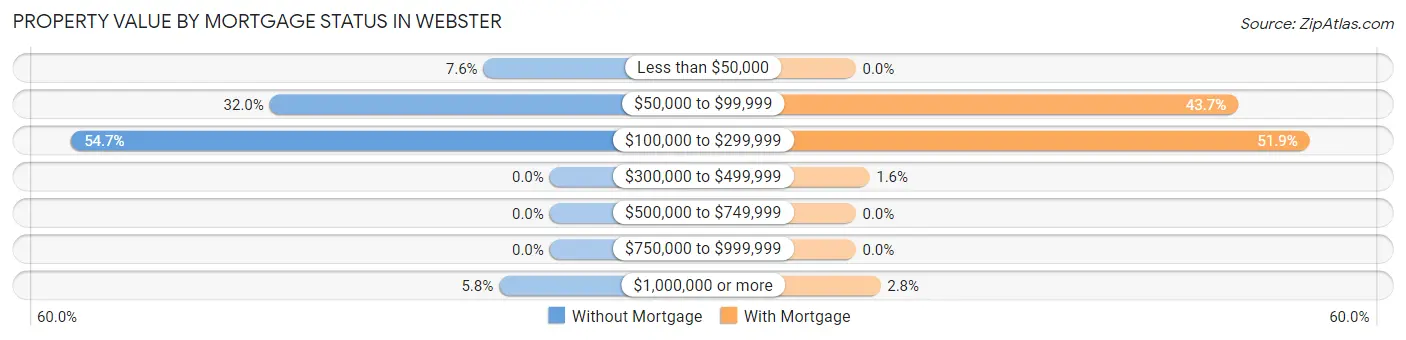
| Property Value | Without Mortgage | With Mortgage |
| Less than $50,000 | 17 (7.6%) | 0 (0.0%) |
| $50,000 to $99,999 | 72 (32.0%) | 139 (43.7%) |
| $100,000 to $299,999 | 123 (54.7%) | 165 (51.9%) |
| $300,000 to $499,999 | 0 (0.0%) | 5 (1.6%) |
| $500,000 to $749,999 | 0 (0.0%) | 0 (0.0%) |
| $750,000 to $999,999 | 0 (0.0%) | 0 (0.0%) |
| $1,000,000 or more | 13 (5.8%) | 9 (2.8%) |
| Total | 225 (100.0%) | 318 (100.0%) |
Household Income by Mortgage Status in Webster
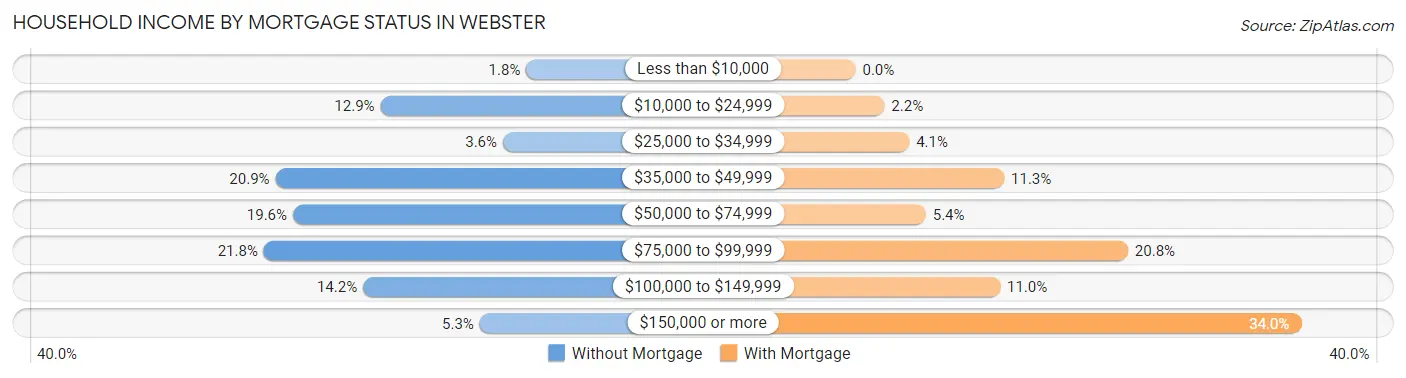
| Household Income | Without Mortgage | With Mortgage |
| Less than $10,000 | 4 (1.8%) | 0 (0.0%) |
| $10,000 to $24,999 | 29 (12.9%) | 7 (2.2%) |
| $25,000 to $34,999 | 8 (3.6%) | 13 (4.1%) |
| $35,000 to $49,999 | 47 (20.9%) | 36 (11.3%) |
| $50,000 to $74,999 | 44 (19.6%) | 17 (5.3%) |
| $75,000 to $99,999 | 49 (21.8%) | 66 (20.7%) |
| $100,000 to $149,999 | 32 (14.2%) | 35 (11.0%) |
| $150,000 or more | 12 (5.3%) | 108 (34.0%) |
| Total | 225 (100.0%) | 318 (100.0%) |
Property Value to Household Income Ratio in Webster
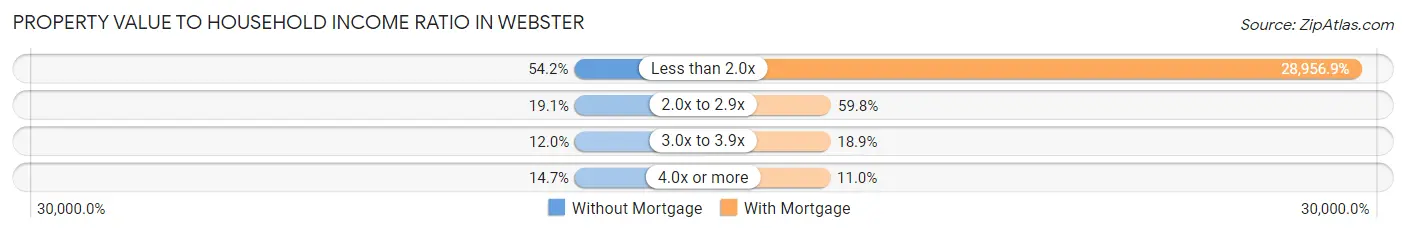
| Value-to-Income Ratio | Without Mortgage | With Mortgage |
| Less than 2.0x | 122 (54.2%) | 92,083 (28,956.9%) |
| 2.0x to 2.9x | 43 (19.1%) | 190 (59.8%) |
| 3.0x to 3.9x | 27 (12.0%) | 60 (18.9%) |
| 4.0x or more | 33 (14.7%) | 35 (11.0%) |
| Total | 225 (100.0%) | 318 (100.0%) |
Real Estate Taxes by Mortgage Status in Webster
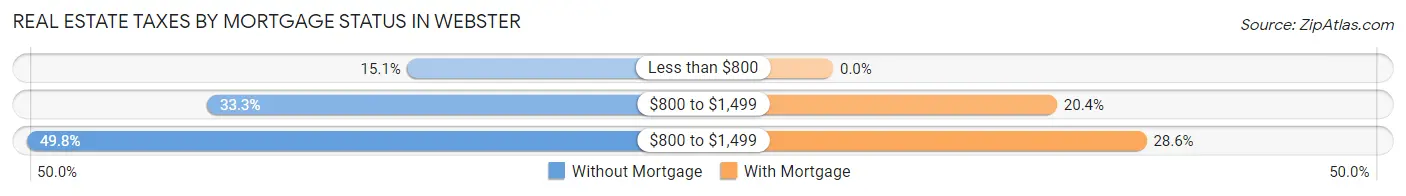
| Property Taxes | Without Mortgage | With Mortgage |
| Less than $800 | 34 (15.1%) | 0 (0.0%) |
| $800 to $1,499 | 75 (33.3%) | 65 (20.4%) |
| $800 to $1,499 | 112 (49.8%) | 91 (28.6%) |
| Total | 225 (100.0%) | 318 (100.0%) |
Health & Disability in Webster
Health Insurance Coverage by Age in Webster
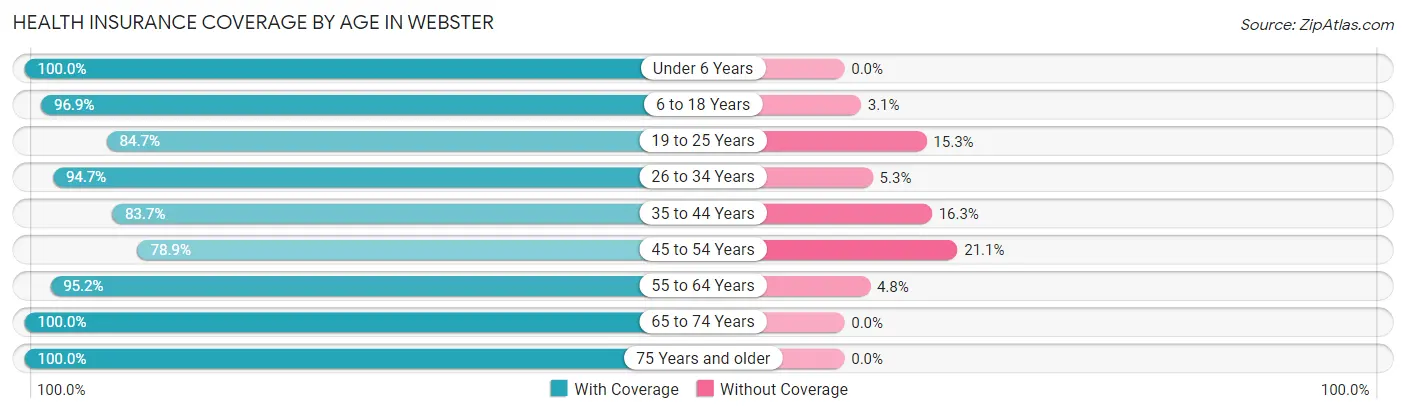
| Age Bracket | With Coverage | Without Coverage |
| Under 6 Years | 112 (100.0%) | 0 (0.0%) |
| 6 to 18 Years | 220 (96.9%) | 7 (3.1%) |
| 19 to 25 Years | 166 (84.7%) | 30 (15.3%) |
| 26 to 34 Years | 179 (94.7%) | 10 (5.3%) |
| 35 to 44 Years | 154 (83.7%) | 30 (16.3%) |
| 45 to 54 Years | 131 (78.9%) | 35 (21.1%) |
| 55 to 64 Years | 239 (95.2%) | 12 (4.8%) |
| 65 to 74 Years | 181 (100.0%) | 0 (0.0%) |
| 75 Years and older | 219 (100.0%) | 0 (0.0%) |
| Total | 1,601 (92.8%) | 124 (7.2%) |
Health Insurance Coverage by Citizenship Status in Webster
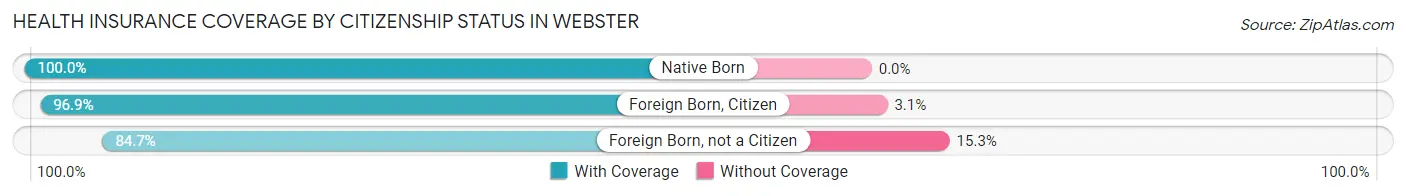
| Citizenship Status | With Coverage | Without Coverage |
| Native Born | 112 (100.0%) | 0 (0.0%) |
| Foreign Born, Citizen | 220 (96.9%) | 7 (3.1%) |
| Foreign Born, not a Citizen | 166 (84.7%) | 30 (15.3%) |
Health Insurance Coverage by Household Income in Webster
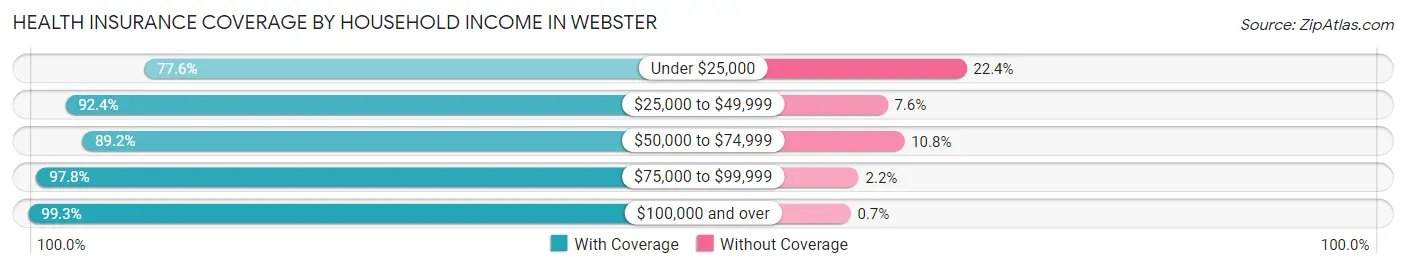
| Household Income | With Coverage | Without Coverage |
| Under $25,000 | 194 (77.6%) | 56 (22.4%) |
| $25,000 to $49,999 | 291 (92.4%) | 24 (7.6%) |
| $50,000 to $74,999 | 282 (89.2%) | 34 (10.8%) |
| $75,000 to $99,999 | 266 (97.8%) | 6 (2.2%) |
| $100,000 and over | 568 (99.3%) | 4 (0.7%) |
Public vs Private Health Insurance Coverage by Age in Webster
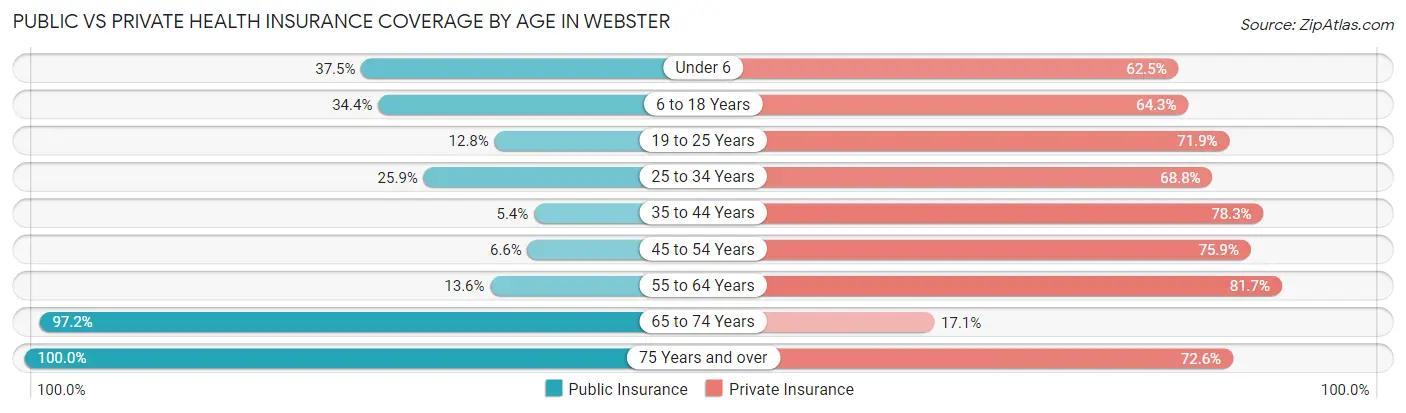
| Age Bracket | Public Insurance | Private Insurance |
| Under 6 | 42 (37.5%) | 70 (62.5%) |
| 6 to 18 Years | 78 (34.4%) | 146 (64.3%) |
| 19 to 25 Years | 25 (12.8%) | 141 (71.9%) |
| 25 to 34 Years | 49 (25.9%) | 130 (68.8%) |
| 35 to 44 Years | 10 (5.4%) | 144 (78.3%) |
| 45 to 54 Years | 11 (6.6%) | 126 (75.9%) |
| 55 to 64 Years | 34 (13.6%) | 205 (81.7%) |
| 65 to 74 Years | 176 (97.2%) | 31 (17.1%) |
| 75 Years and over | 219 (100.0%) | 159 (72.6%) |
| Total | 644 (37.3%) | 1,152 (66.8%) |
Disability Status by Sex by Age in Webster
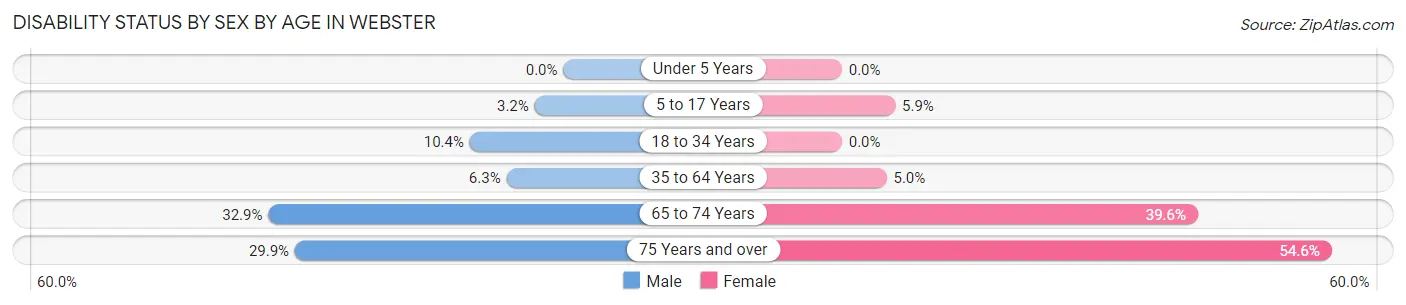
| Age Bracket | Male | Female |
| Under 5 Years | 0 (0.0%) | 0 (0.0%) |
| 5 to 17 Years | 4 (3.2%) | 6 (5.9%) |
| 18 to 34 Years | 25 (10.4%) | 0 (0.0%) |
| 35 to 64 Years | 19 (6.3%) | 15 (5.0%) |
| 65 to 74 Years | 23 (32.9%) | 44 (39.6%) |
| 75 Years and over | 26 (29.9%) | 72 (54.5%) |
Disability Class by Sex by Age in Webster
Disability Class: Hearing Difficulty
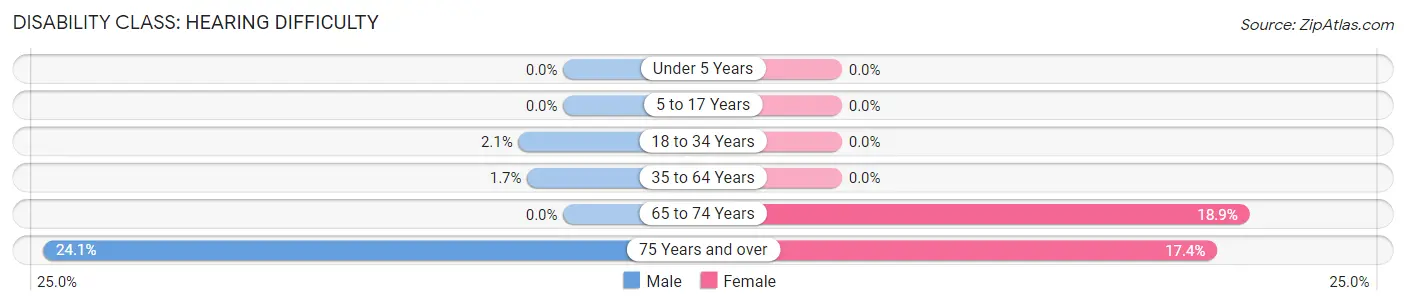
| Age Bracket | Male | Female |
| Under 5 Years | 0 (0.0%) | 0 (0.0%) |
| 5 to 17 Years | 0 (0.0%) | 0 (0.0%) |
| 18 to 34 Years | 5 (2.1%) | 0 (0.0%) |
| 35 to 64 Years | 5 (1.7%) | 0 (0.0%) |
| 65 to 74 Years | 0 (0.0%) | 21 (18.9%) |
| 75 Years and over | 21 (24.1%) | 23 (17.4%) |
Disability Class: Vision Difficulty
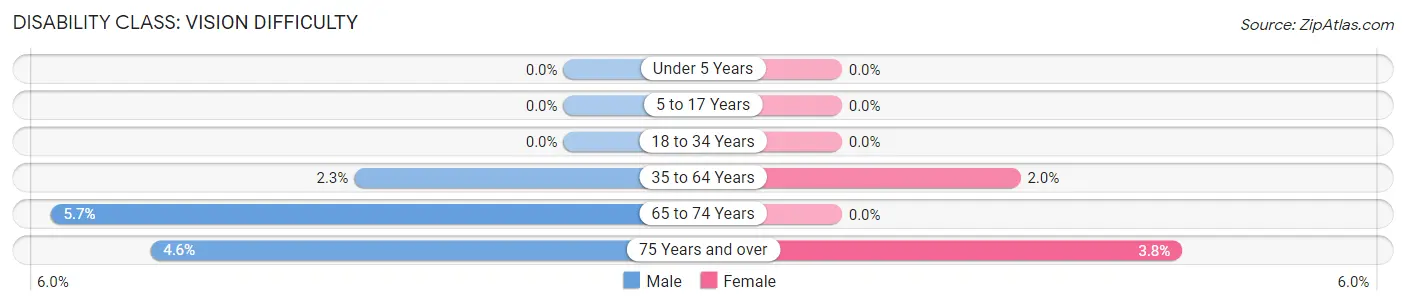
| Age Bracket | Male | Female |
| Under 5 Years | 0 (0.0%) | 0 (0.0%) |
| 5 to 17 Years | 0 (0.0%) | 0 (0.0%) |
| 18 to 34 Years | 0 (0.0%) | 0 (0.0%) |
| 35 to 64 Years | 7 (2.3%) | 6 (2.0%) |
| 65 to 74 Years | 4 (5.7%) | 0 (0.0%) |
| 75 Years and over | 4 (4.6%) | 5 (3.8%) |
Disability Class: Cognitive Difficulty
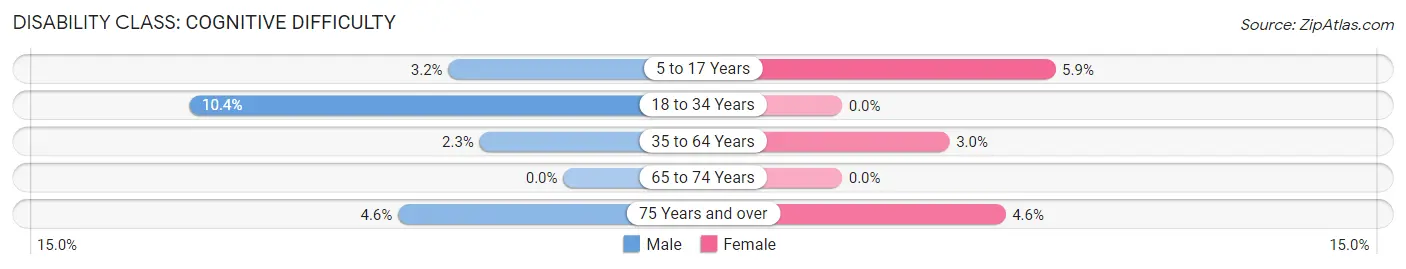
| Age Bracket | Male | Female |
| 5 to 17 Years | 4 (3.2%) | 6 (5.9%) |
| 18 to 34 Years | 25 (10.4%) | 0 (0.0%) |
| 35 to 64 Years | 7 (2.3%) | 9 (3.0%) |
| 65 to 74 Years | 0 (0.0%) | 0 (0.0%) |
| 75 Years and over | 4 (4.6%) | 6 (4.5%) |
Disability Class: Ambulatory Difficulty
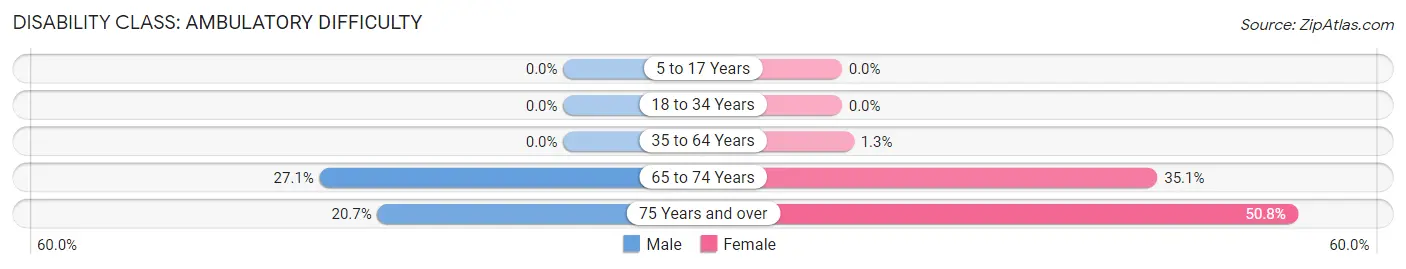
| Age Bracket | Male | Female |
| 5 to 17 Years | 0 (0.0%) | 0 (0.0%) |
| 18 to 34 Years | 0 (0.0%) | 0 (0.0%) |
| 35 to 64 Years | 0 (0.0%) | 4 (1.3%) |
| 65 to 74 Years | 19 (27.1%) | 39 (35.1%) |
| 75 Years and over | 18 (20.7%) | 67 (50.8%) |
Disability Class: Self-Care Difficulty
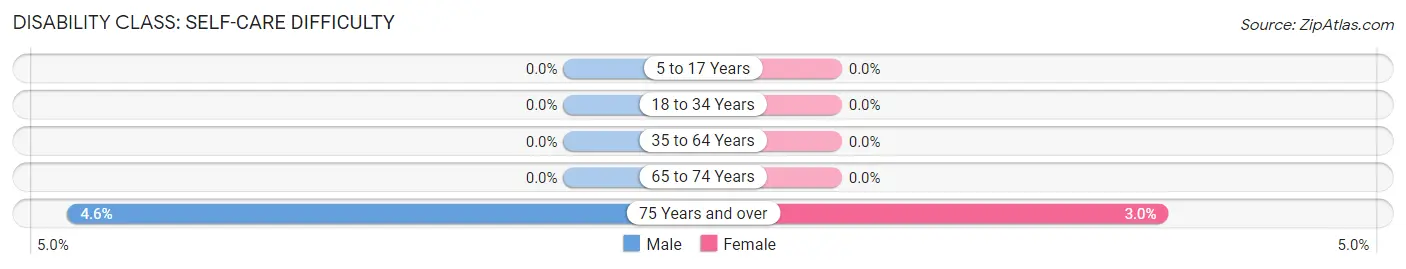
| Age Bracket | Male | Female |
| 5 to 17 Years | 0 (0.0%) | 0 (0.0%) |
| 18 to 34 Years | 0 (0.0%) | 0 (0.0%) |
| 35 to 64 Years | 0 (0.0%) | 0 (0.0%) |
| 65 to 74 Years | 0 (0.0%) | 0 (0.0%) |
| 75 Years and over | 4 (4.6%) | 4 (3.0%) |
Technology Access in Webster
Computing Device Access in Webster
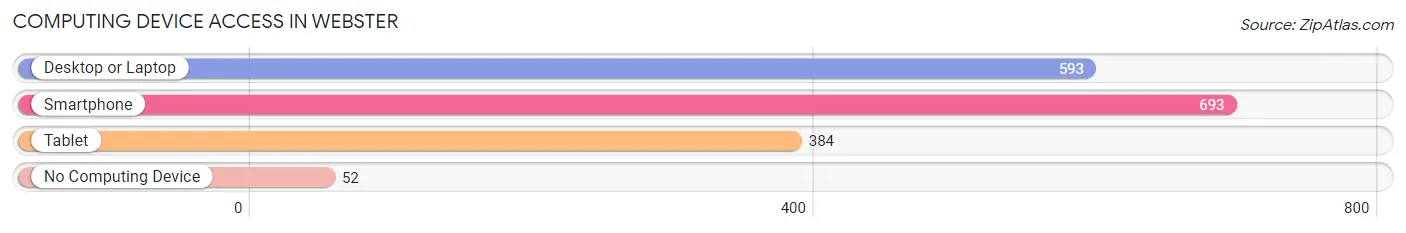
| Device Type | # Households | % Households |
| Desktop or Laptop | 593 | 71.1% |
| Smartphone | 693 | 83.1% |
| Tablet | 384 | 46.0% |
| No Computing Device | 52 | 6.2% |
| Total | 834 | 100.0% |
Internet Access in Webster
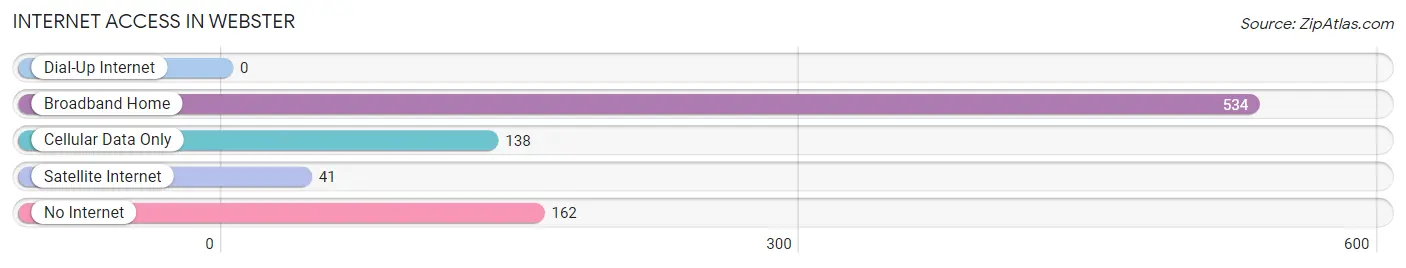
| Internet Type | # Households | % Households |
| Dial-Up Internet | 0 | 0.0% |
| Broadband Home | 534 | 64.0% |
| Cellular Data Only | 138 | 16.6% |
| Satellite Internet | 41 | 4.9% |
| No Internet | 162 | 19.4% |
| Total | 834 | 100.0% |
Webster Summary
Webster is a small city located in Day County, South Dakota. It is situated on the eastern edge of the state, near the border with Minnesota. The city has a population of 1,845 people, according to the 2010 census.
Geography
Webster is located in the northeastern corner of South Dakota, near the border with Minnesota. It is situated on the eastern edge of the state, near the Big Sioux River. The city is located in the Coteau des Prairies, a region of rolling hills and prairies. The city is surrounded by agricultural land, with corn, soybeans, and wheat being the main crops.
The climate in Webster is continental, with cold winters and hot summers. The average temperature in January is around 10°F, while the average temperature in July is around 75°F. The average annual precipitation is around 22 inches.
Economy
The economy of Webster is largely based on agriculture. The city is home to several large farms, which produce corn, soybeans, and wheat. The city also has a number of small businesses, including restaurants, retail stores, and service providers.
The city is also home to several manufacturing companies, including a plastics manufacturer and a metal fabrication company. The city is also home to a number of government offices, including the Day County Courthouse and the Day County Sheriff's Office.
Demographics
According to the 2010 census, the population of Webster was 1,845 people. The racial makeup of the city was 97.3% White, 0.7% African American, 0.3% Native American, 0.2% Asian, 0.1% Pacific Islander, and 1.4% from other races. The median household income was $41,250, and the median family income was $50,000.
The city is served by the Webster Area School District, which includes two elementary schools, one middle school, and one high school. The city is also home to a number of churches, including the United Methodist Church, the Lutheran Church, and the Catholic Church.
Conclusion
Webster is a small city located in Day County, South Dakota. It is situated on the eastern edge of the state, near the border with Minnesota. The city has a population of 1,845 people, according to the 2010 census. The economy of Webster is largely based on agriculture, with corn, soybeans, and wheat being the main crops. The city is also home to several manufacturing companies, government offices, and churches. The city is served by the Webster Area School District, which includes two elementary schools, one middle school, and one high school.
Common Questions
What is Per Capita Income in Webster?
Per Capita income in Webster is $32,367.
What is the Median Family Income in Webster?
Median Family Income in Webster is $81,750.
What is the Median Household income in Webster?
Median Household Income in Webster is $50,500.
What is Income or Wage Gap in Webster?
Income or Wage Gap in Webster is 43.9%.
Women in Webster earn 56.1 cents for every dollar earned by a man.
What is Inequality or Gini Index in Webster?
Inequality or Gini Index in Webster is 0.42.
What is the Total Population of Webster?
Total Population of Webster is 1,805.
What is the Total Male Population of Webster?
Total Male Population of Webster is 911.
What is the Total Female Population of Webster?
Total Female Population of Webster is 894.
What is the Ratio of Males per 100 Females in Webster?
There are 101.90 Males per 100 Females in Webster.
What is the Ratio of Females per 100 Males in Webster?
There are 98.13 Females per 100 Males in Webster.
What is the Median Population Age in Webster?
Median Population Age in Webster is 42.8 Years.
What is the Average Family Size in Webster
Average Family Size in Webster is 3.1 People.
What is the Average Household Size in Webster
Average Household Size in Webster is 2.1 People.
How Large is the Labor Force in Webster?
There are 900 People in the Labor Forcein in Webster.
What is the Percentage of People in the Labor Force in Webster?
59.1% of People are in the Labor Force in Webster.
What is the Unemployment Rate in Webster?
Unemployment Rate in Webster is 1.3%.