Wallace, SD Map & Demographics
Wallace Map
Wallace Overview
$22,060
PER CAPITA INCOME
$75,833
AVG FAMILY INCOME
$68,750
AVG HOUSEHOLD INCOME
56.0%
WAGE / INCOME GAP [ % ]
44.0¢/ $1
WAGE / INCOME GAP [ $ ]
0.24
INEQUALITY / GINI INDEX
68
TOTAL POPULATION
32
MALE POPULATION
36
FEMALE POPULATION
88.89
MALES / 100 FEMALES
112.50
FEMALES / 100 MALES
43.8
MEDIAN AGE
3.3
AVG FAMILY SIZE
2.8
AVG HOUSEHOLD SIZE
28
LABOR FORCE [ PEOPLE ]
58.3%
PERCENT IN LABOR FORCE
Wallace Zip Codes
Wallace Area Codes
Income in Wallace
Income Overview in Wallace
Per Capita Income in Wallace is $22,060, while median incomes of families and households are $75,833 and $68,750 respectively.
| Characteristic | Number | Measure |
| Per Capita Income | 68 | $22,060 |
| Median Family Income | 18 | $75,833 |
| Mean Family Income | 18 | $68,967 |
| Median Household Income | 24 | $68,750 |
| Mean Household Income | 24 | $60,525 |
| Income Deficit | 18 | $0 |
| Wage / Income Gap (%) | 68 | 56.02% |
| Wage / Income Gap ($) | 68 | 43.98¢ per $1 |
| Gini / Inequality Index | 68 | 0.24 |
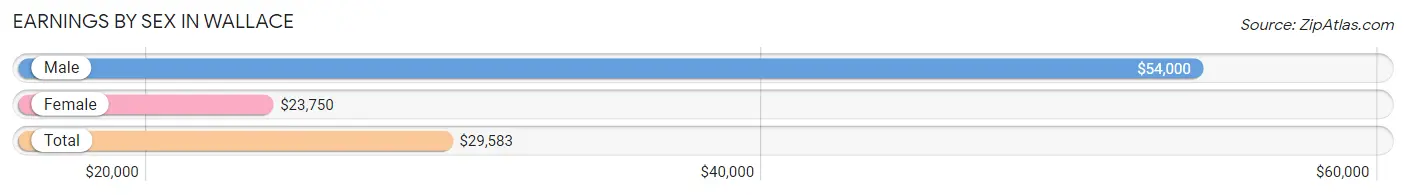
Earnings by Sex in Wallace
Average Earnings in Wallace are $29,583, $54,000 for men and $23,750 for women, a difference of 56.0%.
| Sex | Number | Average Earnings |
| Male | 16 (51.6%) | $54,000 |
| Female | 15 (48.4%) | $23,750 |
| Total | 31 (100.0%) | $29,583 |
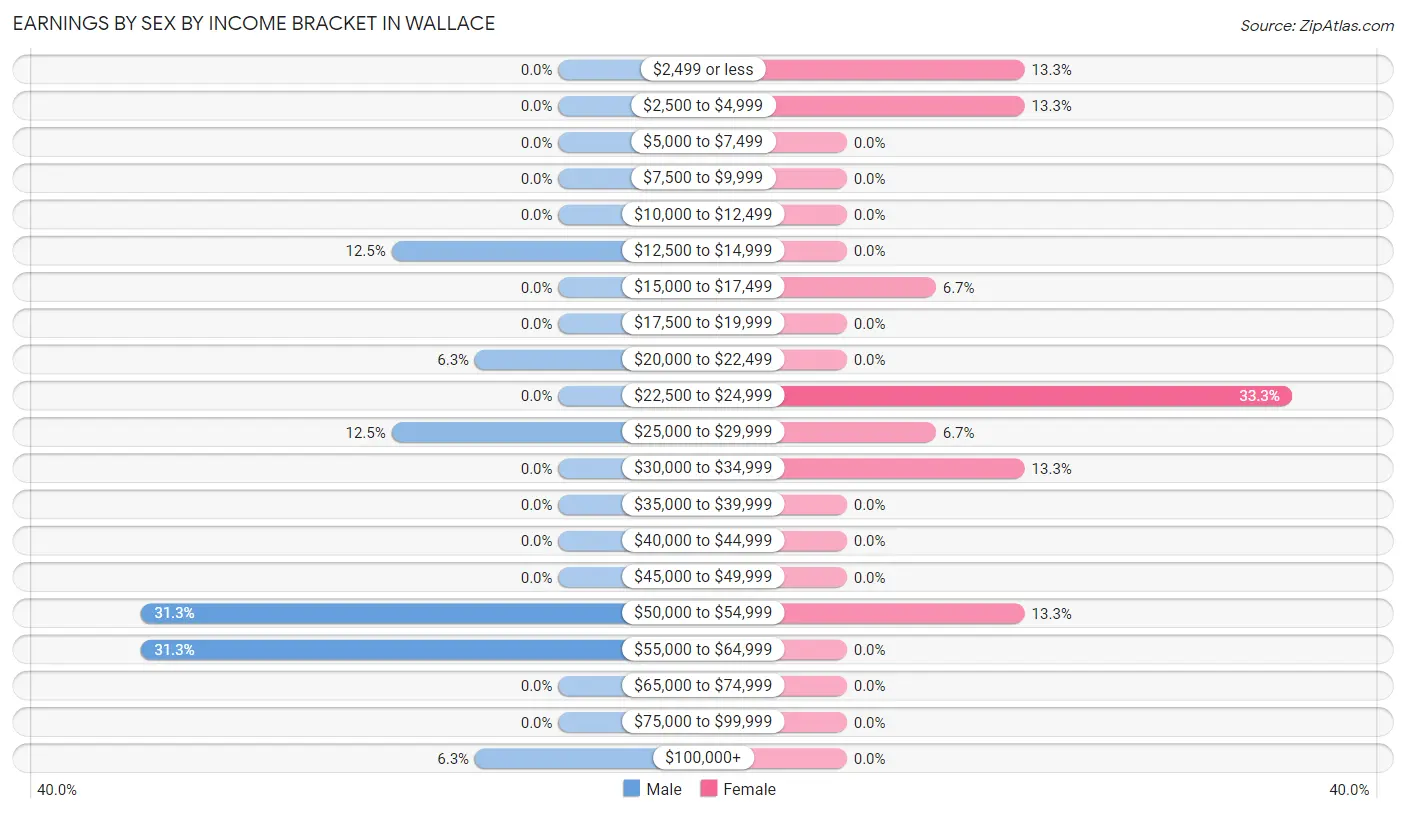
Earnings by Sex by Income Bracket in Wallace
The most common earnings brackets in Wallace are $50,000 to $54,999 for men (5 | 31.2%) and $22,500 to $24,999 for women (5 | 33.3%).
| Income | Male | Female |
| $2,499 or less | 0 (0.0%) | 2 (13.3%) |
| $2,500 to $4,999 | 0 (0.0%) | 2 (13.3%) |
| $5,000 to $7,499 | 0 (0.0%) | 0 (0.0%) |
| $7,500 to $9,999 | 0 (0.0%) | 0 (0.0%) |
| $10,000 to $12,499 | 0 (0.0%) | 0 (0.0%) |
| $12,500 to $14,999 | 2 (12.5%) | 0 (0.0%) |
| $15,000 to $17,499 | 0 (0.0%) | 1 (6.7%) |
| $17,500 to $19,999 | 0 (0.0%) | 0 (0.0%) |
| $20,000 to $22,499 | 1 (6.2%) | 0 (0.0%) |
| $22,500 to $24,999 | 0 (0.0%) | 5 (33.3%) |
| $25,000 to $29,999 | 2 (12.5%) | 1 (6.7%) |
| $30,000 to $34,999 | 0 (0.0%) | 2 (13.3%) |
| $35,000 to $39,999 | 0 (0.0%) | 0 (0.0%) |
| $40,000 to $44,999 | 0 (0.0%) | 0 (0.0%) |
| $45,000 to $49,999 | 0 (0.0%) | 0 (0.0%) |
| $50,000 to $54,999 | 5 (31.2%) | 2 (13.3%) |
| $55,000 to $64,999 | 5 (31.2%) | 0 (0.0%) |
| $65,000 to $74,999 | 0 (0.0%) | 0 (0.0%) |
| $75,000 to $99,999 | 0 (0.0%) | 0 (0.0%) |
| $100,000+ | 1 (6.2%) | 0 (0.0%) |
| Total | 16 (100.0%) | 15 (100.0%) |
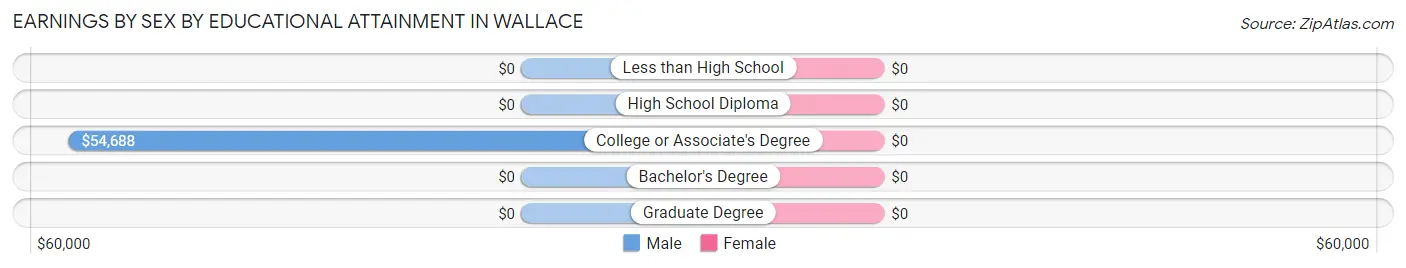
Earnings by Sex by Educational Attainment in Wallace
| Educational Attainment | Male Income | Female Income |
| Less than High School | - | - |
| High School Diploma | - | - |
| College or Associate's Degree | $54,688 | $0 |
| Bachelor's Degree | - | - |
| Graduate Degree | - | - |
| Total | $54,000 | $23,750 |
Family Income in Wallace
Family Income Brackets in Wallace
According to the Wallace family income data, there are 10 families falling into the $75,000 to $99,999 income range, which is the most common income bracket and makes up 55.6% of all families.
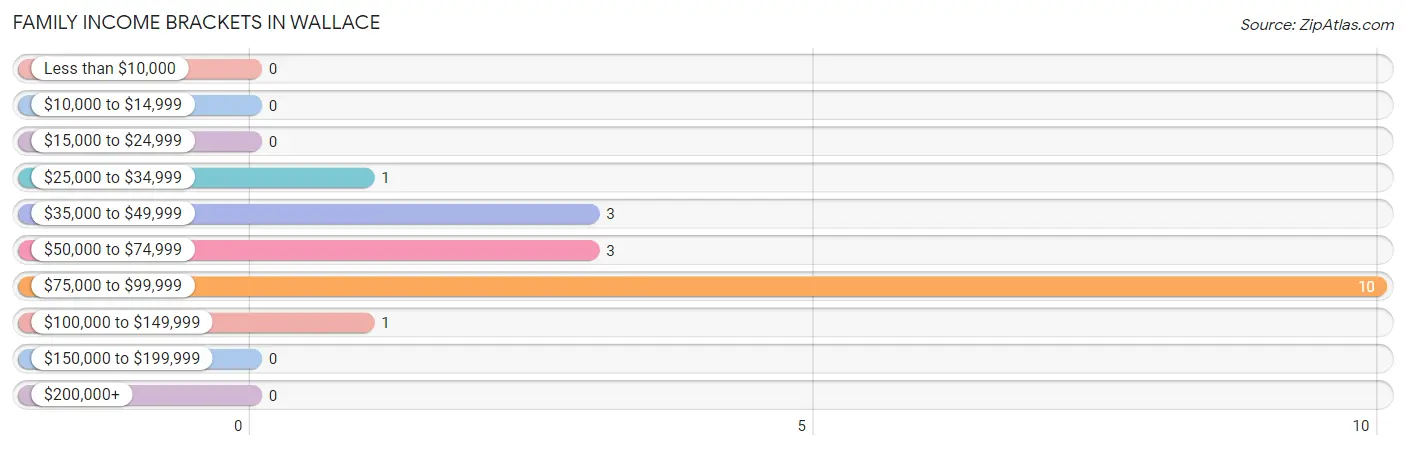
| Income Bracket | # Families | % Families |
| Less than $10,000 | 0 | 0.0% |
| $10,000 to $14,999 | 0 | 0.0% |
| $15,000 to $24,999 | 0 | 0.0% |
| $25,000 to $34,999 | 1 | 5.6% |
| $35,000 to $49,999 | 3 | 16.7% |
| $50,000 to $74,999 | 3 | 16.7% |
| $75,000 to $99,999 | 10 | 55.6% |
| $100,000 to $149,999 | 1 | 5.6% |
| $150,000 to $199,999 | 0 | 0.0% |
| $200,000+ | 0 | 0.0% |
Family Income by Famaliy Size in Wallace
2-person families (10 | 55.6%) account for the highest median family income in Wallace with $70,000 per family, while 2-person families (10 | 55.6%) have the highest median income of $35,000 per family member.
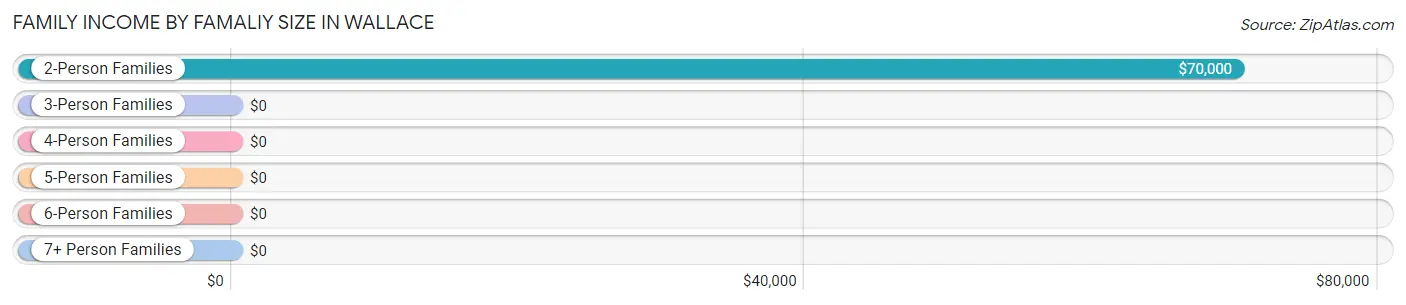
| Income Bracket | # Families | Median Income |
| 2-Person Families | 10 (55.6%) | $70,000 |
| 3-Person Families | 1 (5.6%) | $0 |
| 4-Person Families | 1 (5.6%) | $0 |
| 5-Person Families | 0 (0.0%) | $0 |
| 6-Person Families | 6 (33.3%) | $0 |
| 7+ Person Families | 0 (0.0%) | $0 |
| Total | 18 (100.0%) | $75,833 |
Family Income by Number of Earners in Wallace
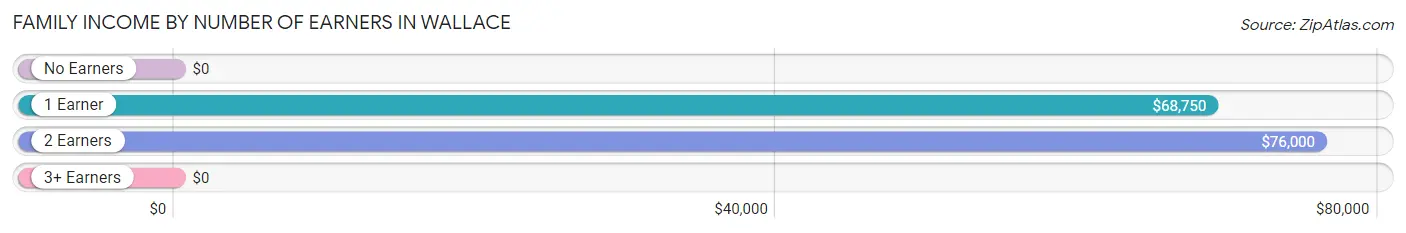
| Number of Earners | # Families | Median Income |
| No Earners | 2 (11.1%) | $0 |
| 1 Earner | 8 (44.4%) | $68,750 |
| 2 Earners | 8 (44.4%) | $76,000 |
| 3+ Earners | 0 (0.0%) | $0 |
| Total | 18 (100.0%) | $75,833 |
Household Income in Wallace
Household Income Brackets in Wallace
With 10 households falling in the category, the $75,000 to $99,999 income range is the most frequent in Wallace, accounting for 41.7% of all households.
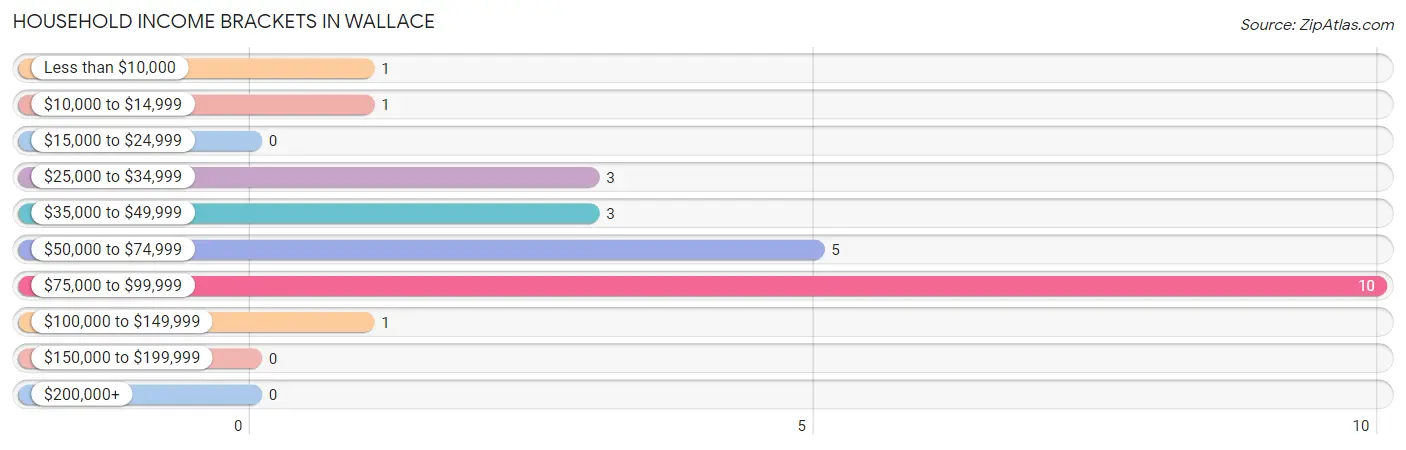
| Income Bracket | # Households | % Households |
| Less than $10,000 | 1 | 4.2% |
| $10,000 to $14,999 | 1 | 4.2% |
| $15,000 to $24,999 | 0 | 0.0% |
| $25,000 to $34,999 | 3 | 12.5% |
| $35,000 to $49,999 | 3 | 12.5% |
| $50,000 to $74,999 | 5 | 20.8% |
| $75,000 to $99,999 | 10 | 41.7% |
| $100,000 to $149,999 | 1 | 4.2% |
| $150,000 to $199,999 | 0 | 0.0% |
| $200,000+ | 0 | 0.0% |
Household Income by Householder Age in Wallace
The median household income in Wallace is $68,750, with the highest median household income of $69,375 found in the 25 to 44 years age bracket for the primary householder. A total of 11 households (45.8%) fall into this category.
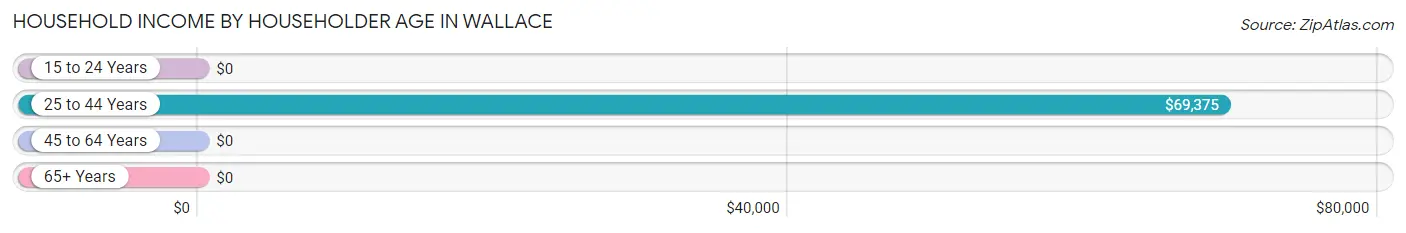
| Income Bracket | # Households | Median Income |
| 15 to 24 Years | 0 (0.0%) | $0 |
| 25 to 44 Years | 11 (45.8%) | $69,375 |
| 45 to 64 Years | 2 (8.3%) | $0 |
| 65+ Years | 11 (45.8%) | $0 |
| Total | 24 (100.0%) | $68,750 |
Poverty in Wallace
Income Below Poverty by Sex and Age in Wallace
With 9.4% poverty level for males and 2.8% for females among the residents of Wallace, 25 to 34 year old males and 75 year old and over females are the most vulnerable to poverty, with 2 males (100.0%) and 1 females (16.7%) in their respective age groups living below the poverty level.
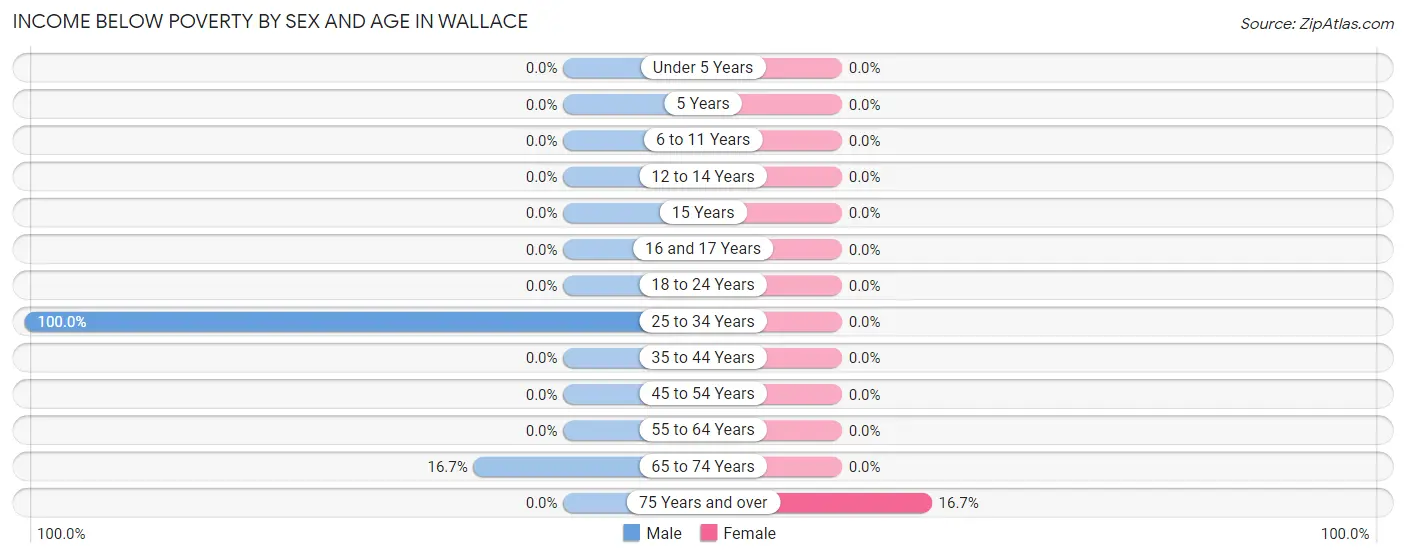
| Age Bracket | Male | Female |
| Under 5 Years | 0 (0.0%) | 0 (0.0%) |
| 5 Years | 0 (0.0%) | 0 (0.0%) |
| 6 to 11 Years | 0 (0.0%) | 0 (0.0%) |
| 12 to 14 Years | 0 (0.0%) | 0 (0.0%) |
| 15 Years | 0 (0.0%) | 0 (0.0%) |
| 16 and 17 Years | 0 (0.0%) | 0 (0.0%) |
| 18 to 24 Years | 0 (0.0%) | 0 (0.0%) |
| 25 to 34 Years | 2 (100.0%) | 0 (0.0%) |
| 35 to 44 Years | 0 (0.0%) | 0 (0.0%) |
| 45 to 54 Years | 0 (0.0%) | 0 (0.0%) |
| 55 to 64 Years | 0 (0.0%) | 0 (0.0%) |
| 65 to 74 Years | 1 (16.7%) | 0 (0.0%) |
| 75 Years and over | 0 (0.0%) | 1 (16.7%) |
| Total | 3 (9.4%) | 1 (2.8%) |
Income Above Poverty by Sex and Age in Wallace
According to the poverty statistics in Wallace, males aged under 5 years and females aged 6 to 11 years are the age groups that are most secure financially, with 100.0% of males and 100.0% of females in these age groups living above the poverty line.
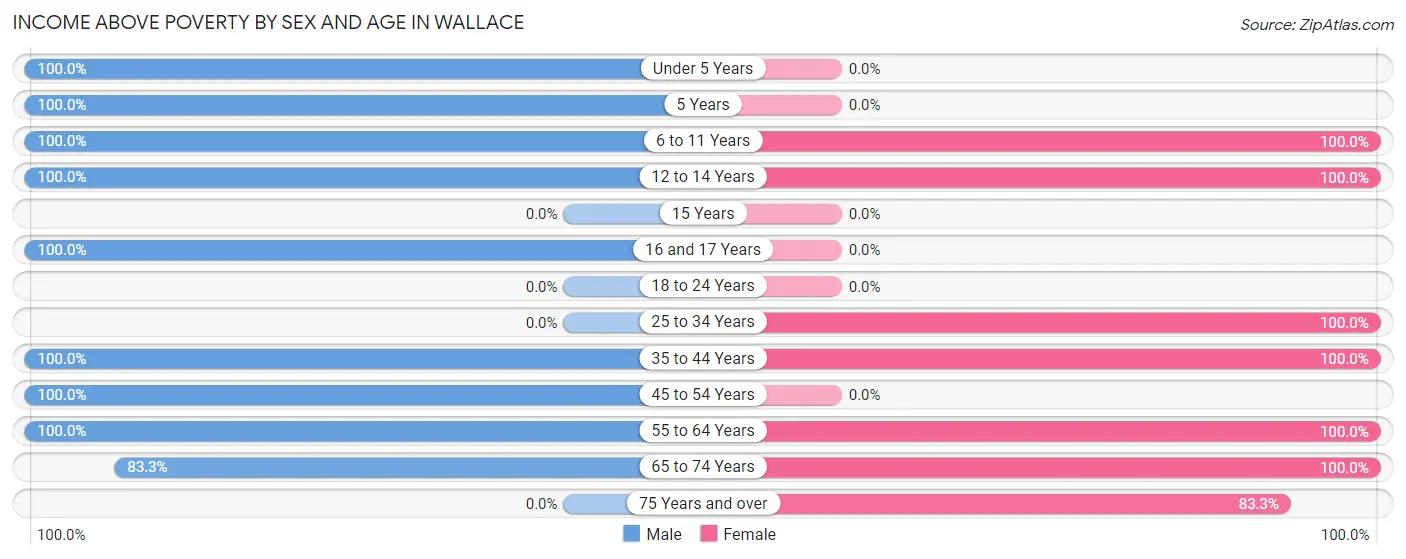
| Age Bracket | Male | Female |
| Under 5 Years | 1 (100.0%) | 0 (0.0%) |
| 5 Years | 1 (100.0%) | 0 (0.0%) |
| 6 to 11 Years | 3 (100.0%) | 7 (100.0%) |
| 12 to 14 Years | 4 (100.0%) | 4 (100.0%) |
| 15 Years | 0 (0.0%) | 0 (0.0%) |
| 16 and 17 Years | 1 (100.0%) | 0 (0.0%) |
| 18 to 24 Years | 0 (0.0%) | 0 (0.0%) |
| 25 to 34 Years | 0 (0.0%) | 2 (100.0%) |
| 35 to 44 Years | 3 (100.0%) | 7 (100.0%) |
| 45 to 54 Years | 4 (100.0%) | 0 (0.0%) |
| 55 to 64 Years | 7 (100.0%) | 7 (100.0%) |
| 65 to 74 Years | 5 (83.3%) | 3 (100.0%) |
| 75 Years and over | 0 (0.0%) | 5 (83.3%) |
| Total | 29 (90.6%) | 35 (97.2%) |
Income Below Poverty Among Married-Couple Families in Wallace
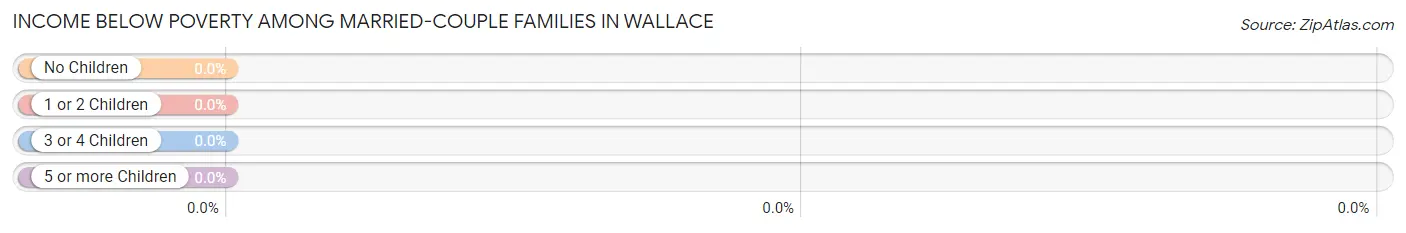
| Children | Above Poverty | Below Poverty |
| No Children | 6 (100.0%) | 0 (0.0%) |
| 1 or 2 Children | 0 (0.0%) | 0 (0.0%) |
| 3 or 4 Children | 6 (100.0%) | 0 (0.0%) |
| 5 or more Children | 0 (0.0%) | 0 (0.0%) |
| Total | 12 (100.0%) | 0 (0.0%) |
Income Below Poverty Among Single-Parent Households in Wallace
| Children | Single Father | Single Mother |
| No Children | 0 (0.0%) | 0 (0.0%) |
| 1 or 2 Children | 0 (0.0%) | 0 (0.0%) |
| 3 or 4 Children | 0 (0.0%) | 0 (0.0%) |
| 5 or more Children | 0 (0.0%) | 0 (0.0%) |
| Total | 0 (0.0%) | 0 (0.0%) |
Income Below Poverty Among Married-Couple vs Single-Parent Households in Wallace
| Children | Married-Couple Families | Single-Parent Households |
| No Children | 0 (0.0%) | 0 (0.0%) |
| 1 or 2 Children | 0 (0.0%) | 0 (0.0%) |
| 3 or 4 Children | 0 (0.0%) | 0 (0.0%) |
| 5 or more Children | 0 (0.0%) | 0 (0.0%) |
| Total | 0 (0.0%) | 0 (0.0%) |
Race in Wallace
The most populous races in Wallace are White / Caucasian (66 | 97.1%), and Two or more Races (2 | 2.9%).
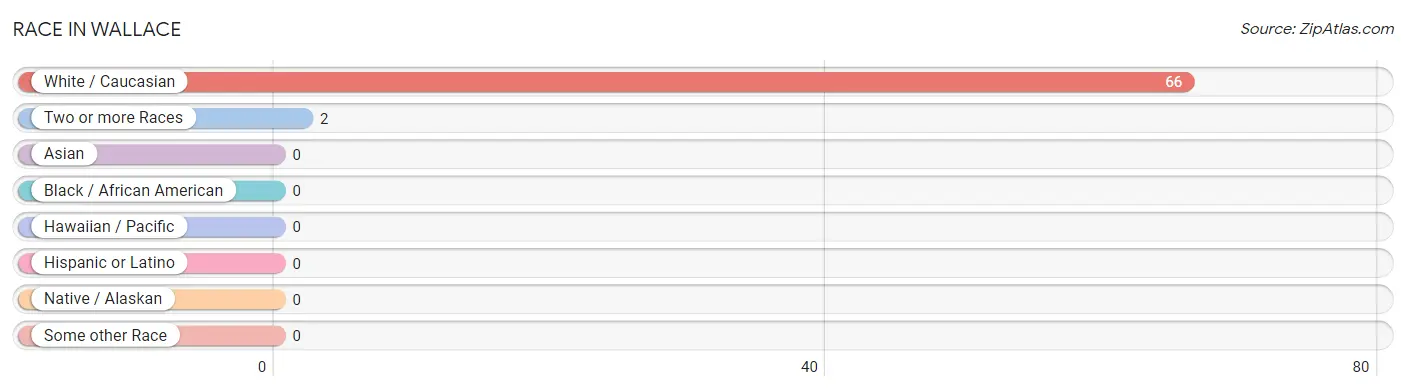
| Race | # Population | % Population |
| Asian | 0 | 0.0% |
| Black / African American | 0 | 0.0% |
| Hawaiian / Pacific | 0 | 0.0% |
| Hispanic or Latino | 0 | 0.0% |
| Native / Alaskan | 0 | 0.0% |
| White / Caucasian | 66 | 97.1% |
| Two or more Races | 2 | 2.9% |
| Some other Race | 0 | 0.0% |
| Total | 68 | 100.0% |
Ancestry in Wallace
The most populous ancestries reported in Wallace are German (43 | 63.2%), French (19 | 27.9%), Norwegian (15 | 22.1%), English (9 | 13.2%), and Irish (4 | 5.9%), together accounting for 132.4% of all Wallace residents.
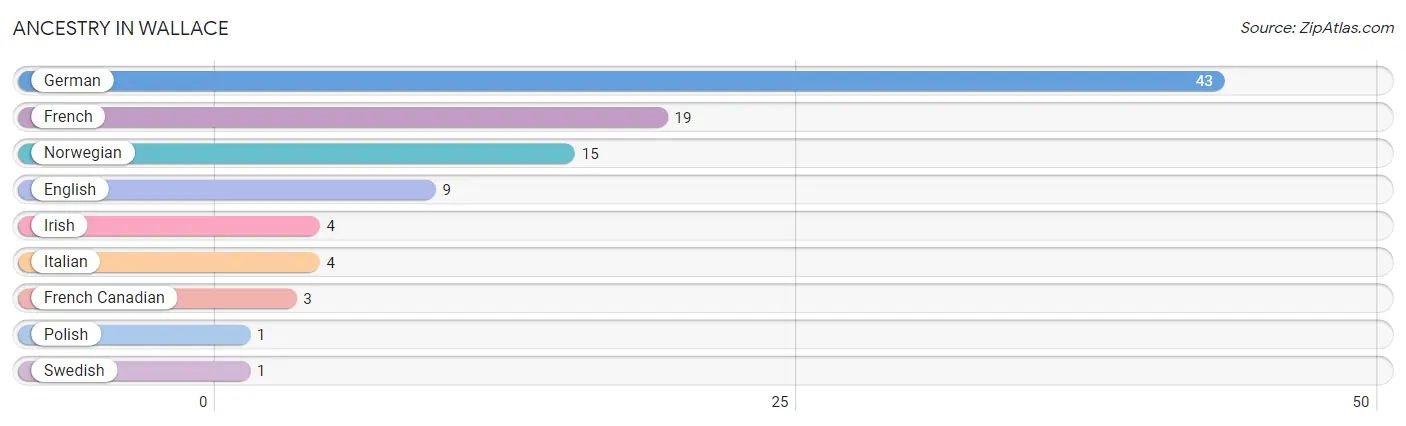
| Ancestry | # Population | % Population |
| English | 9 | 13.2% |
| French | 19 | 27.9% |
| French Canadian | 3 | 4.4% |
| German | 43 | 63.2% |
| Irish | 4 | 5.9% |
| Italian | 4 | 5.9% |
| Norwegian | 15 | 22.1% |
| Polish | 1 | 1.5% |
| Swedish | 1 | 1.5% | View All 9 Rows |
Immigrants in Wallace

| Immigration Origin | # Population | % Population | View All 0 Rows |
Sex and Age in Wallace
Sex and Age in Wallace
The most populous age groups in Wallace are 60 to 64 Years (7 | 21.9%) for men and 10 to 14 Years (8 | 22.2%) for women.
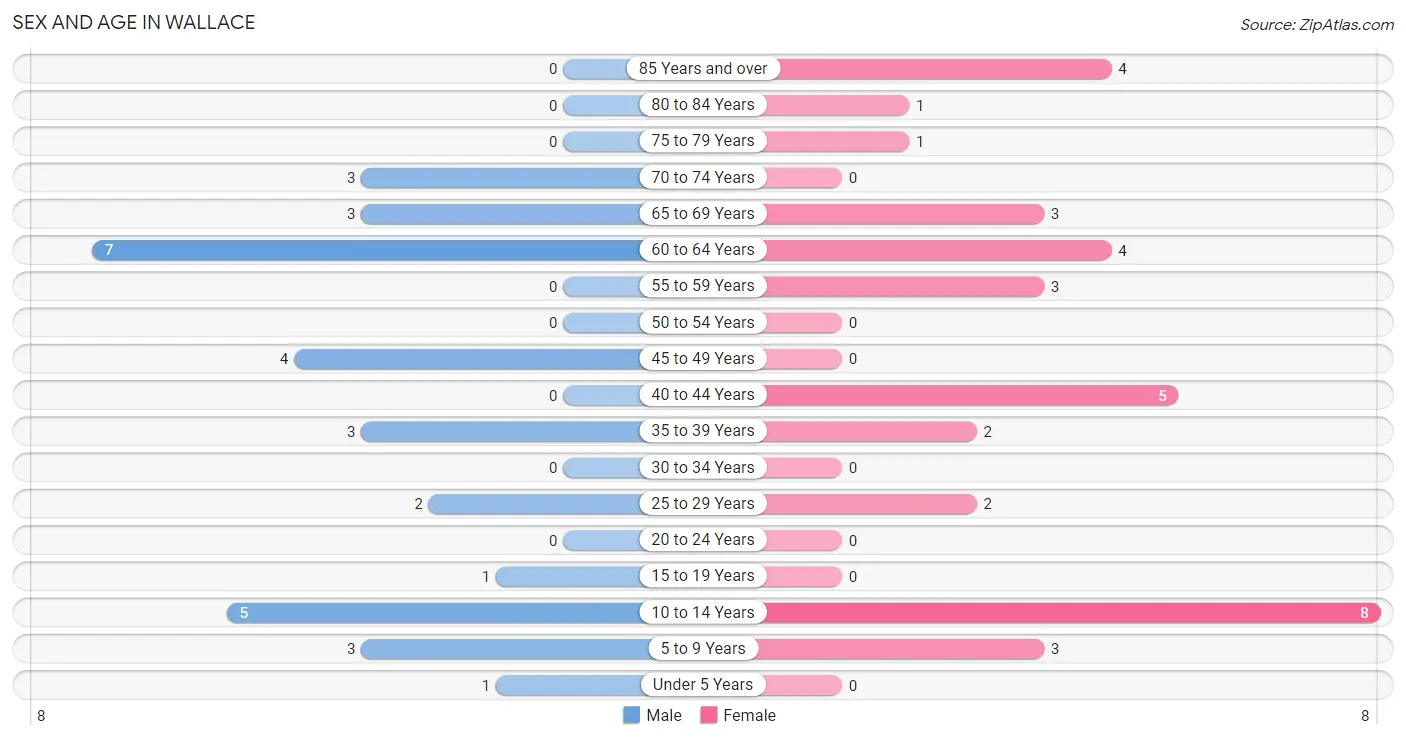
| Age Bracket | Male | Female |
| Under 5 Years | 1 (3.1%) | 0 (0.0%) |
| 5 to 9 Years | 3 (9.4%) | 3 (8.3%) |
| 10 to 14 Years | 5 (15.6%) | 8 (22.2%) |
| 15 to 19 Years | 1 (3.1%) | 0 (0.0%) |
| 20 to 24 Years | 0 (0.0%) | 0 (0.0%) |
| 25 to 29 Years | 2 (6.2%) | 2 (5.6%) |
| 30 to 34 Years | 0 (0.0%) | 0 (0.0%) |
| 35 to 39 Years | 3 (9.4%) | 2 (5.6%) |
| 40 to 44 Years | 0 (0.0%) | 5 (13.9%) |
| 45 to 49 Years | 4 (12.5%) | 0 (0.0%) |
| 50 to 54 Years | 0 (0.0%) | 0 (0.0%) |
| 55 to 59 Years | 0 (0.0%) | 3 (8.3%) |
| 60 to 64 Years | 7 (21.9%) | 4 (11.1%) |
| 65 to 69 Years | 3 (9.4%) | 3 (8.3%) |
| 70 to 74 Years | 3 (9.4%) | 0 (0.0%) |
| 75 to 79 Years | 0 (0.0%) | 1 (2.8%) |
| 80 to 84 Years | 0 (0.0%) | 1 (2.8%) |
| 85 Years and over | 0 (0.0%) | 4 (11.1%) |
| Total | 32 (100.0%) | 36 (100.0%) |
Families and Households in Wallace
Median Family Size in Wallace
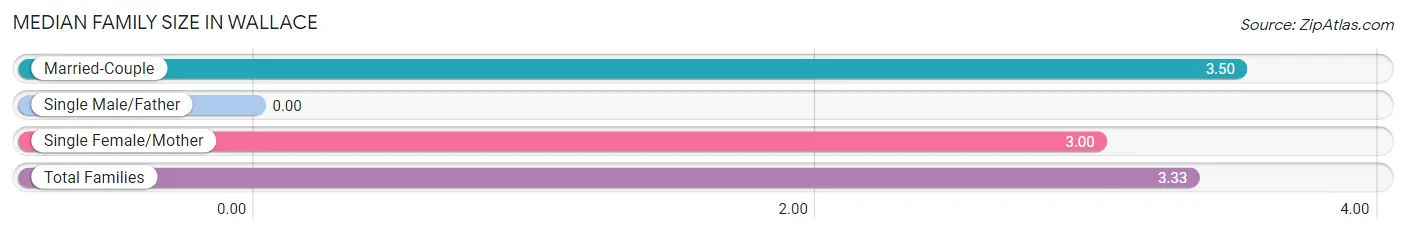
| Family Type | # Families | Family Size |
| Married-Couple | 12 (66.7%) | 3.50 |
| Single Male/Father | 0 (0.0%) | - |
| Single Female/Mother | 6 (33.3%) | 3.00 |
| Total Families | 18 (100.0%) | 3.33 |
Median Household Size in Wallace
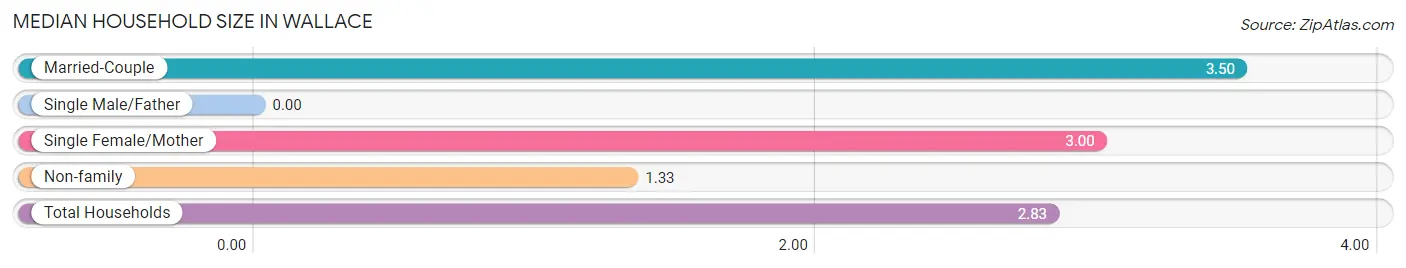
| Household Type | # Households | Household Size |
| Married-Couple | 12 (50.0%) | 3.50 |
| Single Male/Father | 0 (0.0%) | - |
| Single Female/Mother | 6 (25.0%) | 3.00 |
| Non-family | 6 (25.0%) | 1.33 |
| Total Households | 24 (100.0%) | 2.83 |
Household Size by Marriage Status in Wallace
Out of a total of 24 households in Wallace, 18 (75.0%) are family households, while 6 (25.0%) are nonfamily households. The most numerous type of family households are 2-person households, comprising 10, and the most common type of nonfamily households are 1-person households, comprising 4.
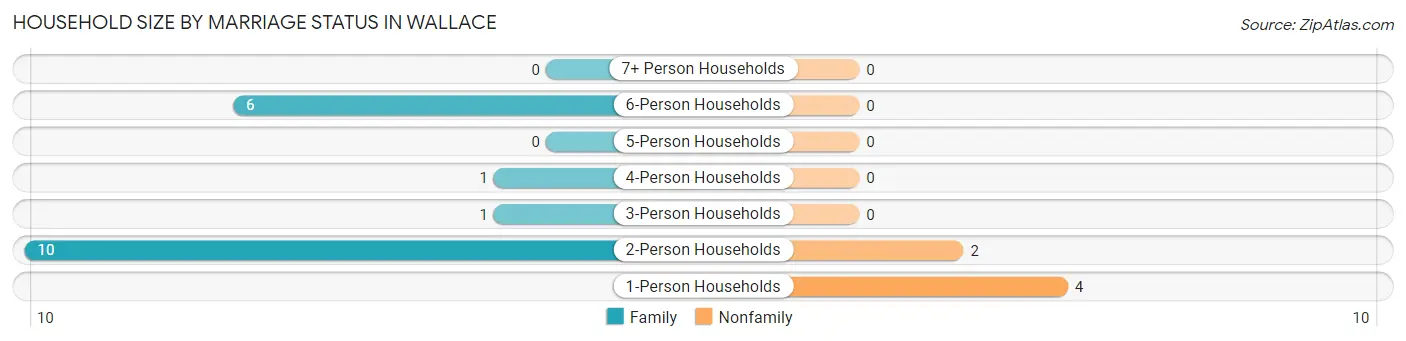
| Household Size | Family Households | Nonfamily Households |
| 1-Person Households | - | 4 (16.7%) |
| 2-Person Households | 10 (41.7%) | 2 (8.3%) |
| 3-Person Households | 1 (4.2%) | 0 (0.0%) |
| 4-Person Households | 1 (4.2%) | 0 (0.0%) |
| 5-Person Households | 0 (0.0%) | 0 (0.0%) |
| 6-Person Households | 6 (25.0%) | 0 (0.0%) |
| 7+ Person Households | 0 (0.0%) | 0 (0.0%) |
| Total | 18 (75.0%) | 6 (25.0%) |
Female Fertility in Wallace
Fertility by Age in Wallace
| Age Bracket | Women with Births | Births / 1,000 Women |
| 15 to 19 years | 0 (0.0%) | 0.0 |
| 20 to 34 years | 0 (0.0%) | 0.0 |
| 35 to 50 years | 0 (0.0%) | 0.0 |
| Total | 0 (0.0%) | 0.0 |
Fertility by Age by Marriage Status in Wallace
| Age Bracket | Married | Unmarried |
| 15 to 19 years | 0 (0.0%) | 0 (0.0%) |
| 20 to 34 years | 0 (0.0%) | 0 (0.0%) |
| 35 to 50 years | 0 (0.0%) | 0 (0.0%) |
| Total | 0 (0.0%) | 0 (0.0%) |
Fertility by Education in Wallace
| Educational Attainment | Women with Births | Births / 1,000 Women |
| Less than High School | 0 (0.0%) | 0.0 |
| High School Diploma | 0 (0.0%) | 0.0 |
| College or Associate's Degree | 0 (0.0%) | 0.0 |
| Bachelor's Degree | 0 (0.0%) | 0.0 |
| Graduate Degree | 0 (0.0%) | 0.0 |
| Total | 0 (0.0%) | 0.0 |
Fertility by Education by Marriage Status in Wallace
| Educational Attainment | Married | Unmarried |
| Less than High School | 0 (0.0%) | 0 (0.0%) |
| High School Diploma | 0 (0.0%) | 0 (0.0%) |
| College or Associate's Degree | 0 (0.0%) | 0 (0.0%) |
| Bachelor's Degree | 0 (0.0%) | 0 (0.0%) |
| Graduate Degree | 0 (0.0%) | 0 (0.0%) |
| Total | 0 (0.0%) | 0 (0.0%) |
Employment Characteristics in Wallace
Employment by Class of Employer in Wallace
Among the 21 employed individuals in Wallace, private company employees (11 | 52.4%), self-employed (incorporated) (3 | 14.3%), and self-employed (not incorporated) (3 | 14.3%) make up the most common classes of employment.
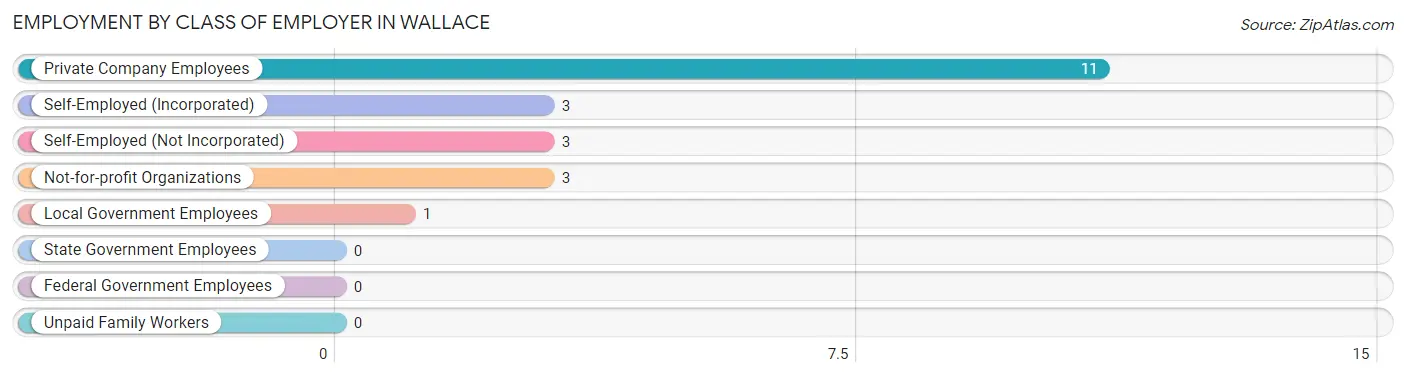
| Employer Class | # Employees | % Employees |
| Private Company Employees | 11 | 52.4% |
| Self-Employed (Incorporated) | 3 | 14.3% |
| Self-Employed (Not Incorporated) | 3 | 14.3% |
| Not-for-profit Organizations | 3 | 14.3% |
| Local Government Employees | 1 | 4.8% |
| State Government Employees | 0 | 0.0% |
| Federal Government Employees | 0 | 0.0% |
| Unpaid Family Workers | 0 | 0.0% |
| Total | 21 | 100.0% |
Employment Status by Age in Wallace
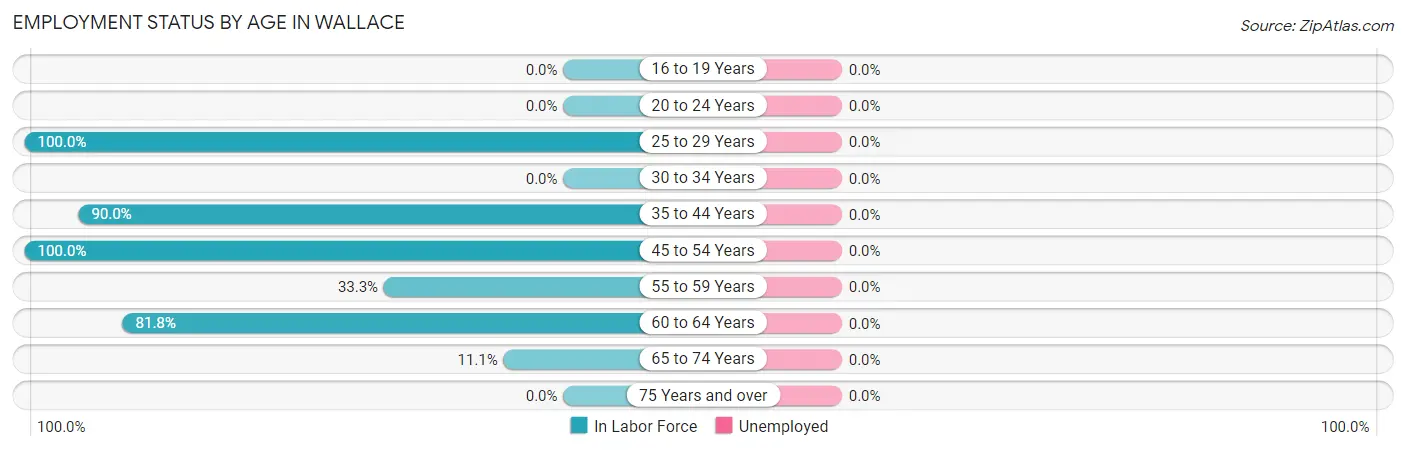
| Age Bracket | In Labor Force | Unemployed |
| 16 to 19 Years | 0 (0.0%) | 0 (0.0%) |
| 20 to 24 Years | 0 (0.0%) | 0 (0.0%) |
| 25 to 29 Years | 4 (100.0%) | 0 (0.0%) |
| 30 to 34 Years | 0 (0.0%) | 0 (0.0%) |
| 35 to 44 Years | 9 (90.0%) | 0 (0.0%) |
| 45 to 54 Years | 4 (100.0%) | 0 (0.0%) |
| 55 to 59 Years | 1 (33.3%) | 0 (0.0%) |
| 60 to 64 Years | 9 (81.8%) | 0 (0.0%) |
| 65 to 74 Years | 1 (11.1%) | 0 (0.0%) |
| 75 Years and over | 0 (0.0%) | 0 (0.0%) |
| Total | 28 (58.3%) | 0 (0.0%) |
Employment Status by Educational Attainment in Wallace
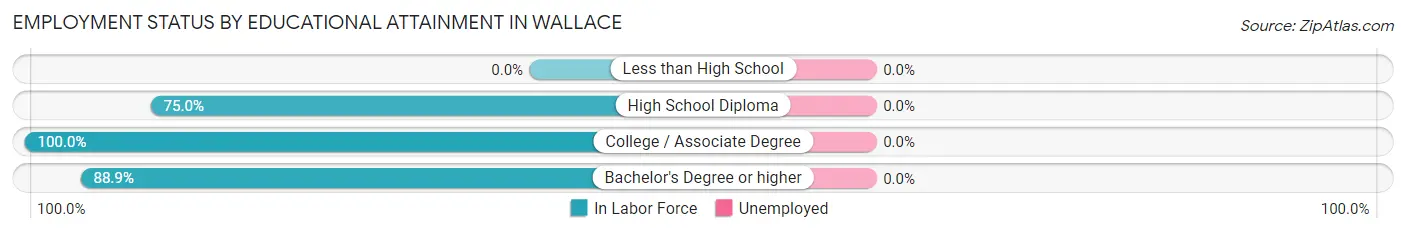
| Educational Attainment | In Labor Force | Unemployed |
| Less than High School | 0 (0.0%) | 0 (0.0%) |
| High School Diploma | 6 (75.0%) | 0 (0.0%) |
| College / Associate Degree | 13 (100.0%) | 0 (0.0%) |
| Bachelor's Degree or higher | 8 (88.9%) | 0 (0.0%) |
| Total | 27 (84.4%) | 0 (0.0%) |
Employment Occupations by Sex in Wallace
Management, Business, Science and Arts Occupations
The most common Management, Business, Science and Arts occupations in Wallace are Community & Social Service (6 | 21.4%), Education Instruction & Library (5 | 17.9%), Management (3 | 10.7%), Business & Financial (2 | 7.1%), and Education, Arts & Media (1 | 3.6%).
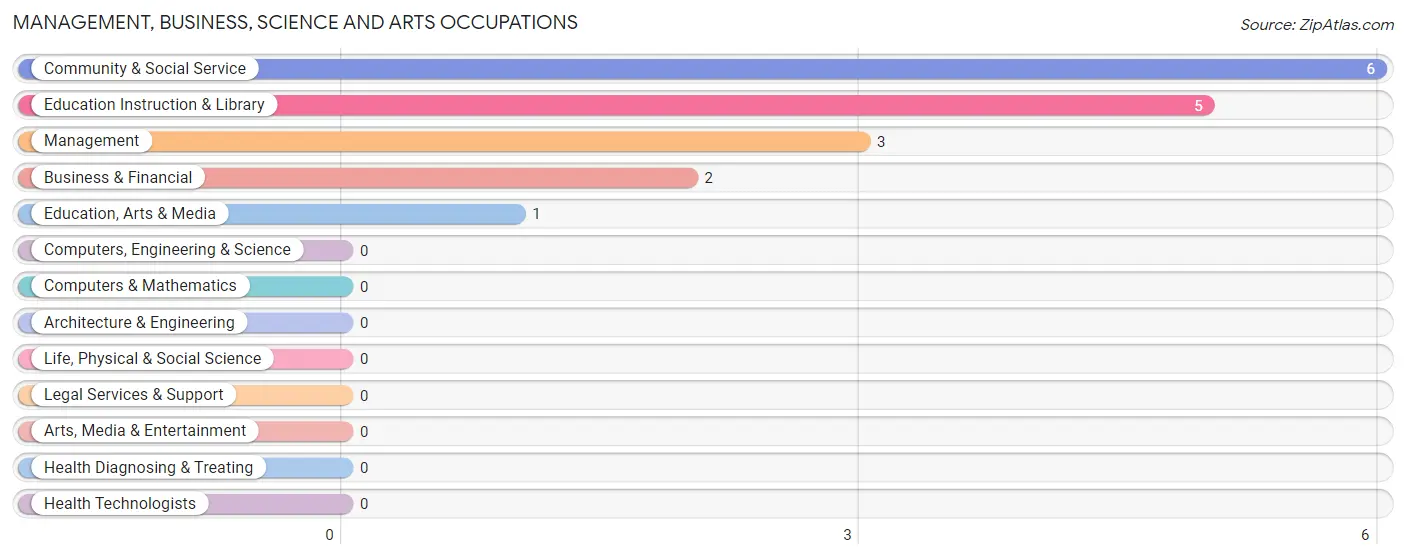
Management, Business, Science and Arts Occupations by Sex
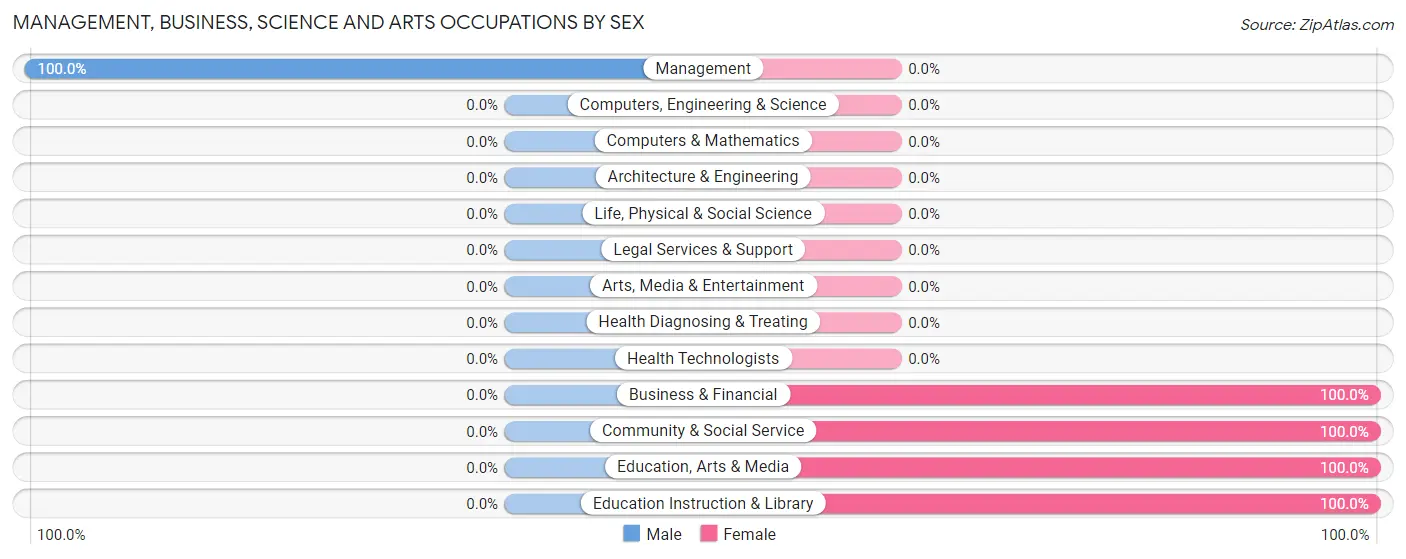
| Occupation | Male | Female |
| Management | 3 (100.0%) | 0 (0.0%) |
| Business & Financial | 0 (0.0%) | 2 (100.0%) |
| Computers, Engineering & Science | 0 (0.0%) | 0 (0.0%) |
| Computers & Mathematics | 0 (0.0%) | 0 (0.0%) |
| Architecture & Engineering | 0 (0.0%) | 0 (0.0%) |
| Life, Physical & Social Science | 0 (0.0%) | 0 (0.0%) |
| Community & Social Service | 0 (0.0%) | 6 (100.0%) |
| Education, Arts & Media | 0 (0.0%) | 1 (100.0%) |
| Legal Services & Support | 0 (0.0%) | 0 (0.0%) |
| Education Instruction & Library | 0 (0.0%) | 5 (100.0%) |
| Arts, Media & Entertainment | 0 (0.0%) | 0 (0.0%) |
| Health Diagnosing & Treating | 0 (0.0%) | 0 (0.0%) |
| Health Technologists | 0 (0.0%) | 0 (0.0%) |
| Total (Category) | 3 (27.3%) | 8 (72.7%) |
| Total (Overall) | 16 (57.1%) | 12 (42.9%) |
Services Occupations
The most common Services occupations in Wallace are Food Preparation & Serving (2 | 7.1%), and Cleaning & Maintenance (1 | 3.6%).
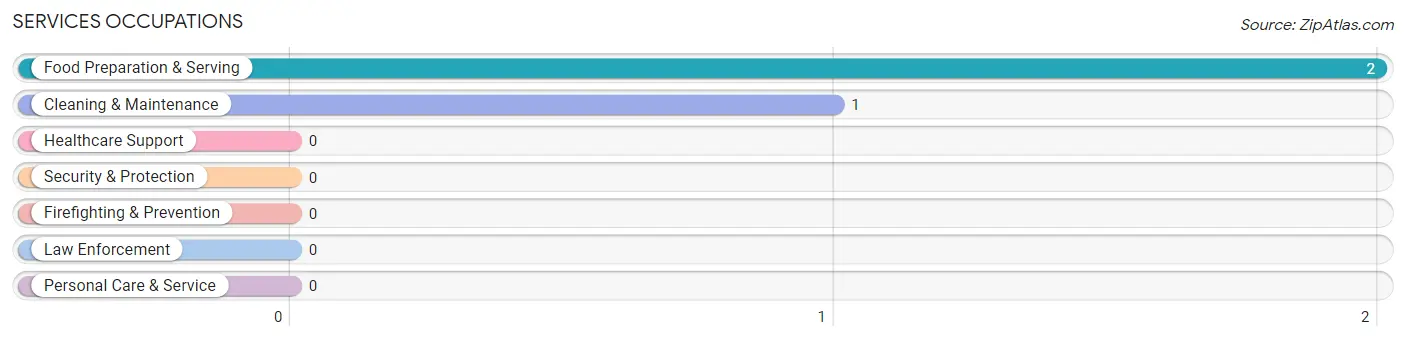
Services Occupations by Sex
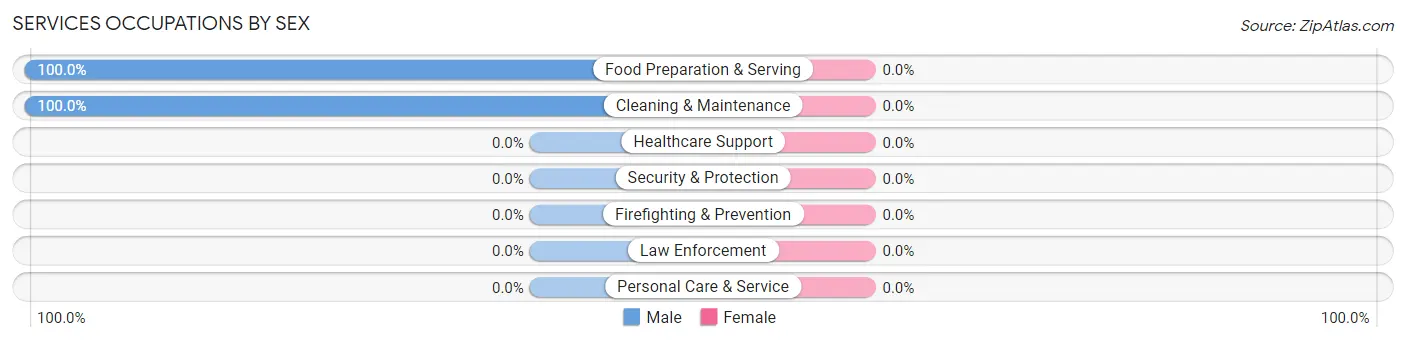
| Occupation | Male | Female |
| Healthcare Support | 0 (0.0%) | 0 (0.0%) |
| Security & Protection | 0 (0.0%) | 0 (0.0%) |
| Firefighting & Prevention | 0 (0.0%) | 0 (0.0%) |
| Law Enforcement | 0 (0.0%) | 0 (0.0%) |
| Food Preparation & Serving | 2 (100.0%) | 0 (0.0%) |
| Cleaning & Maintenance | 1 (100.0%) | 0 (0.0%) |
| Personal Care & Service | 0 (0.0%) | 0 (0.0%) |
| Total (Category) | 3 (100.0%) | 0 (0.0%) |
| Total (Overall) | 16 (57.1%) | 12 (42.9%) |
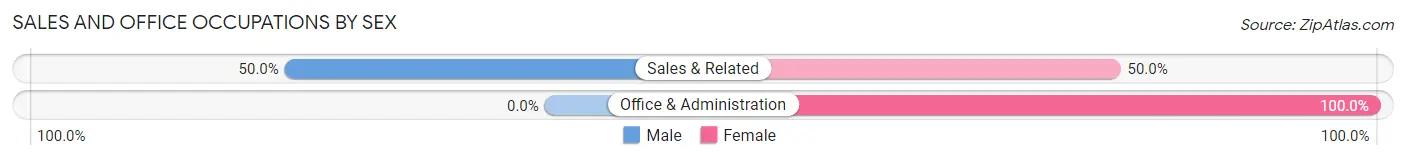
Sales and Office Occupations
The most common Sales and Office occupations in Wallace are Sales & Related (2 | 7.1%), and Office & Administration (2 | 7.1%).
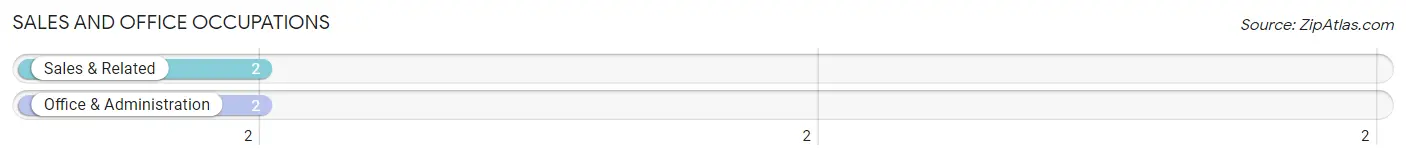
Sales and Office Occupations by Sex
| Occupation | Male | Female |
| Sales & Related | 1 (50.0%) | 1 (50.0%) |
| Office & Administration | 0 (0.0%) | 2 (100.0%) |
| Total (Category) | 1 (25.0%) | 3 (75.0%) |
| Total (Overall) | 16 (57.1%) | 12 (42.9%) |
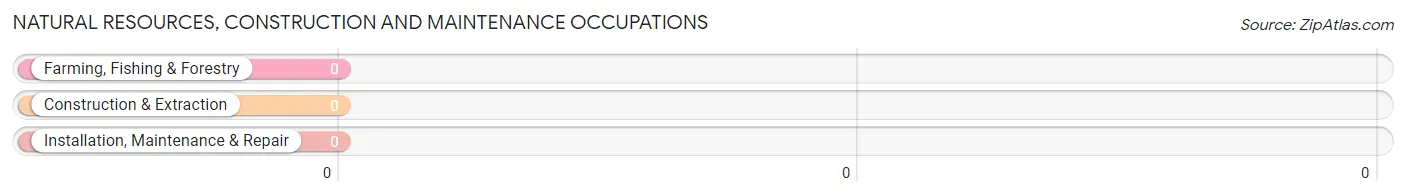
Natural Resources, Construction and Maintenance Occupations
Natural Resources, Construction and Maintenance Occupations by Sex
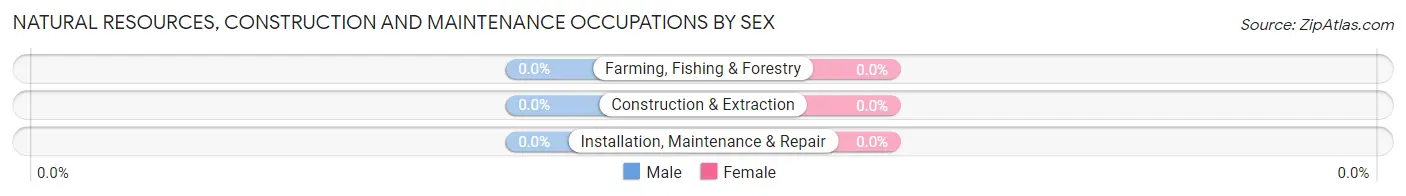
| Occupation | Male | Female |
| Farming, Fishing & Forestry | 0 (0.0%) | 0 (0.0%) |
| Construction & Extraction | 0 (0.0%) | 0 (0.0%) |
| Installation, Maintenance & Repair | 0 (0.0%) | 0 (0.0%) |
| Total (Category) | 0 (0.0%) | 0 (0.0%) |
| Total (Overall) | 16 (57.1%) | 12 (42.9%) |
Production, Transportation and Moving Occupations
The most common Production, Transportation and Moving occupations in Wallace are , and Production (10 | 35.7%).
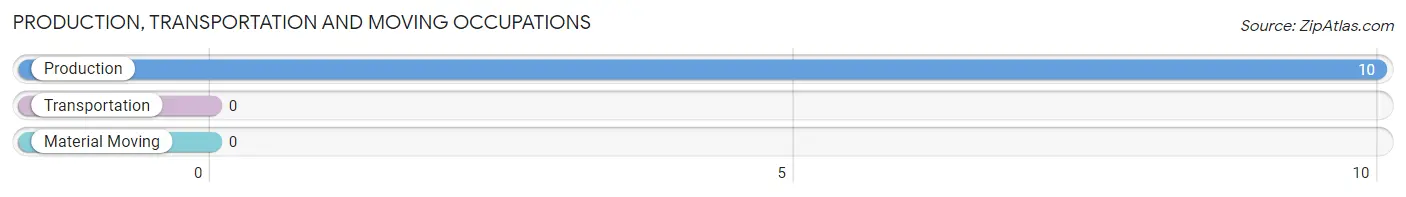
Production, Transportation and Moving Occupations by Sex
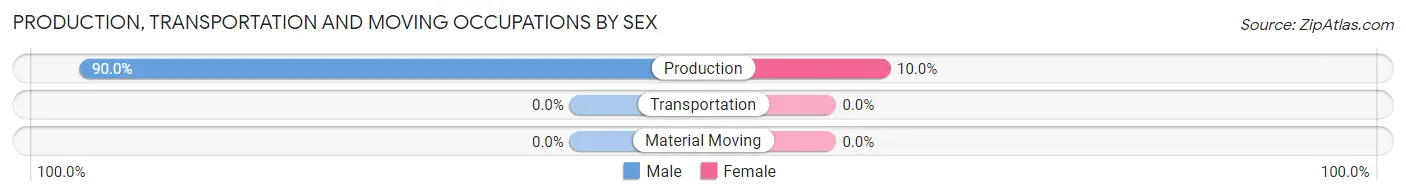
| Occupation | Male | Female |
| Production | 9 (90.0%) | 1 (10.0%) |
| Transportation | 0 (0.0%) | 0 (0.0%) |
| Material Moving | 0 (0.0%) | 0 (0.0%) |
| Total (Category) | 9 (90.0%) | 1 (10.0%) |
| Total (Overall) | 16 (57.1%) | 12 (42.9%) |
Employment Industries by Sex in Wallace
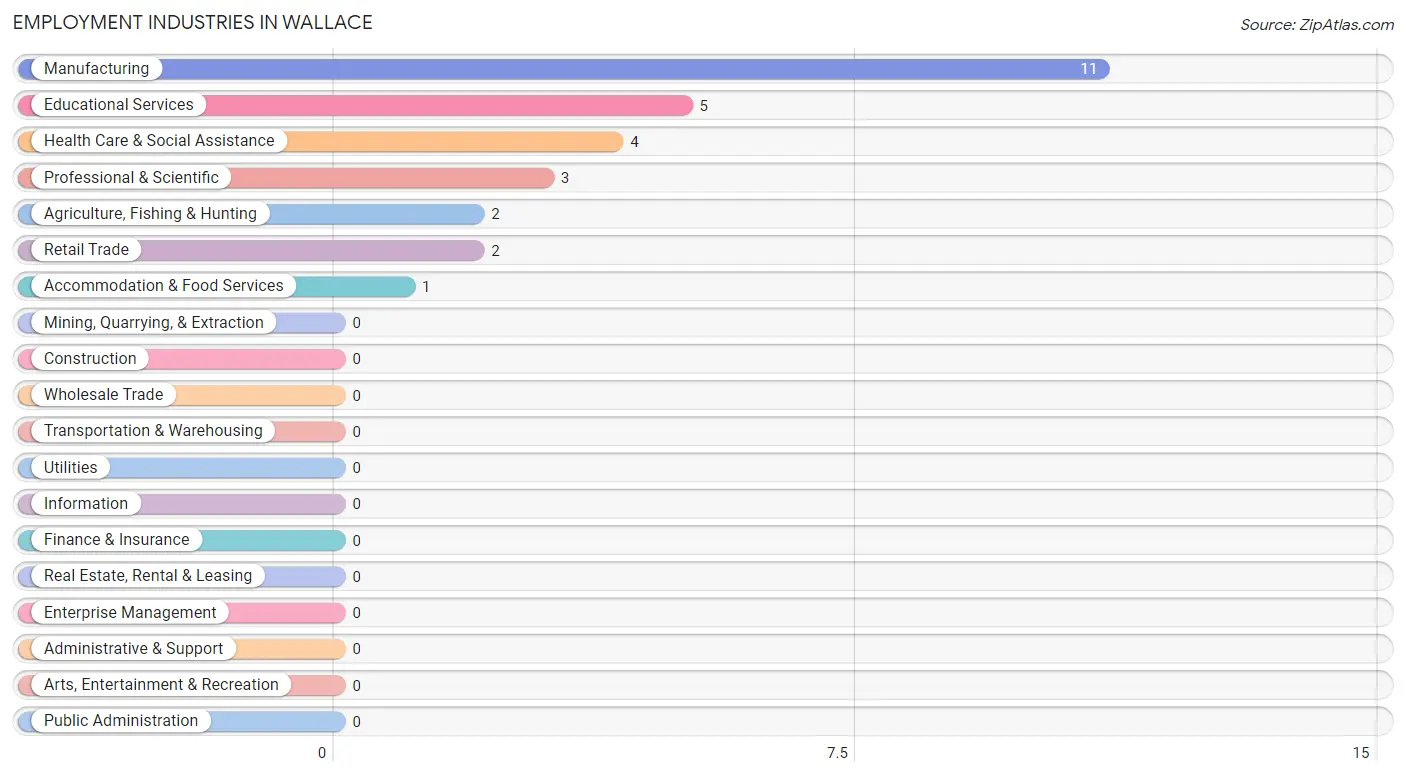
Employment Industries in Wallace
The major employment industries in Wallace include Manufacturing (11 | 39.3%), Educational Services (5 | 17.9%), Health Care & Social Assistance (4 | 14.3%), Professional & Scientific (3 | 10.7%), and Agriculture, Fishing & Hunting (2 | 7.1%).
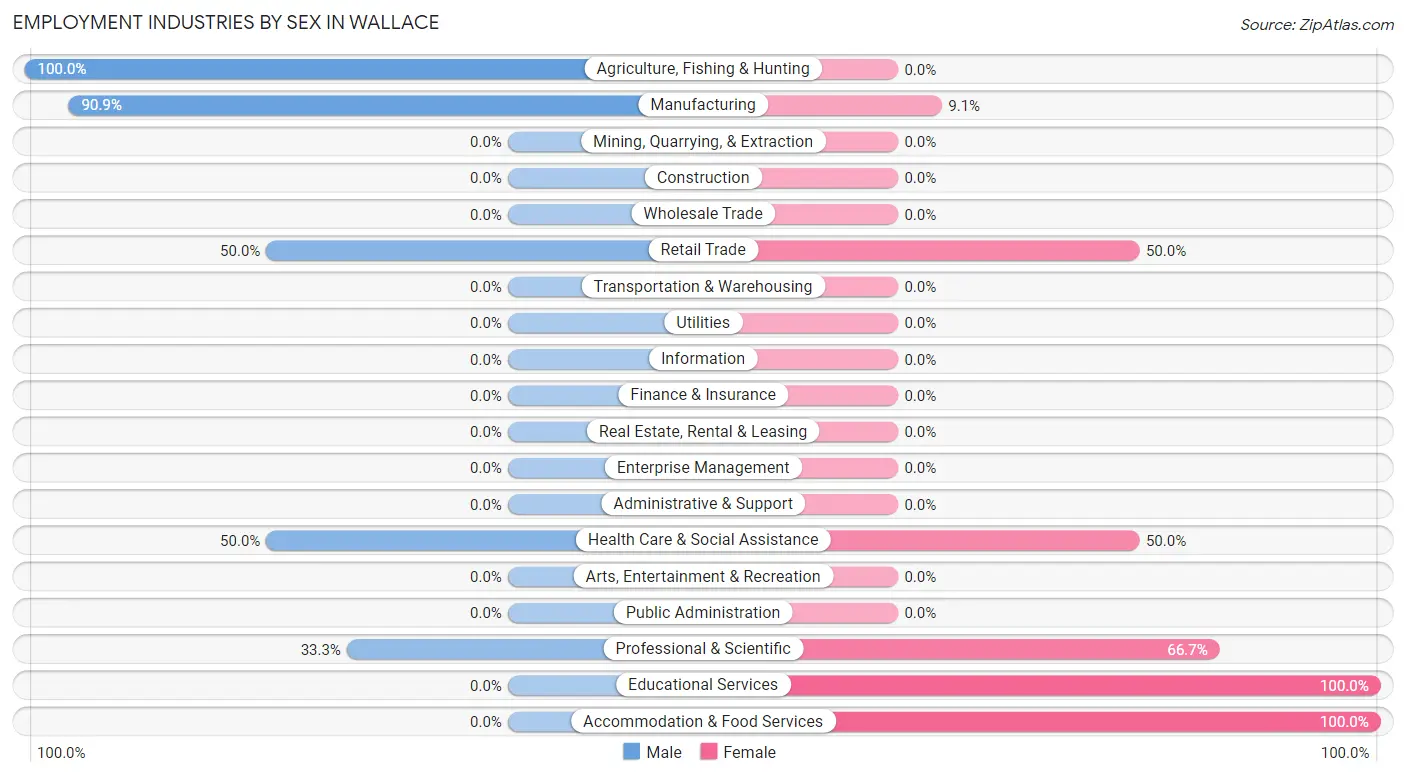
Employment Industries by Sex in Wallace
The Wallace industries that see more men than women are Agriculture, Fishing & Hunting (100.0%), Manufacturing (90.9%), and Retail Trade (50.0%), whereas the industries that tend to have a higher number of women are Educational Services (100.0%), Accommodation & Food Services (100.0%), and Professional & Scientific (66.7%).
| Industry | Male | Female |
| Agriculture, Fishing & Hunting | 2 (100.0%) | 0 (0.0%) |
| Mining, Quarrying, & Extraction | 0 (0.0%) | 0 (0.0%) |
| Construction | 0 (0.0%) | 0 (0.0%) |
| Manufacturing | 10 (90.9%) | 1 (9.1%) |
| Wholesale Trade | 0 (0.0%) | 0 (0.0%) |
| Retail Trade | 1 (50.0%) | 1 (50.0%) |
| Transportation & Warehousing | 0 (0.0%) | 0 (0.0%) |
| Utilities | 0 (0.0%) | 0 (0.0%) |
| Information | 0 (0.0%) | 0 (0.0%) |
| Finance & Insurance | 0 (0.0%) | 0 (0.0%) |
| Real Estate, Rental & Leasing | 0 (0.0%) | 0 (0.0%) |
| Professional & Scientific | 1 (33.3%) | 2 (66.7%) |
| Enterprise Management | 0 (0.0%) | 0 (0.0%) |
| Administrative & Support | 0 (0.0%) | 0 (0.0%) |
| Educational Services | 0 (0.0%) | 5 (100.0%) |
| Health Care & Social Assistance | 2 (50.0%) | 2 (50.0%) |
| Arts, Entertainment & Recreation | 0 (0.0%) | 0 (0.0%) |
| Accommodation & Food Services | 0 (0.0%) | 1 (100.0%) |
| Public Administration | 0 (0.0%) | 0 (0.0%) |
| Total | 16 (57.1%) | 12 (42.9%) |
Education in Wallace
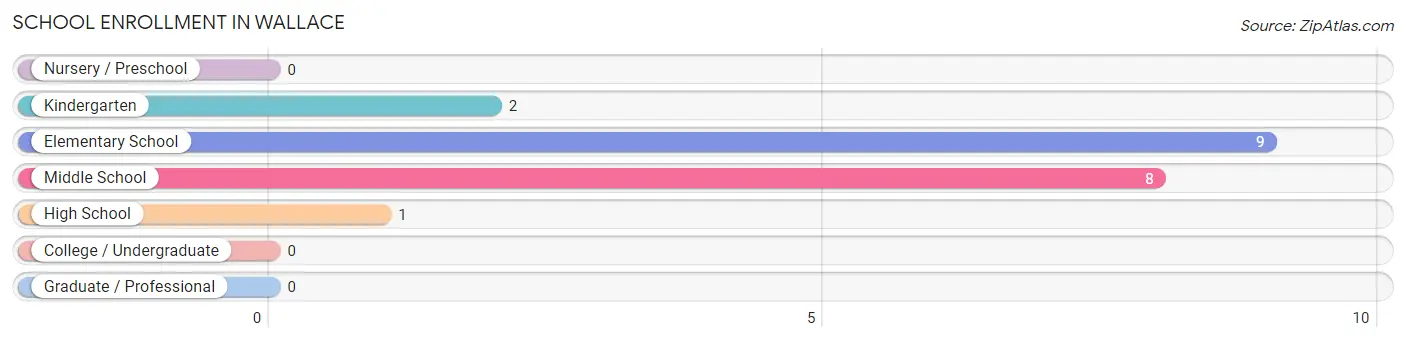
School Enrollment in Wallace
The most common levels of schooling among the 20 students in Wallace are elementary school (9 | 45.0%), middle school (8 | 40.0%), and kindergarten (2 | 10.0%).
| School Level | # Students | % Students |
| Nursery / Preschool | 0 | 0.0% |
| Kindergarten | 2 | 10.0% |
| Elementary School | 9 | 45.0% |
| Middle School | 8 | 40.0% |
| High School | 1 | 5.0% |
| College / Undergraduate | 0 | 0.0% |
| Graduate / Professional | 0 | 0.0% |
| Total | 20 | 100.0% |
School Enrollment by Age by Funding Source in Wallace
Out of a total of 20 students who are enrolled in schools in Wallace, 3 (15.0%) attend a private institution, while the remaining 17 (85.0%) are enrolled in public schools. The age group of 5 to 9 year old has the highest likelihood of being enrolled in private schools, with 2 (33.3% in the age bracket) enrolled. Conversely, the age group of 15 to 17 year olds has the lowest likelihood of being enrolled in a private school, with 1 (100.0% in the age bracket) attending a public institution.
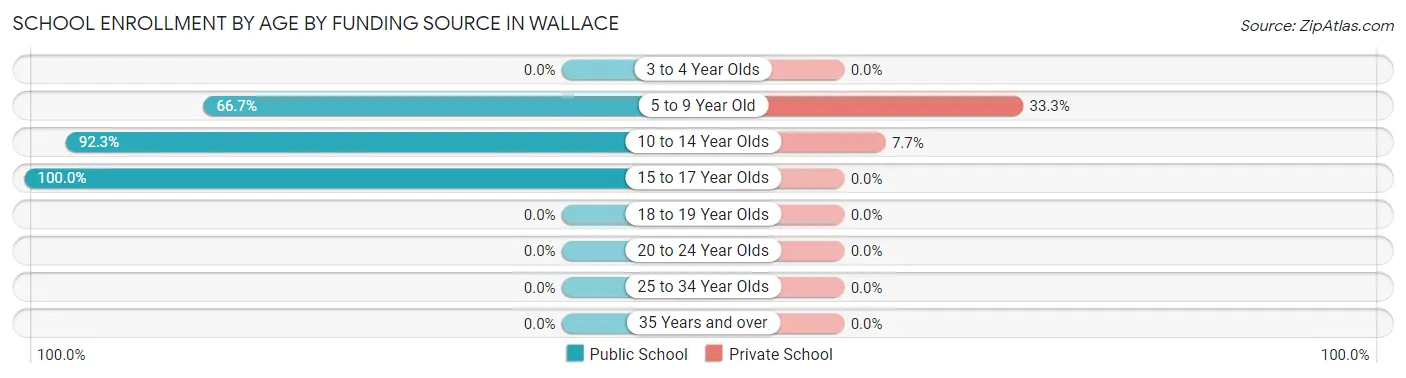
| Age Bracket | Public School | Private School |
| 3 to 4 Year Olds | 0 (0.0%) | 0 (0.0%) |
| 5 to 9 Year Old | 4 (66.7%) | 2 (33.3%) |
| 10 to 14 Year Olds | 12 (92.3%) | 1 (7.7%) |
| 15 to 17 Year Olds | 1 (100.0%) | 0 (0.0%) |
| 18 to 19 Year Olds | 0 (0.0%) | 0 (0.0%) |
| 20 to 24 Year Olds | 0 (0.0%) | 0 (0.0%) |
| 25 to 34 Year Olds | 0 (0.0%) | 0 (0.0%) |
| 35 Years and over | 0 (0.0%) | 0 (0.0%) |
| Total | 17 (85.0%) | 3 (15.0%) |
Educational Attainment by Field of Study in Wallace
Science & technology (6 | 60.0%), business (2 | 20.0%), education (1 | 10.0%), and arts & humanities (1 | 10.0%) are the most common fields of study among 10 individuals in Wallace who have obtained a bachelor's degree or higher.
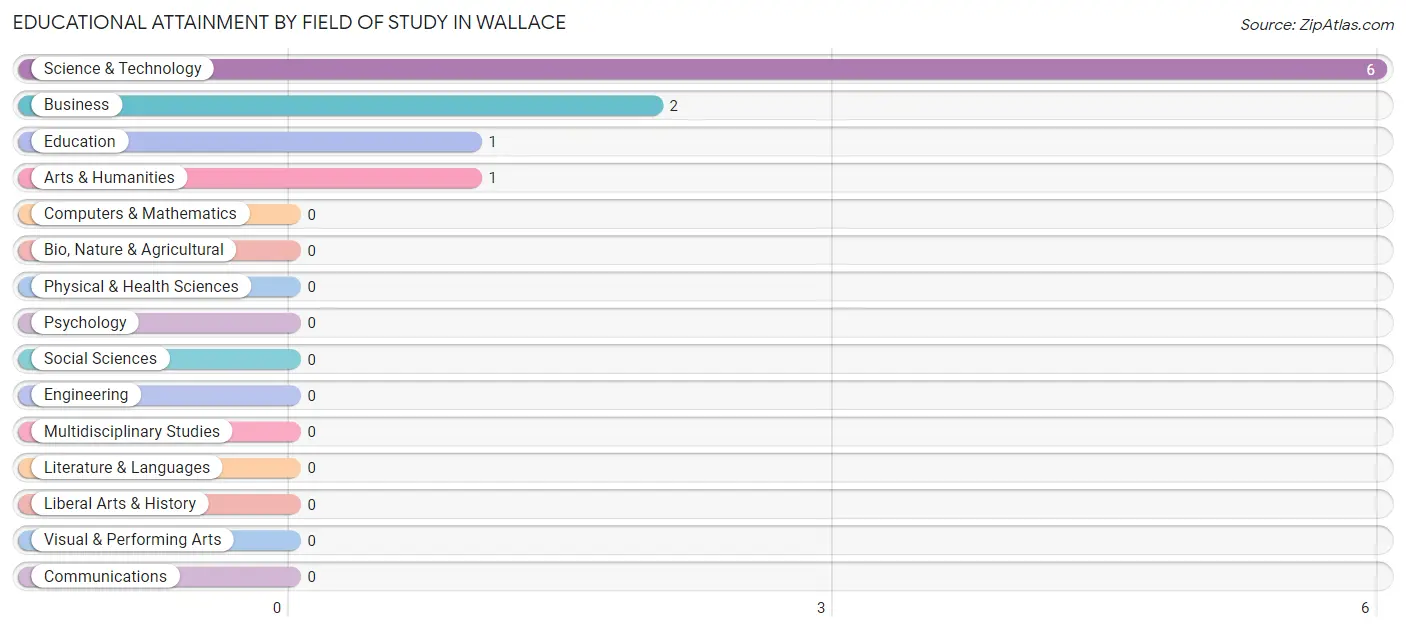
| Field of Study | # Graduates | % Graduates |
| Computers & Mathematics | 0 | 0.0% |
| Bio, Nature & Agricultural | 0 | 0.0% |
| Physical & Health Sciences | 0 | 0.0% |
| Psychology | 0 | 0.0% |
| Social Sciences | 0 | 0.0% |
| Engineering | 0 | 0.0% |
| Multidisciplinary Studies | 0 | 0.0% |
| Science & Technology | 6 | 60.0% |
| Business | 2 | 20.0% |
| Education | 1 | 10.0% |
| Literature & Languages | 0 | 0.0% |
| Liberal Arts & History | 0 | 0.0% |
| Visual & Performing Arts | 0 | 0.0% |
| Communications | 0 | 0.0% |
| Arts & Humanities | 1 | 10.0% |
| Total | 10 | 100.0% |
Transportation & Commute in Wallace
Vehicle Availability by Sex in Wallace
The most prevalent vehicle ownership categories in Wallace are males with 2 vehicles (6, accounting for 37.5%) and females with 2 vehicles (4, making up 120.0%).
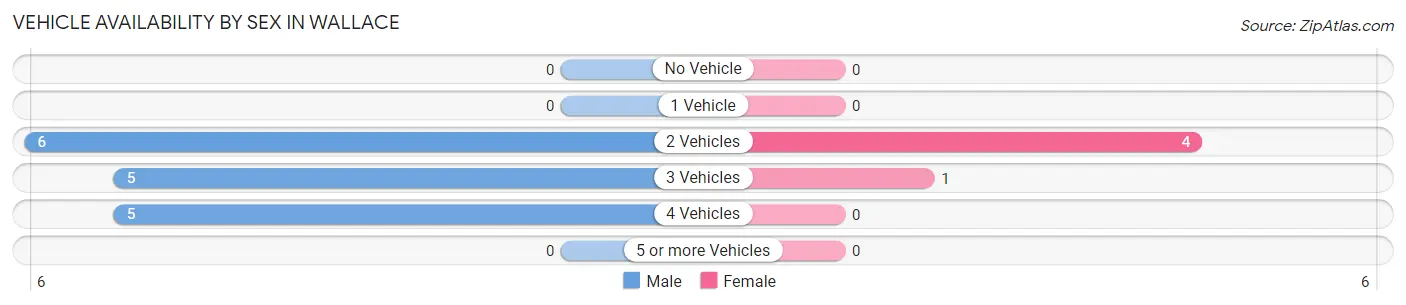
| Vehicles Available | Male | Female |
| No Vehicle | 0 (0.0%) | 0 (0.0%) |
| 1 Vehicle | 0 (0.0%) | 0 (0.0%) |
| 2 Vehicles | 6 (37.5%) | 4 (80.0%) |
| 3 Vehicles | 5 (31.2%) | 1 (20.0%) |
| 4 Vehicles | 5 (31.2%) | 0 (0.0%) |
| 5 or more Vehicles | 0 (0.0%) | 0 (0.0%) |
| Total | 16 (100.0%) | 5 (100.0%) |
Commute Time in Wallace
The most frequently occuring commute durations in Wallace are 30 to 34 minutes (7 commuters, 33.3%), less than 5 minutes (5 commuters, 23.8%), and 10 to 14 minutes (3 commuters, 14.3%).
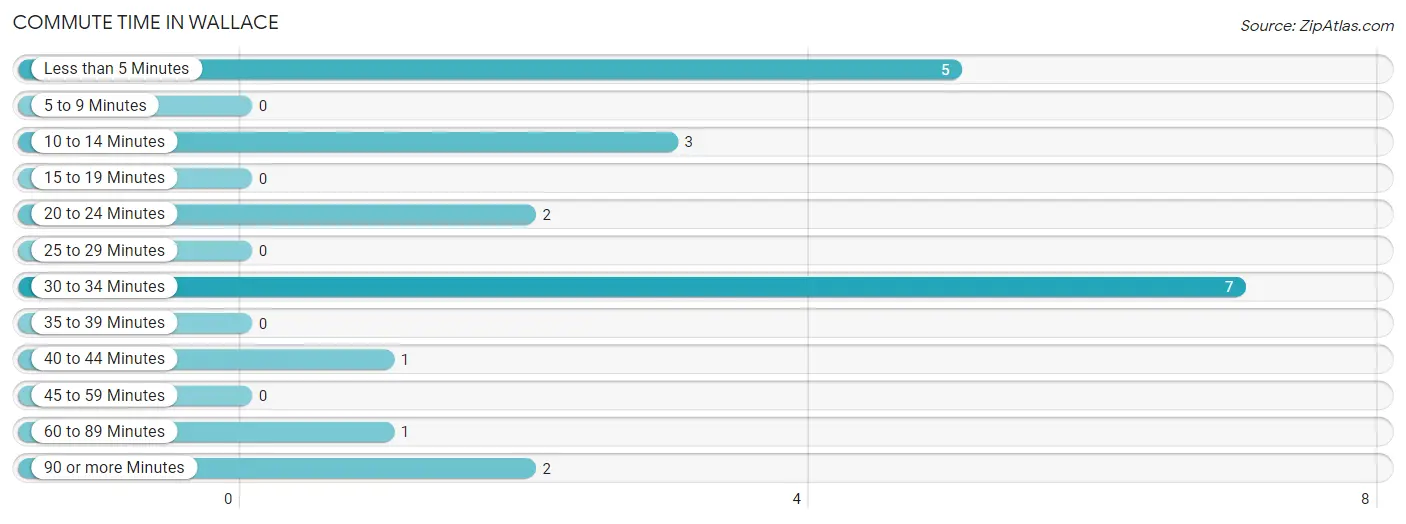
| Commute Time | # Commuters | % Commuters |
| Less than 5 Minutes | 5 | 23.8% |
| 5 to 9 Minutes | 0 | 0.0% |
| 10 to 14 Minutes | 3 | 14.3% |
| 15 to 19 Minutes | 0 | 0.0% |
| 20 to 24 Minutes | 2 | 9.5% |
| 25 to 29 Minutes | 0 | 0.0% |
| 30 to 34 Minutes | 7 | 33.3% |
| 35 to 39 Minutes | 0 | 0.0% |
| 40 to 44 Minutes | 1 | 4.8% |
| 45 to 59 Minutes | 0 | 0.0% |
| 60 to 89 Minutes | 1 | 4.8% |
| 90 or more Minutes | 2 | 9.5% |
Commute Time by Sex in Wallace
The most common commute times in Wallace are less than 5 minutes (5 commuters, 31.2%) for males and 10 to 14 minutes (2 commuters, 40.0%) for females.
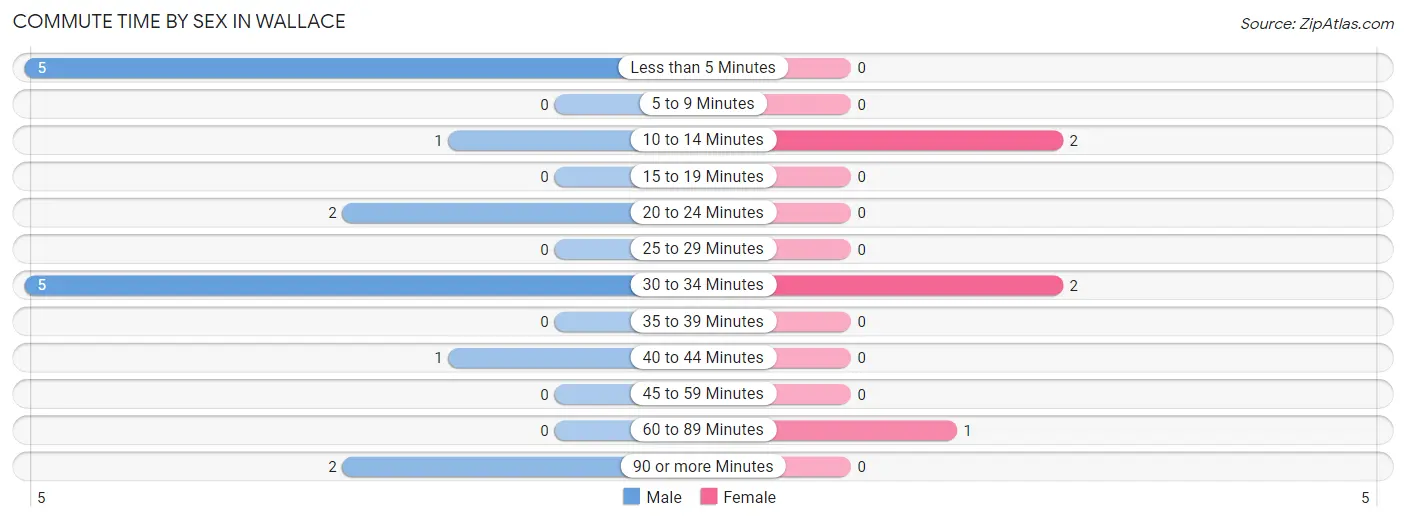
| Commute Time | Male | Female |
| Less than 5 Minutes | 5 (31.2%) | 0 (0.0%) |
| 5 to 9 Minutes | 0 (0.0%) | 0 (0.0%) |
| 10 to 14 Minutes | 1 (6.2%) | 2 (40.0%) |
| 15 to 19 Minutes | 0 (0.0%) | 0 (0.0%) |
| 20 to 24 Minutes | 2 (12.5%) | 0 (0.0%) |
| 25 to 29 Minutes | 0 (0.0%) | 0 (0.0%) |
| 30 to 34 Minutes | 5 (31.2%) | 2 (40.0%) |
| 35 to 39 Minutes | 0 (0.0%) | 0 (0.0%) |
| 40 to 44 Minutes | 1 (6.2%) | 0 (0.0%) |
| 45 to 59 Minutes | 0 (0.0%) | 0 (0.0%) |
| 60 to 89 Minutes | 0 (0.0%) | 1 (20.0%) |
| 90 or more Minutes | 2 (12.5%) | 0 (0.0%) |
Time of Departure to Work by Sex in Wallace
The most frequent times of departure to work in Wallace are 6:00 AM to 6:29 AM (11, 68.8%) for males and 9:00 AM to 9:59 AM (2, 40.0%) for females.
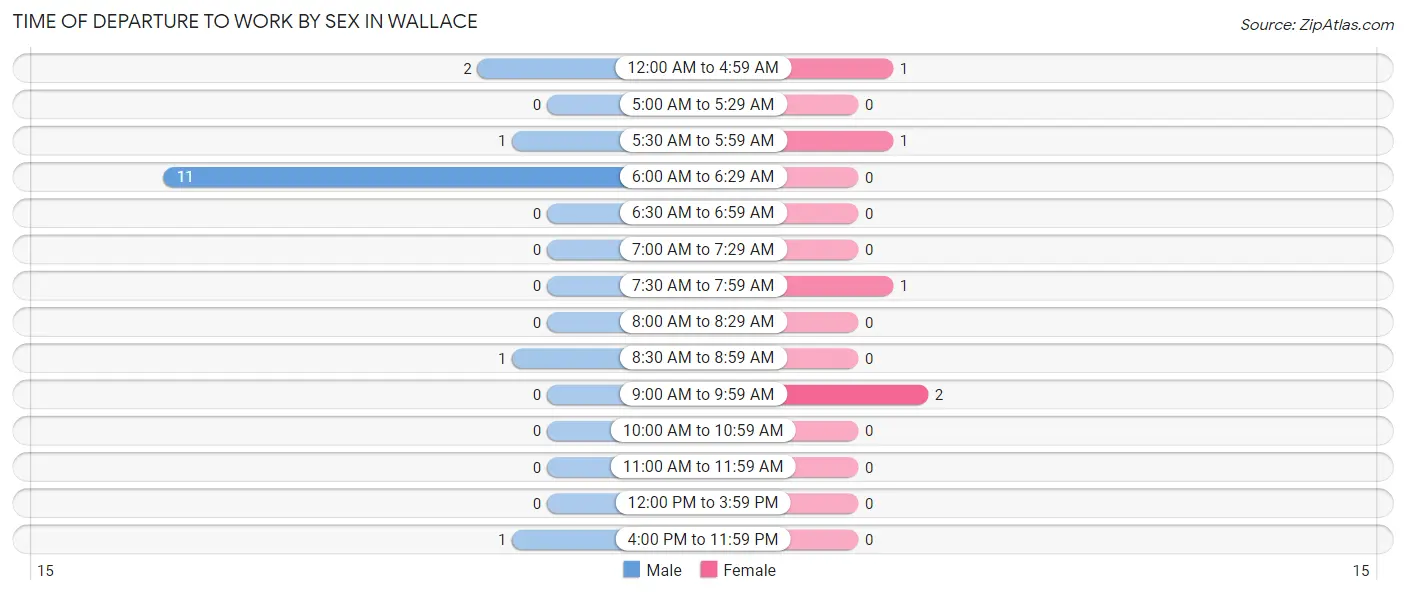
| Time of Departure | Male | Female |
| 12:00 AM to 4:59 AM | 2 (12.5%) | 1 (20.0%) |
| 5:00 AM to 5:29 AM | 0 (0.0%) | 0 (0.0%) |
| 5:30 AM to 5:59 AM | 1 (6.2%) | 1 (20.0%) |
| 6:00 AM to 6:29 AM | 11 (68.8%) | 0 (0.0%) |
| 6:30 AM to 6:59 AM | 0 (0.0%) | 0 (0.0%) |
| 7:00 AM to 7:29 AM | 0 (0.0%) | 0 (0.0%) |
| 7:30 AM to 7:59 AM | 0 (0.0%) | 1 (20.0%) |
| 8:00 AM to 8:29 AM | 0 (0.0%) | 0 (0.0%) |
| 8:30 AM to 8:59 AM | 1 (6.2%) | 0 (0.0%) |
| 9:00 AM to 9:59 AM | 0 (0.0%) | 2 (40.0%) |
| 10:00 AM to 10:59 AM | 0 (0.0%) | 0 (0.0%) |
| 11:00 AM to 11:59 AM | 0 (0.0%) | 0 (0.0%) |
| 12:00 PM to 3:59 PM | 0 (0.0%) | 0 (0.0%) |
| 4:00 PM to 11:59 PM | 1 (6.2%) | 0 (0.0%) |
| Total | 16 (100.0%) | 5 (100.0%) |
Housing Occupancy in Wallace
Occupancy by Ownership in Wallace
Of the total 24 dwellings in Wallace, owner-occupied units account for 19 (79.2%), while renter-occupied units make up 5 (20.8%).
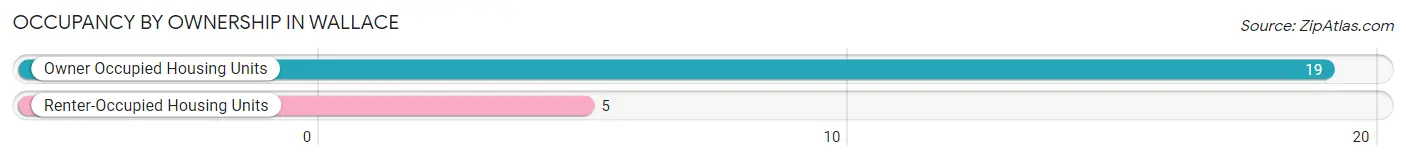
| Occupancy | # Housing Units | % Housing Units |
| Owner Occupied Housing Units | 19 | 79.2% |
| Renter-Occupied Housing Units | 5 | 20.8% |
| Total Occupied Housing Units | 24 | 100.0% |
Occupancy by Household Size in Wallace
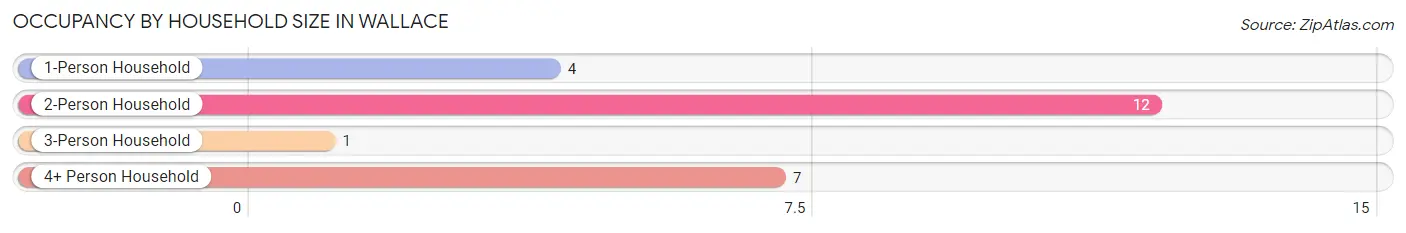
| Household Size | # Housing Units | % Housing Units |
| 1-Person Household | 4 | 16.7% |
| 2-Person Household | 12 | 50.0% |
| 3-Person Household | 1 | 4.2% |
| 4+ Person Household | 7 | 29.2% |
| Total Housing Units | 24 | 100.0% |
Occupancy by Ownership by Household Size in Wallace
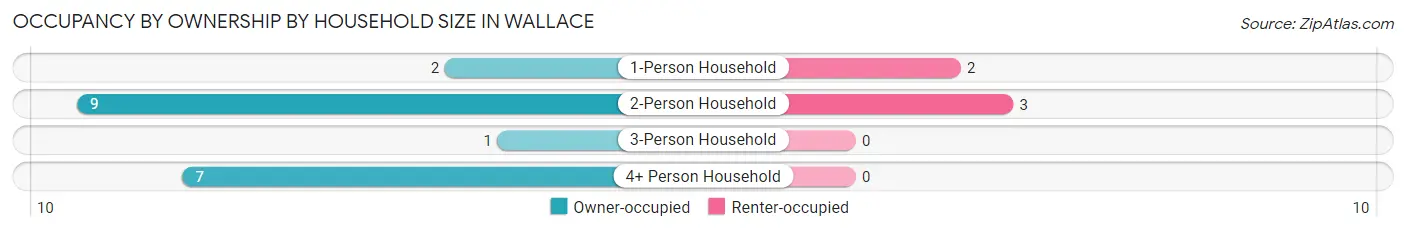
| Household Size | Owner-occupied | Renter-occupied |
| 1-Person Household | 2 (50.0%) | 2 (50.0%) |
| 2-Person Household | 9 (75.0%) | 3 (25.0%) |
| 3-Person Household | 1 (100.0%) | 0 (0.0%) |
| 4+ Person Household | 7 (100.0%) | 0 (0.0%) |
| Total Housing Units | 19 (79.2%) | 5 (20.8%) |
Occupancy by Educational Attainment in Wallace
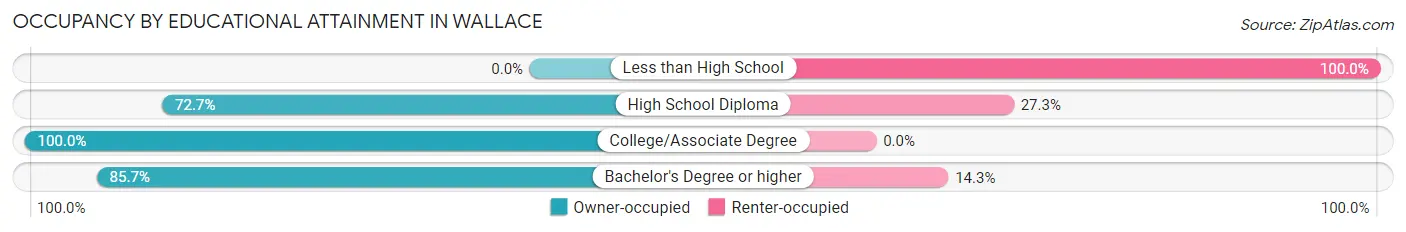
| Household Size | Owner-occupied | Renter-occupied |
| Less than High School | 0 (0.0%) | 1 (100.0%) |
| High School Diploma | 8 (72.7%) | 3 (27.3%) |
| College/Associate Degree | 5 (100.0%) | 0 (0.0%) |
| Bachelor's Degree or higher | 6 (85.7%) | 1 (14.3%) |
Occupancy by Age of Householder in Wallace
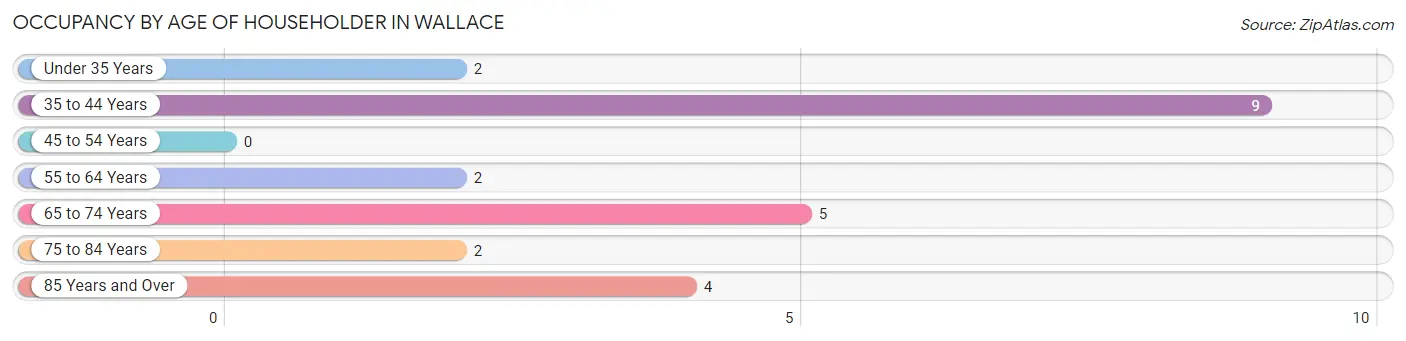
| Age Bracket | # Households | % Households |
| Under 35 Years | 2 | 8.3% |
| 35 to 44 Years | 9 | 37.5% |
| 45 to 54 Years | 0 | 0.0% |
| 55 to 64 Years | 2 | 8.3% |
| 65 to 74 Years | 5 | 20.8% |
| 75 to 84 Years | 2 | 8.3% |
| 85 Years and Over | 4 | 16.7% |
| Total | 24 | 100.0% |
Housing Finances in Wallace
Median Income by Occupancy in Wallace
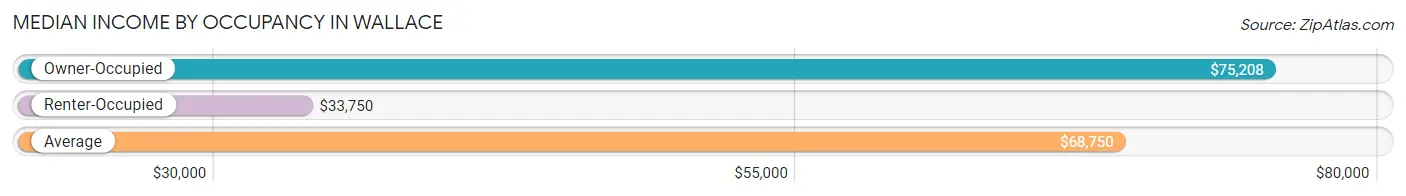
| Occupancy Type | # Households | Median Income |
| Owner-Occupied | 19 (79.2%) | $75,208 |
| Renter-Occupied | 5 (20.8%) | $33,750 |
| Average | 24 (100.0%) | $68,750 |
Occupancy by Householder Income Bracket in Wallace
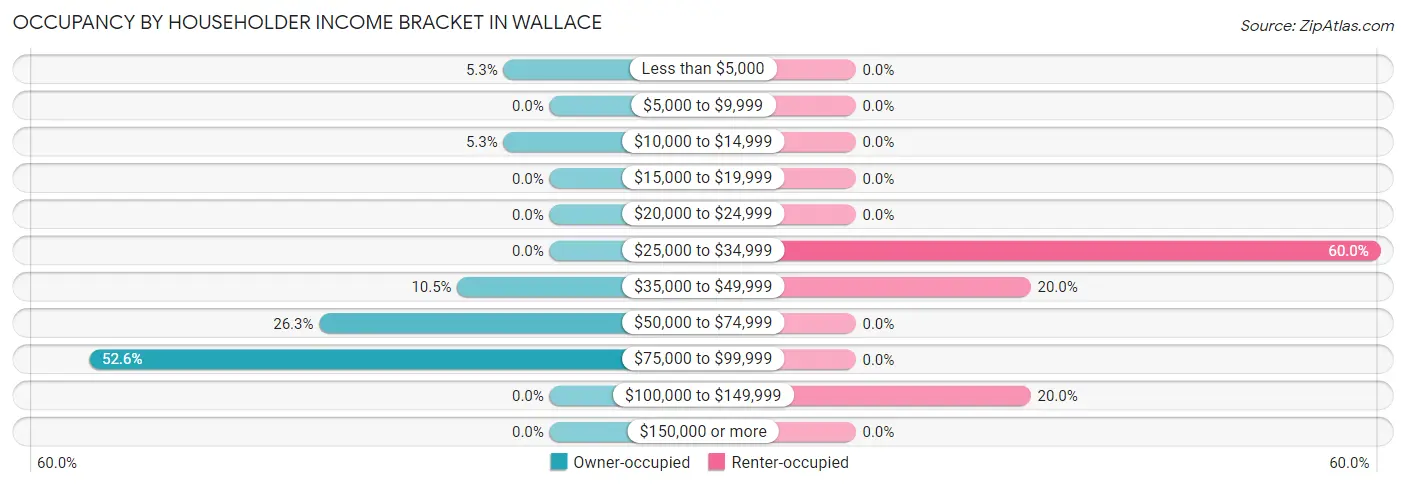
| Income Bracket | Owner-occupied | Renter-occupied |
| Less than $5,000 | 1 (5.3%) | 0 (0.0%) |
| $5,000 to $9,999 | 0 (0.0%) | 0 (0.0%) |
| $10,000 to $14,999 | 1 (5.3%) | 0 (0.0%) |
| $15,000 to $19,999 | 0 (0.0%) | 0 (0.0%) |
| $20,000 to $24,999 | 0 (0.0%) | 0 (0.0%) |
| $25,000 to $34,999 | 0 (0.0%) | 3 (60.0%) |
| $35,000 to $49,999 | 2 (10.5%) | 1 (20.0%) |
| $50,000 to $74,999 | 5 (26.3%) | 0 (0.0%) |
| $75,000 to $99,999 | 10 (52.6%) | 0 (0.0%) |
| $100,000 to $149,999 | 0 (0.0%) | 1 (20.0%) |
| $150,000 or more | 0 (0.0%) | 0 (0.0%) |
| Total | 19 (100.0%) | 5 (100.0%) |
Monthly Housing Cost Tiers in Wallace
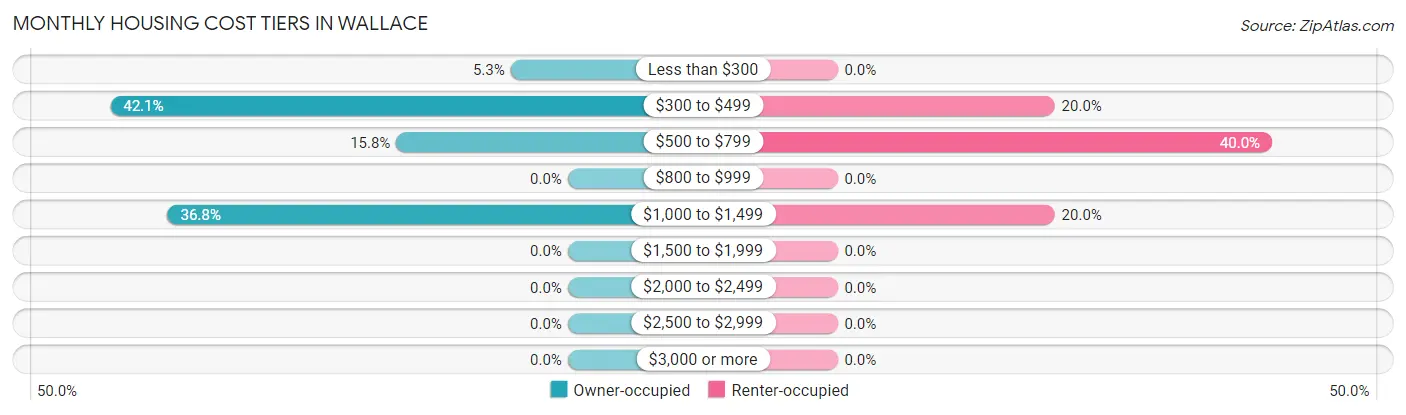
| Monthly Cost | Owner-occupied | Renter-occupied |
| Less than $300 | 1 (5.3%) | 0 (0.0%) |
| $300 to $499 | 8 (42.1%) | 1 (20.0%) |
| $500 to $799 | 3 (15.8%) | 2 (40.0%) |
| $800 to $999 | 0 (0.0%) | 0 (0.0%) |
| $1,000 to $1,499 | 7 (36.8%) | 1 (20.0%) |
| $1,500 to $1,999 | 0 (0.0%) | 0 (0.0%) |
| $2,000 to $2,499 | 0 (0.0%) | 0 (0.0%) |
| $2,500 to $2,999 | 0 (0.0%) | 0 (0.0%) |
| $3,000 or more | 0 (0.0%) | 0 (0.0%) |
| Total | 19 (100.0%) | 5 (100.0%) |
Physical Housing Characteristics in Wallace
Housing Structures in Wallace
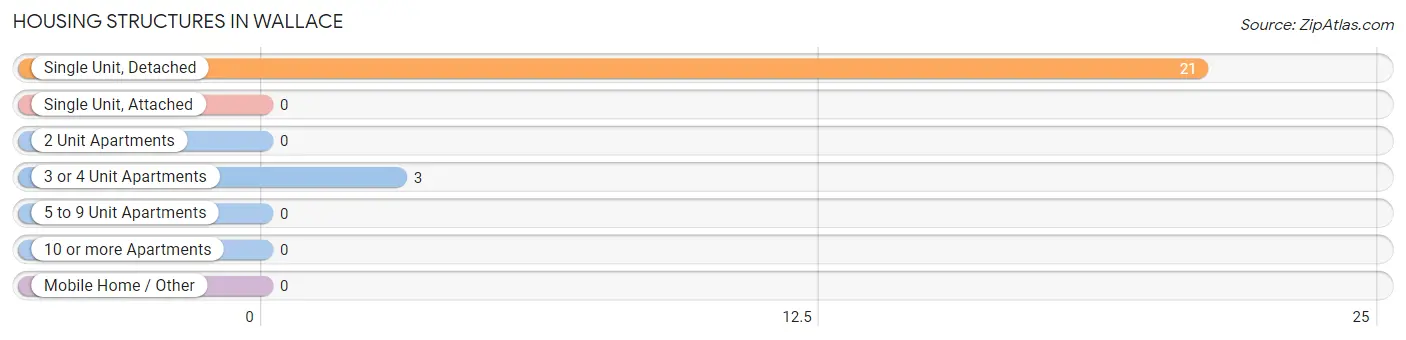
| Structure Type | # Housing Units | % Housing Units |
| Single Unit, Detached | 21 | 87.5% |
| Single Unit, Attached | 0 | 0.0% |
| 2 Unit Apartments | 0 | 0.0% |
| 3 or 4 Unit Apartments | 3 | 12.5% |
| 5 to 9 Unit Apartments | 0 | 0.0% |
| 10 or more Apartments | 0 | 0.0% |
| Mobile Home / Other | 0 | 0.0% |
| Total | 24 | 100.0% |
Housing Structures by Occupancy in Wallace
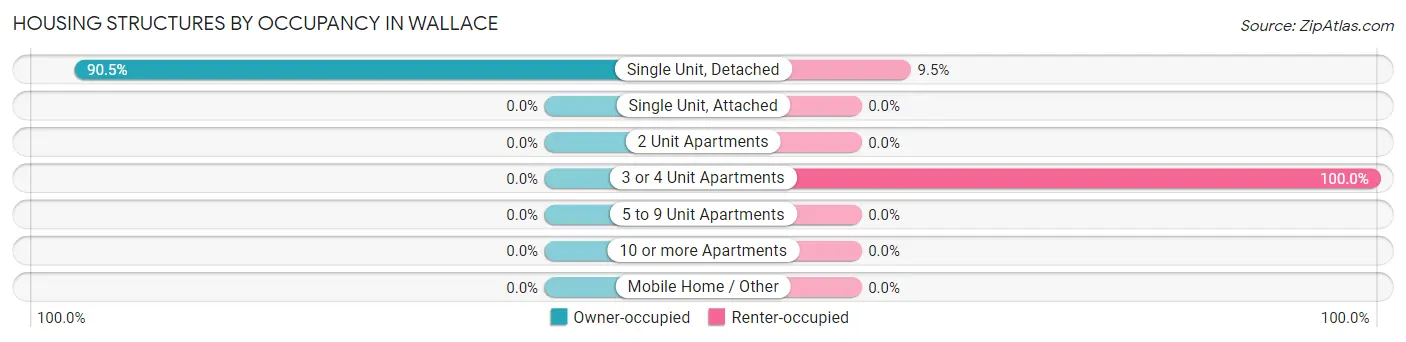
| Structure Type | Owner-occupied | Renter-occupied |
| Single Unit, Detached | 19 (90.5%) | 2 (9.5%) |
| Single Unit, Attached | 0 (0.0%) | 0 (0.0%) |
| 2 Unit Apartments | 0 (0.0%) | 0 (0.0%) |
| 3 or 4 Unit Apartments | 0 (0.0%) | 3 (100.0%) |
| 5 to 9 Unit Apartments | 0 (0.0%) | 0 (0.0%) |
| 10 or more Apartments | 0 (0.0%) | 0 (0.0%) |
| Mobile Home / Other | 0 (0.0%) | 0 (0.0%) |
| Total | 19 (79.2%) | 5 (20.8%) |
Housing Structures by Number of Rooms in Wallace
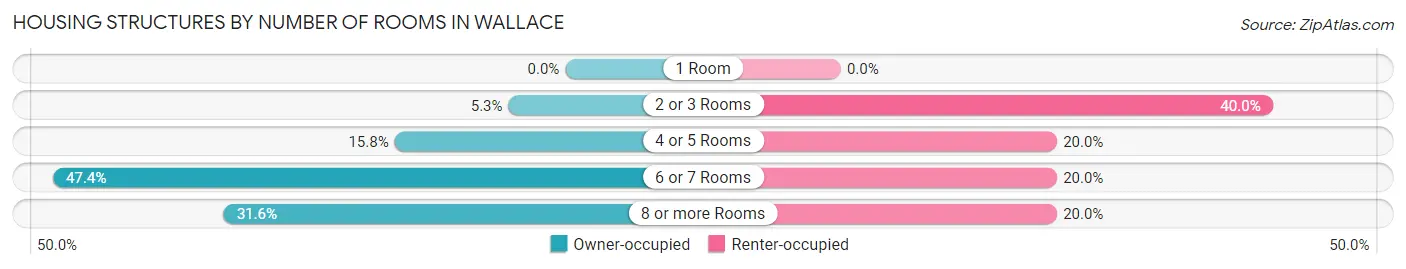
| Number of Rooms | Owner-occupied | Renter-occupied |
| 1 Room | 0 (0.0%) | 0 (0.0%) |
| 2 or 3 Rooms | 1 (5.3%) | 2 (40.0%) |
| 4 or 5 Rooms | 3 (15.8%) | 1 (20.0%) |
| 6 or 7 Rooms | 9 (47.4%) | 1 (20.0%) |
| 8 or more Rooms | 6 (31.6%) | 1 (20.0%) |
| Total | 19 (100.0%) | 5 (100.0%) |
Housing Structure by Heating Type in Wallace
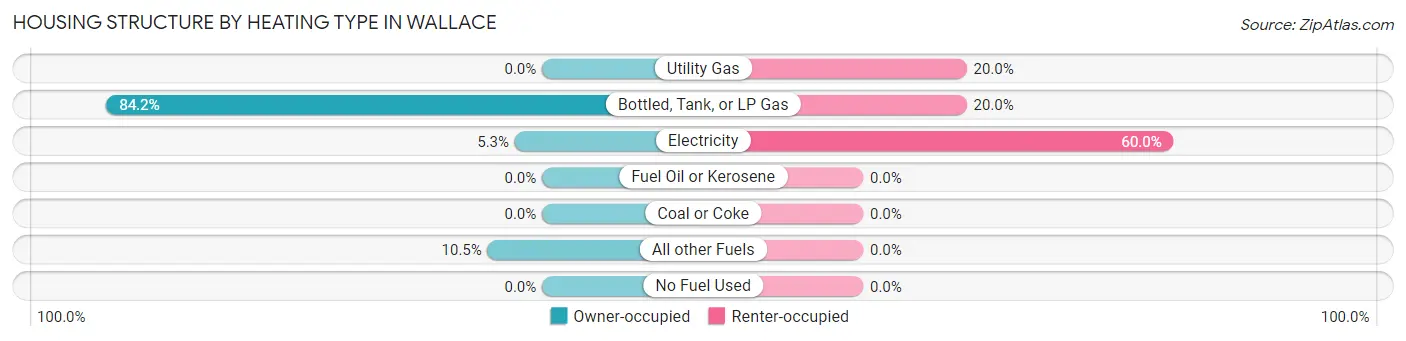
| Heating Type | Owner-occupied | Renter-occupied |
| Utility Gas | 0 (0.0%) | 1 (20.0%) |
| Bottled, Tank, or LP Gas | 16 (84.2%) | 1 (20.0%) |
| Electricity | 1 (5.3%) | 3 (60.0%) |
| Fuel Oil or Kerosene | 0 (0.0%) | 0 (0.0%) |
| Coal or Coke | 0 (0.0%) | 0 (0.0%) |
| All other Fuels | 2 (10.5%) | 0 (0.0%) |
| No Fuel Used | 0 (0.0%) | 0 (0.0%) |
| Total | 19 (100.0%) | 5 (100.0%) |
Household Vehicle Usage in Wallace
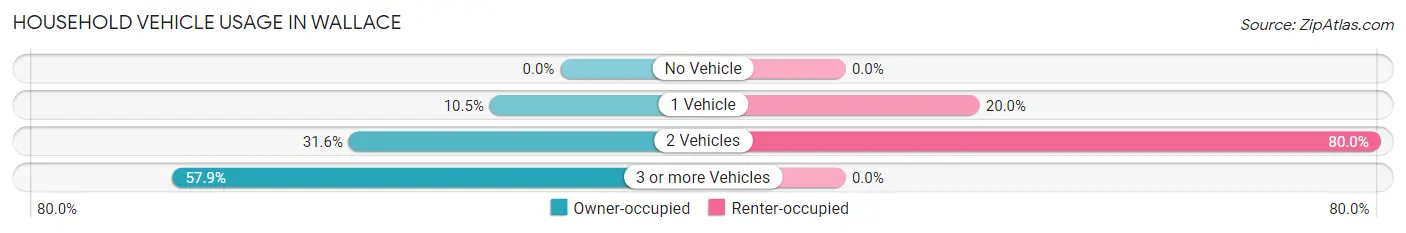
| Vehicles per Household | Owner-occupied | Renter-occupied |
| No Vehicle | 0 (0.0%) | 0 (0.0%) |
| 1 Vehicle | 2 (10.5%) | 1 (20.0%) |
| 2 Vehicles | 6 (31.6%) | 4 (80.0%) |
| 3 or more Vehicles | 11 (57.9%) | 0 (0.0%) |
| Total | 19 (100.0%) | 5 (100.0%) |
Real Estate & Mortgages in Wallace
Real Estate and Mortgage Overview in Wallace
| Characteristic | Without Mortgage | With Mortgage |
| Housing Units | 19 | 0 |
| Median Property Value | $85,800 | $0 |
| Median Household Income | $75,208 | $0 |
| Monthly Housing Costs | $550 | $0 |
| Real Estate Taxes | $1,104 | $0 |
Property Value by Mortgage Status in Wallace
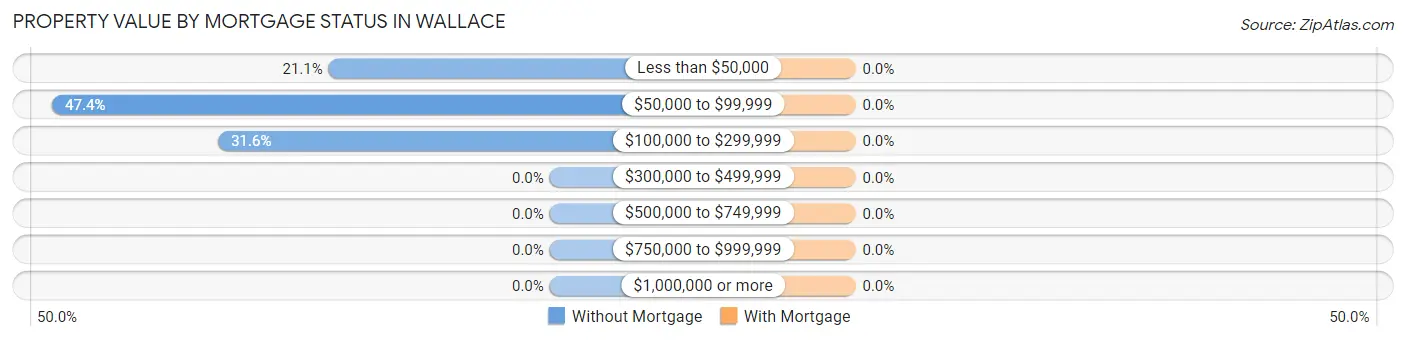
| Property Value | Without Mortgage | With Mortgage |
| Less than $50,000 | 4 (21.0%) | 0 (0.0%) |
| $50,000 to $99,999 | 9 (47.4%) | 0 (0.0%) |
| $100,000 to $299,999 | 6 (31.6%) | 0 (0.0%) |
| $300,000 to $499,999 | 0 (0.0%) | 0 (0.0%) |
| $500,000 to $749,999 | 0 (0.0%) | 0 (0.0%) |
| $750,000 to $999,999 | 0 (0.0%) | 0 (0.0%) |
| $1,000,000 or more | 0 (0.0%) | 0 (0.0%) |
| Total | 19 (100.0%) | 0 (0.0%) |
Household Income by Mortgage Status in Wallace
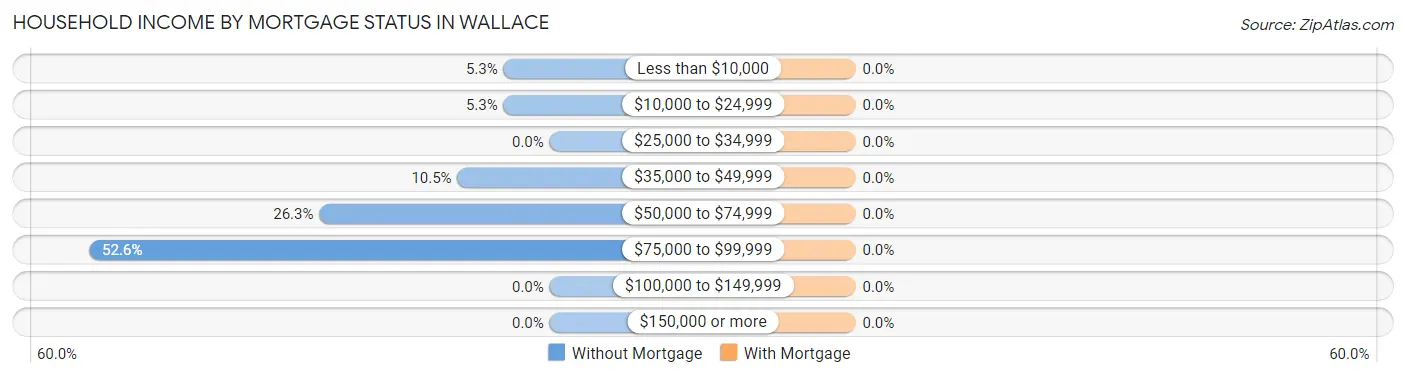
| Household Income | Without Mortgage | With Mortgage |
| Less than $10,000 | 1 (5.3%) | 0 (0.0%) |
| $10,000 to $24,999 | 1 (5.3%) | 0 (0.0%) |
| $25,000 to $34,999 | 0 (0.0%) | 0 (0.0%) |
| $35,000 to $49,999 | 2 (10.5%) | 0 (0.0%) |
| $50,000 to $74,999 | 5 (26.3%) | 0 (0.0%) |
| $75,000 to $99,999 | 10 (52.6%) | 0 (0.0%) |
| $100,000 to $149,999 | 0 (0.0%) | 0 (0.0%) |
| $150,000 or more | 0 (0.0%) | 0 (0.0%) |
| Total | 19 (100.0%) | 0 (0.0%) |
Property Value to Household Income Ratio in Wallace
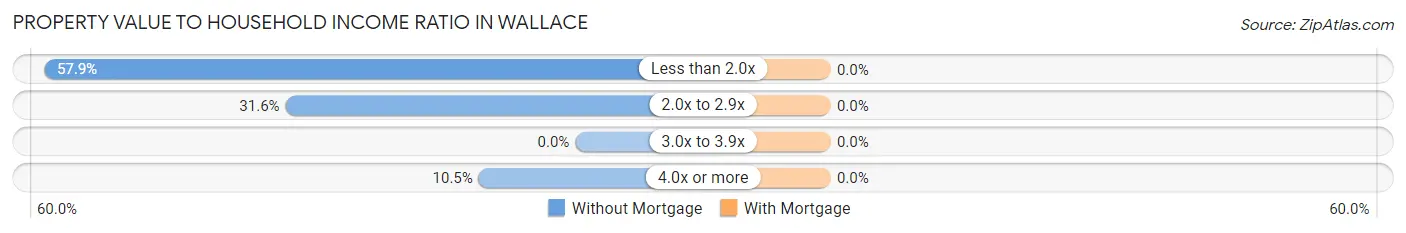
| Value-to-Income Ratio | Without Mortgage | With Mortgage |
| Less than 2.0x | 11 (57.9%) | 0 (0.0%) |
| 2.0x to 2.9x | 6 (31.6%) | 0 (0.0%) |
| 3.0x to 3.9x | 0 (0.0%) | 0 (0.0%) |
| 4.0x or more | 2 (10.5%) | 0 (0.0%) |
| Total | 19 (100.0%) | 0 (0.0%) |
Real Estate Taxes by Mortgage Status in Wallace
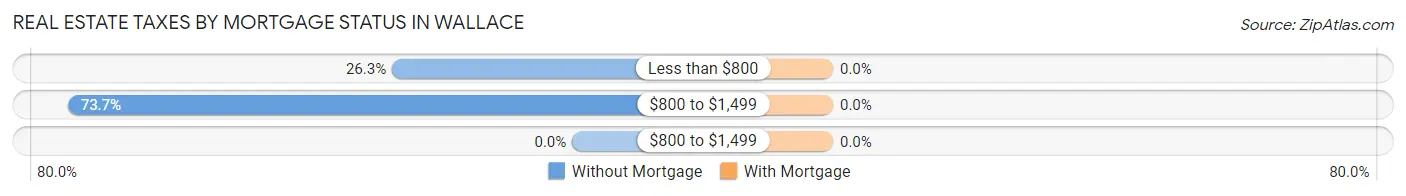
| Property Taxes | Without Mortgage | With Mortgage |
| Less than $800 | 5 (26.3%) | 0 (0.0%) |
| $800 to $1,499 | 14 (73.7%) | 0 (0.0%) |
| $800 to $1,499 | 0 (0.0%) | 0 (0.0%) |
| Total | 19 (100.0%) | 0 (0.0%) |
Health & Disability in Wallace
Health Insurance Coverage by Age in Wallace
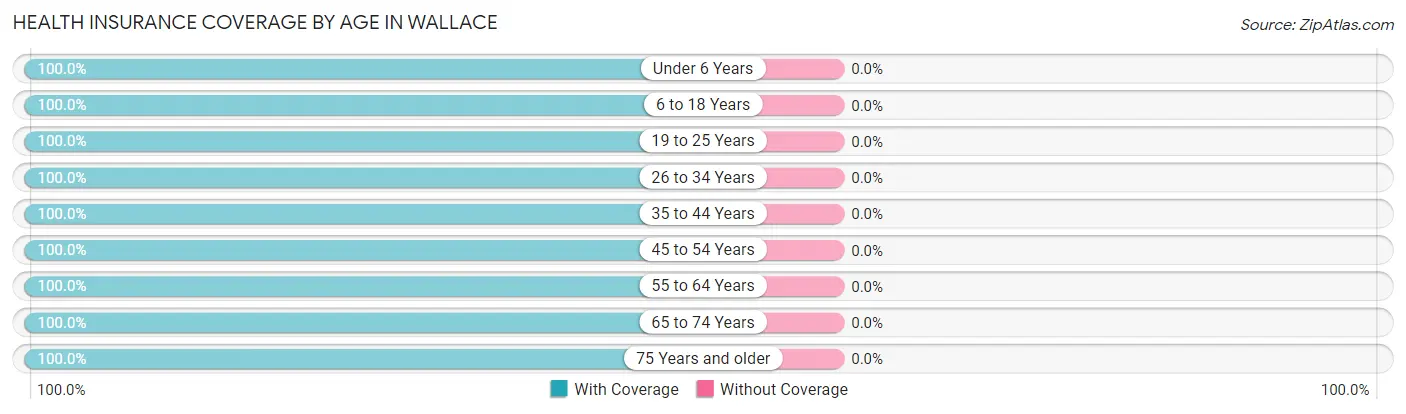
| Age Bracket | With Coverage | Without Coverage |
| Under 6 Years | 2 (100.0%) | 0 (0.0%) |
| 6 to 18 Years | 19 (100.0%) | 0 (0.0%) |
| 19 to 25 Years | 2 (100.0%) | 0 (0.0%) |
| 26 to 34 Years | 2 (100.0%) | 0 (0.0%) |
| 35 to 44 Years | 10 (100.0%) | 0 (0.0%) |
| 45 to 54 Years | 4 (100.0%) | 0 (0.0%) |
| 55 to 64 Years | 14 (100.0%) | 0 (0.0%) |
| 65 to 74 Years | 9 (100.0%) | 0 (0.0%) |
| 75 Years and older | 6 (100.0%) | 0 (0.0%) |
| Total | 68 (100.0%) | 0 (0.0%) |
Health Insurance Coverage by Citizenship Status in Wallace
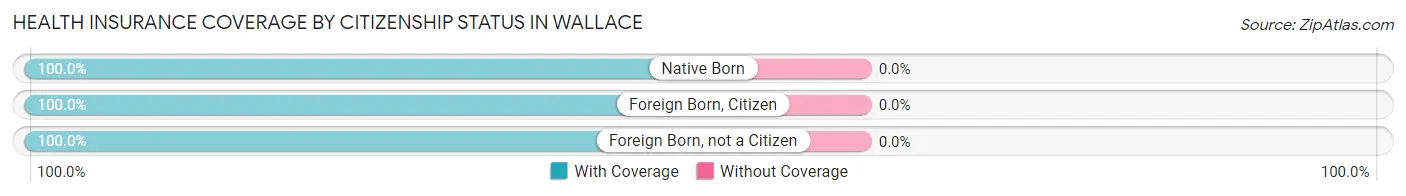
| Citizenship Status | With Coverage | Without Coverage |
| Native Born | 2 (100.0%) | 0 (0.0%) |
| Foreign Born, Citizen | 19 (100.0%) | 0 (0.0%) |
| Foreign Born, not a Citizen | 2 (100.0%) | 0 (0.0%) |
Health Insurance Coverage by Household Income in Wallace
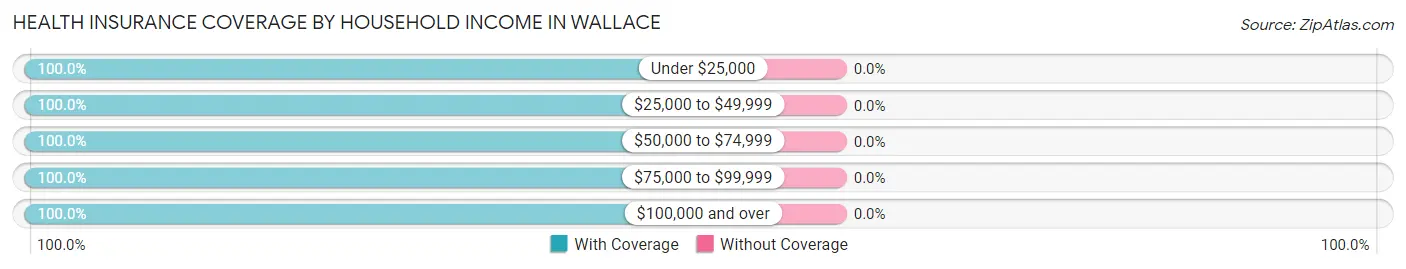
| Household Income | With Coverage | Without Coverage |
| Under $25,000 | 2 (100.0%) | 0 (0.0%) |
| $25,000 to $49,999 | 10 (100.0%) | 0 (0.0%) |
| $50,000 to $74,999 | 16 (100.0%) | 0 (0.0%) |
| $75,000 to $99,999 | 37 (100.0%) | 0 (0.0%) |
| $100,000 and over | 3 (100.0%) | 0 (0.0%) |
Public vs Private Health Insurance Coverage by Age in Wallace
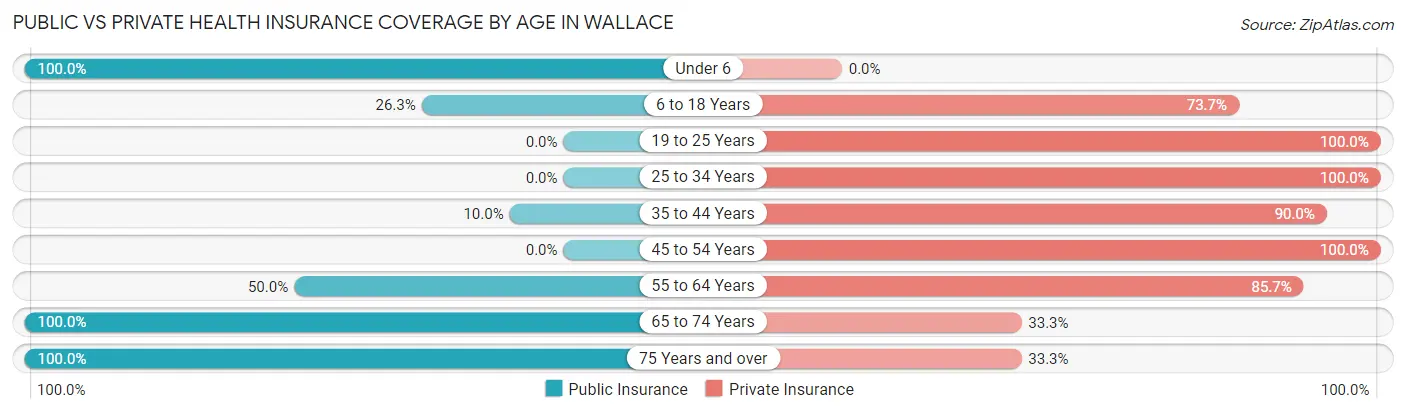
| Age Bracket | Public Insurance | Private Insurance |
| Under 6 | 2 (100.0%) | 0 (0.0%) |
| 6 to 18 Years | 5 (26.3%) | 14 (73.7%) |
| 19 to 25 Years | 0 (0.0%) | 2 (100.0%) |
| 25 to 34 Years | 0 (0.0%) | 2 (100.0%) |
| 35 to 44 Years | 1 (10.0%) | 9 (90.0%) |
| 45 to 54 Years | 0 (0.0%) | 4 (100.0%) |
| 55 to 64 Years | 7 (50.0%) | 12 (85.7%) |
| 65 to 74 Years | 9 (100.0%) | 3 (33.3%) |
| 75 Years and over | 6 (100.0%) | 2 (33.3%) |
| Total | 30 (44.1%) | 48 (70.6%) |
Disability Status by Sex by Age in Wallace
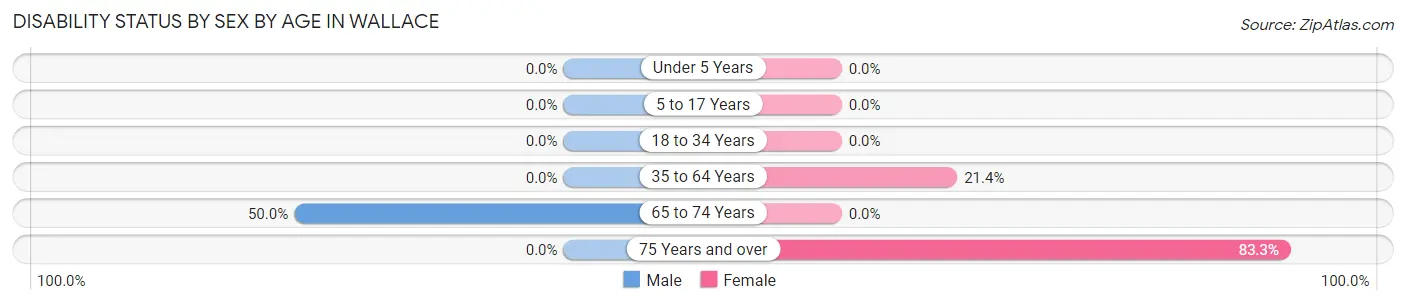
| Age Bracket | Male | Female |
| Under 5 Years | 0 (0.0%) | 0 (0.0%) |
| 5 to 17 Years | 0 (0.0%) | 0 (0.0%) |
| 18 to 34 Years | 0 (0.0%) | 0 (0.0%) |
| 35 to 64 Years | 0 (0.0%) | 3 (21.4%) |
| 65 to 74 Years | 3 (50.0%) | 0 (0.0%) |
| 75 Years and over | 0 (0.0%) | 5 (83.3%) |
Disability Class by Sex by Age in Wallace
Disability Class: Hearing Difficulty
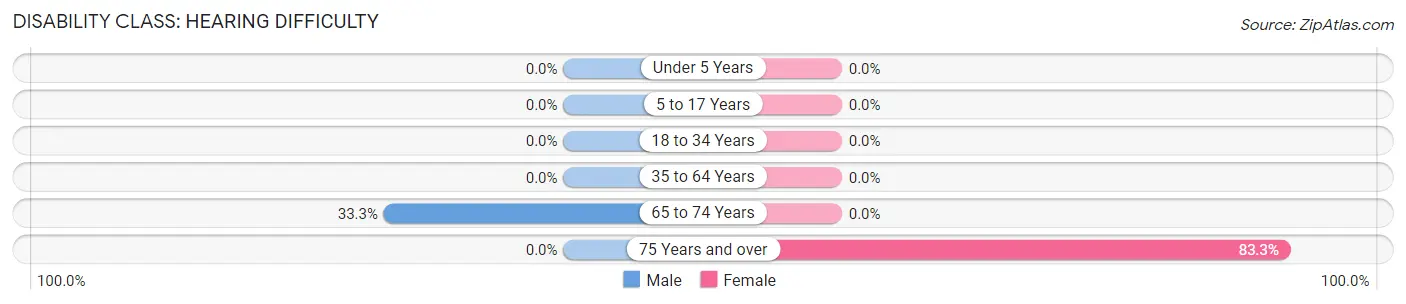
| Age Bracket | Male | Female |
| Under 5 Years | 0 (0.0%) | 0 (0.0%) |
| 5 to 17 Years | 0 (0.0%) | 0 (0.0%) |
| 18 to 34 Years | 0 (0.0%) | 0 (0.0%) |
| 35 to 64 Years | 0 (0.0%) | 0 (0.0%) |
| 65 to 74 Years | 2 (33.3%) | 0 (0.0%) |
| 75 Years and over | 0 (0.0%) | 5 (83.3%) |
Disability Class: Vision Difficulty
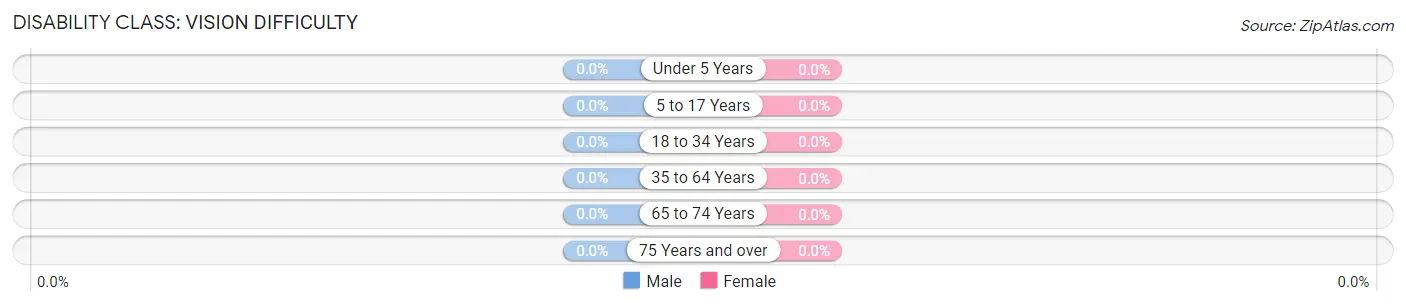
| Age Bracket | Male | Female |
| Under 5 Years | 0 (0.0%) | 0 (0.0%) |
| 5 to 17 Years | 0 (0.0%) | 0 (0.0%) |
| 18 to 34 Years | 0 (0.0%) | 0 (0.0%) |
| 35 to 64 Years | 0 (0.0%) | 0 (0.0%) |
| 65 to 74 Years | 0 (0.0%) | 0 (0.0%) |
| 75 Years and over | 0 (0.0%) | 0 (0.0%) |
Disability Class: Cognitive Difficulty
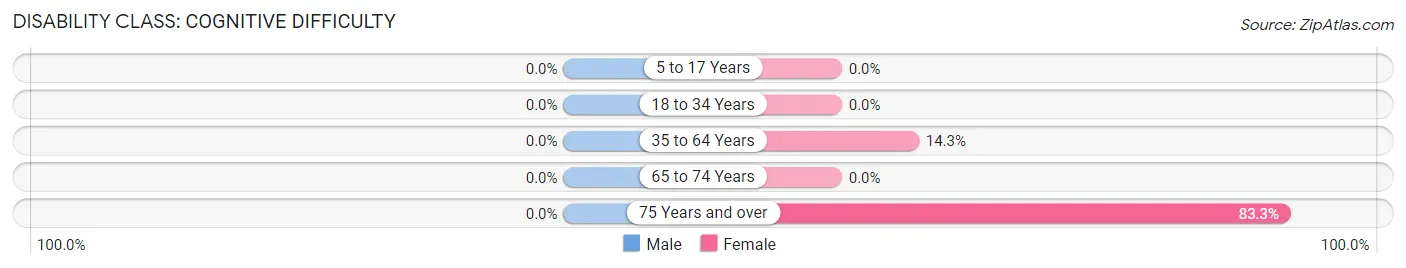
| Age Bracket | Male | Female |
| 5 to 17 Years | 0 (0.0%) | 0 (0.0%) |
| 18 to 34 Years | 0 (0.0%) | 0 (0.0%) |
| 35 to 64 Years | 0 (0.0%) | 2 (14.3%) |
| 65 to 74 Years | 0 (0.0%) | 0 (0.0%) |
| 75 Years and over | 0 (0.0%) | 5 (83.3%) |
Disability Class: Ambulatory Difficulty
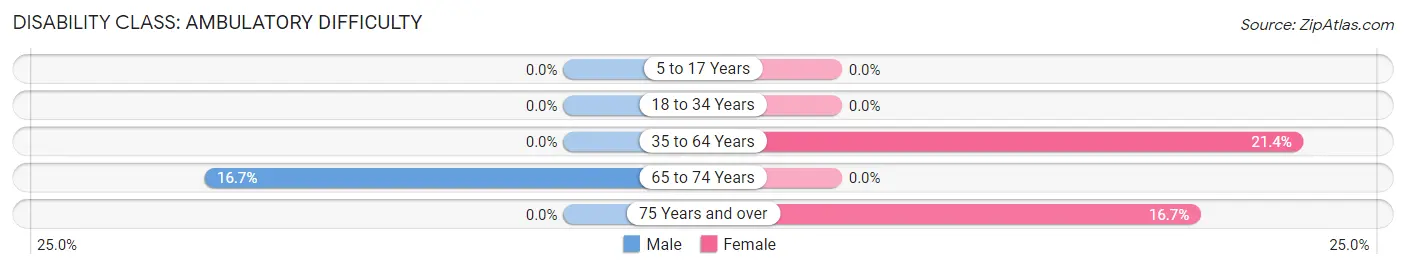
| Age Bracket | Male | Female |
| 5 to 17 Years | 0 (0.0%) | 0 (0.0%) |
| 18 to 34 Years | 0 (0.0%) | 0 (0.0%) |
| 35 to 64 Years | 0 (0.0%) | 3 (21.4%) |
| 65 to 74 Years | 1 (16.7%) | 0 (0.0%) |
| 75 Years and over | 0 (0.0%) | 1 (16.7%) |
Disability Class: Self-Care Difficulty
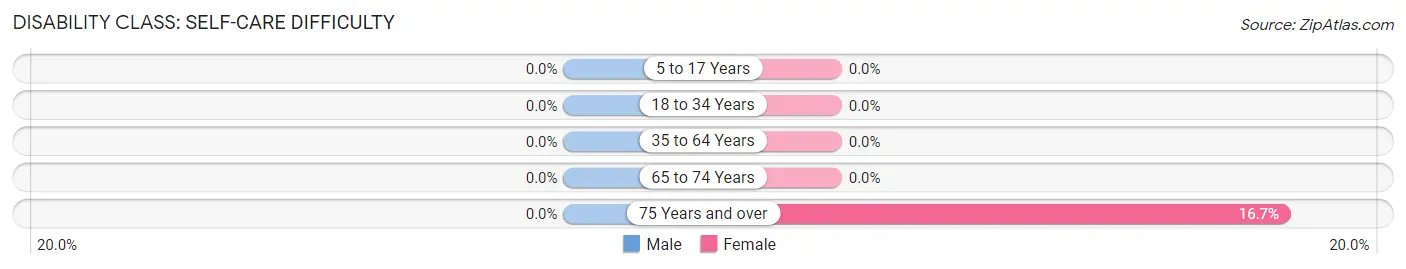
| Age Bracket | Male | Female |
| 5 to 17 Years | 0 (0.0%) | 0 (0.0%) |
| 18 to 34 Years | 0 (0.0%) | 0 (0.0%) |
| 35 to 64 Years | 0 (0.0%) | 0 (0.0%) |
| 65 to 74 Years | 0 (0.0%) | 0 (0.0%) |
| 75 Years and over | 0 (0.0%) | 1 (16.7%) |
Technology Access in Wallace
Computing Device Access in Wallace
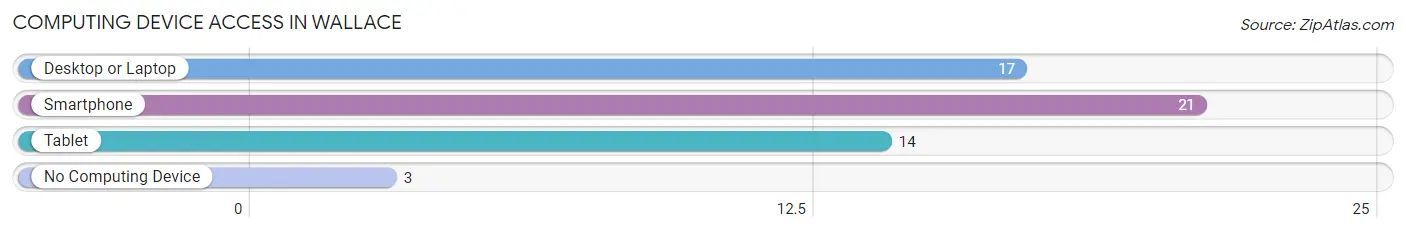
| Device Type | # Households | % Households |
| Desktop or Laptop | 17 | 70.8% |
| Smartphone | 21 | 87.5% |
| Tablet | 14 | 58.3% |
| No Computing Device | 3 | 12.5% |
| Total | 24 | 100.0% |
Internet Access in Wallace
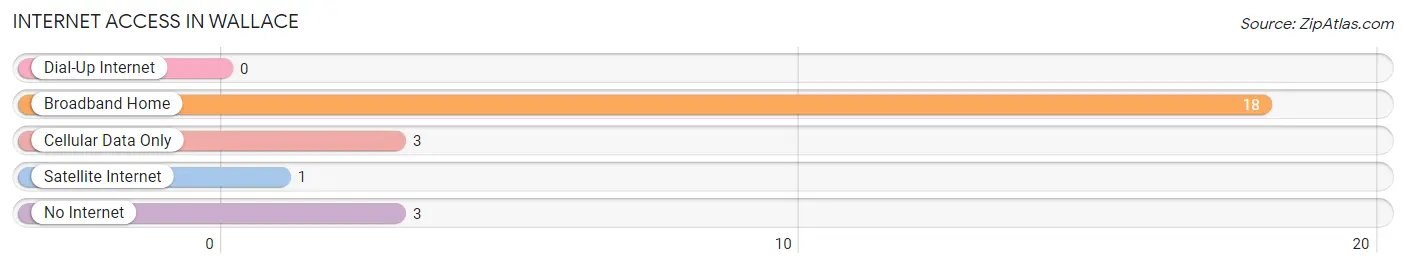
| Internet Type | # Households | % Households |
| Dial-Up Internet | 0 | 0.0% |
| Broadband Home | 18 | 75.0% |
| Cellular Data Only | 3 | 12.5% |
| Satellite Internet | 1 | 4.2% |
| No Internet | 3 | 12.5% |
| Total | 24 | 100.0% |
Wallace Summary
Wallace, South Dakota is a small town located in the southeastern corner of the state. It is situated in the rolling hills of the Missouri River Valley, and is surrounded by the vast prairies of the Great Plains. The town has a population of just over 500 people, and is the county seat of Deuel County.
Geographically, Wallace is located in the Missouri River Valley, which is part of the Great Plains region. The town is situated on the banks of the Missouri River, and is surrounded by rolling hills and prairies. The area is known for its rich soil and abundant wildlife, and is home to a variety of plant and animal species. The climate in Wallace is generally mild, with hot summers and cold winters.
The economy of Wallace is largely based on agriculture. The town is home to several farms, which produce a variety of crops, including corn, wheat, soybeans, and hay. The town also has a small manufacturing sector, which produces a variety of products, including furniture, clothing, and food products. In addition, Wallace is home to several small businesses, including restaurants, retail stores, and service providers.
Demographically, Wallace is a predominantly white town, with a population of just over 500 people. The town has a median age of 37.5 years, and a median household income of $41,000. The town is home to a variety of religious denominations, including Catholic, Lutheran, and Methodist.
Wallace is a small town with a rich history and a vibrant culture. The town is home to a variety of historic sites, including the Deuel County Courthouse, the Wallace Opera House, and the Wallace Museum. The town also hosts a variety of festivals and events throughout the year, including the Wallace County Fair and the Wallace County Rodeo.
Wallace is a small town with a lot to offer. It is a great place to live, work, and raise a family. The town has a rich history, a vibrant culture, and a strong economy. It is a great place to call home.
Common Questions
What is Per Capita Income in Wallace?
Per Capita income in Wallace is $22,060.
What is the Median Family Income in Wallace?
Median Family Income in Wallace is $75,833.
What is the Median Household income in Wallace?
Median Household Income in Wallace is $68,750.
What is Income or Wage Gap in Wallace?
Income or Wage Gap in Wallace is 56.0%.
Women in Wallace earn 44.0 cents for every dollar earned by a man.
What is Inequality or Gini Index in Wallace?
Inequality or Gini Index in Wallace is 0.24.
What is the Total Population of Wallace?
Total Population of Wallace is 68.
What is the Total Male Population of Wallace?
Total Male Population of Wallace is 32.
What is the Total Female Population of Wallace?
Total Female Population of Wallace is 36.
What is the Ratio of Males per 100 Females in Wallace?
There are 88.89 Males per 100 Females in Wallace.
What is the Ratio of Females per 100 Males in Wallace?
There are 112.50 Females per 100 Males in Wallace.
What is the Median Population Age in Wallace?
Median Population Age in Wallace is 43.8 Years.
What is the Average Family Size in Wallace
Average Family Size in Wallace is 3.3 People.
What is the Average Household Size in Wallace
Average Household Size in Wallace is 2.8 People.
How Large is the Labor Force in Wallace?
There are 28 People in the Labor Forcein in Wallace.
What is the Percentage of People in the Labor Force in Wallace?
58.3% of People are in the Labor Force in Wallace.