Zip Codes with the Highest Percentage of Population Employed in Security & Protection in Spearfish, SD
RELATED REPORTS & OPTIONS
Security & Protection
Spearfish
Compare Zip Codes
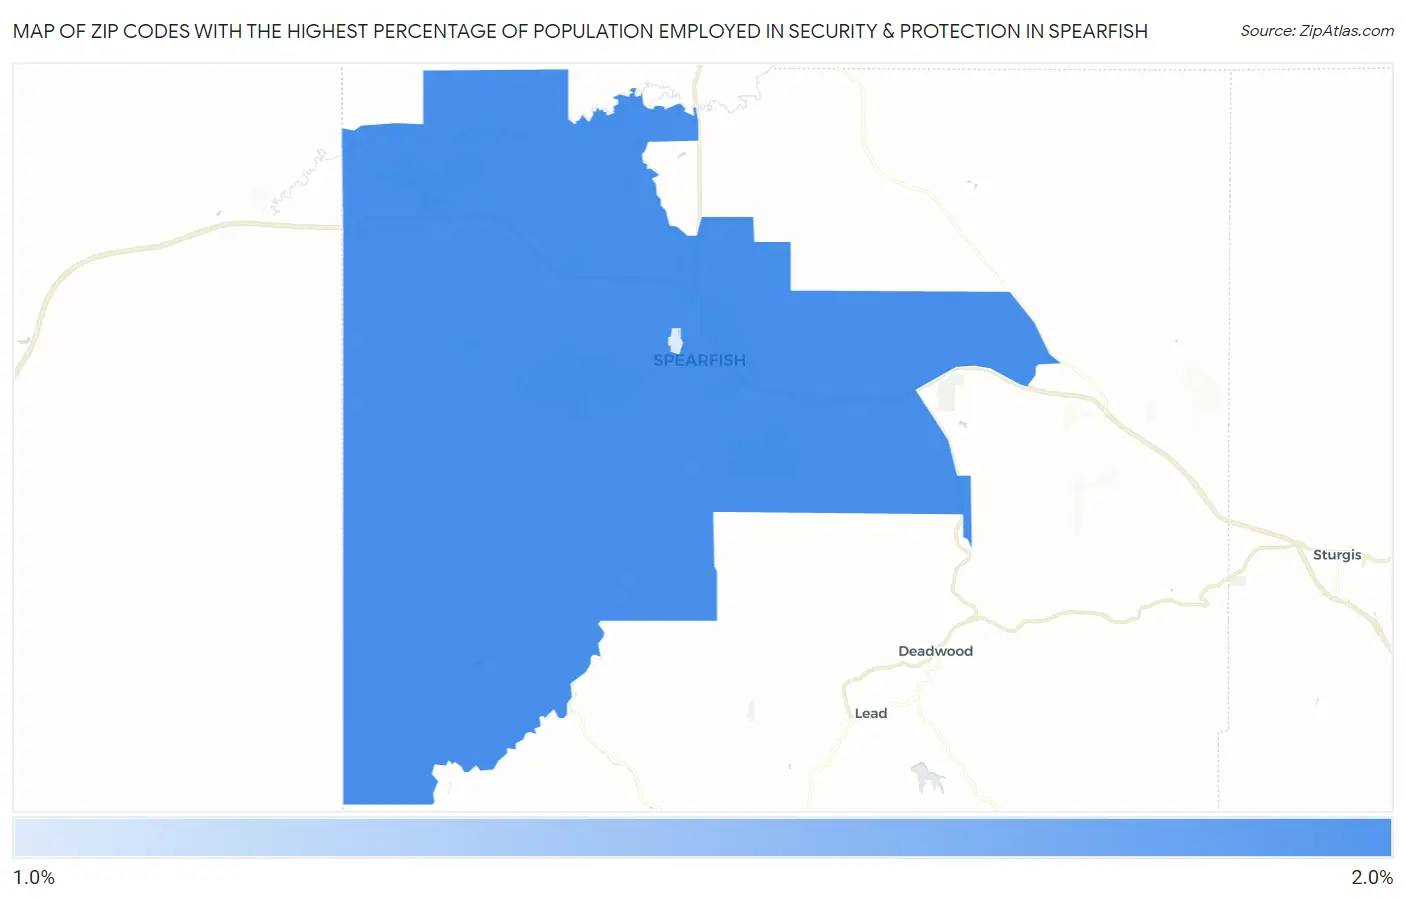
Map of Zip Codes with the Highest Percentage of Population Employed in Security & Protection in Spearfish
1.3%
1.6%
Zip Codes with the Highest Percentage of Population Employed in Security & Protection in Spearfish, SD
| Zip Code | % Employed | vs State | vs National | |
| 1. | 57783 | 1.6% | 1.8%(-0.141)#108 | 2.1%(-0.532)#15,282 |
| 2. | 57799 | 1.3% | 1.8%(-0.463)#128 | 2.1%(-0.854)#17,785 |
1
Common Questions
What are the Top Zip Codes with the Highest Percentage of Population Employed in Security & Protection in Spearfish, SD?
Top Zip Codes with the Highest Percentage of Population Employed in Security & Protection in Spearfish, SD are:
What zip code has the Highest Percentage of Population Employed in Security & Protection in Spearfish, SD?
57783 has the Highest Percentage of Population Employed in Security & Protection in Spearfish, SD with 1.6%.
What is the Percentage of Population Employed in Security & Protection in Spearfish, SD?
Percentage of Population Employed in Security & Protection in Spearfish is 2.1%.
What is the Percentage of Population Employed in Security & Protection in South Dakota?
Percentage of Population Employed in Security & Protection in South Dakota is 1.8%.
What is the Percentage of Population Employed in Security & Protection in the United States?
Percentage of Population Employed in Security & Protection in the United States is 2.1%.