Zip Codes with the Highest Percentage of Population Working from Home in Sioux Falls, SD

RELATED REPORTS & OPTIONS

Work from Home
Population
Families and Households
Female Fertility
Female Fertility (Unmarried)
Race (Community Size)
Race (Percentage)
Ancestry (Community Size)
AfricanAlbanianAmericanArabArmenianAustralianAustrianBelgianBhutaneseBlackfeetBritishBurmeseCanadianCentral AmericanCherokeeCheyenneChileanChippewaColombianCroatianCubanCzechCzechoslovakianDanishDominicanDutchEastern EuropeanEgyptianEnglishEthiopianEuropeanFinnishFrenchFrench CanadianGermanGerman RussianGreekGuatemalanHaitianHonduranHungarianIcelanderIndian (Asian)IndonesianIranianIraqiIrishIroquoisItalianJapaneseKoreanLaotianLatvianLebaneseLiberianLithuanianLuxembourgerMalaysianMexicanMexican American IndianNative HawaiianNorthern EuropeanNorwegianPakistaniPennsylvania GermanPeruvianPolishPortuguesePuerto RicanRomanianRussianSalvadoranScandinavianScotch-IrishScottishSerbianSiouxSlavicSlovakSomaliSouth AmericanSpaniardSpanishSri LankanSubsaharan AfricanSudaneseSwedishSwissSyrianThaiUkrainianVenezuelanWelshWest IndianYugoslavian
Ancestry (Percentage)
AfricanAlbanianAmericanArabArmenianAustralianAustrianBelgianBhutaneseBlackfeetBritishBurmeseCanadianCentral AmericanCherokeeCheyenneChileanChippewaColombianCroatianCubanCzechCzechoslovakianDanishDominicanDutchEastern EuropeanEgyptianEnglishEthiopianEuropeanFinnishFrenchFrench CanadianGermanGerman RussianGreekGuatemalanHaitianHonduranHungarianIcelanderIndian (Asian)IndonesianIranianIraqiIrishIroquoisItalianJapaneseKoreanLaotianLatvianLebaneseLiberianLithuanianLuxembourgerMalaysianMexicanMexican American IndianNative HawaiianNorthern EuropeanNorwegianPakistaniPennsylvania GermanPeruvianPolishPortuguesePuerto RicanRomanianRussianSalvadoranScandinavianScotch-IrishScottishSerbianSiouxSlavicSlovakSomaliSouth AmericanSpaniardSpanishSri LankanSubsaharan AfricanSudaneseSwedishSwissSyrianThaiUkrainianVenezuelanWelshWest IndianYugoslavian
Immigrant Origin (Total)
Immigrant Origin (Percentage)
Income
Income (Families)
Income (Households)
Poverty
Poverty (Families)
Unemployment
Employment Occupations
Employment Industries
Employer Class
Commute Time
Commute Means
School Enrollment
Education by Degree Field
Occupancy
Finances
Physical Characteristics
Sioux Falls
Compare Zip Codes
Comparison Subject

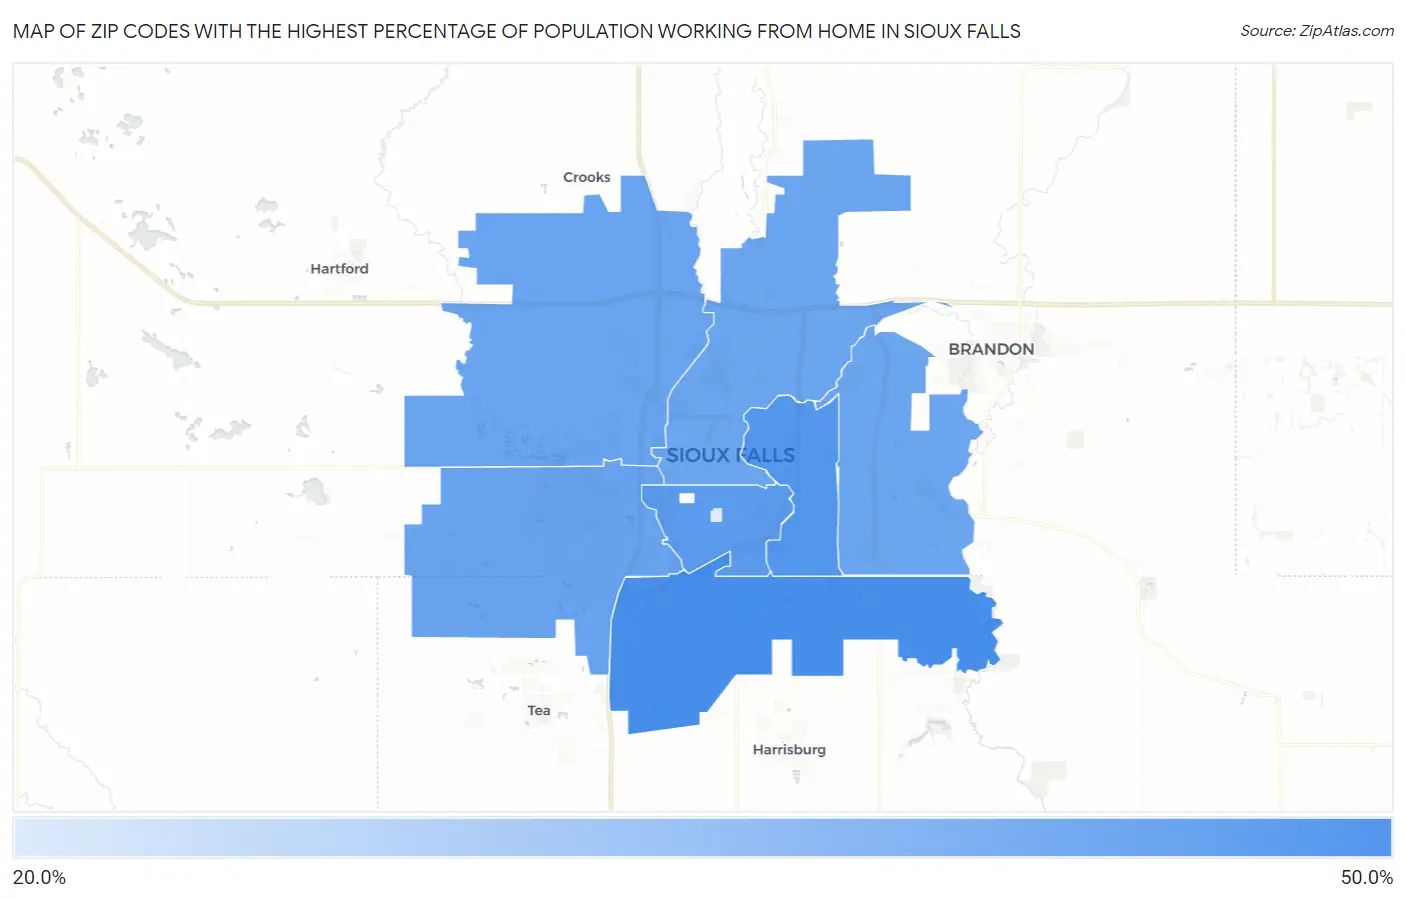
Map of Zip Codes with the Highest Percentage of Population Working from Home in Sioux Falls

0.0%
50.0%
Zip Codes with the Highest Percentage of Population Working from Home in Sioux Falls Map

Zip Codes with the Highest Percentage of Population Working from Home in Sioux Falls, SD

Zip Code % Work from Home vs State vs National
1.5710848.1%46.5%(+1.60)#16444.0%(+4.10)#10,685
2.5710345.3%46.5%(-1.20)#18744.0%(+1.30)#13,965
3.5710543.9%46.5%(-2.60)#19344.0%(-0.100)#15,625
4.5710641.8%46.5%(-4.70)#21444.0%(-2.20)#17,891
5.5710741.3%46.5%(-5.20)#22044.0%(-2.70)#18,468
6.5710441.0%46.5%(-5.50)#22244.0%(-3.00)#18,696
7.5711040.8%46.5%(-5.70)#22644.0%(-3.20)#18,896
8.5719720.7%46.5%(-25.8)#27844.0%(-23.3)#24,646

Common Questions

What are the Top 5 Zip Codes with the Highest Percentage of Population Working from Home in Sioux Falls, SD?
Top 5 Zip Codes with the Highest Percentage of Population Working from Home in Sioux Falls, SD are:
#1
48.1%
#2
45.3%
#3
43.9%
#4
41.8%
#5
41.3%
What zip code has the Highest Percentage of Population Working from Home in Sioux Falls, SD?
57108 has the Highest Percentage of Population Working from Home in Sioux Falls, SD with 48.1%.
What is the Percentage of Population Working from Home in Sioux Falls, SD?
Percentage of Population Working from Home in Sioux Falls is 43.0%.
What is the Percentage of Population Working from Home in South Dakota?
Percentage of Population Working from Home in South Dakota is 46.5%.
What is the Percentage of Population Working from Home in the United States?
Percentage of Population Working from Home in the United States is 44.0%.