Zip Codes with the Highest Percentage of Population Employed in Accommodation & Food Services in Sioux Falls, SD
RELATED REPORTS & OPTIONS
Accommodation & Food Services
Sioux Falls
Compare Zip Codes
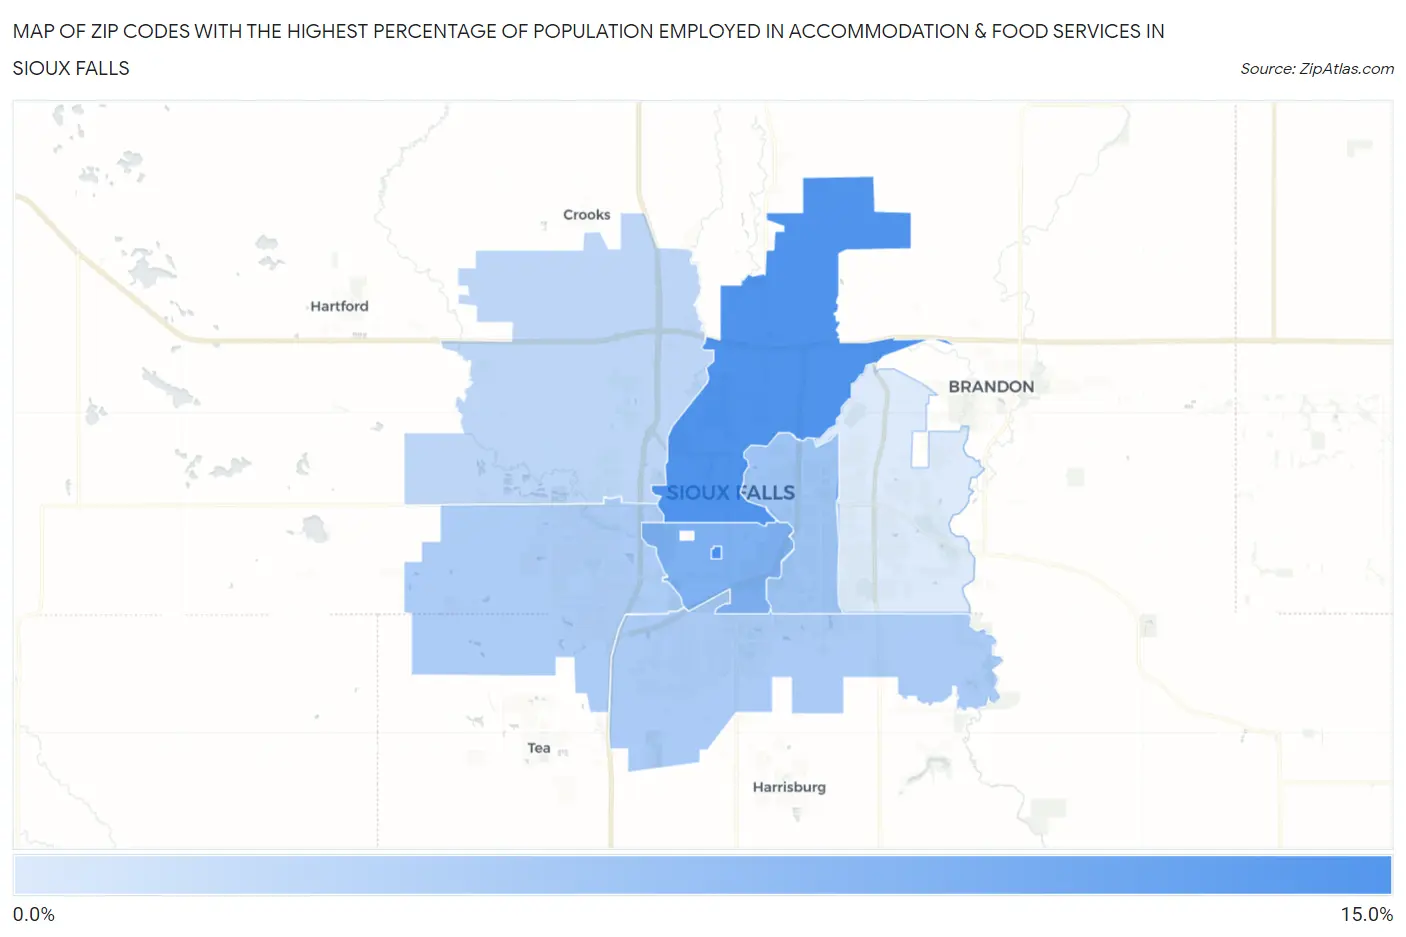
Map of Zip Codes with the Highest Percentage of Population Employed in Accommodation & Food Services in Sioux Falls
4.1%
12.0%
Zip Codes with the Highest Percentage of Population Employed in Accommodation & Food Services in Sioux Falls, SD
| Zip Code | % Employed | vs State | vs National | |
| 1. | 57197 | 12.0% | 6.8%(+5.16)#29 | 6.9%(+5.11)#2,834 |
| 2. | 57104 | 11.6% | 6.8%(+4.75)#30 | 6.9%(+4.70)#3,106 |
| 3. | 57105 | 9.1% | 6.8%(+2.24)#45 | 6.9%(+2.19)#5,859 |
| 4. | 57103 | 7.3% | 6.8%(+0.492)#68 | 6.9%(+0.443)#9,448 |
| 5. | 57108 | 6.8% | 6.8%(-0.066)#81 | 6.9%(-0.115)#10,999 |
| 6. | 57106 | 6.6% | 6.8%(-0.267)#85 | 6.9%(-0.316)#11,635 |
| 7. | 57107 | 5.7% | 6.8%(-1.11)#102 | 6.9%(-1.16)#14,307 |
| 8. | 57110 | 4.1% | 6.8%(-2.72)#161 | 6.9%(-2.77)#19,777 |
1
Common Questions
What are the Top 5 Zip Codes with the Highest Percentage of Population Employed in Accommodation & Food Services in Sioux Falls, SD?
Top 5 Zip Codes with the Highest Percentage of Population Employed in Accommodation & Food Services in Sioux Falls, SD are:
What zip code has the Highest Percentage of Population Employed in Accommodation & Food Services in Sioux Falls, SD?
57197 has the Highest Percentage of Population Employed in Accommodation & Food Services in Sioux Falls, SD with 12.0%.
What is the Percentage of Population Employed in Accommodation & Food Services in Sioux Falls, SD?
Percentage of Population Employed in Accommodation & Food Services in Sioux Falls is 7.5%.
What is the Percentage of Population Employed in Accommodation & Food Services in South Dakota?
Percentage of Population Employed in Accommodation & Food Services in South Dakota is 6.8%.
What is the Percentage of Population Employed in Accommodation & Food Services in the United States?
Percentage of Population Employed in Accommodation & Food Services in the United States is 6.9%.