Piedmont, SD Map & Demographics
Piedmont Map
Piedmont Overview
$28,090
PER CAPITA INCOME
$57,014
AVG FAMILY INCOME
$51,767
AVG HOUSEHOLD INCOME
22.7%
WAGE / INCOME GAP [ % ]
77.3¢/ $1
WAGE / INCOME GAP [ $ ]
0.39
INEQUALITY / GINI INDEX
1,198
TOTAL POPULATION
603
MALE POPULATION
595
FEMALE POPULATION
101.34
MALES / 100 FEMALES
98.67
FEMALES / 100 MALES
33.8
MEDIAN AGE
3.2
AVG FAMILY SIZE
2.6
AVG HOUSEHOLD SIZE
562
LABOR FORCE [ PEOPLE ]
65.0%
PERCENT IN LABOR FORCE
0.5%
UNEMPLOYMENT RATE
Piedmont Zip Codes
Piedmont Area Codes
Income in Piedmont
Income Overview in Piedmont
Per Capita Income in Piedmont is $28,090, while median incomes of families and households are $57,014 and $51,767 respectively.
| Characteristic | Number | Measure |
| Per Capita Income | 1,198 | $28,090 |
| Median Family Income | 315 | $57,014 |
| Mean Family Income | 315 | $85,790 |
| Median Household Income | 455 | $51,767 |
| Mean Household Income | 455 | $72,349 |
| Income Deficit | 315 | $0 |
| Wage / Income Gap (%) | 1,198 | 22.67% |
| Wage / Income Gap ($) | 1,198 | 77.33¢ per $1 |
| Gini / Inequality Index | 1,198 | 0.39 |
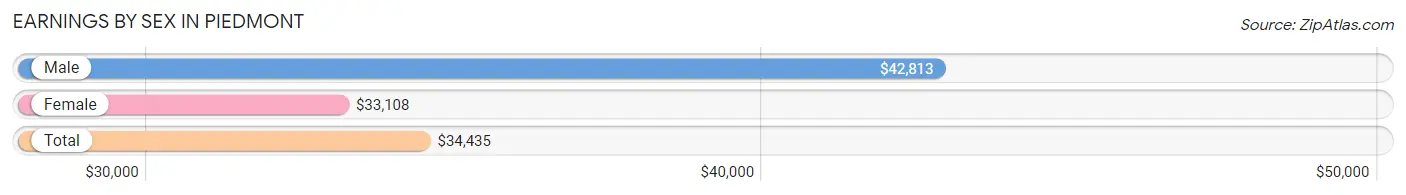
Earnings by Sex in Piedmont
Average Earnings in Piedmont are $34,435, $42,813 for men and $33,108 for women, a difference of 22.7%.
| Sex | Number | Average Earnings |
| Male | 349 (57.1%) | $42,813 |
| Female | 262 (42.9%) | $33,108 |
| Total | 611 (100.0%) | $34,435 |
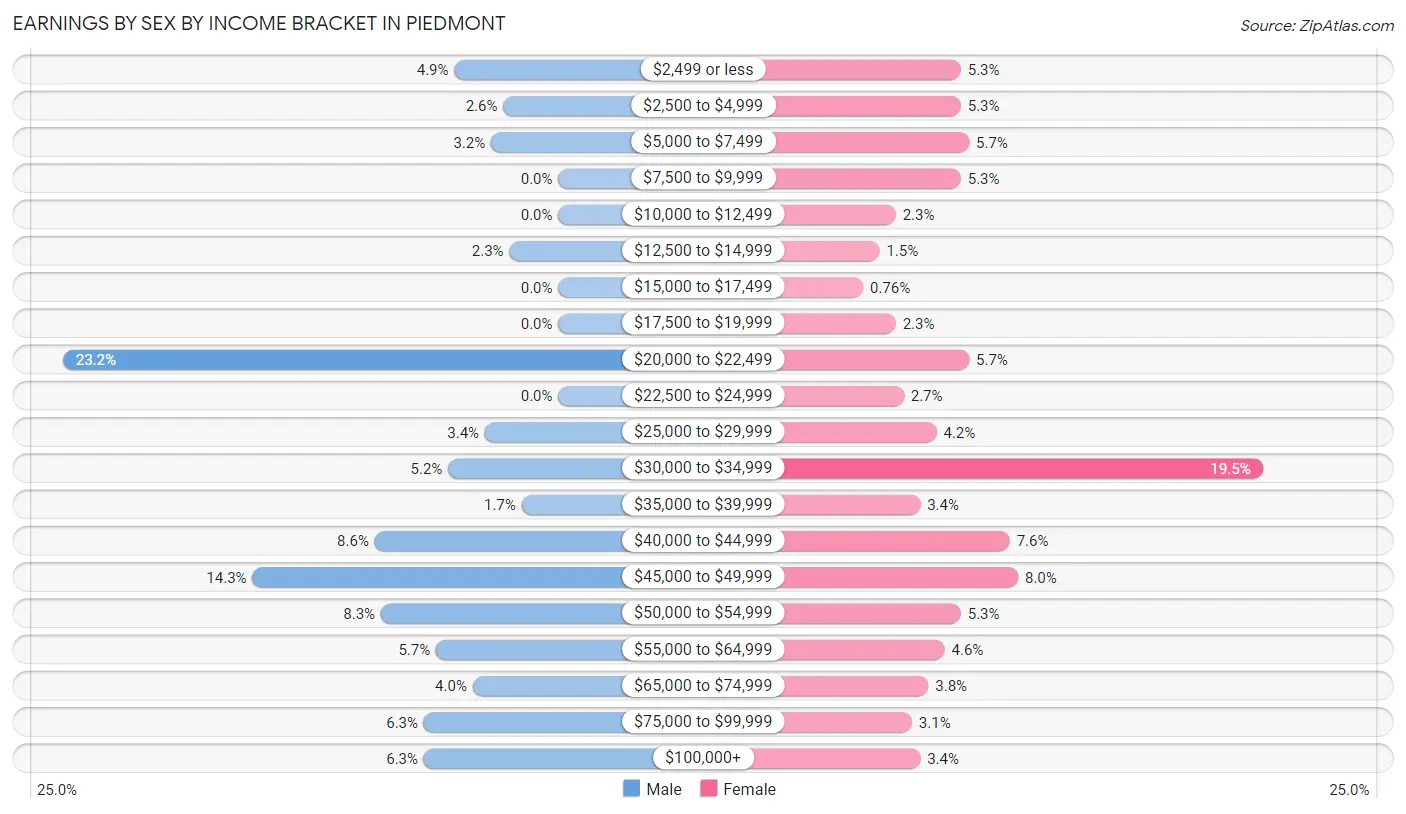
Earnings by Sex by Income Bracket in Piedmont
The most common earnings brackets in Piedmont are $20,000 to $22,499 for men (81 | 23.2%) and $30,000 to $34,999 for women (51 | 19.5%).
| Income | Male | Female |
| $2,499 or less | 17 (4.9%) | 14 (5.3%) |
| $2,500 to $4,999 | 9 (2.6%) | 14 (5.3%) |
| $5,000 to $7,499 | 11 (3.2%) | 15 (5.7%) |
| $7,500 to $9,999 | 0 (0.0%) | 14 (5.3%) |
| $10,000 to $12,499 | 0 (0.0%) | 6 (2.3%) |
| $12,500 to $14,999 | 8 (2.3%) | 4 (1.5%) |
| $15,000 to $17,499 | 0 (0.0%) | 2 (0.8%) |
| $17,500 to $19,999 | 0 (0.0%) | 6 (2.3%) |
| $20,000 to $22,499 | 81 (23.2%) | 15 (5.7%) |
| $22,500 to $24,999 | 0 (0.0%) | 7 (2.7%) |
| $25,000 to $29,999 | 12 (3.4%) | 11 (4.2%) |
| $30,000 to $34,999 | 18 (5.2%) | 51 (19.5%) |
| $35,000 to $39,999 | 6 (1.7%) | 9 (3.4%) |
| $40,000 to $44,999 | 30 (8.6%) | 20 (7.6%) |
| $45,000 to $49,999 | 50 (14.3%) | 21 (8.0%) |
| $50,000 to $54,999 | 29 (8.3%) | 14 (5.3%) |
| $55,000 to $64,999 | 20 (5.7%) | 12 (4.6%) |
| $65,000 to $74,999 | 14 (4.0%) | 10 (3.8%) |
| $75,000 to $99,999 | 22 (6.3%) | 8 (3.0%) |
| $100,000+ | 22 (6.3%) | 9 (3.4%) |
| Total | 349 (100.0%) | 262 (100.0%) |
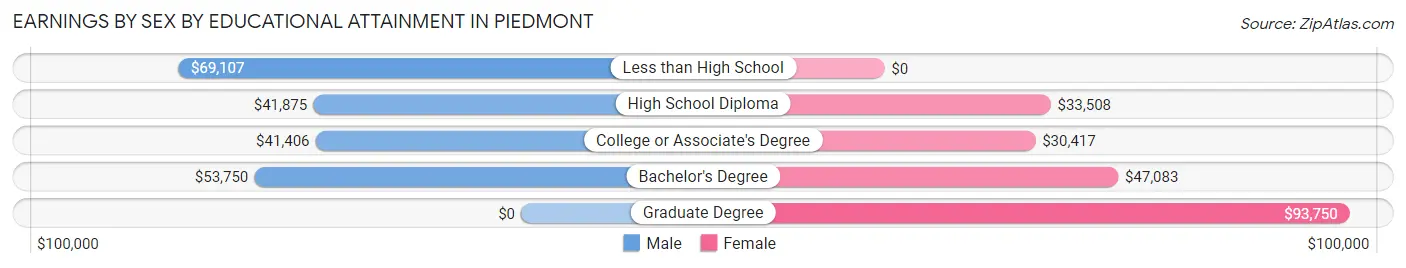
Earnings by Sex by Educational Attainment in Piedmont
Average earnings in Piedmont are $44,125 for men and $34,583 for women, a difference of 21.6%. Men with an educational attainment of less than high school enjoy the highest average annual earnings of $69,107, while those with college or associate's degree education earn the least with $41,406. Women with an educational attainment of graduate degree earn the most with the average annual earnings of $93,750, while those with college or associate's degree education have the smallest earnings of $30,417.
| Educational Attainment | Male Income | Female Income |
| Less than High School | $69,107 | $0 |
| High School Diploma | $41,875 | $33,508 |
| College or Associate's Degree | $41,406 | $30,417 |
| Bachelor's Degree | $53,750 | $47,083 |
| Graduate Degree | - | - |
| Total | $44,125 | $34,583 |
Family Income in Piedmont
Family Income Brackets in Piedmont
According to the Piedmont family income data, there are 89 families falling into the $50,000 to $74,999 income range, which is the most common income bracket and makes up 28.2% of all families. Conversely, the $15,000 to $24,999 income bracket is the least frequent group with only 1 families (0.3%) belonging to this category.
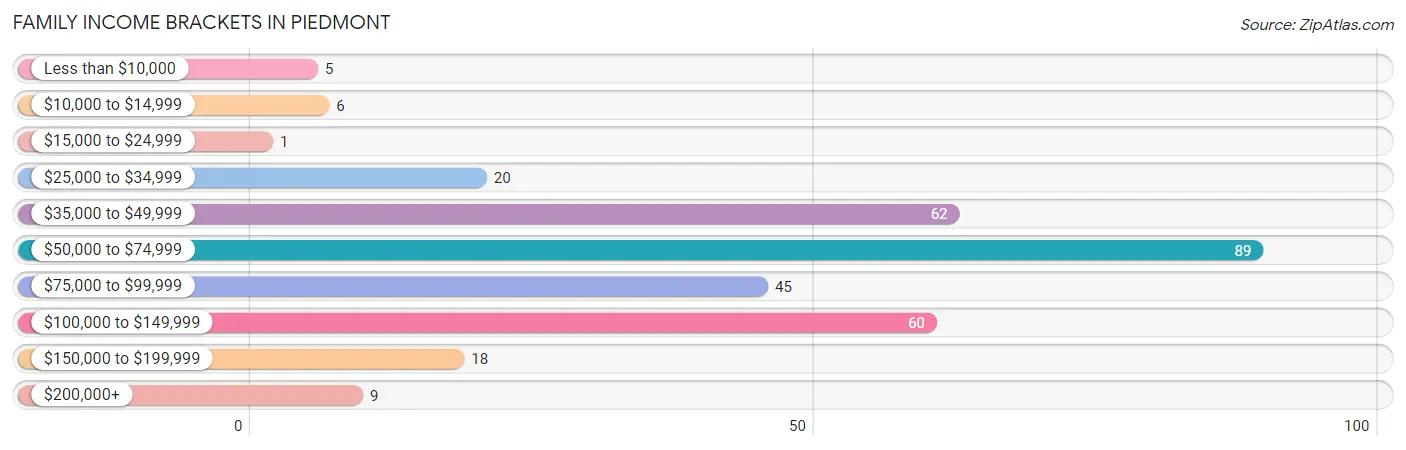
| Income Bracket | # Families | % Families |
| Less than $10,000 | 5 | 1.6% |
| $10,000 to $14,999 | 6 | 1.9% |
| $15,000 to $24,999 | 1 | 0.3% |
| $25,000 to $34,999 | 20 | 6.3% |
| $35,000 to $49,999 | 62 | 19.7% |
| $50,000 to $74,999 | 89 | 28.3% |
| $75,000 to $99,999 | 45 | 14.3% |
| $100,000 to $149,999 | 60 | 19.0% |
| $150,000 to $199,999 | 18 | 5.7% |
| $200,000+ | 9 | 2.9% |
Family Income by Famaliy Size in Piedmont
4-person families (40 | 12.7%) account for the highest median family income in Piedmont with $91,250 per family, while 2-person families (153 | 48.6%) have the highest median income of $31,094 per family member.
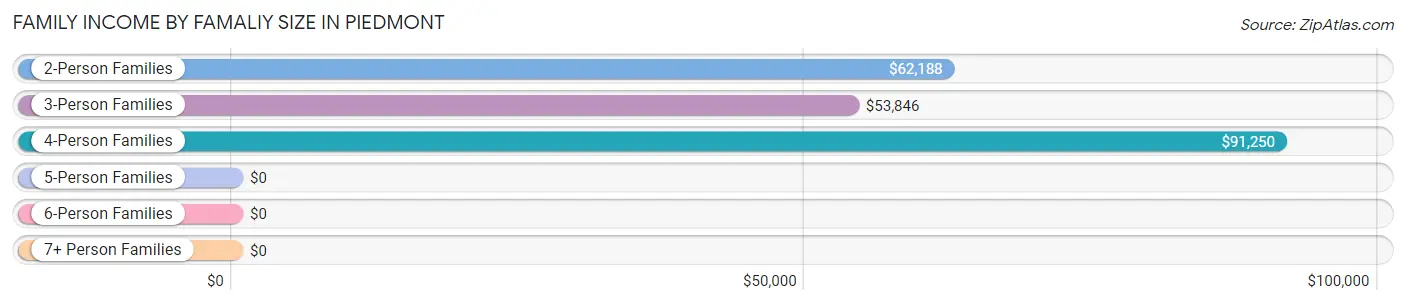
| Income Bracket | # Families | Median Income |
| 2-Person Families | 153 (48.6%) | $62,188 |
| 3-Person Families | 64 (20.3%) | $53,846 |
| 4-Person Families | 40 (12.7%) | $91,250 |
| 5-Person Families | 10 (3.2%) | $0 |
| 6-Person Families | 44 (14.0%) | $0 |
| 7+ Person Families | 4 (1.3%) | $0 |
| Total | 315 (100.0%) | $57,014 |
Family Income by Number of Earners in Piedmont
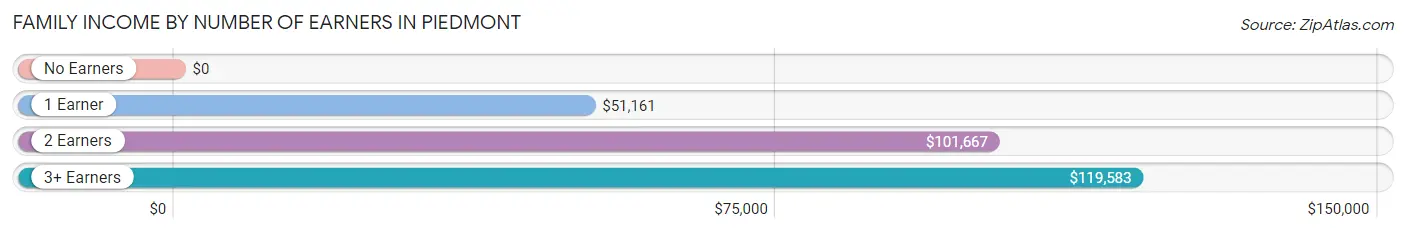
| Number of Earners | # Families | Median Income |
| No Earners | 30 (9.5%) | $0 |
| 1 Earner | 162 (51.4%) | $51,161 |
| 2 Earners | 96 (30.5%) | $101,667 |
| 3+ Earners | 27 (8.6%) | $119,583 |
| Total | 315 (100.0%) | $57,014 |
Household Income in Piedmont
Household Income Brackets in Piedmont
With 106 households falling in the category, the $50,000 to $74,999 income range is the most frequent in Piedmont, accounting for 23.3% of all households. In contrast, only 6 households (1.3%) fall into the $10,000 to $14,999 income bracket, making it the least populous group.
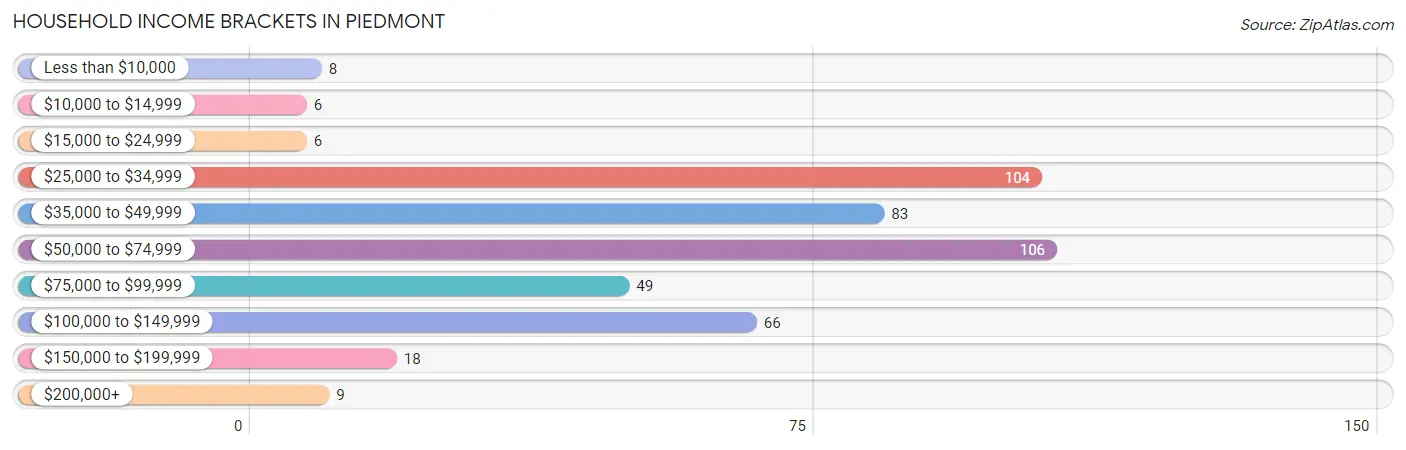
| Income Bracket | # Households | % Households |
| Less than $10,000 | 8 | 1.8% |
| $10,000 to $14,999 | 6 | 1.3% |
| $15,000 to $24,999 | 6 | 1.3% |
| $25,000 to $34,999 | 104 | 22.9% |
| $35,000 to $49,999 | 83 | 18.2% |
| $50,000 to $74,999 | 106 | 23.3% |
| $75,000 to $99,999 | 49 | 10.8% |
| $100,000 to $149,999 | 66 | 14.5% |
| $150,000 to $199,999 | 18 | 4.0% |
| $200,000+ | 9 | 2.0% |
Household Income by Householder Age in Piedmont
The median household income in Piedmont is $51,767, with the highest median household income of $55,750 found in the 45 to 64 years age bracket for the primary householder. A total of 155 households (34.1%) fall into this category. Meanwhile, the 15 to 24 years age bracket for the primary householder has the lowest median household income of $0, with 4 households (0.9%) in this group.
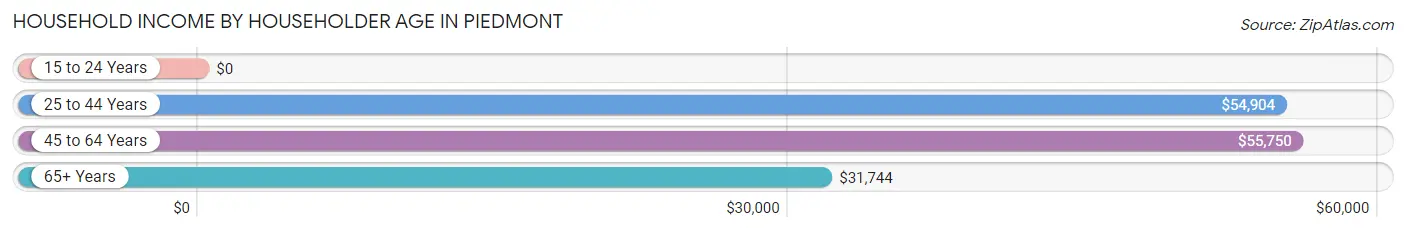
| Income Bracket | # Households | Median Income |
| 15 to 24 Years | 4 (0.9%) | $0 |
| 25 to 44 Years | 151 (33.2%) | $54,904 |
| 45 to 64 Years | 155 (34.1%) | $55,750 |
| 65+ Years | 145 (31.9%) | $31,744 |
| Total | 455 (100.0%) | $51,767 |
Poverty in Piedmont
Income Below Poverty by Sex and Age in Piedmont
With 8.5% poverty level for males and 7.3% for females among the residents of Piedmont, 75 year old and over males and 75 year old and over females are the most vulnerable to poverty, with 11 males (68.8%) and 5 females (26.3%) in their respective age groups living below the poverty level.
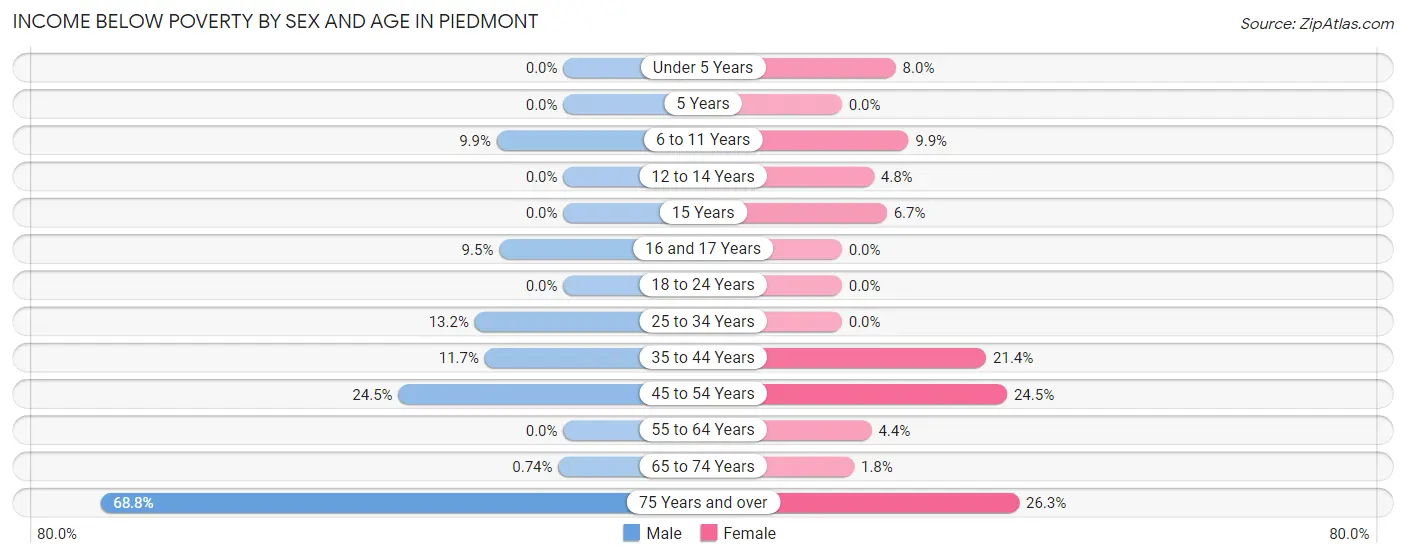
| Age Bracket | Male | Female |
| Under 5 Years | 0 (0.0%) | 4 (8.0%) |
| 5 Years | 0 (0.0%) | 0 (0.0%) |
| 6 to 11 Years | 8 (9.9%) | 8 (9.9%) |
| 12 to 14 Years | 0 (0.0%) | 1 (4.8%) |
| 15 Years | 0 (0.0%) | 1 (6.7%) |
| 16 and 17 Years | 2 (9.5%) | 0 (0.0%) |
| 18 to 24 Years | 0 (0.0%) | 0 (0.0%) |
| 25 to 34 Years | 10 (13.2%) | 0 (0.0%) |
| 35 to 44 Years | 7 (11.7%) | 6 (21.4%) |
| 45 to 54 Years | 12 (24.5%) | 13 (24.5%) |
| 55 to 64 Years | 0 (0.0%) | 4 (4.4%) |
| 65 to 74 Years | 1 (0.7%) | 1 (1.8%) |
| 75 Years and over | 11 (68.8%) | 5 (26.3%) |
| Total | 51 (8.5%) | 43 (7.3%) |
Income Above Poverty by Sex and Age in Piedmont
According to the poverty statistics in Piedmont, males aged under 5 years and females aged 5 years are the age groups that are most secure financially, with 100.0% of males and 100.0% of females in these age groups living above the poverty line.
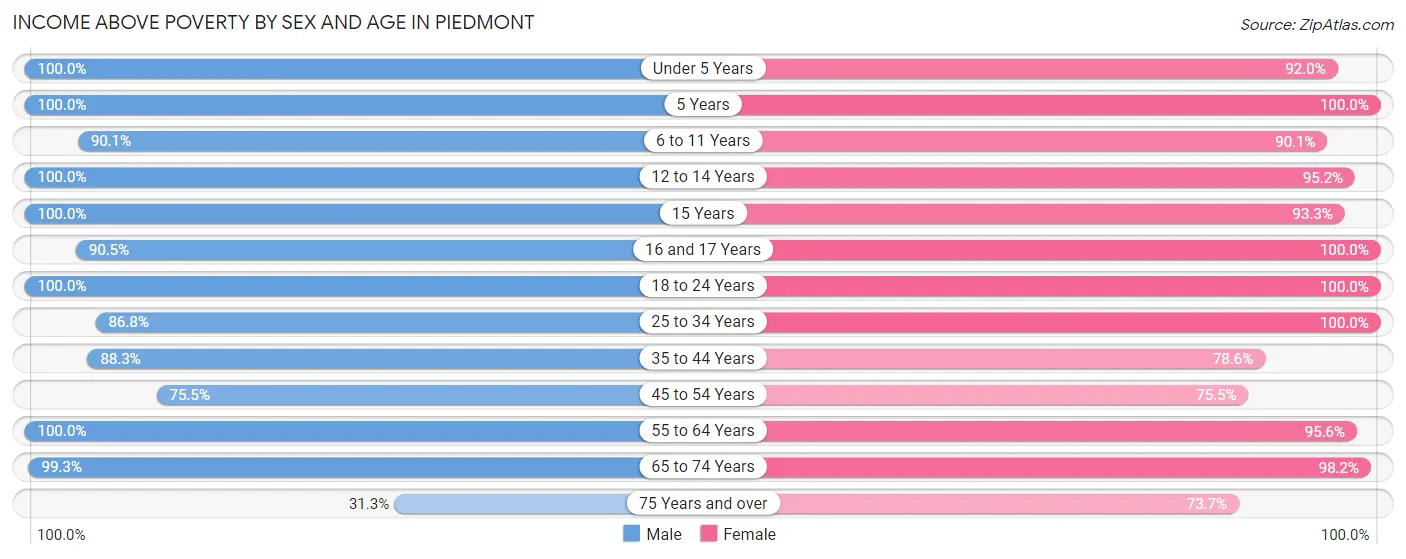
| Age Bracket | Male | Female |
| Under 5 Years | 17 (100.0%) | 46 (92.0%) |
| 5 Years | 8 (100.0%) | 5 (100.0%) |
| 6 to 11 Years | 73 (90.1%) | 73 (90.1%) |
| 12 to 14 Years | 31 (100.0%) | 20 (95.2%) |
| 15 Years | 19 (100.0%) | 14 (93.3%) |
| 16 and 17 Years | 19 (90.5%) | 13 (100.0%) |
| 18 to 24 Years | 8 (100.0%) | 40 (100.0%) |
| 25 to 34 Years | 66 (86.8%) | 121 (100.0%) |
| 35 to 44 Years | 53 (88.3%) | 22 (78.6%) |
| 45 to 54 Years | 37 (75.5%) | 40 (75.5%) |
| 55 to 64 Years | 79 (100.0%) | 87 (95.6%) |
| 65 to 74 Years | 135 (99.3%) | 54 (98.2%) |
| 75 Years and over | 5 (31.2%) | 14 (73.7%) |
| Total | 550 (91.5%) | 549 (92.7%) |
Income Below Poverty Among Married-Couple Families in Piedmont
The poverty statistics for married-couple families in Piedmont show that 4.9% or 13 of the total 268 families live below the poverty line. Families with 5 or more children have the highest poverty rate of 100.0%, comprising of 1 families. On the other hand, families with 3 or 4 children have the lowest poverty rate of 0.0%, which includes 0 families.
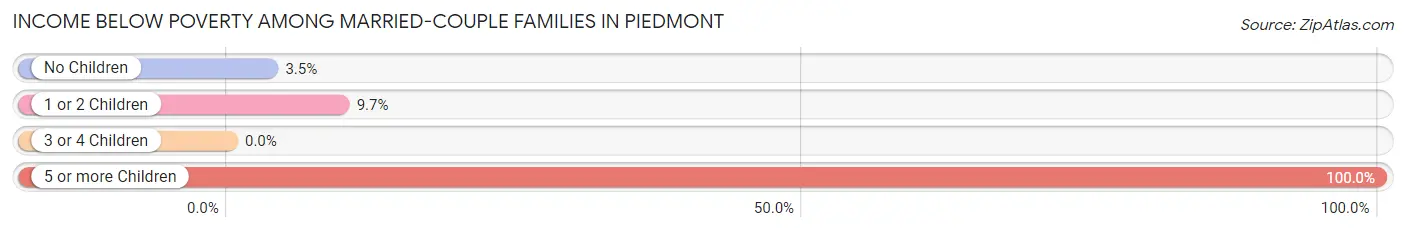
| Children | Above Poverty | Below Poverty |
| No Children | 137 (96.5%) | 5 (3.5%) |
| 1 or 2 Children | 65 (90.3%) | 7 (9.7%) |
| 3 or 4 Children | 53 (100.0%) | 0 (0.0%) |
| 5 or more Children | 0 (0.0%) | 1 (100.0%) |
| Total | 255 (95.2%) | 13 (4.9%) |
Income Below Poverty Among Single-Parent Households in Piedmont
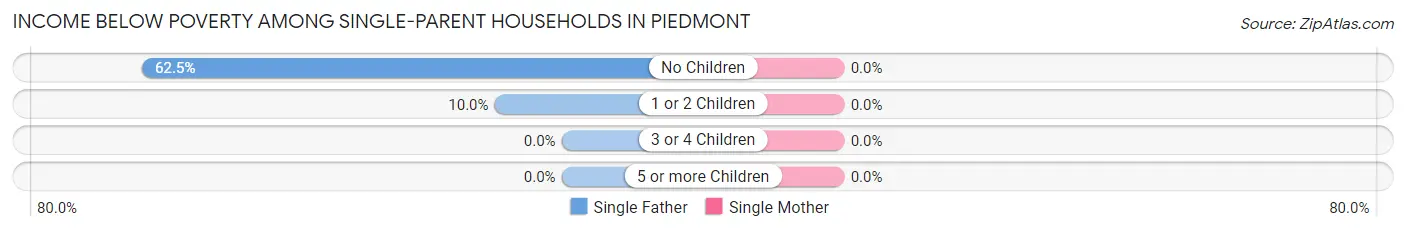
| Children | Single Father | Single Mother |
| No Children | 5 (62.5%) | 0 (0.0%) |
| 1 or 2 Children | 1 (10.0%) | 0 (0.0%) |
| 3 or 4 Children | 0 (0.0%) | 0 (0.0%) |
| 5 or more Children | 0 (0.0%) | 0 (0.0%) |
| Total | 6 (33.3%) | 0 (0.0%) |
Income Below Poverty Among Married-Couple vs Single-Parent Households in Piedmont
The poverty data for Piedmont shows that 13 of the married-couple family households (4.9%) and 6 of the single-parent households (12.8%) are living below the poverty level. Within the married-couple family households, those with 5 or more children have the highest poverty rate, with 1 households (100.0%) falling below the poverty line. Among the single-parent households, those with no children have the highest poverty rate, with 5 household (41.7%) living below poverty.
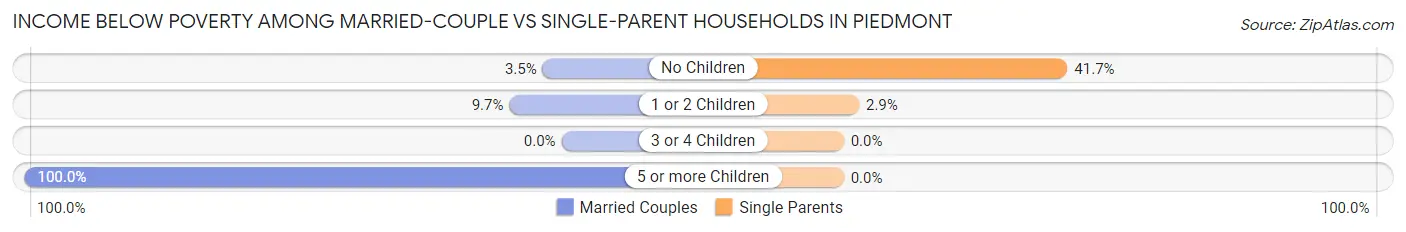
| Children | Married-Couple Families | Single-Parent Households |
| No Children | 5 (3.5%) | 5 (41.7%) |
| 1 or 2 Children | 7 (9.7%) | 1 (2.9%) |
| 3 or 4 Children | 0 (0.0%) | 0 (0.0%) |
| 5 or more Children | 1 (100.0%) | 0 (0.0%) |
| Total | 13 (4.9%) | 6 (12.8%) |
Race in Piedmont
The most populous races in Piedmont are White / Caucasian (1,023 | 85.4%), Native / Alaskan (105 | 8.8%), and Two or more Races (31 | 2.6%).
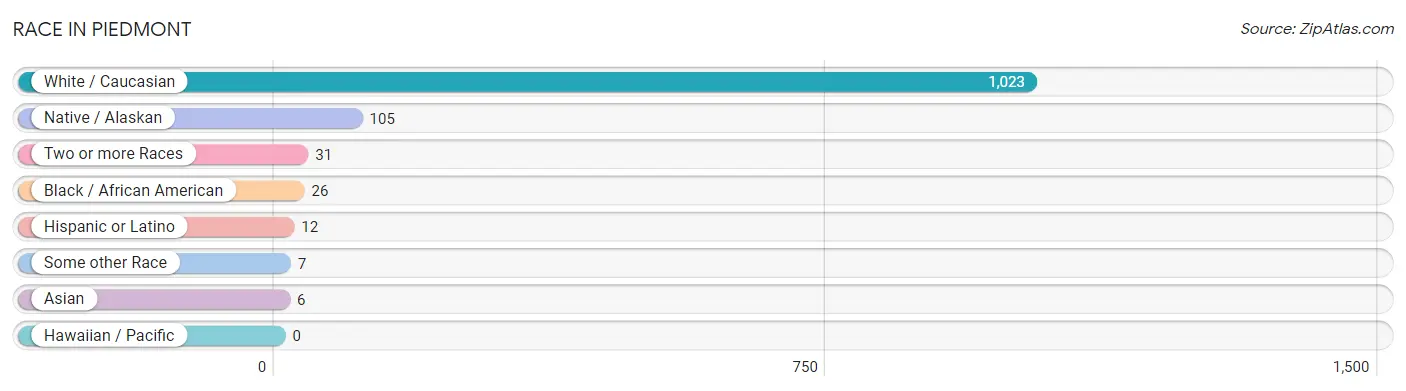
| Race | # Population | % Population |
| Asian | 6 | 0.5% |
| Black / African American | 26 | 2.2% |
| Hawaiian / Pacific | 0 | 0.0% |
| Hispanic or Latino | 12 | 1.0% |
| Native / Alaskan | 105 | 8.8% |
| White / Caucasian | 1,023 | 85.4% |
| Two or more Races | 31 | 2.6% |
| Some other Race | 7 | 0.6% |
| Total | 1,198 | 100.0% |
Ancestry in Piedmont
The most populous ancestries reported in Piedmont are German (481 | 40.2%), Irish (187 | 15.6%), European (147 | 12.3%), Norwegian (125 | 10.4%), and English (72 | 6.0%), together accounting for 84.5% of all Piedmont residents.
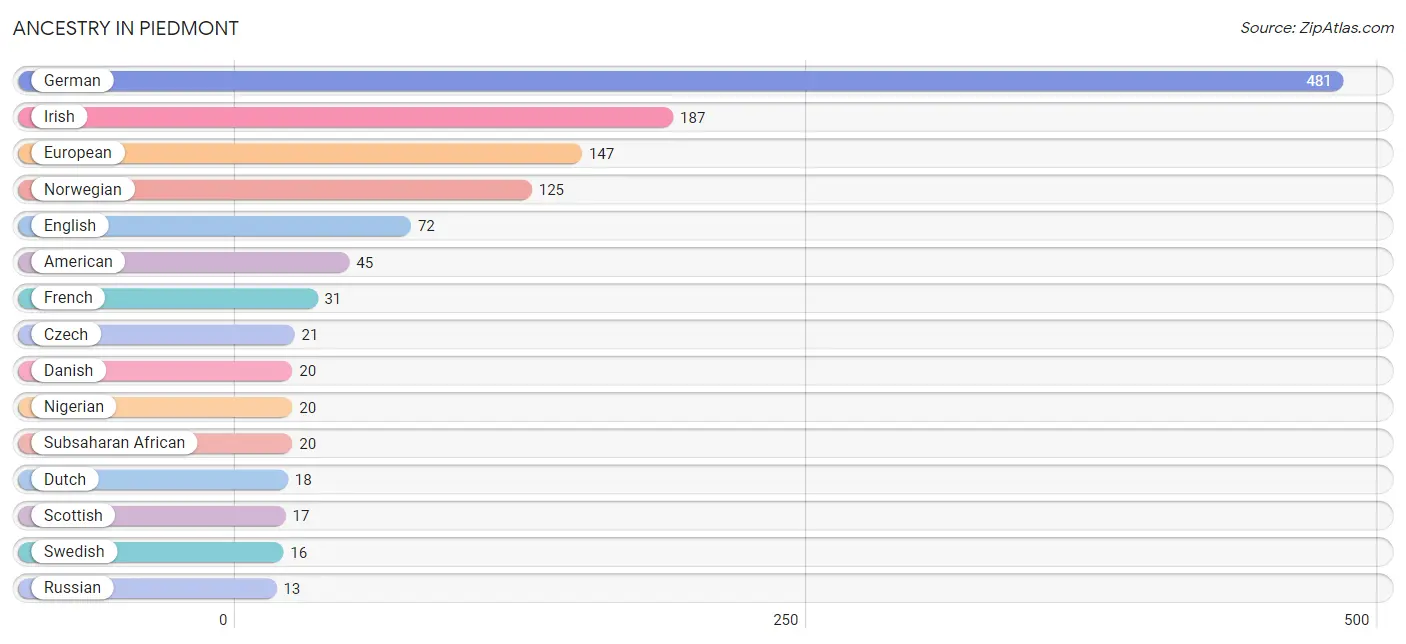
| Ancestry | # Population | % Population |
| American | 45 | 3.8% |
| Canadian | 2 | 0.2% |
| Cheyenne | 3 | 0.3% |
| Chippewa | 1 | 0.1% |
| Czech | 21 | 1.8% |
| Danish | 20 | 1.7% |
| Dutch | 18 | 1.5% |
| English | 72 | 6.0% |
| European | 147 | 12.3% |
| Finnish | 9 | 0.7% |
| French | 31 | 2.6% |
| German | 481 | 40.2% |
| Irish | 187 | 15.6% |
| Italian | 12 | 1.0% |
| Mexican | 12 | 1.0% |
| Nigerian | 20 | 1.7% |
| Norwegian | 125 | 10.4% |
| Polish | 4 | 0.3% |
| Russian | 13 | 1.1% |
| Scandinavian | 2 | 0.2% |
| Scottish | 17 | 1.4% |
| Sioux | 11 | 0.9% |
| Subsaharan African | 20 | 1.7% |
| Swedish | 16 | 1.3% |
| Swiss | 4 | 0.3% |
| Thai | 6 | 0.5% |
| Welsh | 2 | 0.2% | View All 27 Rows |
Immigrants in Piedmont
The most numerous immigrant groups reported in Piedmont came from Africa (8 | 0.7%), Nigeria (8 | 0.7%), and Western Africa (8 | 0.7%), together accounting for 2.0% of all Piedmont residents.
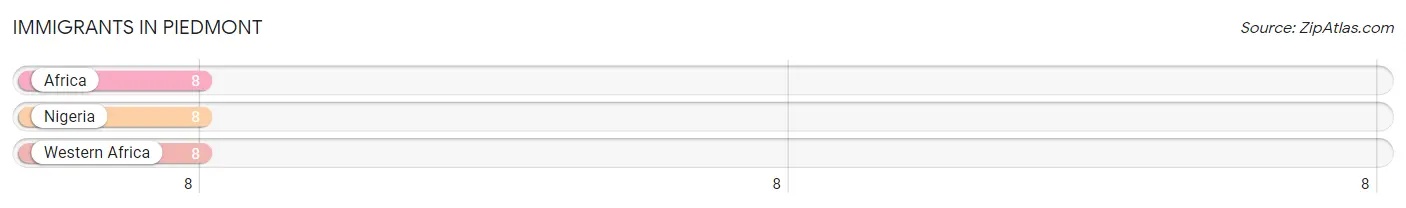
| Immigration Origin | # Population | % Population |
| Africa | 8 | 0.7% |
| Nigeria | 8 | 0.7% |
| Western Africa | 8 | 0.7% | View All 3 Rows |
Sex and Age in Piedmont
Sex and Age in Piedmont
The most populous age groups in Piedmont are 65 to 69 Years (125 | 20.7%) for men and 30 to 34 Years (75 | 12.6%) for women.
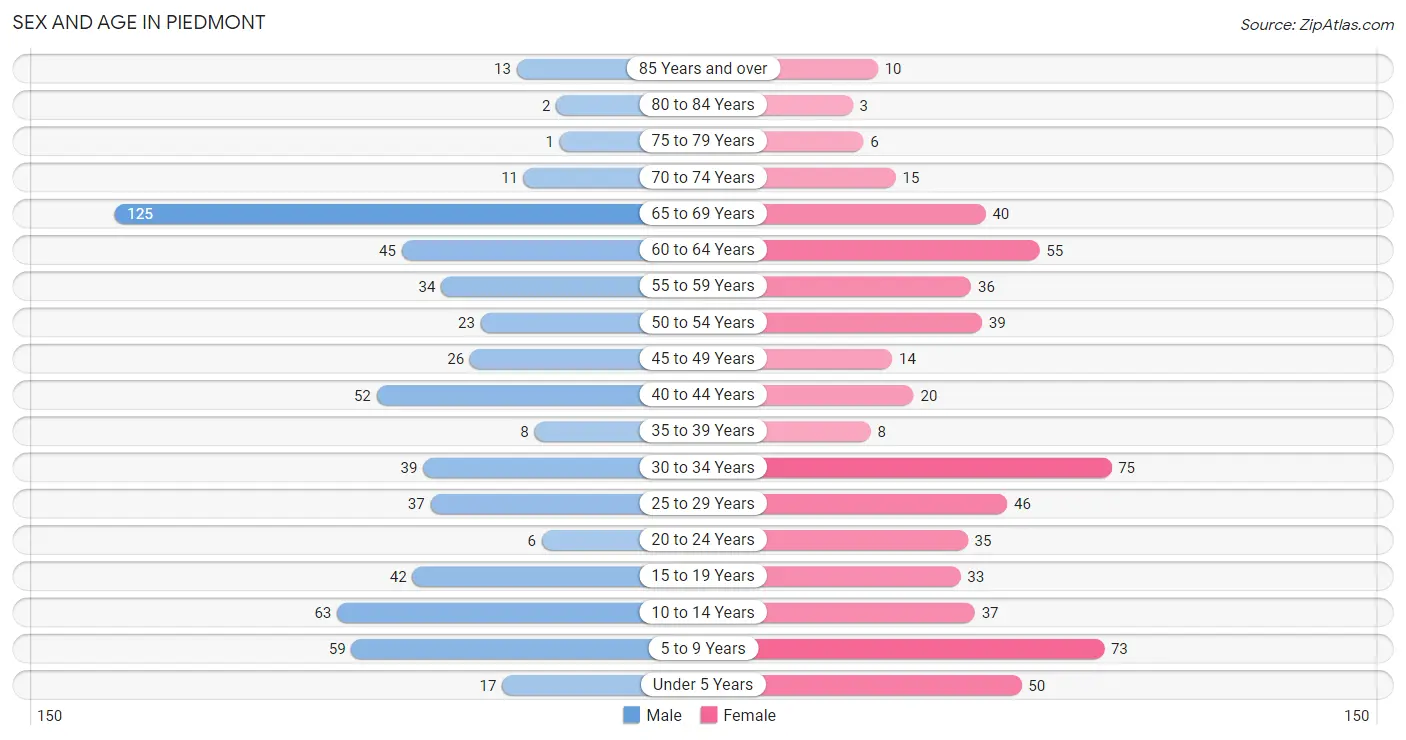
| Age Bracket | Male | Female |
| Under 5 Years | 17 (2.8%) | 50 (8.4%) |
| 5 to 9 Years | 59 (9.8%) | 73 (12.3%) |
| 10 to 14 Years | 63 (10.4%) | 37 (6.2%) |
| 15 to 19 Years | 42 (7.0%) | 33 (5.6%) |
| 20 to 24 Years | 6 (1.0%) | 35 (5.9%) |
| 25 to 29 Years | 37 (6.1%) | 46 (7.7%) |
| 30 to 34 Years | 39 (6.5%) | 75 (12.6%) |
| 35 to 39 Years | 8 (1.3%) | 8 (1.3%) |
| 40 to 44 Years | 52 (8.6%) | 20 (3.4%) |
| 45 to 49 Years | 26 (4.3%) | 14 (2.4%) |
| 50 to 54 Years | 23 (3.8%) | 39 (6.6%) |
| 55 to 59 Years | 34 (5.6%) | 36 (6.0%) |
| 60 to 64 Years | 45 (7.5%) | 55 (9.2%) |
| 65 to 69 Years | 125 (20.7%) | 40 (6.7%) |
| 70 to 74 Years | 11 (1.8%) | 15 (2.5%) |
| 75 to 79 Years | 1 (0.2%) | 6 (1.0%) |
| 80 to 84 Years | 2 (0.3%) | 3 (0.5%) |
| 85 Years and over | 13 (2.2%) | 10 (1.7%) |
| Total | 603 (100.0%) | 595 (100.0%) |
Families and Households in Piedmont
Median Family Size in Piedmont
The median family size in Piedmont is 3.25 persons per family, with single male/father families (18 | 5.7%) accounting for the largest median family size of 3.83 persons per family. On the other hand, single female/mother families (29 | 9.2%) represent the smallest median family size with 2.79 persons per family.
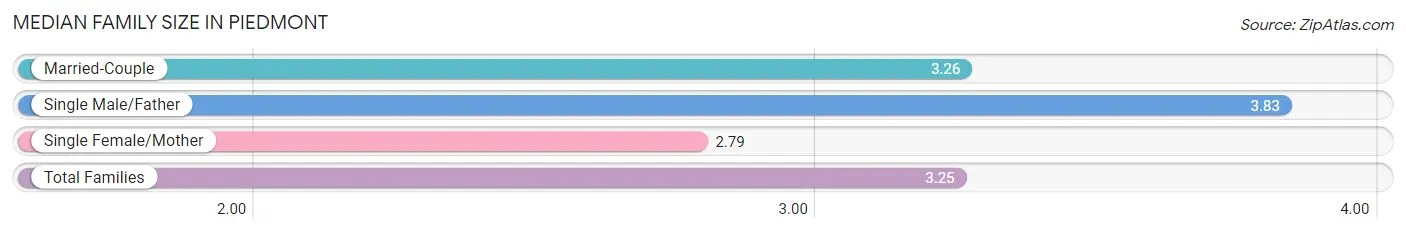
| Family Type | # Families | Family Size |
| Married-Couple | 268 (85.1%) | 3.26 |
| Single Male/Father | 18 (5.7%) | 3.83 |
| Single Female/Mother | 29 (9.2%) | 2.79 |
| Total Families | 315 (100.0%) | 3.25 |
Median Household Size in Piedmont
The median household size in Piedmont is 2.63 persons per household, with single male/father households (18 | 4.0%) accounting for the largest median household size of 4.17 persons per household. non-family households (140 | 30.8%) represent the smallest median household size with 1.07 persons per household.
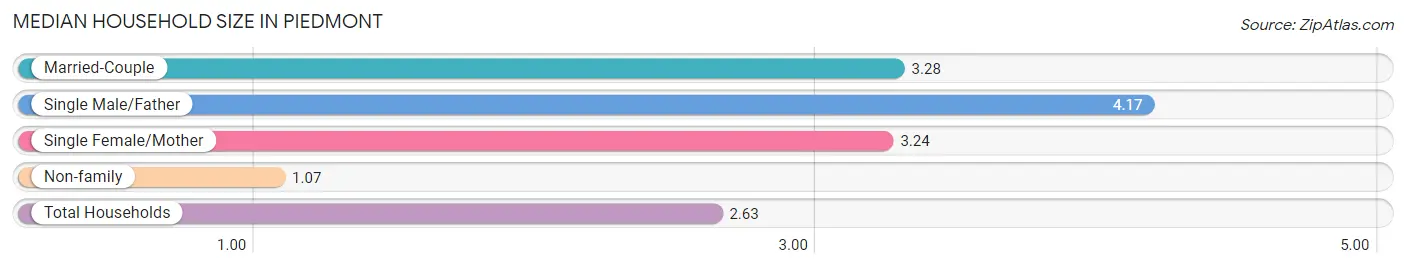
| Household Type | # Households | Household Size |
| Married-Couple | 268 (58.9%) | 3.28 |
| Single Male/Father | 18 (4.0%) | 4.17 |
| Single Female/Mother | 29 (6.4%) | 3.24 |
| Non-family | 140 (30.8%) | 1.07 |
| Total Households | 455 (100.0%) | 2.63 |
Household Size by Marriage Status in Piedmont
Out of a total of 455 households in Piedmont, 315 (69.2%) are family households, while 140 (30.8%) are nonfamily households. The most numerous type of family households are 2-person households, comprising 141, and the most common type of nonfamily households are 1-person households, comprising 133.
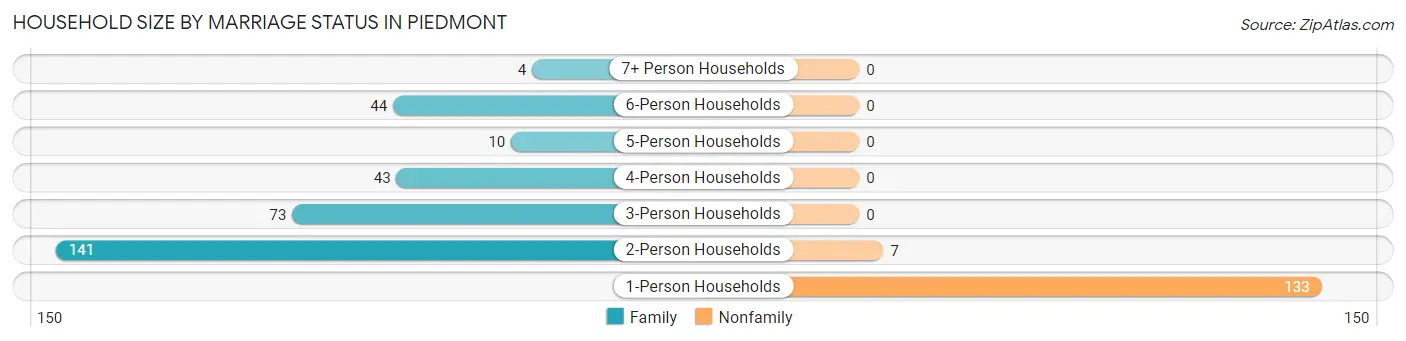
| Household Size | Family Households | Nonfamily Households |
| 1-Person Households | - | 133 (29.2%) |
| 2-Person Households | 141 (31.0%) | 7 (1.5%) |
| 3-Person Households | 73 (16.0%) | 0 (0.0%) |
| 4-Person Households | 43 (9.5%) | 0 (0.0%) |
| 5-Person Households | 10 (2.2%) | 0 (0.0%) |
| 6-Person Households | 44 (9.7%) | 0 (0.0%) |
| 7+ Person Households | 4 (0.9%) | 0 (0.0%) |
| Total | 315 (69.2%) | 140 (30.8%) |
Female Fertility in Piedmont
Fertility by Age in Piedmont
Average fertility rate in Piedmont is 38.0 births per 1,000 women. Women in the age bracket of 20 to 34 years have the highest fertility rate with 58.0 births per 1,000 women. Women in the age bracket of 20 to 34 years acount for 100.0% of all women with births.
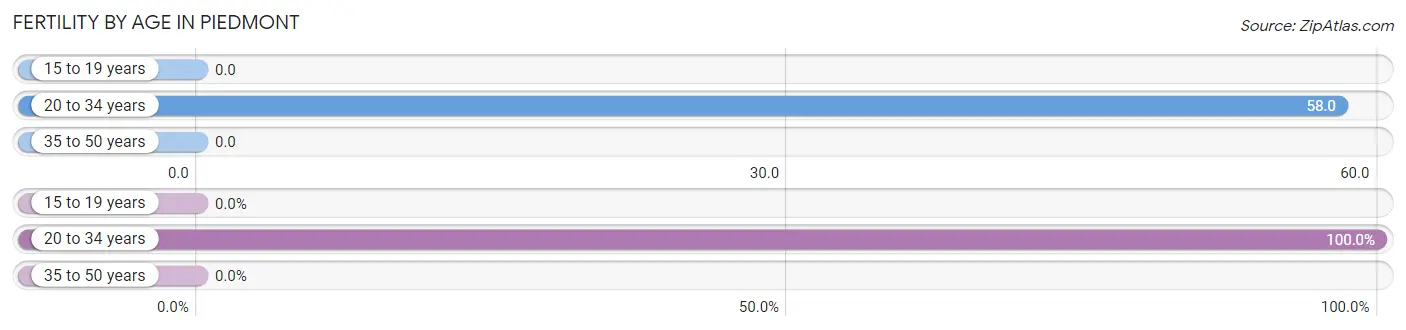
| Age Bracket | Women with Births | Births / 1,000 Women |
| 15 to 19 years | 0 (0.0%) | 0.0 |
| 20 to 34 years | 9 (100.0%) | 58.0 |
| 35 to 50 years | 0 (0.0%) | 0.0 |
| Total | 9 (100.0%) | 38.0 |
Fertility by Age by Marriage Status in Piedmont
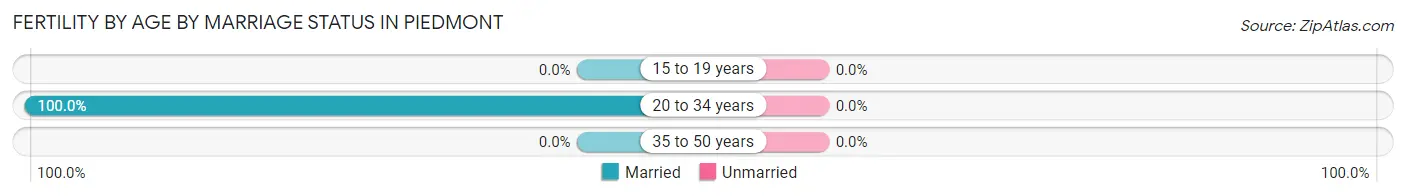
| Age Bracket | Married | Unmarried |
| 15 to 19 years | 0 (0.0%) | 0 (0.0%) |
| 20 to 34 years | 9 (100.0%) | 0 (0.0%) |
| 35 to 50 years | 0 (0.0%) | 0 (0.0%) |
| Total | 9 (100.0%) | 0 (0.0%) |
Fertility by Education in Piedmont
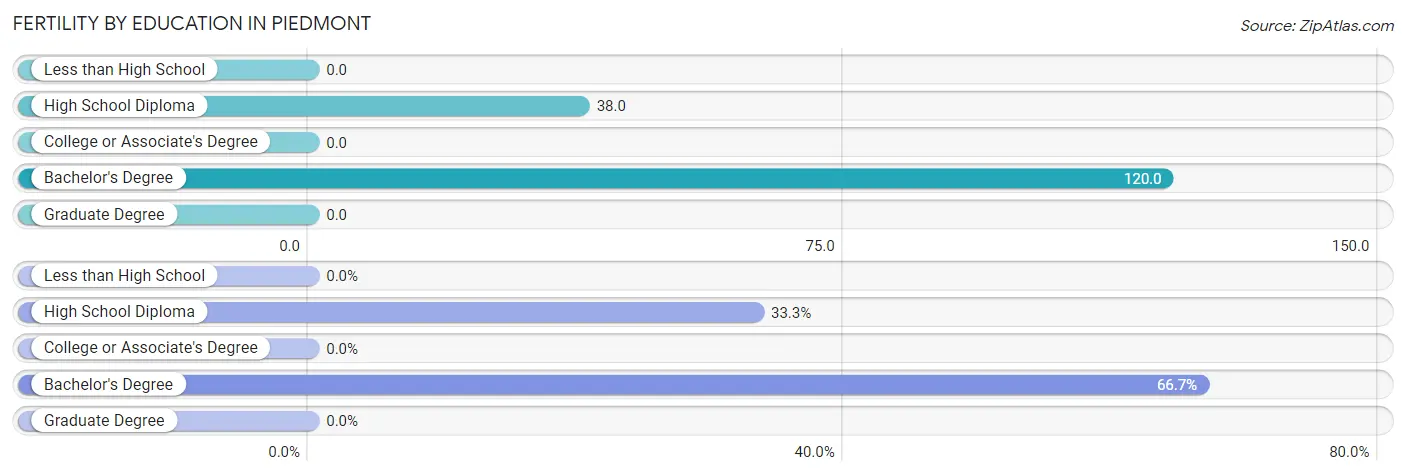
| Educational Attainment | Women with Births | Births / 1,000 Women |
| Less than High School | 0 (0.0%) | 0.0 |
| High School Diploma | 3 (33.3%) | 38.0 |
| College or Associate's Degree | 0 (0.0%) | 0.0 |
| Bachelor's Degree | 6 (66.7%) | 120.0 |
| Graduate Degree | 0 (0.0%) | 0.0 |
| Total | 9 (100.0%) | 38.0 |
Fertility by Education by Marriage Status in Piedmont
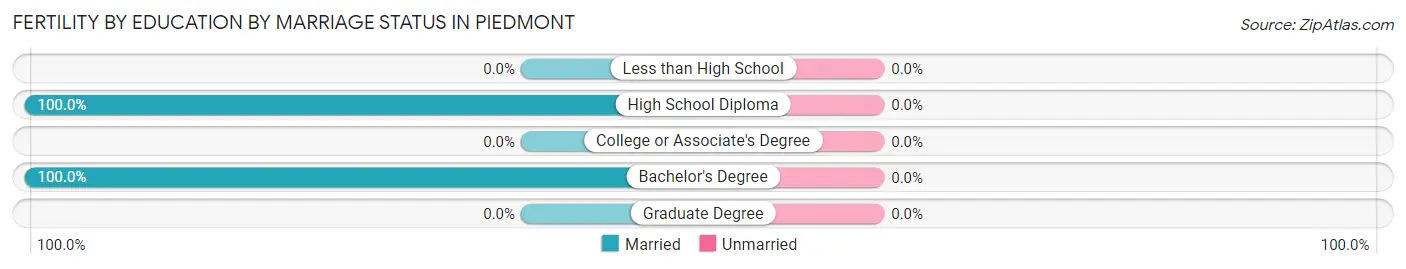
| Educational Attainment | Married | Unmarried |
| Less than High School | 0 (0.0%) | 0 (0.0%) |
| High School Diploma | 3 (100.0%) | 0 (0.0%) |
| College or Associate's Degree | 0 (0.0%) | 0 (0.0%) |
| Bachelor's Degree | 6 (100.0%) | 0 (0.0%) |
| Graduate Degree | 0 (0.0%) | 0 (0.0%) |
| Total | 9 (100.0%) | 0 (0.0%) |
Employment Characteristics in Piedmont
Employment by Class of Employer in Piedmont
Among the 553 employed individuals in Piedmont, private company employees (309 | 55.9%), self-employed (not incorporated) (115 | 20.8%), and local government employees (49 | 8.9%) make up the most common classes of employment.
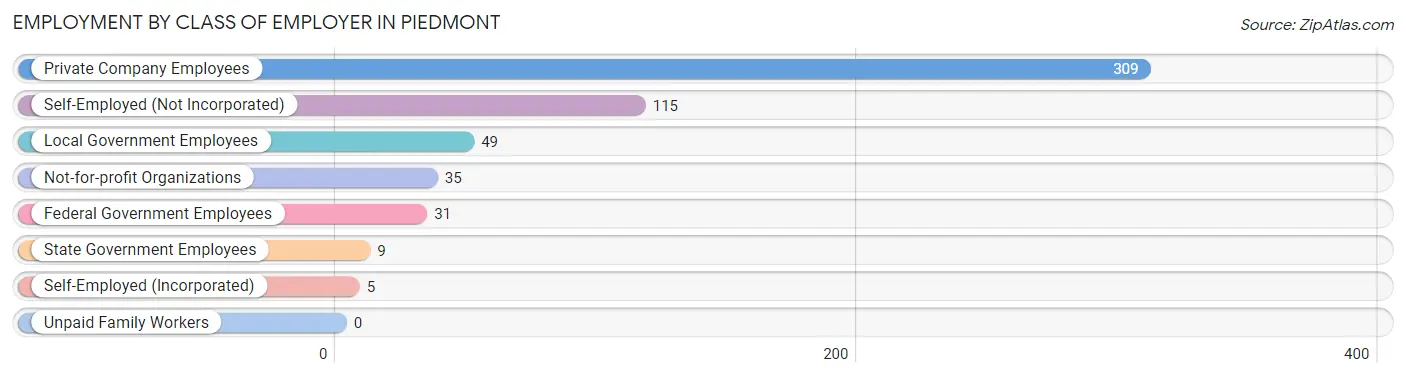
| Employer Class | # Employees | % Employees |
| Private Company Employees | 309 | 55.9% |
| Self-Employed (Incorporated) | 5 | 0.9% |
| Self-Employed (Not Incorporated) | 115 | 20.8% |
| Not-for-profit Organizations | 35 | 6.3% |
| Local Government Employees | 49 | 8.9% |
| State Government Employees | 9 | 1.6% |
| Federal Government Employees | 31 | 5.6% |
| Unpaid Family Workers | 0 | 0.0% |
| Total | 553 | 100.0% |
Employment Status by Age in Piedmont
According to the labor force statistics for Piedmont, out of the total population over 16 years of age (865), 65.0% or 562 individuals are in the labor force, with 0.5% or 3 of them unemployed. The age group with the highest labor force participation rate is 20 to 24 years, with 100.0% or 41 individuals in the labor force. Within the labor force, the 60 to 64 years age range has the highest percentage of unemployed individuals, with 4.2% or 3 of them being unemployed.
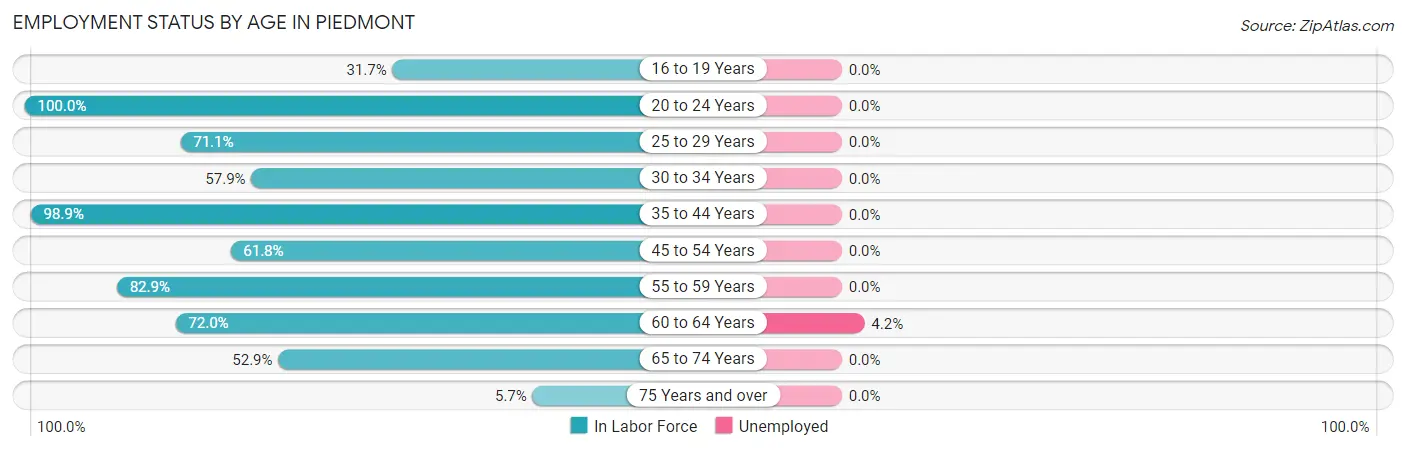
| Age Bracket | In Labor Force | Unemployed |
| 16 to 19 Years | 13 (31.7%) | 0 (0.0%) |
| 20 to 24 Years | 41 (100.0%) | 0 (0.0%) |
| 25 to 29 Years | 59 (71.1%) | 0 (0.0%) |
| 30 to 34 Years | 66 (57.9%) | 0 (0.0%) |
| 35 to 44 Years | 87 (98.9%) | 0 (0.0%) |
| 45 to 54 Years | 63 (61.8%) | 0 (0.0%) |
| 55 to 59 Years | 58 (82.9%) | 0 (0.0%) |
| 60 to 64 Years | 72 (72.0%) | 3 (4.2%) |
| 65 to 74 Years | 101 (52.9%) | 0 (0.0%) |
| 75 Years and over | 2 (5.7%) | 0 (0.0%) |
| Total | 562 (65.0%) | 3 (0.5%) |
Employment Status by Educational Attainment in Piedmont
According to labor force statistics for Piedmont, 72.7% of individuals (405) out of the total population between 25 and 64 years of age (557) are in the labor force, with 0.7% or 3 of them being unemployed. The group with the highest labor force participation rate are those with the educational attainment of less than high school, with 100.0% or 13 individuals in the labor force. Within the labor force, individuals with high school diploma education have the highest percentage of unemployment, with 2.2% or 3 of them being unemployed.
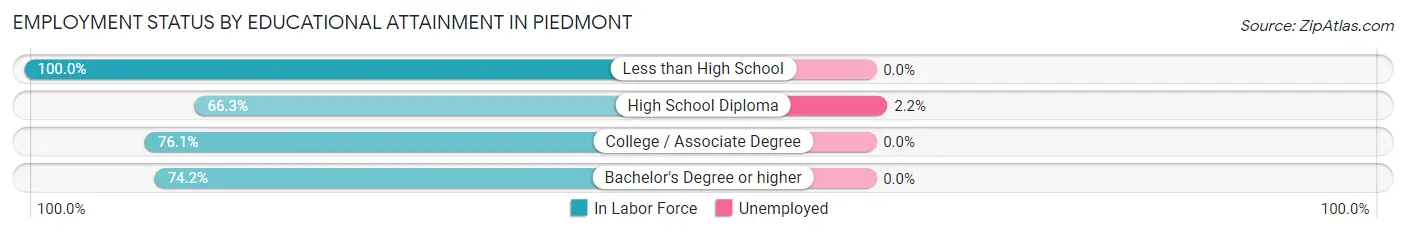
| Educational Attainment | In Labor Force | Unemployed |
| Less than High School | 13 (100.0%) | 0 (0.0%) |
| High School Diploma | 134 (66.3%) | 4 (2.2%) |
| College / Associate Degree | 166 (76.1%) | 0 (0.0%) |
| Bachelor's Degree or higher | 92 (74.2%) | 0 (0.0%) |
| Total | 405 (72.7%) | 4 (0.7%) |
Employment Occupations by Sex in Piedmont
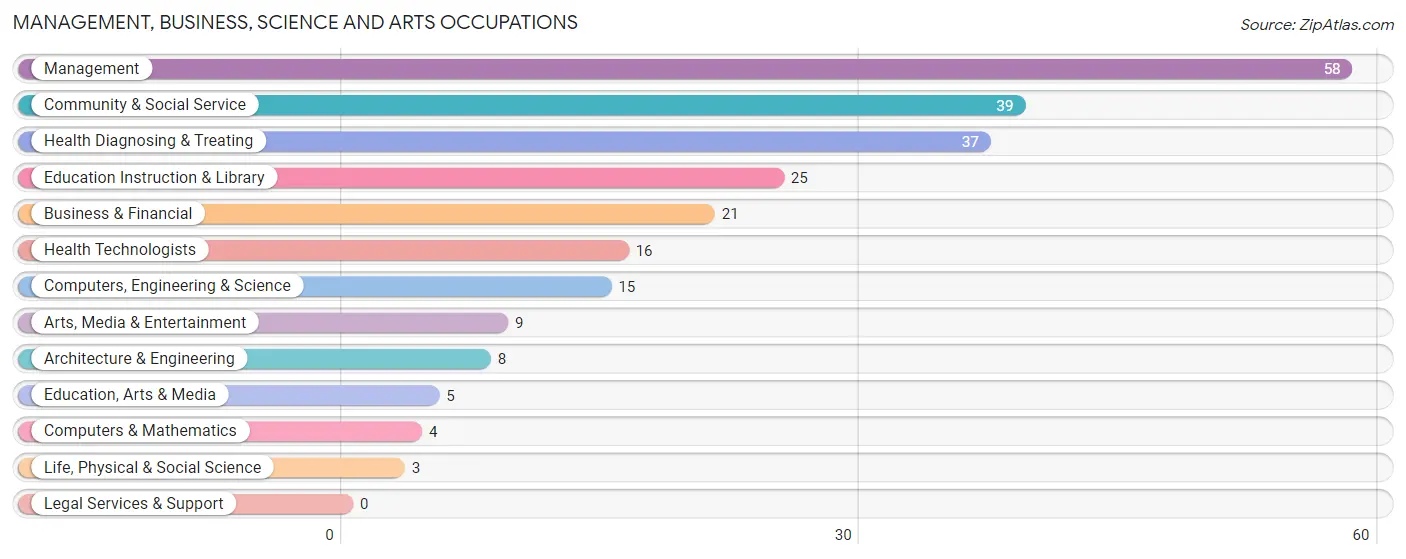
Management, Business, Science and Arts Occupations
The most common Management, Business, Science and Arts occupations in Piedmont are Management (58 | 10.4%), Community & Social Service (39 | 7.0%), Health Diagnosing & Treating (37 | 6.6%), Education Instruction & Library (25 | 4.5%), and Business & Financial (21 | 3.8%).
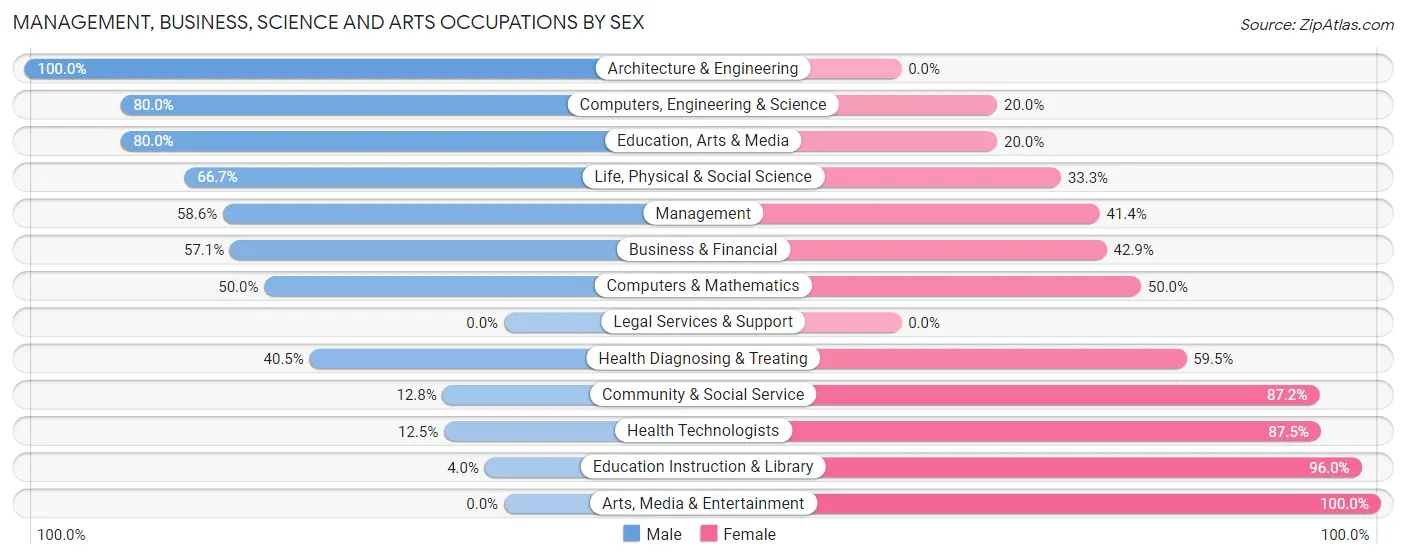
Management, Business, Science and Arts Occupations by Sex
Within the Management, Business, Science and Arts occupations in Piedmont, the most male-oriented occupations are Architecture & Engineering (100.0%), Computers, Engineering & Science (80.0%), and Education, Arts & Media (80.0%), while the most female-oriented occupations are Arts, Media & Entertainment (100.0%), Education Instruction & Library (96.0%), and Health Technologists (87.5%).
| Occupation | Male | Female |
| Management | 34 (58.6%) | 24 (41.4%) |
| Business & Financial | 12 (57.1%) | 9 (42.9%) |
| Computers, Engineering & Science | 12 (80.0%) | 3 (20.0%) |
| Computers & Mathematics | 2 (50.0%) | 2 (50.0%) |
| Architecture & Engineering | 8 (100.0%) | 0 (0.0%) |
| Life, Physical & Social Science | 2 (66.7%) | 1 (33.3%) |
| Community & Social Service | 5 (12.8%) | 34 (87.2%) |
| Education, Arts & Media | 4 (80.0%) | 1 (20.0%) |
| Legal Services & Support | 0 (0.0%) | 0 (0.0%) |
| Education Instruction & Library | 1 (4.0%) | 24 (96.0%) |
| Arts, Media & Entertainment | 0 (0.0%) | 9 (100.0%) |
| Health Diagnosing & Treating | 15 (40.5%) | 22 (59.5%) |
| Health Technologists | 2 (12.5%) | 14 (87.5%) |
| Total (Category) | 78 (45.9%) | 92 (54.1%) |
| Total (Overall) | 336 (60.1%) | 223 (39.9%) |
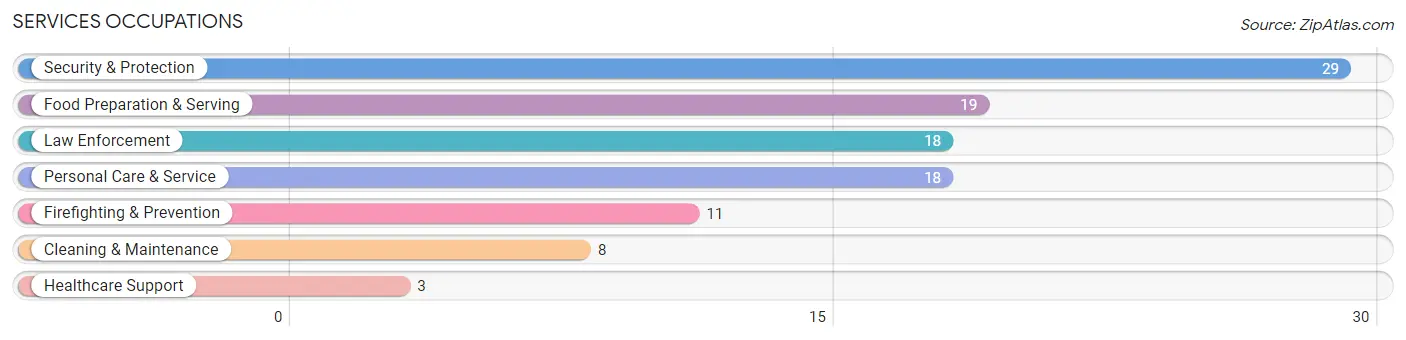
Services Occupations
The most common Services occupations in Piedmont are Security & Protection (29 | 5.2%), Food Preparation & Serving (19 | 3.4%), Law Enforcement (18 | 3.2%), Personal Care & Service (18 | 3.2%), and Firefighting & Prevention (11 | 2.0%).
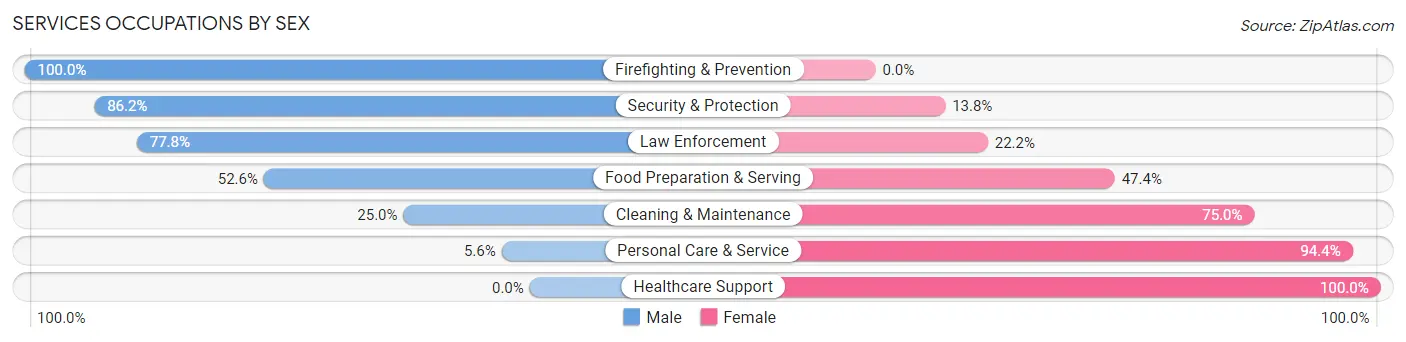
Services Occupations by Sex
Within the Services occupations in Piedmont, the most male-oriented occupations are Firefighting & Prevention (100.0%), Security & Protection (86.2%), and Law Enforcement (77.8%), while the most female-oriented occupations are Healthcare Support (100.0%), Personal Care & Service (94.4%), and Cleaning & Maintenance (75.0%).
| Occupation | Male | Female |
| Healthcare Support | 0 (0.0%) | 3 (100.0%) |
| Security & Protection | 25 (86.2%) | 4 (13.8%) |
| Firefighting & Prevention | 11 (100.0%) | 0 (0.0%) |
| Law Enforcement | 14 (77.8%) | 4 (22.2%) |
| Food Preparation & Serving | 10 (52.6%) | 9 (47.4%) |
| Cleaning & Maintenance | 2 (25.0%) | 6 (75.0%) |
| Personal Care & Service | 1 (5.6%) | 17 (94.4%) |
| Total (Category) | 38 (49.3%) | 39 (50.6%) |
| Total (Overall) | 336 (60.1%) | 223 (39.9%) |
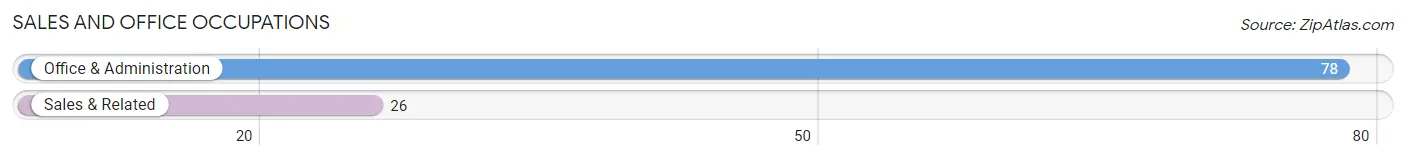
Sales and Office Occupations
The most common Sales and Office occupations in Piedmont are Office & Administration (78 | 14.0%), and Sales & Related (26 | 4.6%).
Sales and Office Occupations by Sex
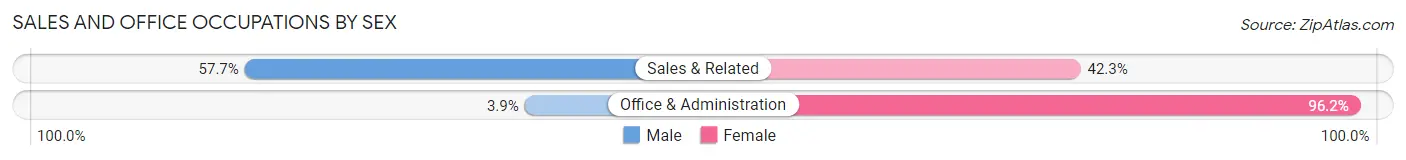
| Occupation | Male | Female |
| Sales & Related | 15 (57.7%) | 11 (42.3%) |
| Office & Administration | 3 (3.8%) | 75 (96.2%) |
| Total (Category) | 18 (17.3%) | 86 (82.7%) |
| Total (Overall) | 336 (60.1%) | 223 (39.9%) |
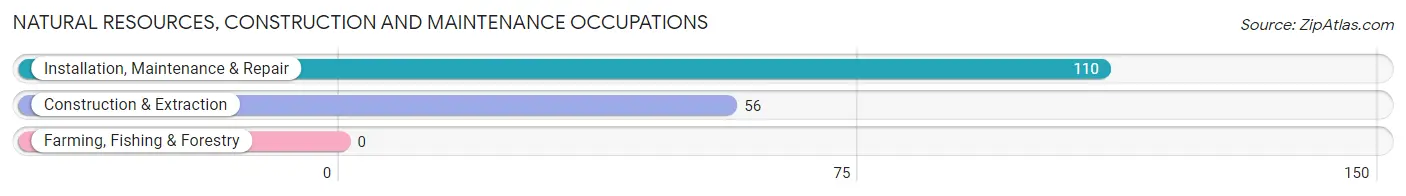
Natural Resources, Construction and Maintenance Occupations
The most common Natural Resources, Construction and Maintenance occupations in Piedmont are Installation, Maintenance & Repair (110 | 19.7%), and Construction & Extraction (56 | 10.0%).
Natural Resources, Construction and Maintenance Occupations by Sex
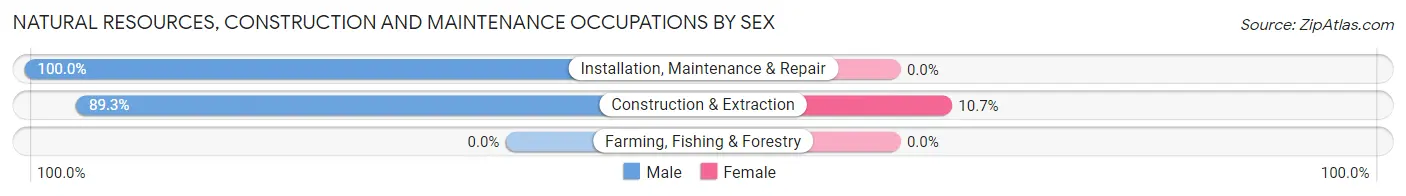
| Occupation | Male | Female |
| Farming, Fishing & Forestry | 0 (0.0%) | 0 (0.0%) |
| Construction & Extraction | 50 (89.3%) | 6 (10.7%) |
| Installation, Maintenance & Repair | 110 (100.0%) | 0 (0.0%) |
| Total (Category) | 160 (96.4%) | 6 (3.6%) |
| Total (Overall) | 336 (60.1%) | 223 (39.9%) |
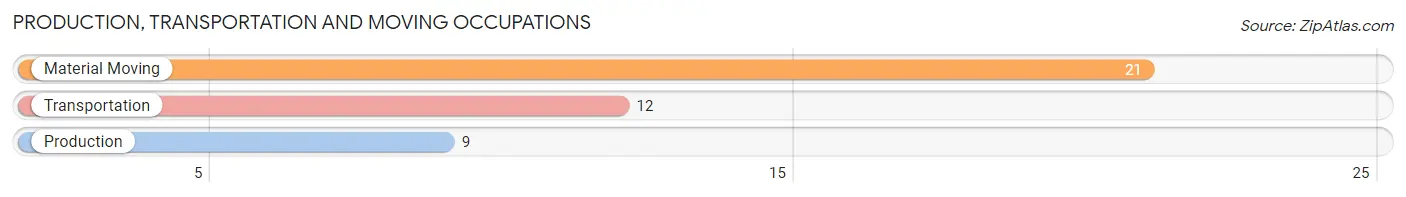
Production, Transportation and Moving Occupations
The most common Production, Transportation and Moving occupations in Piedmont are Material Moving (21 | 3.8%), Transportation (12 | 2.1%), and Production (9 | 1.6%).
Production, Transportation and Moving Occupations by Sex
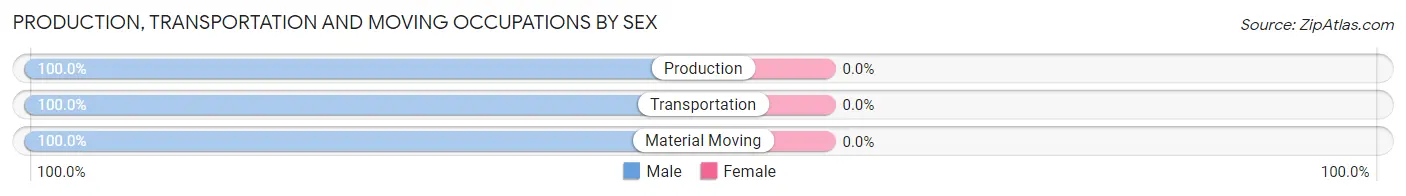
| Occupation | Male | Female |
| Production | 9 (100.0%) | 0 (0.0%) |
| Transportation | 12 (100.0%) | 0 (0.0%) |
| Material Moving | 21 (100.0%) | 0 (0.0%) |
| Total (Category) | 42 (100.0%) | 0 (0.0%) |
| Total (Overall) | 336 (60.1%) | 223 (39.9%) |
Employment Industries by Sex in Piedmont
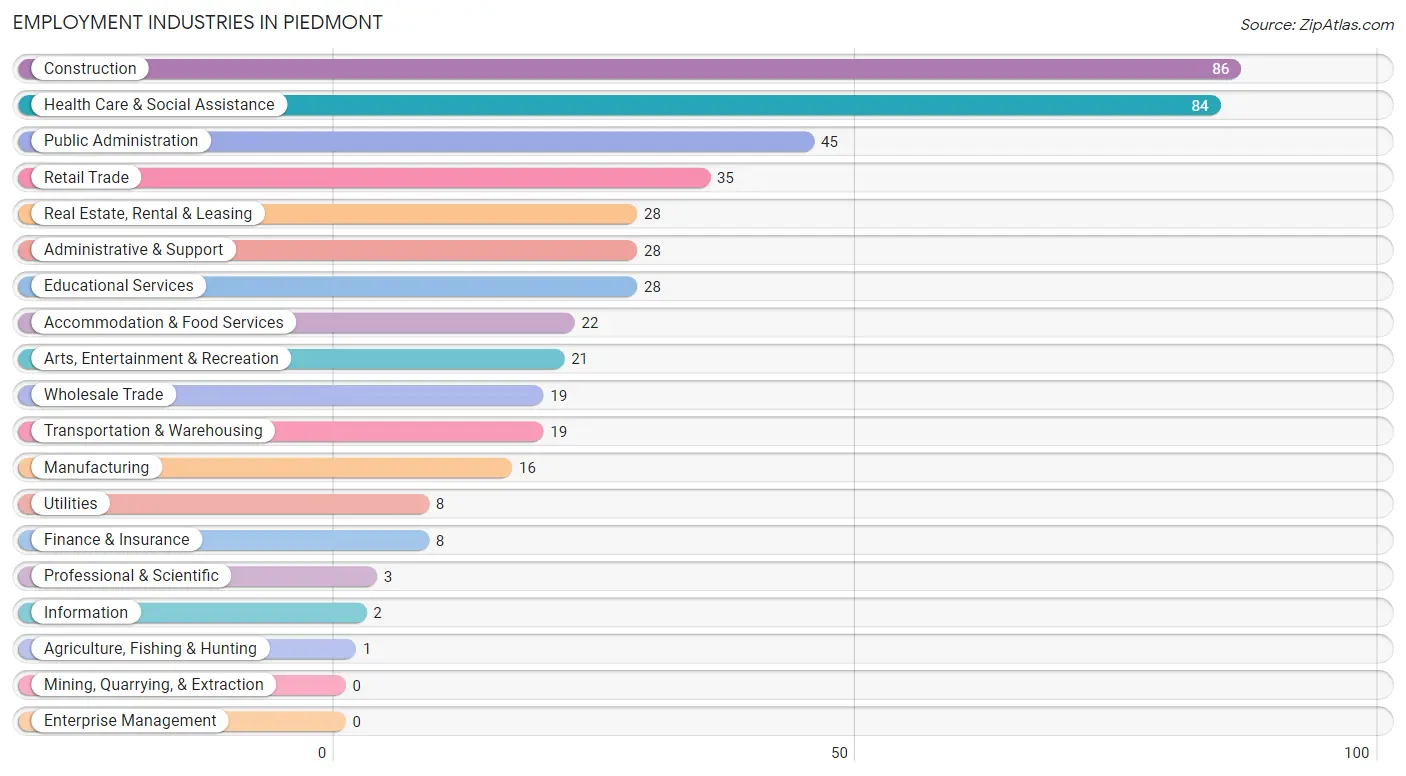
Employment Industries in Piedmont
The major employment industries in Piedmont include Construction (86 | 15.4%), Health Care & Social Assistance (84 | 15.0%), Public Administration (45 | 8.1%), Retail Trade (35 | 6.3%), and Real Estate, Rental & Leasing (28 | 5.0%).
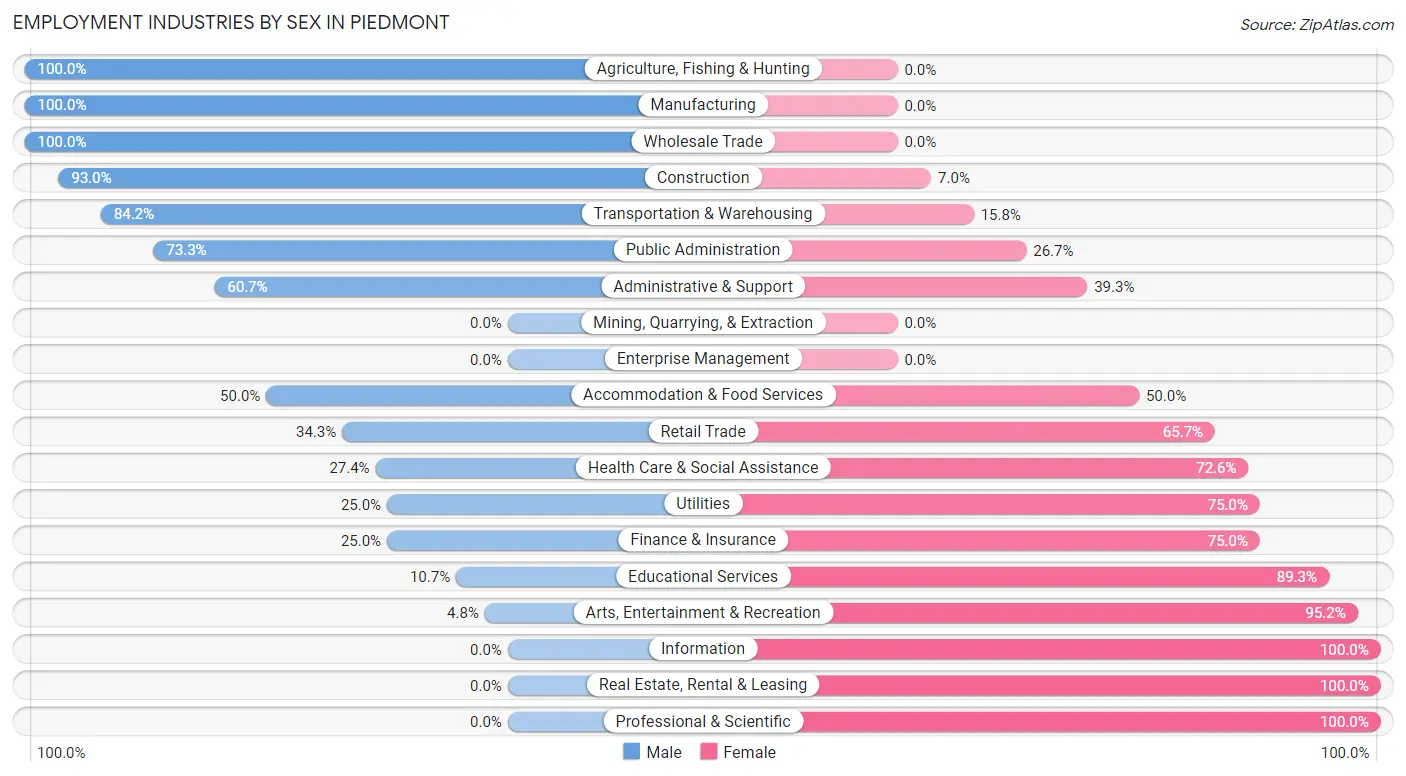
Employment Industries by Sex in Piedmont
The Piedmont industries that see more men than women are Agriculture, Fishing & Hunting (100.0%), Manufacturing (100.0%), and Wholesale Trade (100.0%), whereas the industries that tend to have a higher number of women are Information (100.0%), Real Estate, Rental & Leasing (100.0%), and Professional & Scientific (100.0%).
| Industry | Male | Female |
| Agriculture, Fishing & Hunting | 1 (100.0%) | 0 (0.0%) |
| Mining, Quarrying, & Extraction | 0 (0.0%) | 0 (0.0%) |
| Construction | 80 (93.0%) | 6 (7.0%) |
| Manufacturing | 16 (100.0%) | 0 (0.0%) |
| Wholesale Trade | 19 (100.0%) | 0 (0.0%) |
| Retail Trade | 12 (34.3%) | 23 (65.7%) |
| Transportation & Warehousing | 16 (84.2%) | 3 (15.8%) |
| Utilities | 2 (25.0%) | 6 (75.0%) |
| Information | 0 (0.0%) | 2 (100.0%) |
| Finance & Insurance | 2 (25.0%) | 6 (75.0%) |
| Real Estate, Rental & Leasing | 0 (0.0%) | 28 (100.0%) |
| Professional & Scientific | 0 (0.0%) | 3 (100.0%) |
| Enterprise Management | 0 (0.0%) | 0 (0.0%) |
| Administrative & Support | 17 (60.7%) | 11 (39.3%) |
| Educational Services | 3 (10.7%) | 25 (89.3%) |
| Health Care & Social Assistance | 23 (27.4%) | 61 (72.6%) |
| Arts, Entertainment & Recreation | 1 (4.8%) | 20 (95.2%) |
| Accommodation & Food Services | 11 (50.0%) | 11 (50.0%) |
| Public Administration | 33 (73.3%) | 12 (26.7%) |
| Total | 336 (60.1%) | 223 (39.9%) |
Education in Piedmont
School Enrollment in Piedmont
The most common levels of schooling among the 327 students in Piedmont are elementary school (117 | 35.8%), middle school (90 | 27.5%), and high school (69 | 21.1%).
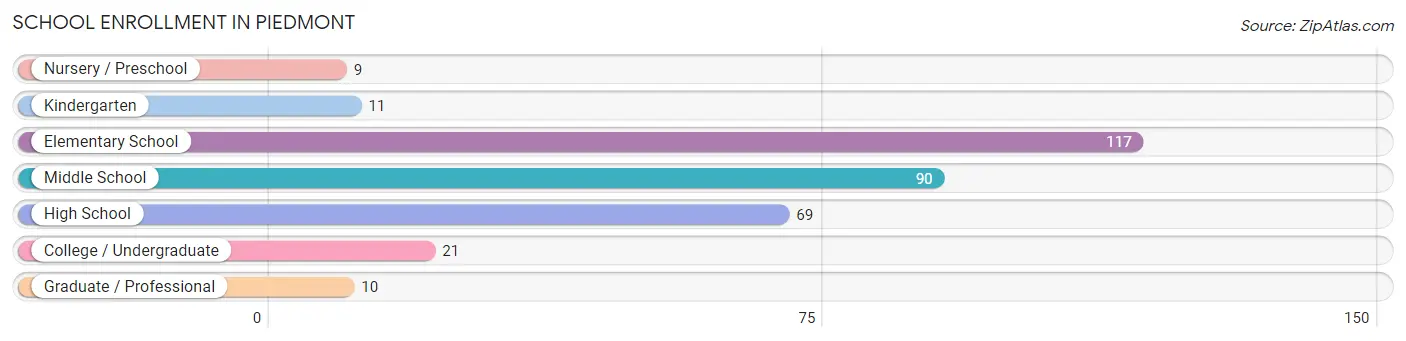
| School Level | # Students | % Students |
| Nursery / Preschool | 9 | 2.8% |
| Kindergarten | 11 | 3.4% |
| Elementary School | 117 | 35.8% |
| Middle School | 90 | 27.5% |
| High School | 69 | 21.1% |
| College / Undergraduate | 21 | 6.4% |
| Graduate / Professional | 10 | 3.1% |
| Total | 327 | 100.0% |
School Enrollment by Age by Funding Source in Piedmont
Out of a total of 327 students who are enrolled in schools in Piedmont, 23 (7.0%) attend a private institution, while the remaining 304 (93.0%) are enrolled in public schools. The age group of 35 years and over has the highest likelihood of being enrolled in private schools, with 9 (69.2% in the age bracket) enrolled. Conversely, the age group of 20 to 24 year olds has the lowest likelihood of being enrolled in a private school, with 18 (100.0% in the age bracket) attending a public institution.
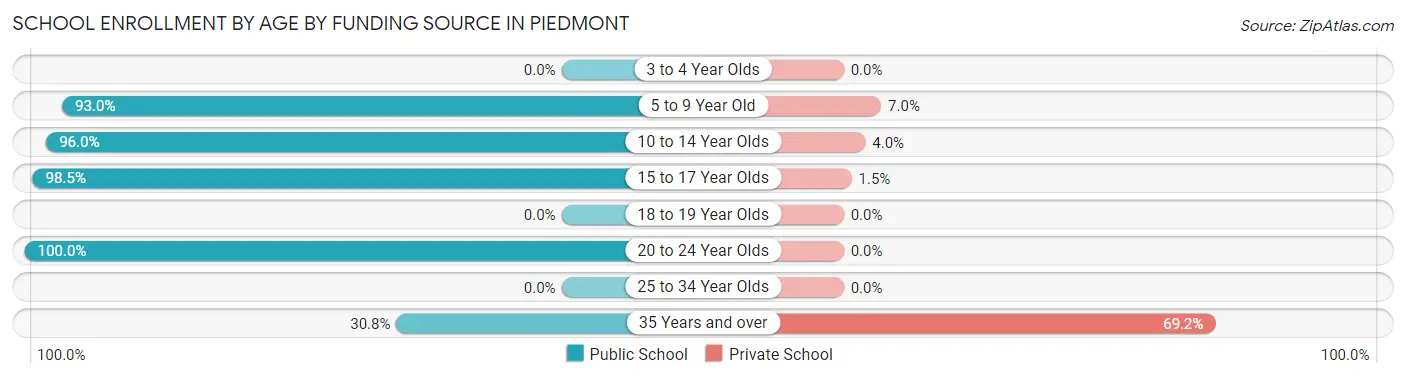
| Age Bracket | Public School | Private School |
| 3 to 4 Year Olds | 0 (0.0%) | 0 (0.0%) |
| 5 to 9 Year Old | 120 (93.0%) | 9 (7.0%) |
| 10 to 14 Year Olds | 95 (96.0%) | 4 (4.0%) |
| 15 to 17 Year Olds | 67 (98.5%) | 1 (1.5%) |
| 18 to 19 Year Olds | 0 (0.0%) | 0 (0.0%) |
| 20 to 24 Year Olds | 18 (100.0%) | 0 (0.0%) |
| 25 to 34 Year Olds | 0 (0.0%) | 0 (0.0%) |
| 35 Years and over | 4 (30.8%) | 9 (69.2%) |
| Total | 304 (93.0%) | 23 (7.0%) |
Educational Attainment by Field of Study in Piedmont
Business (58 | 33.9%), science & technology (27 | 15.8%), education (21 | 12.3%), liberal arts & history (13 | 7.6%), and bio, nature & agricultural (9 | 5.3%) are the most common fields of study among 171 individuals in Piedmont who have obtained a bachelor's degree or higher.
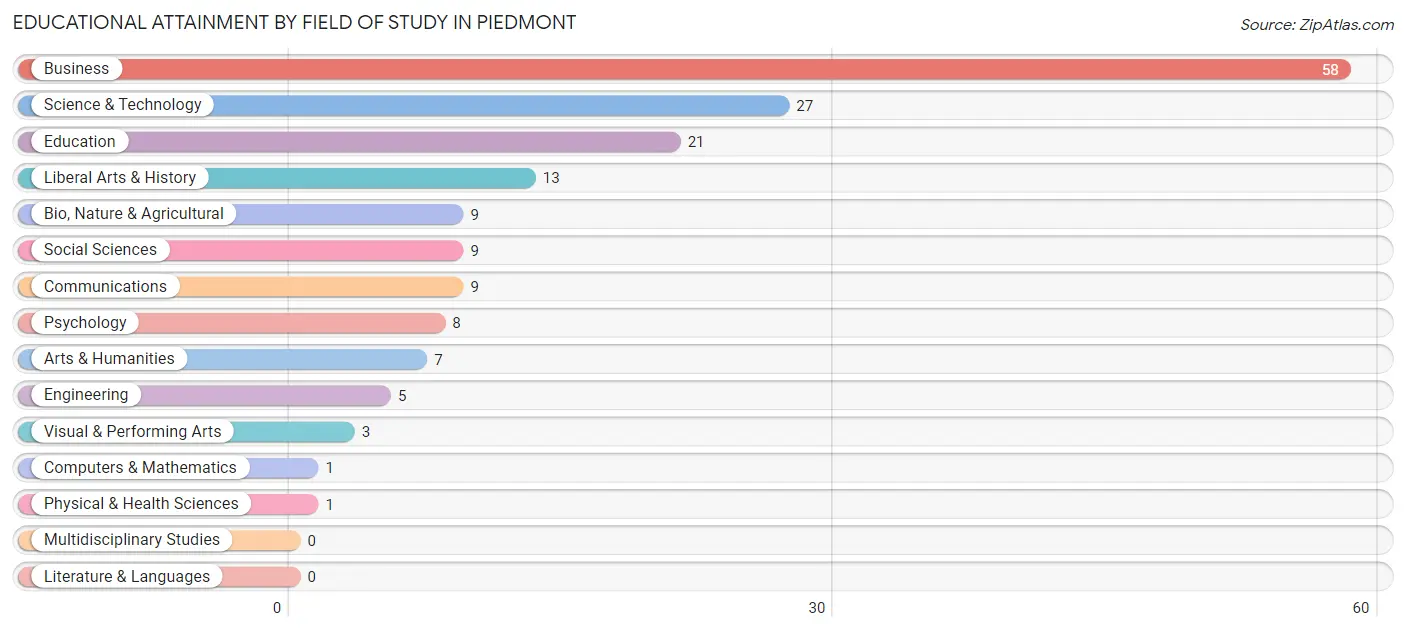
| Field of Study | # Graduates | % Graduates |
| Computers & Mathematics | 1 | 0.6% |
| Bio, Nature & Agricultural | 9 | 5.3% |
| Physical & Health Sciences | 1 | 0.6% |
| Psychology | 8 | 4.7% |
| Social Sciences | 9 | 5.3% |
| Engineering | 5 | 2.9% |
| Multidisciplinary Studies | 0 | 0.0% |
| Science & Technology | 27 | 15.8% |
| Business | 58 | 33.9% |
| Education | 21 | 12.3% |
| Literature & Languages | 0 | 0.0% |
| Liberal Arts & History | 13 | 7.6% |
| Visual & Performing Arts | 3 | 1.8% |
| Communications | 9 | 5.3% |
| Arts & Humanities | 7 | 4.1% |
| Total | 171 | 100.0% |
Transportation & Commute in Piedmont
Vehicle Availability by Sex in Piedmont
The most prevalent vehicle ownership categories in Piedmont are males with 3 vehicles (130, accounting for 39.2%) and females with 3 vehicles (66, making up 58.8%).
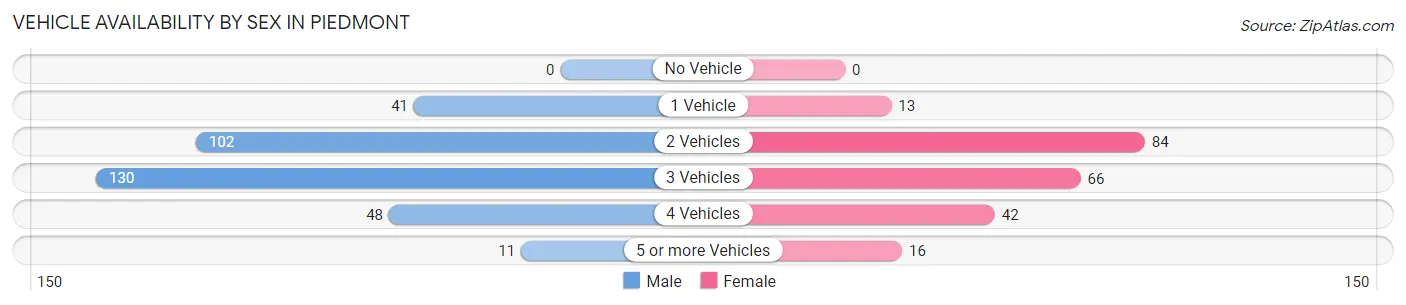
| Vehicles Available | Male | Female |
| No Vehicle | 0 (0.0%) | 0 (0.0%) |
| 1 Vehicle | 41 (12.3%) | 13 (5.9%) |
| 2 Vehicles | 102 (30.7%) | 84 (38.0%) |
| 3 Vehicles | 130 (39.2%) | 66 (29.9%) |
| 4 Vehicles | 48 (14.5%) | 42 (19.0%) |
| 5 or more Vehicles | 11 (3.3%) | 16 (7.2%) |
| Total | 332 (100.0%) | 221 (100.0%) |
Commute Time in Piedmont
The most frequently occuring commute durations in Piedmont are 20 to 24 minutes (177 commuters, 32.8%), less than 5 minutes (97 commuters, 18.0%), and 15 to 19 minutes (91 commuters, 16.9%).
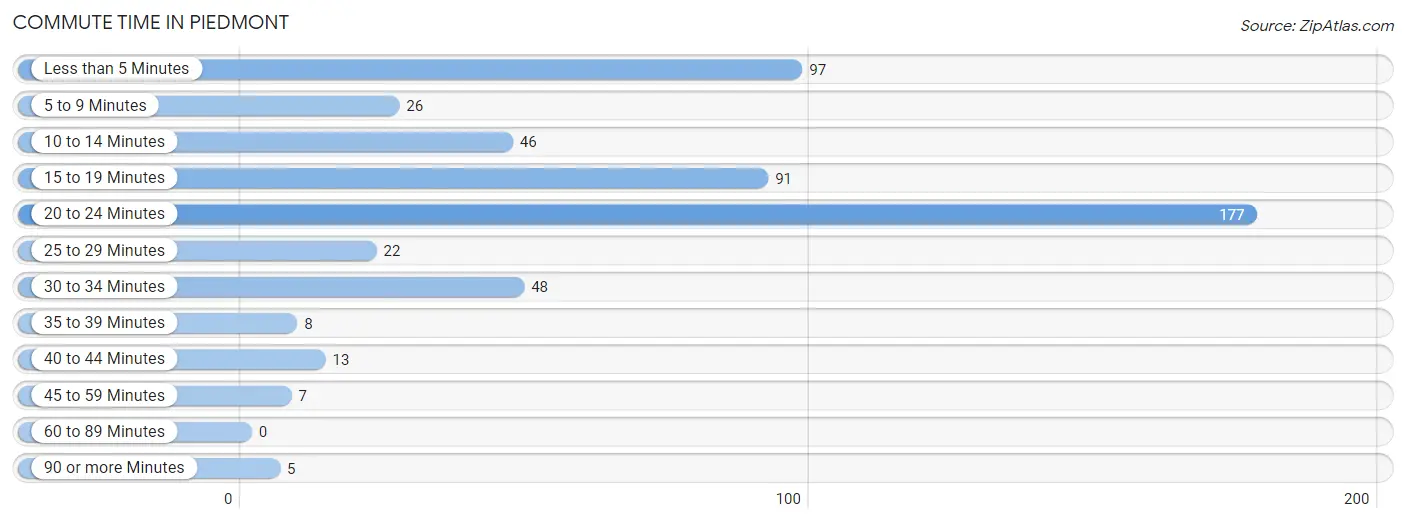
| Commute Time | # Commuters | % Commuters |
| Less than 5 Minutes | 97 | 18.0% |
| 5 to 9 Minutes | 26 | 4.8% |
| 10 to 14 Minutes | 46 | 8.5% |
| 15 to 19 Minutes | 91 | 16.9% |
| 20 to 24 Minutes | 177 | 32.8% |
| 25 to 29 Minutes | 22 | 4.1% |
| 30 to 34 Minutes | 48 | 8.9% |
| 35 to 39 Minutes | 8 | 1.5% |
| 40 to 44 Minutes | 13 | 2.4% |
| 45 to 59 Minutes | 7 | 1.3% |
| 60 to 89 Minutes | 0 | 0.0% |
| 90 or more Minutes | 5 | 0.9% |
Commute Time by Sex in Piedmont
The most common commute times in Piedmont are 20 to 24 minutes (105 commuters, 31.8%) for males and 20 to 24 minutes (72 commuters, 34.3%) for females.
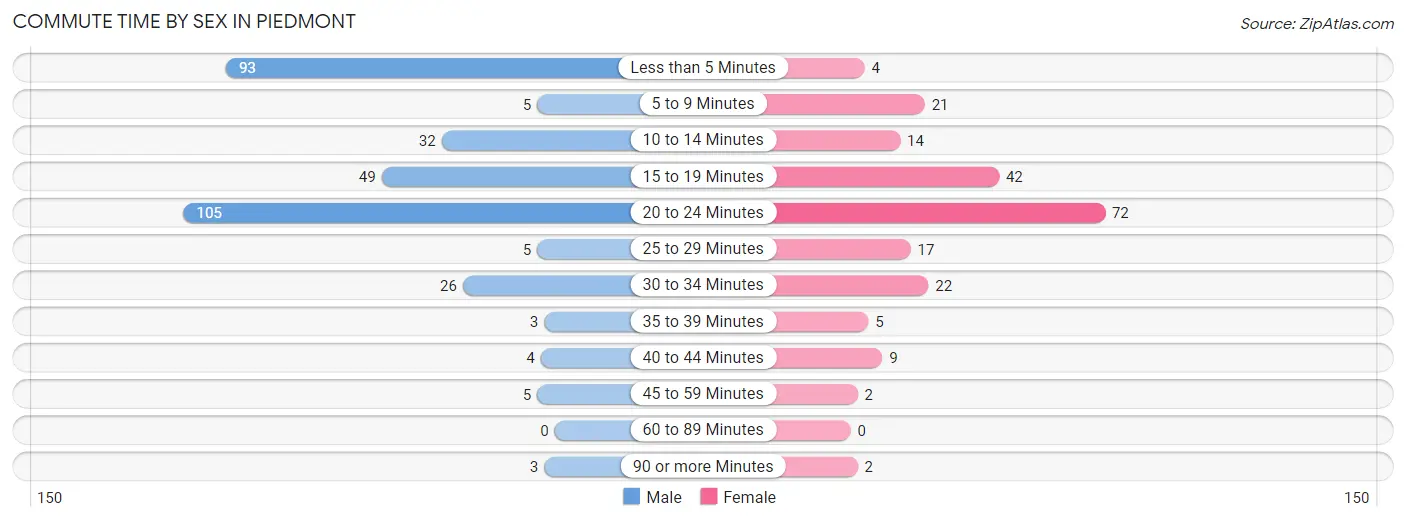
| Commute Time | Male | Female |
| Less than 5 Minutes | 93 (28.2%) | 4 (1.9%) |
| 5 to 9 Minutes | 5 (1.5%) | 21 (10.0%) |
| 10 to 14 Minutes | 32 (9.7%) | 14 (6.7%) |
| 15 to 19 Minutes | 49 (14.8%) | 42 (20.0%) |
| 20 to 24 Minutes | 105 (31.8%) | 72 (34.3%) |
| 25 to 29 Minutes | 5 (1.5%) | 17 (8.1%) |
| 30 to 34 Minutes | 26 (7.9%) | 22 (10.5%) |
| 35 to 39 Minutes | 3 (0.9%) | 5 (2.4%) |
| 40 to 44 Minutes | 4 (1.2%) | 9 (4.3%) |
| 45 to 59 Minutes | 5 (1.5%) | 2 (0.9%) |
| 60 to 89 Minutes | 0 (0.0%) | 0 (0.0%) |
| 90 or more Minutes | 3 (0.9%) | 2 (0.9%) |
Time of Departure to Work by Sex in Piedmont
The most frequent times of departure to work in Piedmont are 9:00 AM to 9:59 AM (86, 26.1%) for males and 7:30 AM to 7:59 AM (57, 27.1%) for females.
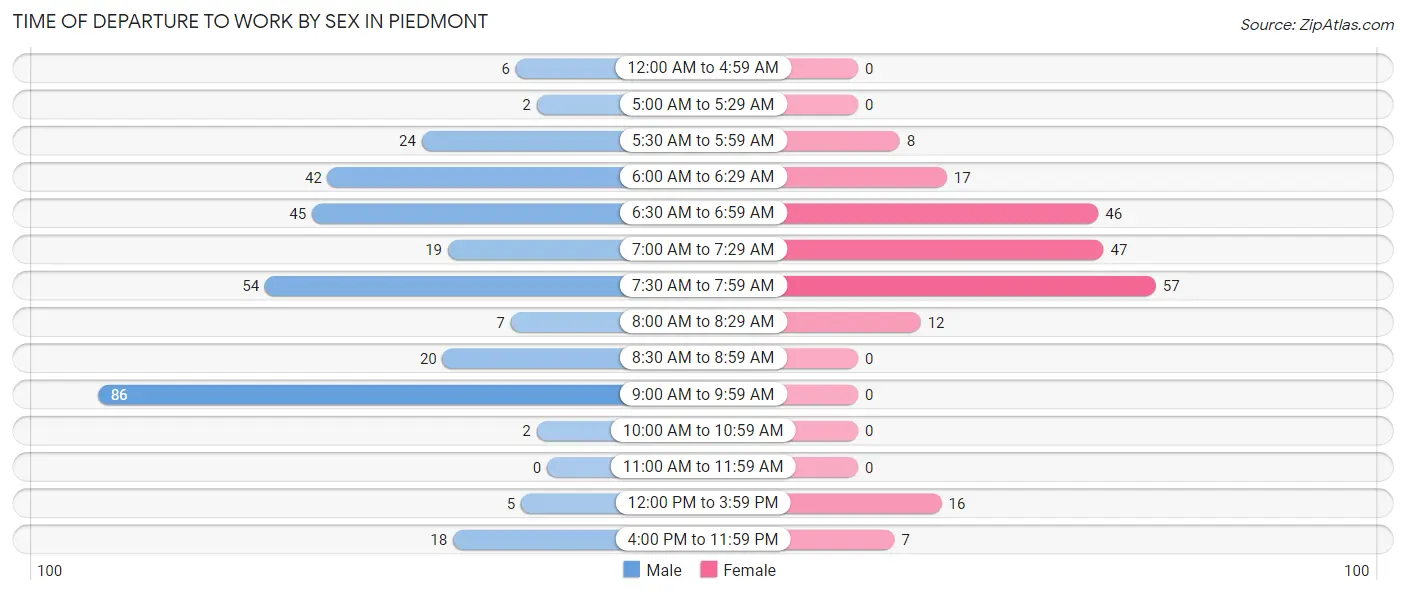
| Time of Departure | Male | Female |
| 12:00 AM to 4:59 AM | 6 (1.8%) | 0 (0.0%) |
| 5:00 AM to 5:29 AM | 2 (0.6%) | 0 (0.0%) |
| 5:30 AM to 5:59 AM | 24 (7.3%) | 8 (3.8%) |
| 6:00 AM to 6:29 AM | 42 (12.7%) | 17 (8.1%) |
| 6:30 AM to 6:59 AM | 45 (13.6%) | 46 (21.9%) |
| 7:00 AM to 7:29 AM | 19 (5.8%) | 47 (22.4%) |
| 7:30 AM to 7:59 AM | 54 (16.4%) | 57 (27.1%) |
| 8:00 AM to 8:29 AM | 7 (2.1%) | 12 (5.7%) |
| 8:30 AM to 8:59 AM | 20 (6.1%) | 0 (0.0%) |
| 9:00 AM to 9:59 AM | 86 (26.1%) | 0 (0.0%) |
| 10:00 AM to 10:59 AM | 2 (0.6%) | 0 (0.0%) |
| 11:00 AM to 11:59 AM | 0 (0.0%) | 0 (0.0%) |
| 12:00 PM to 3:59 PM | 5 (1.5%) | 16 (7.6%) |
| 4:00 PM to 11:59 PM | 18 (5.4%) | 7 (3.3%) |
| Total | 330 (100.0%) | 210 (100.0%) |
Housing Occupancy in Piedmont
Occupancy by Ownership in Piedmont
Of the total 455 dwellings in Piedmont, owner-occupied units account for 375 (82.4%), while renter-occupied units make up 80 (17.6%).
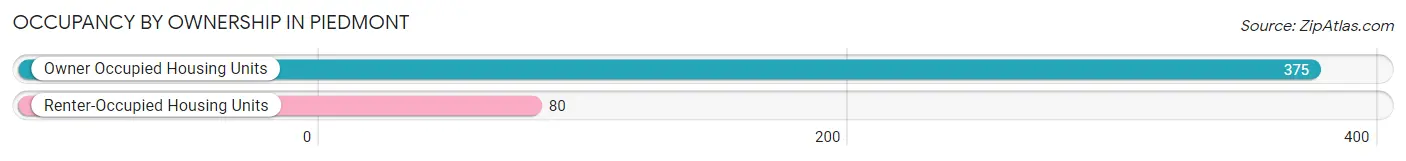
| Occupancy | # Housing Units | % Housing Units |
| Owner Occupied Housing Units | 375 | 82.4% |
| Renter-Occupied Housing Units | 80 | 17.6% |
| Total Occupied Housing Units | 455 | 100.0% |
Occupancy by Household Size in Piedmont
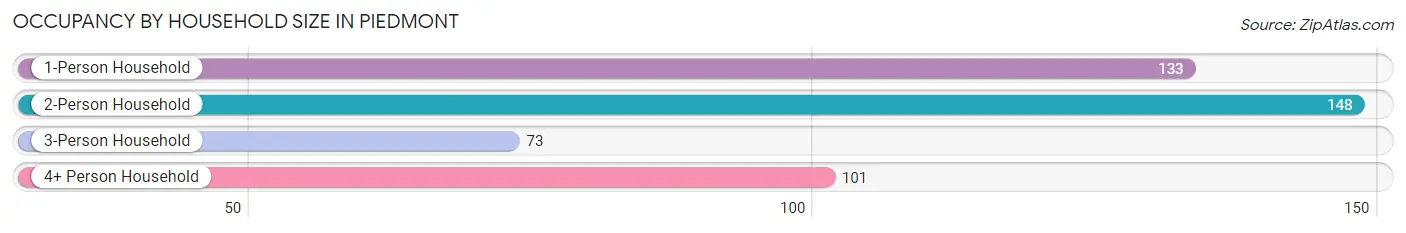
| Household Size | # Housing Units | % Housing Units |
| 1-Person Household | 133 | 29.2% |
| 2-Person Household | 148 | 32.5% |
| 3-Person Household | 73 | 16.0% |
| 4+ Person Household | 101 | 22.2% |
| Total Housing Units | 455 | 100.0% |
Occupancy by Ownership by Household Size in Piedmont
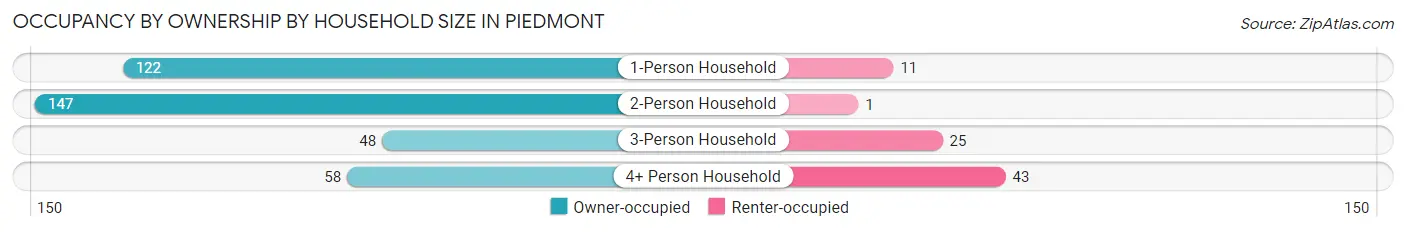
| Household Size | Owner-occupied | Renter-occupied |
| 1-Person Household | 122 (91.7%) | 11 (8.3%) |
| 2-Person Household | 147 (99.3%) | 1 (0.7%) |
| 3-Person Household | 48 (65.7%) | 25 (34.3%) |
| 4+ Person Household | 58 (57.4%) | 43 (42.6%) |
| Total Housing Units | 375 (82.4%) | 80 (17.6%) |
Occupancy by Educational Attainment in Piedmont
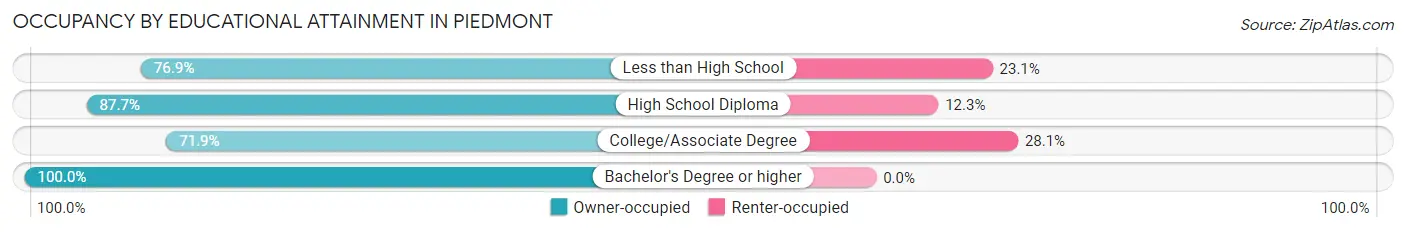
| Household Size | Owner-occupied | Renter-occupied |
| Less than High School | 10 (76.9%) | 3 (23.1%) |
| High School Diploma | 114 (87.7%) | 16 (12.3%) |
| College/Associate Degree | 156 (71.9%) | 61 (28.1%) |
| Bachelor's Degree or higher | 95 (100.0%) | 0 (0.0%) |
Occupancy by Age of Householder in Piedmont
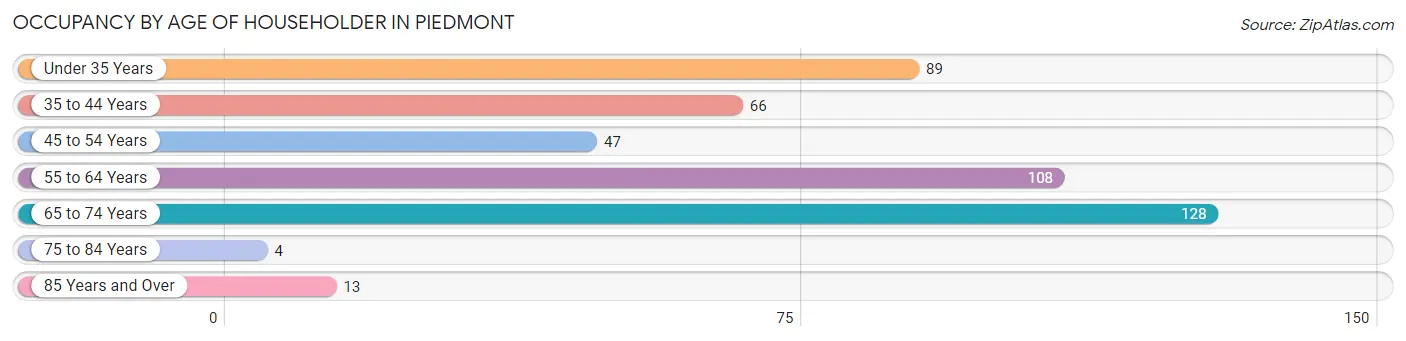
| Age Bracket | # Households | % Households |
| Under 35 Years | 89 | 19.6% |
| 35 to 44 Years | 66 | 14.5% |
| 45 to 54 Years | 47 | 10.3% |
| 55 to 64 Years | 108 | 23.7% |
| 65 to 74 Years | 128 | 28.1% |
| 75 to 84 Years | 4 | 0.9% |
| 85 Years and Over | 13 | 2.9% |
| Total | 455 | 100.0% |
Housing Finances in Piedmont
Median Income by Occupancy in Piedmont
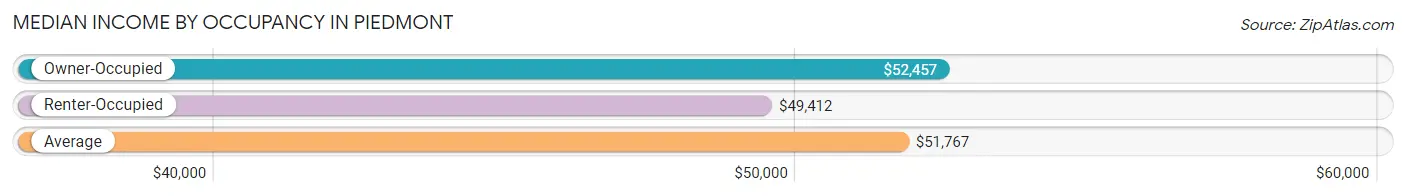
| Occupancy Type | # Households | Median Income |
| Owner-Occupied | 375 (82.4%) | $52,457 |
| Renter-Occupied | 80 (17.6%) | $49,412 |
| Average | 455 (100.0%) | $51,767 |
Occupancy by Householder Income Bracket in Piedmont
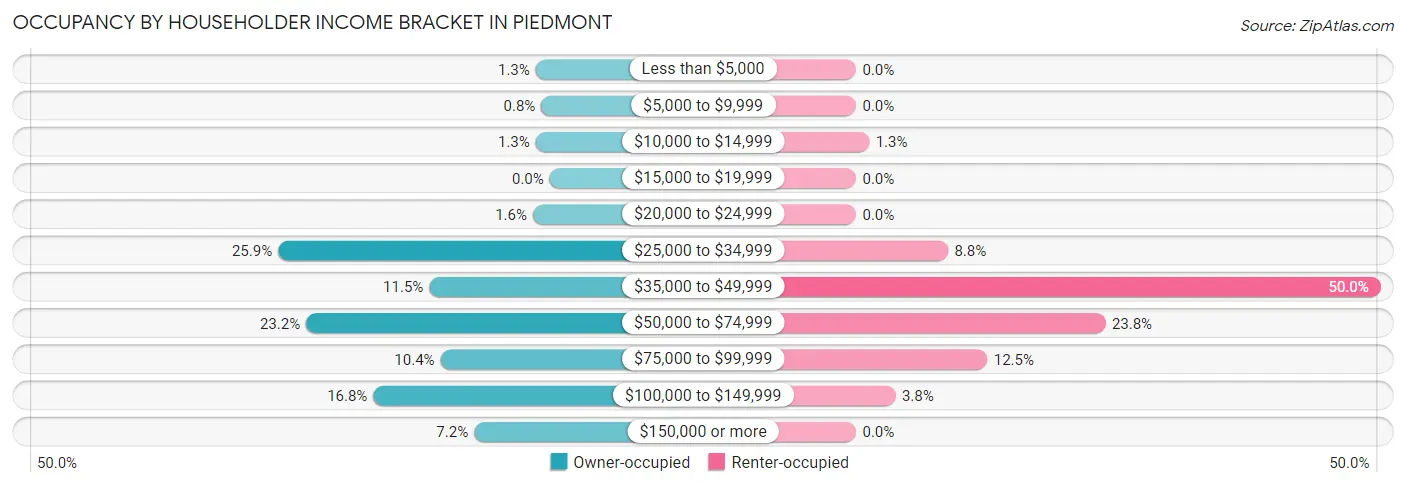
| Income Bracket | Owner-occupied | Renter-occupied |
| Less than $5,000 | 5 (1.3%) | 0 (0.0%) |
| $5,000 to $9,999 | 3 (0.8%) | 0 (0.0%) |
| $10,000 to $14,999 | 5 (1.3%) | 1 (1.3%) |
| $15,000 to $19,999 | 0 (0.0%) | 0 (0.0%) |
| $20,000 to $24,999 | 6 (1.6%) | 0 (0.0%) |
| $25,000 to $34,999 | 97 (25.9%) | 7 (8.7%) |
| $35,000 to $49,999 | 43 (11.5%) | 40 (50.0%) |
| $50,000 to $74,999 | 87 (23.2%) | 19 (23.7%) |
| $75,000 to $99,999 | 39 (10.4%) | 10 (12.5%) |
| $100,000 to $149,999 | 63 (16.8%) | 3 (3.7%) |
| $150,000 or more | 27 (7.2%) | 0 (0.0%) |
| Total | 375 (100.0%) | 80 (100.0%) |
Monthly Housing Cost Tiers in Piedmont
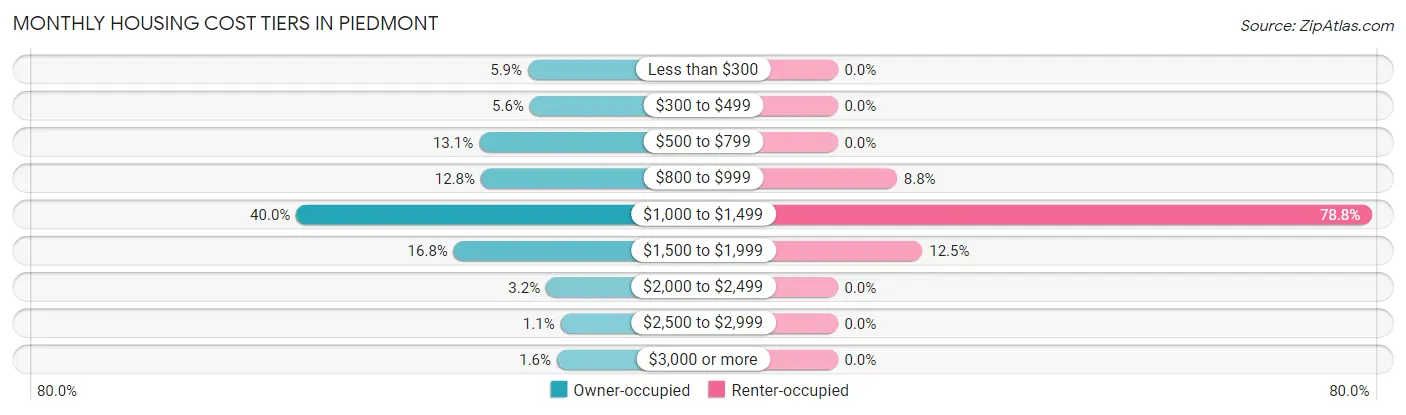
| Monthly Cost | Owner-occupied | Renter-occupied |
| Less than $300 | 22 (5.9%) | 0 (0.0%) |
| $300 to $499 | 21 (5.6%) | 0 (0.0%) |
| $500 to $799 | 49 (13.1%) | 0 (0.0%) |
| $800 to $999 | 48 (12.8%) | 7 (8.7%) |
| $1,000 to $1,499 | 150 (40.0%) | 63 (78.7%) |
| $1,500 to $1,999 | 63 (16.8%) | 10 (12.5%) |
| $2,000 to $2,499 | 12 (3.2%) | 0 (0.0%) |
| $2,500 to $2,999 | 4 (1.1%) | 0 (0.0%) |
| $3,000 or more | 6 (1.6%) | 0 (0.0%) |
| Total | 375 (100.0%) | 80 (100.0%) |
Physical Housing Characteristics in Piedmont
Housing Structures in Piedmont
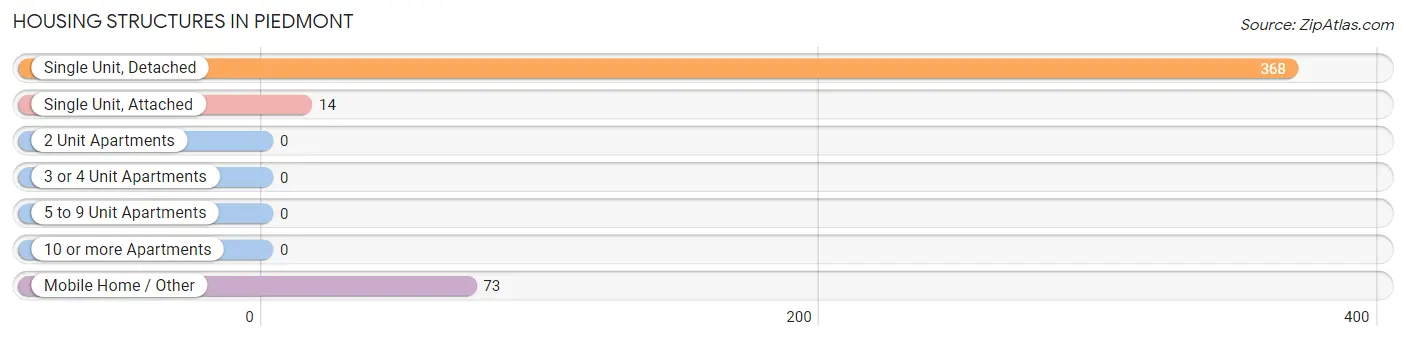
| Structure Type | # Housing Units | % Housing Units |
| Single Unit, Detached | 368 | 80.9% |
| Single Unit, Attached | 14 | 3.1% |
| 2 Unit Apartments | 0 | 0.0% |
| 3 or 4 Unit Apartments | 0 | 0.0% |
| 5 to 9 Unit Apartments | 0 | 0.0% |
| 10 or more Apartments | 0 | 0.0% |
| Mobile Home / Other | 73 | 16.0% |
| Total | 455 | 100.0% |
Housing Structures by Occupancy in Piedmont
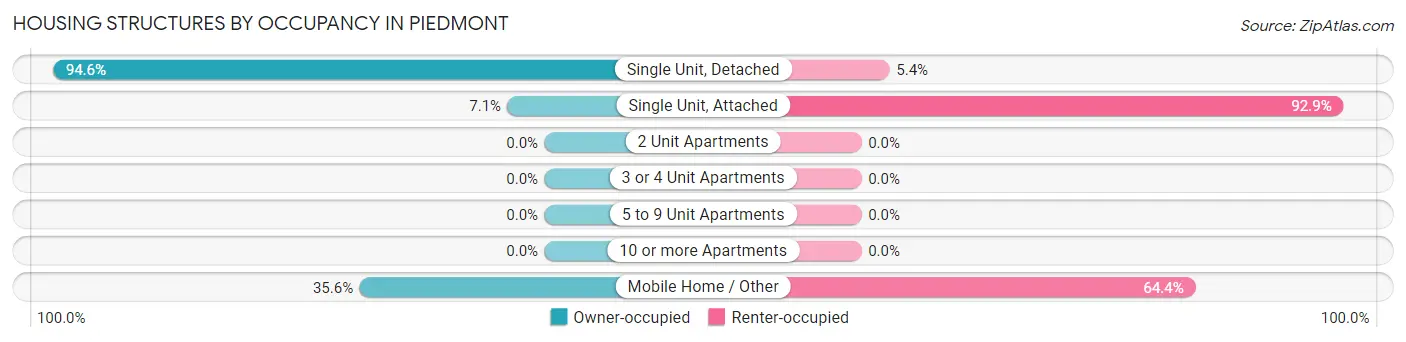
| Structure Type | Owner-occupied | Renter-occupied |
| Single Unit, Detached | 348 (94.6%) | 20 (5.4%) |
| Single Unit, Attached | 1 (7.1%) | 13 (92.9%) |
| 2 Unit Apartments | 0 (0.0%) | 0 (0.0%) |
| 3 or 4 Unit Apartments | 0 (0.0%) | 0 (0.0%) |
| 5 to 9 Unit Apartments | 0 (0.0%) | 0 (0.0%) |
| 10 or more Apartments | 0 (0.0%) | 0 (0.0%) |
| Mobile Home / Other | 26 (35.6%) | 47 (64.4%) |
| Total | 375 (82.4%) | 80 (17.6%) |
Housing Structures by Number of Rooms in Piedmont
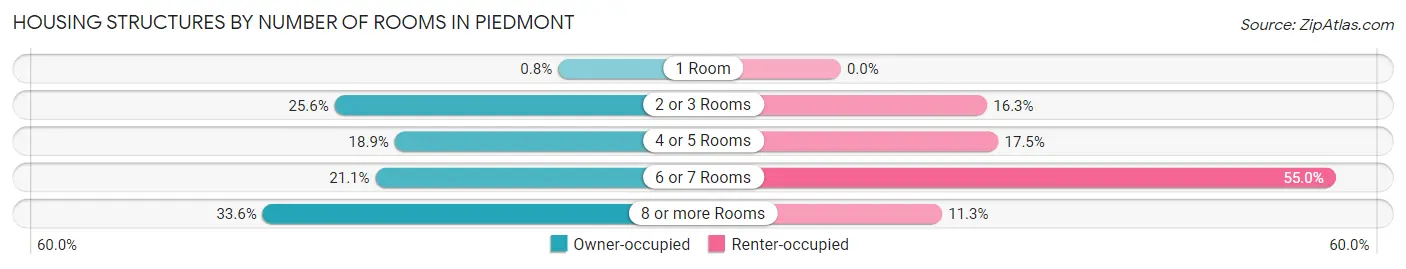
| Number of Rooms | Owner-occupied | Renter-occupied |
| 1 Room | 3 (0.8%) | 0 (0.0%) |
| 2 or 3 Rooms | 96 (25.6%) | 13 (16.3%) |
| 4 or 5 Rooms | 71 (18.9%) | 14 (17.5%) |
| 6 or 7 Rooms | 79 (21.1%) | 44 (55.0%) |
| 8 or more Rooms | 126 (33.6%) | 9 (11.3%) |
| Total | 375 (100.0%) | 80 (100.0%) |
Housing Structure by Heating Type in Piedmont
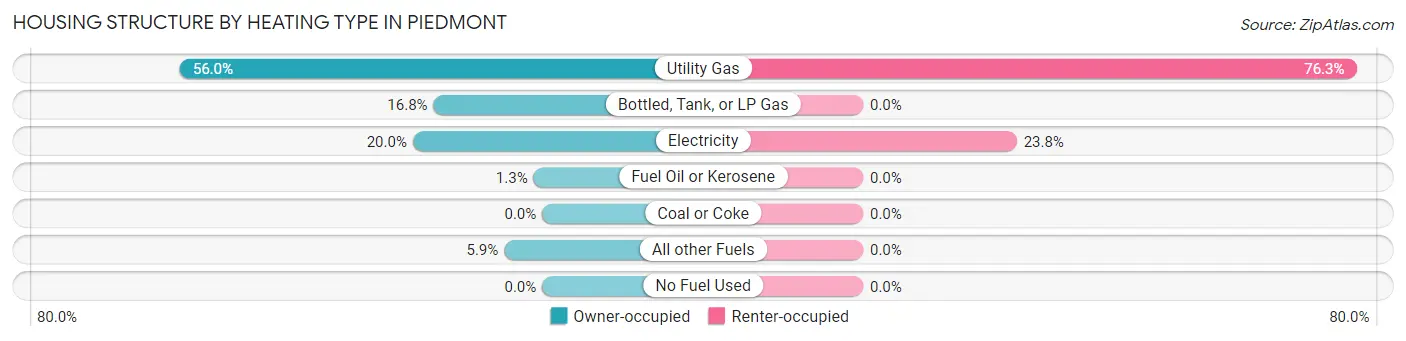
| Heating Type | Owner-occupied | Renter-occupied |
| Utility Gas | 210 (56.0%) | 61 (76.2%) |
| Bottled, Tank, or LP Gas | 63 (16.8%) | 0 (0.0%) |
| Electricity | 75 (20.0%) | 19 (23.7%) |
| Fuel Oil or Kerosene | 5 (1.3%) | 0 (0.0%) |
| Coal or Coke | 0 (0.0%) | 0 (0.0%) |
| All other Fuels | 22 (5.9%) | 0 (0.0%) |
| No Fuel Used | 0 (0.0%) | 0 (0.0%) |
| Total | 375 (100.0%) | 80 (100.0%) |
Household Vehicle Usage in Piedmont
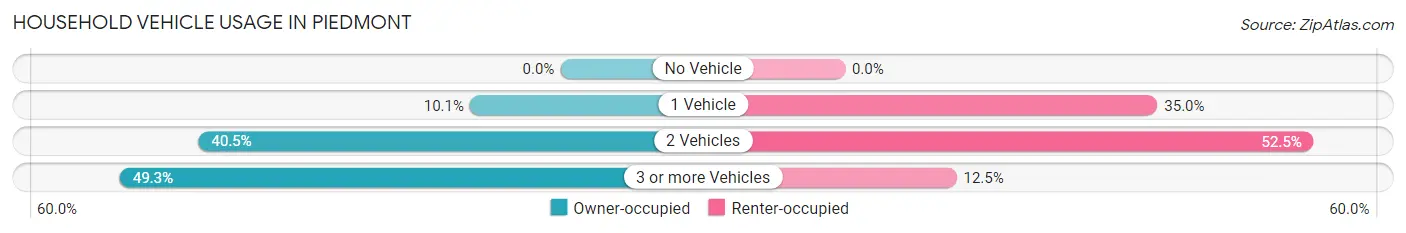
| Vehicles per Household | Owner-occupied | Renter-occupied |
| No Vehicle | 0 (0.0%) | 0 (0.0%) |
| 1 Vehicle | 38 (10.1%) | 28 (35.0%) |
| 2 Vehicles | 152 (40.5%) | 42 (52.5%) |
| 3 or more Vehicles | 185 (49.3%) | 10 (12.5%) |
| Total | 375 (100.0%) | 80 (100.0%) |
Real Estate & Mortgages in Piedmont
Real Estate and Mortgage Overview in Piedmont
| Characteristic | Without Mortgage | With Mortgage |
| Housing Units | 216 | 159 |
| Median Property Value | $329,000 | $220,700 |
| Median Household Income | - | - |
| Monthly Housing Costs | $876 | $6 |
| Real Estate Taxes | $2,659 | $0 |
Property Value by Mortgage Status in Piedmont
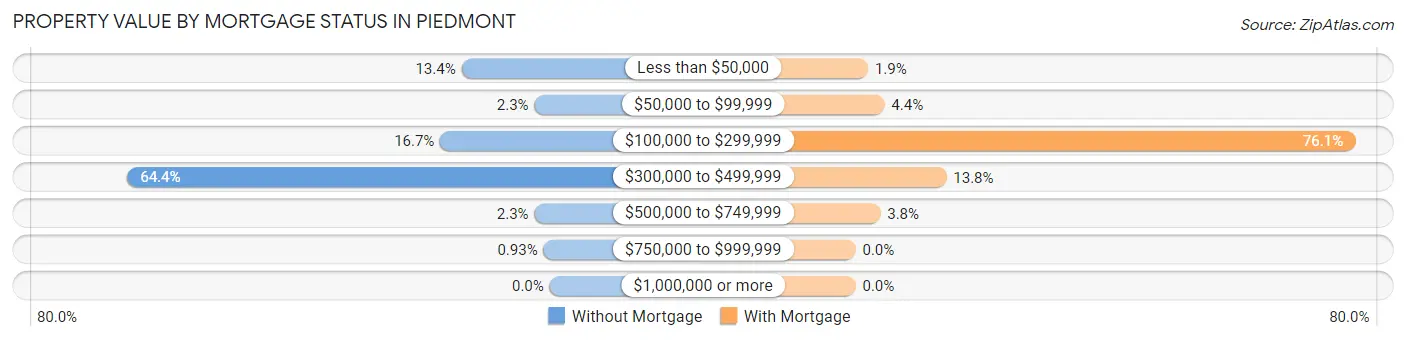
| Property Value | Without Mortgage | With Mortgage |
| Less than $50,000 | 29 (13.4%) | 3 (1.9%) |
| $50,000 to $99,999 | 5 (2.3%) | 7 (4.4%) |
| $100,000 to $299,999 | 36 (16.7%) | 121 (76.1%) |
| $300,000 to $499,999 | 139 (64.3%) | 22 (13.8%) |
| $500,000 to $749,999 | 5 (2.3%) | 6 (3.8%) |
| $750,000 to $999,999 | 2 (0.9%) | 0 (0.0%) |
| $1,000,000 or more | 0 (0.0%) | 0 (0.0%) |
| Total | 216 (100.0%) | 159 (100.0%) |
Household Income by Mortgage Status in Piedmont
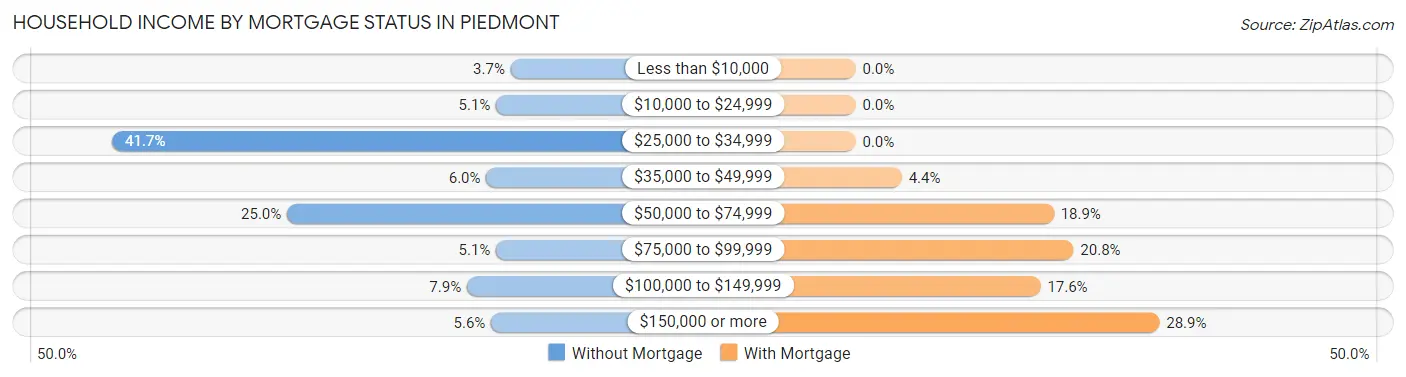
| Household Income | Without Mortgage | With Mortgage |
| Less than $10,000 | 8 (3.7%) | 0 (0.0%) |
| $10,000 to $24,999 | 11 (5.1%) | 0 (0.0%) |
| $25,000 to $34,999 | 90 (41.7%) | 0 (0.0%) |
| $35,000 to $49,999 | 13 (6.0%) | 7 (4.4%) |
| $50,000 to $74,999 | 54 (25.0%) | 30 (18.9%) |
| $75,000 to $99,999 | 11 (5.1%) | 33 (20.7%) |
| $100,000 to $149,999 | 17 (7.9%) | 28 (17.6%) |
| $150,000 or more | 12 (5.6%) | 46 (28.9%) |
| Total | 216 (100.0%) | 159 (100.0%) |
Property Value to Household Income Ratio in Piedmont
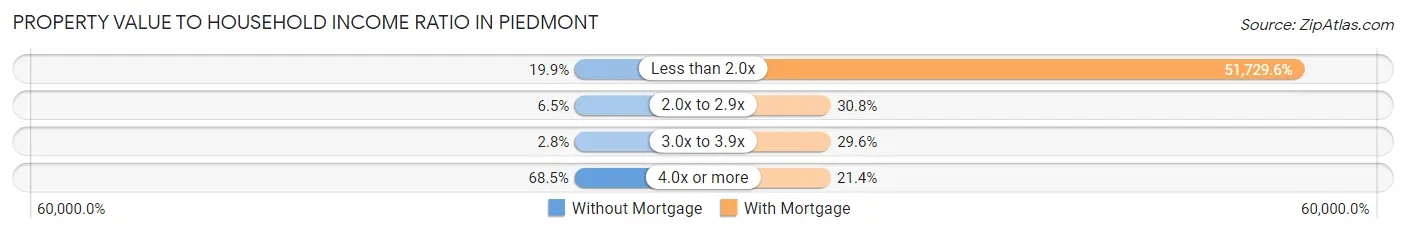
| Value-to-Income Ratio | Without Mortgage | With Mortgage |
| Less than 2.0x | 43 (19.9%) | 82,250 (51,729.6%) |
| 2.0x to 2.9x | 14 (6.5%) | 49 (30.8%) |
| 3.0x to 3.9x | 6 (2.8%) | 47 (29.6%) |
| 4.0x or more | 148 (68.5%) | 34 (21.4%) |
| Total | 216 (100.0%) | 159 (100.0%) |
Real Estate Taxes by Mortgage Status in Piedmont
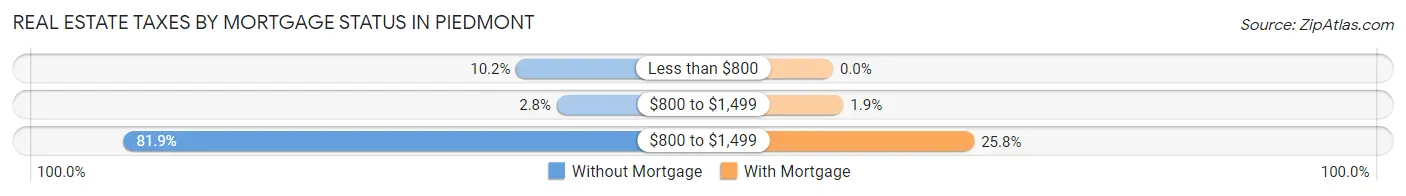
| Property Taxes | Without Mortgage | With Mortgage |
| Less than $800 | 22 (10.2%) | 0 (0.0%) |
| $800 to $1,499 | 6 (2.8%) | 3 (1.9%) |
| $800 to $1,499 | 177 (81.9%) | 41 (25.8%) |
| Total | 216 (100.0%) | 159 (100.0%) |
Health & Disability in Piedmont
Health Insurance Coverage by Age in Piedmont
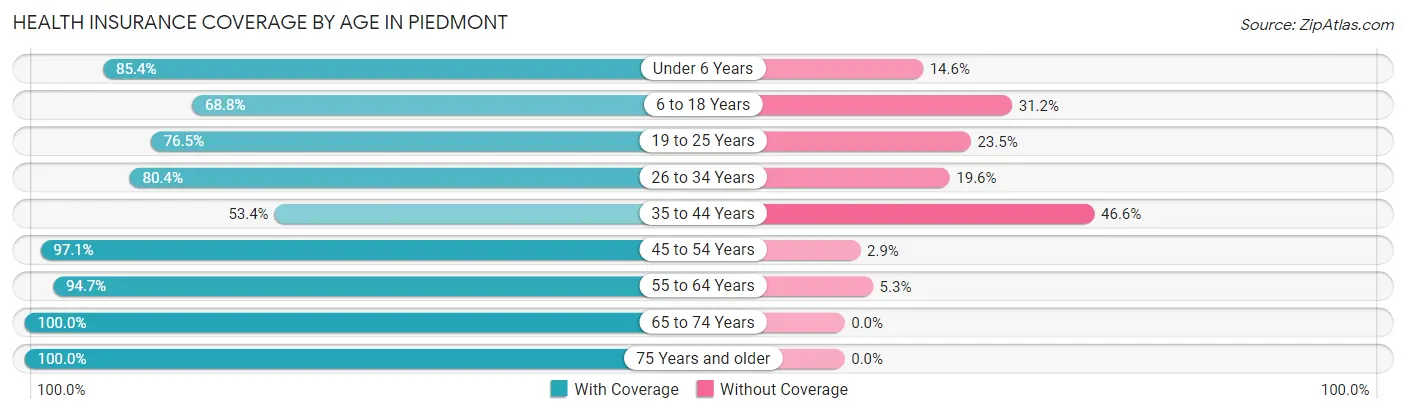
| Age Bracket | With Coverage | Without Coverage |
| Under 6 Years | 70 (85.4%) | 12 (14.6%) |
| 6 to 18 Years | 196 (68.8%) | 89 (31.2%) |
| 19 to 25 Years | 39 (76.5%) | 12 (23.5%) |
| 26 to 34 Years | 156 (80.4%) | 38 (19.6%) |
| 35 to 44 Years | 47 (53.4%) | 41 (46.6%) |
| 45 to 54 Years | 99 (97.1%) | 3 (2.9%) |
| 55 to 64 Years | 161 (94.7%) | 9 (5.3%) |
| 65 to 74 Years | 191 (100.0%) | 0 (0.0%) |
| 75 Years and older | 35 (100.0%) | 0 (0.0%) |
| Total | 994 (83.0%) | 204 (17.0%) |
Health Insurance Coverage by Citizenship Status in Piedmont
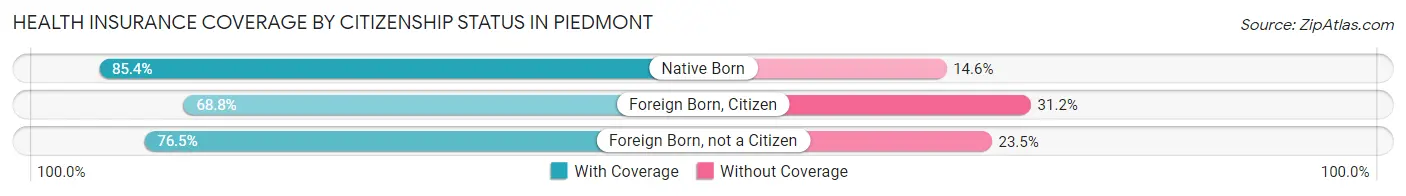
| Citizenship Status | With Coverage | Without Coverage |
| Native Born | 70 (85.4%) | 12 (14.6%) |
| Foreign Born, Citizen | 196 (68.8%) | 89 (31.2%) |
| Foreign Born, not a Citizen | 39 (76.5%) | 12 (23.5%) |
Health Insurance Coverage by Household Income in Piedmont
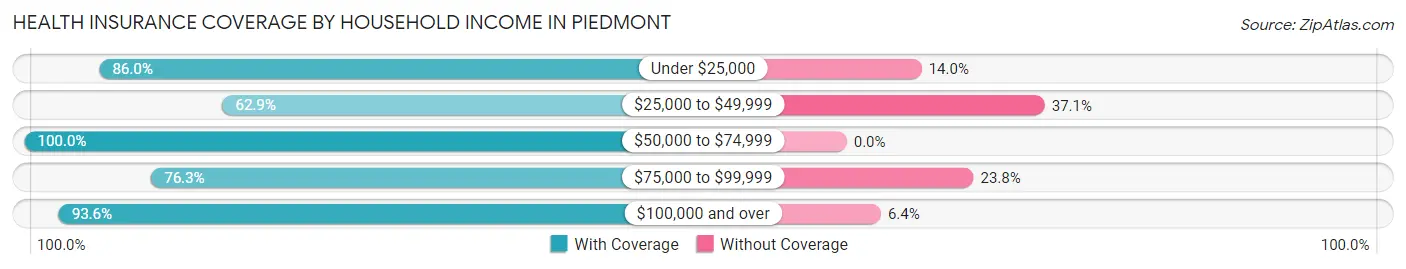
| Household Income | With Coverage | Without Coverage |
| Under $25,000 | 49 (86.0%) | 8 (14.0%) |
| $25,000 to $49,999 | 234 (62.9%) | 138 (37.1%) |
| $50,000 to $74,999 | 297 (100.0%) | 0 (0.0%) |
| $75,000 to $99,999 | 122 (76.2%) | 38 (23.7%) |
| $100,000 and over | 292 (93.6%) | 20 (6.4%) |
Public vs Private Health Insurance Coverage by Age in Piedmont
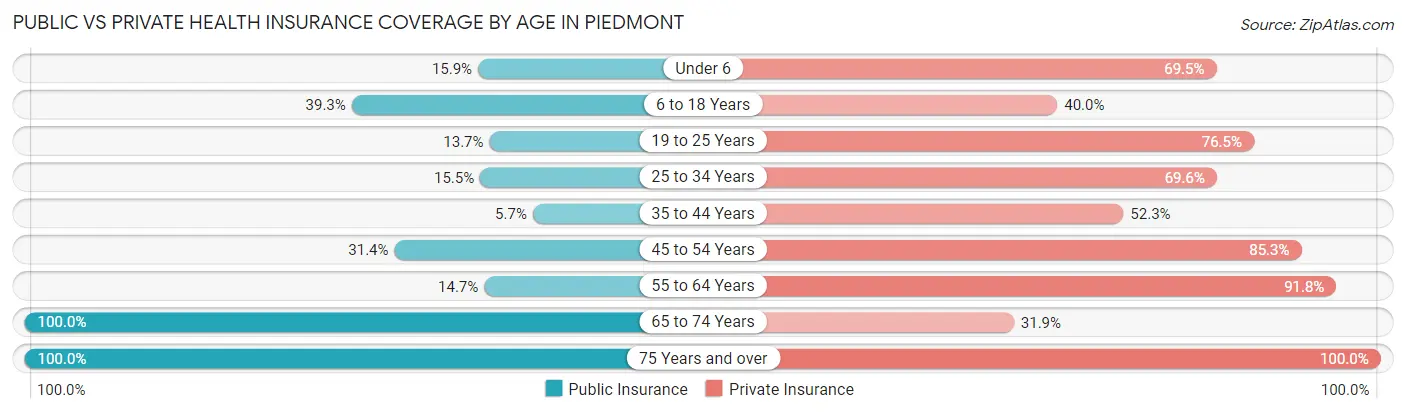
| Age Bracket | Public Insurance | Private Insurance |
| Under 6 | 13 (15.9%) | 57 (69.5%) |
| 6 to 18 Years | 112 (39.3%) | 114 (40.0%) |
| 19 to 25 Years | 7 (13.7%) | 39 (76.5%) |
| 25 to 34 Years | 30 (15.5%) | 135 (69.6%) |
| 35 to 44 Years | 5 (5.7%) | 46 (52.3%) |
| 45 to 54 Years | 32 (31.4%) | 87 (85.3%) |
| 55 to 64 Years | 25 (14.7%) | 156 (91.8%) |
| 65 to 74 Years | 191 (100.0%) | 61 (31.9%) |
| 75 Years and over | 35 (100.0%) | 35 (100.0%) |
| Total | 450 (37.6%) | 730 (60.9%) |
Disability Status by Sex by Age in Piedmont
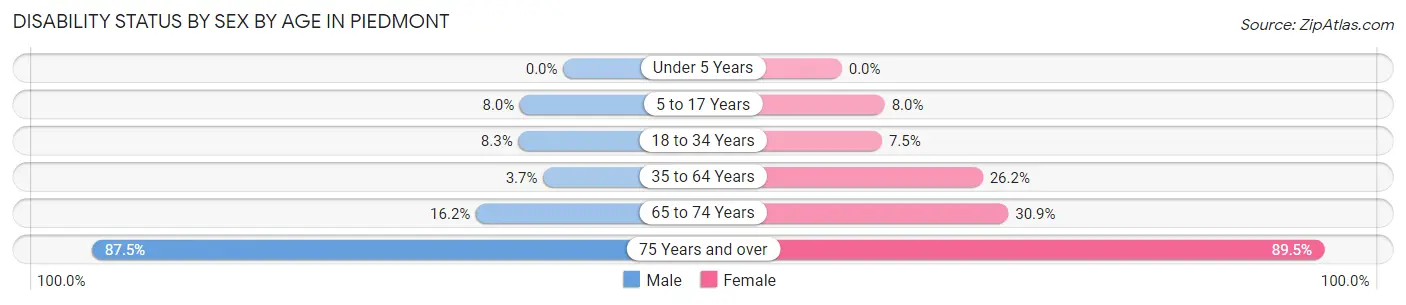
| Age Bracket | Male | Female |
| Under 5 Years | 0 (0.0%) | 0 (0.0%) |
| 5 to 17 Years | 13 (8.0%) | 11 (8.0%) |
| 18 to 34 Years | 7 (8.3%) | 12 (7.4%) |
| 35 to 64 Years | 7 (3.7%) | 45 (26.2%) |
| 65 to 74 Years | 22 (16.2%) | 17 (30.9%) |
| 75 Years and over | 14 (87.5%) | 17 (89.5%) |
Disability Class by Sex by Age in Piedmont
Disability Class: Hearing Difficulty
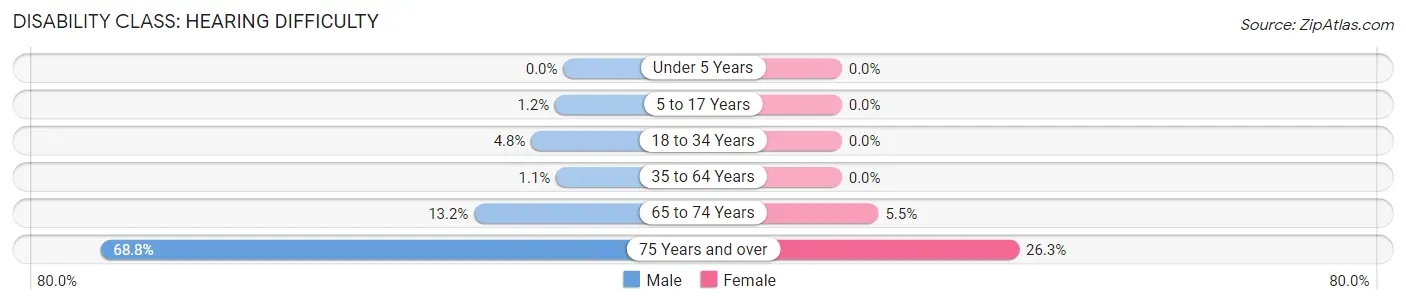
| Age Bracket | Male | Female |
| Under 5 Years | 0 (0.0%) | 0 (0.0%) |
| 5 to 17 Years | 2 (1.2%) | 0 (0.0%) |
| 18 to 34 Years | 4 (4.8%) | 0 (0.0%) |
| 35 to 64 Years | 2 (1.1%) | 0 (0.0%) |
| 65 to 74 Years | 18 (13.2%) | 3 (5.4%) |
| 75 Years and over | 11 (68.8%) | 5 (26.3%) |
Disability Class: Vision Difficulty
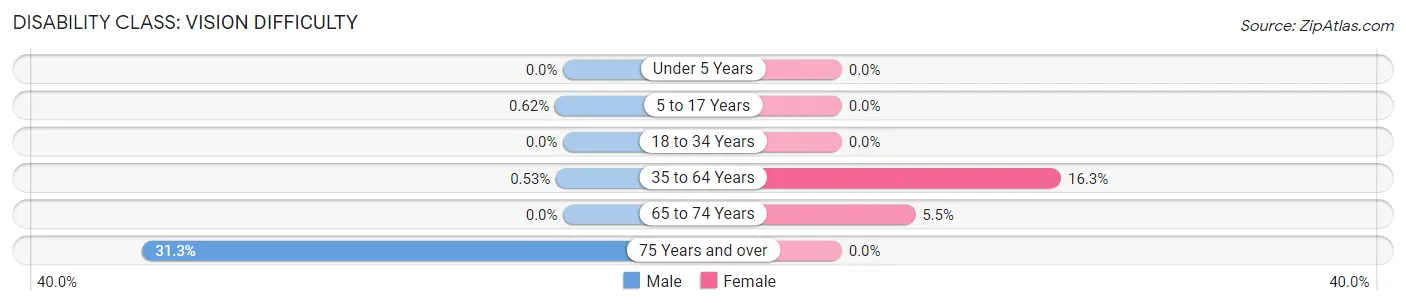
| Age Bracket | Male | Female |
| Under 5 Years | 0 (0.0%) | 0 (0.0%) |
| 5 to 17 Years | 1 (0.6%) | 0 (0.0%) |
| 18 to 34 Years | 0 (0.0%) | 0 (0.0%) |
| 35 to 64 Years | 1 (0.5%) | 28 (16.3%) |
| 65 to 74 Years | 0 (0.0%) | 3 (5.4%) |
| 75 Years and over | 5 (31.2%) | 0 (0.0%) |
Disability Class: Cognitive Difficulty
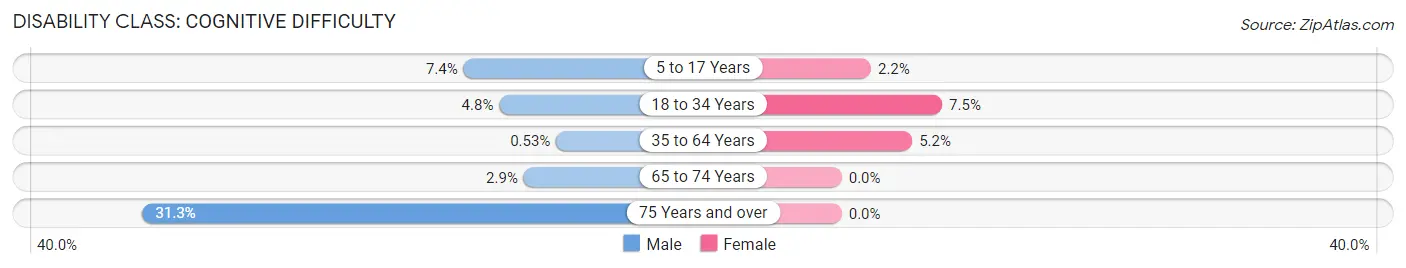
| Age Bracket | Male | Female |
| 5 to 17 Years | 12 (7.4%) | 3 (2.2%) |
| 18 to 34 Years | 4 (4.8%) | 12 (7.4%) |
| 35 to 64 Years | 1 (0.5%) | 9 (5.2%) |
| 65 to 74 Years | 4 (2.9%) | 0 (0.0%) |
| 75 Years and over | 5 (31.2%) | 0 (0.0%) |
Disability Class: Ambulatory Difficulty
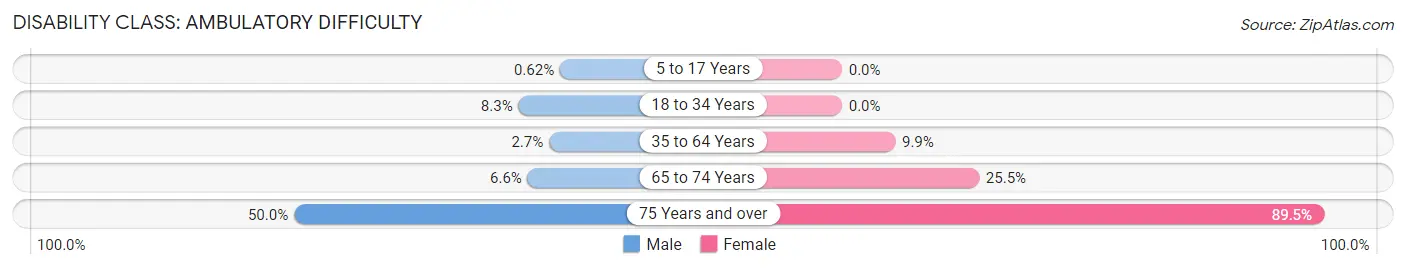
| Age Bracket | Male | Female |
| 5 to 17 Years | 1 (0.6%) | 0 (0.0%) |
| 18 to 34 Years | 7 (8.3%) | 0 (0.0%) |
| 35 to 64 Years | 5 (2.7%) | 17 (9.9%) |
| 65 to 74 Years | 9 (6.6%) | 14 (25.5%) |
| 75 Years and over | 8 (50.0%) | 17 (89.5%) |
Disability Class: Self-Care Difficulty
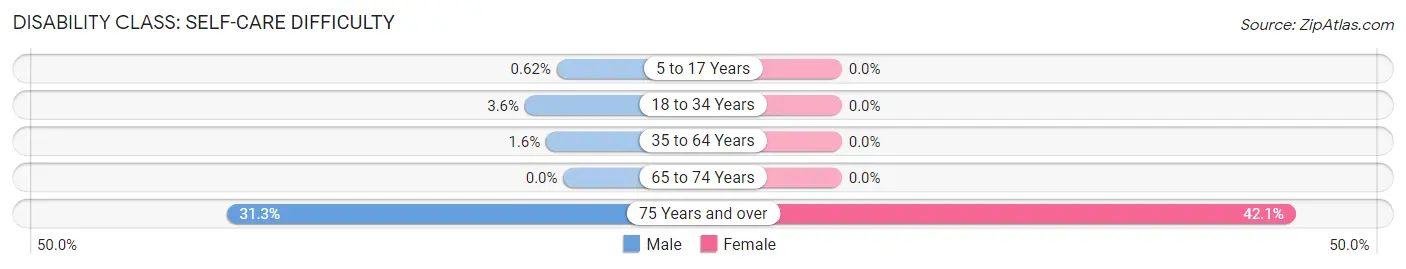
| Age Bracket | Male | Female |
| 5 to 17 Years | 1 (0.6%) | 0 (0.0%) |
| 18 to 34 Years | 3 (3.6%) | 0 (0.0%) |
| 35 to 64 Years | 3 (1.6%) | 0 (0.0%) |
| 65 to 74 Years | 0 (0.0%) | 0 (0.0%) |
| 75 Years and over | 5 (31.2%) | 8 (42.1%) |
Technology Access in Piedmont
Computing Device Access in Piedmont
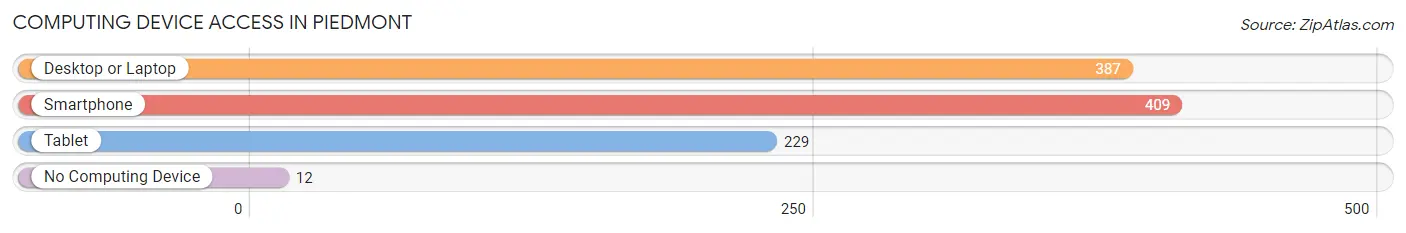
| Device Type | # Households | % Households |
| Desktop or Laptop | 387 | 85.1% |
| Smartphone | 409 | 89.9% |
| Tablet | 229 | 50.3% |
| No Computing Device | 12 | 2.6% |
| Total | 455 | 100.0% |
Internet Access in Piedmont
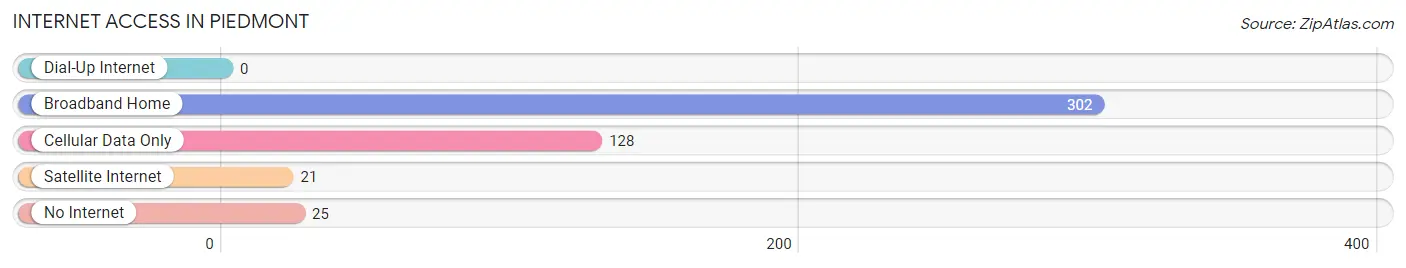
| Internet Type | # Households | % Households |
| Dial-Up Internet | 0 | 0.0% |
| Broadband Home | 302 | 66.4% |
| Cellular Data Only | 128 | 28.1% |
| Satellite Internet | 21 | 4.6% |
| No Internet | 25 | 5.5% |
| Total | 455 | 100.0% |
Piedmont Summary
Piedmont, South Dakota is a small town located in the Black Hills region of the state. It is situated in the southwestern corner of Pennington County, and is bordered by the towns of Rapid City, Keystone, and Hill City. The population of Piedmont was 1,845 in the 2010 census, making it the second-largest town in Pennington County.
History
Piedmont was founded in 1876 by a group of miners who were searching for gold in the Black Hills. The town was named after the French word for “high mountain”, and was originally known as “Piedmont City”. The town quickly grew, and by 1880 it had a population of over 500.
In the late 19th century, Piedmont was a bustling mining town, with several gold mines in operation. The town also had a number of saloons, hotels, and other businesses. In the early 20th century, the mining industry began to decline, and the town’s population began to dwindle.
In the 1950s, Piedmont began to experience a resurgence in population and economic activity. The town was home to a number of businesses, including a lumber mill, a sawmill, and a dairy. In the 1960s, the town was incorporated, and the population continued to grow.
Geography
Piedmont is located in the Black Hills region of South Dakota. The town is situated in the southwestern corner of Pennington County, and is bordered by the towns of Rapid City, Keystone, and Hill City. The town is situated at an elevation of 4,890 feet, and is surrounded by the Black Hills National Forest.
The town is located in the Black Hills region of South Dakota, which is known for its rugged terrain and beautiful scenery. The area is home to a variety of wildlife, including deer, elk, bighorn sheep, and mountain lions.
Economy
The economy of Piedmont is largely based on tourism and agriculture. The town is home to a number of tourist attractions, including the Black Hills National Forest, Mount Rushmore National Memorial, and the Crazy Horse Memorial. The town is also home to a number of agricultural businesses, including cattle ranches, hay farms, and fruit orchards.
The town is also home to a number of businesses, including a lumber mill, a sawmill, and a dairy. In addition, the town is home to a number of retail stores, restaurants, and other businesses.
Demographics
As of the 2010 census, the population of Piedmont was 1,845. The racial makeup of the town was 94.3% White, 0.7% African American, 0.3% Native American, 0.2% Asian, 0.1% Pacific Islander, 0.2% from other races, and 4.2% from two or more races. Hispanic or Latino of any race were 1.2% of the population.
The median income for a household in Piedmont was $41,250, and the median income for a family was $50,000. The per capita income for the town was $20,845. About 8.3% of families and 10.7% of the population were below the poverty line, including 14.3% of those under age 18 and 6.3% of those age 65 or over.
Common Questions
What is Per Capita Income in Piedmont?
Per Capita income in Piedmont is $28,090.
What is the Median Family Income in Piedmont?
Median Family Income in Piedmont is $57,014.
What is the Median Household income in Piedmont?
Median Household Income in Piedmont is $51,767.
What is Income or Wage Gap in Piedmont?
Income or Wage Gap in Piedmont is 22.7%.
Women in Piedmont earn 77.3 cents for every dollar earned by a man.
What is Inequality or Gini Index in Piedmont?
Inequality or Gini Index in Piedmont is 0.39.
What is the Total Population of Piedmont?
Total Population of Piedmont is 1,198.
What is the Total Male Population of Piedmont?
Total Male Population of Piedmont is 603.
What is the Total Female Population of Piedmont?
Total Female Population of Piedmont is 595.
What is the Ratio of Males per 100 Females in Piedmont?
There are 101.34 Males per 100 Females in Piedmont.
What is the Ratio of Females per 100 Males in Piedmont?
There are 98.67 Females per 100 Males in Piedmont.
What is the Median Population Age in Piedmont?
Median Population Age in Piedmont is 33.8 Years.
What is the Average Family Size in Piedmont
Average Family Size in Piedmont is 3.2 People.
What is the Average Household Size in Piedmont
Average Household Size in Piedmont is 2.6 People.
How Large is the Labor Force in Piedmont?
There are 562 People in the Labor Forcein in Piedmont.
What is the Percentage of People in the Labor Force in Piedmont?
65.0% of People are in the Labor Force in Piedmont.
What is the Unemployment Rate in Piedmont?
Unemployment Rate in Piedmont is 0.5%.