Lebanon, SD Map & Demographics
Lebanon Map
Lebanon Overview
$32,838
PER CAPITA INCOME
$48,750
AVG FAMILY INCOME
$58,750
AVG HOUSEHOLD INCOME
79.5%
WAGE / INCOME GAP [ % ]
20.5¢/ $1
WAGE / INCOME GAP [ $ ]
0.51
INEQUALITY / GINI INDEX
78
TOTAL POPULATION
24
MALE POPULATION
54
FEMALE POPULATION
44.44
MALES / 100 FEMALES
225.00
FEMALES / 100 MALES
29.8
MEDIAN AGE
3.4
AVG FAMILY SIZE
3.2
AVG HOUSEHOLD SIZE
47
LABOR FORCE [ PEOPLE ]
85.5%
PERCENT IN LABOR FORCE
Lebanon Zip Codes
Lebanon Area Codes
Income in Lebanon
Income Overview in Lebanon
Per Capita Income in Lebanon is $32,838, while median incomes of families and households are $48,750 and $58,750 respectively.
| Characteristic | Number | Measure |
| Per Capita Income | 78 | $32,838 |
| Median Family Income | 18 | $48,750 |
| Mean Family Income | 18 | $107,000 |
| Median Household Income | 24 | $58,750 |
| Mean Household Income | 24 | $100,183 |
| Income Deficit | 18 | $0 |
| Wage / Income Gap (%) | 78 | 79.50% |
| Wage / Income Gap ($) | 78 | 20.50¢ per $1 |
| Gini / Inequality Index | 78 | 0.51 |
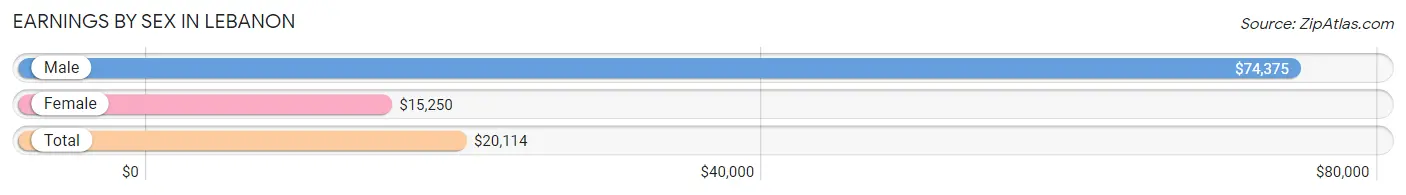
Earnings by Sex in Lebanon
Average Earnings in Lebanon are $20,114, $74,375 for men and $15,250 for women, a difference of 79.5%.
| Sex | Number | Average Earnings |
| Male | 10 (21.3%) | $74,375 |
| Female | 37 (78.7%) | $15,250 |
| Total | 47 (100.0%) | $20,114 |
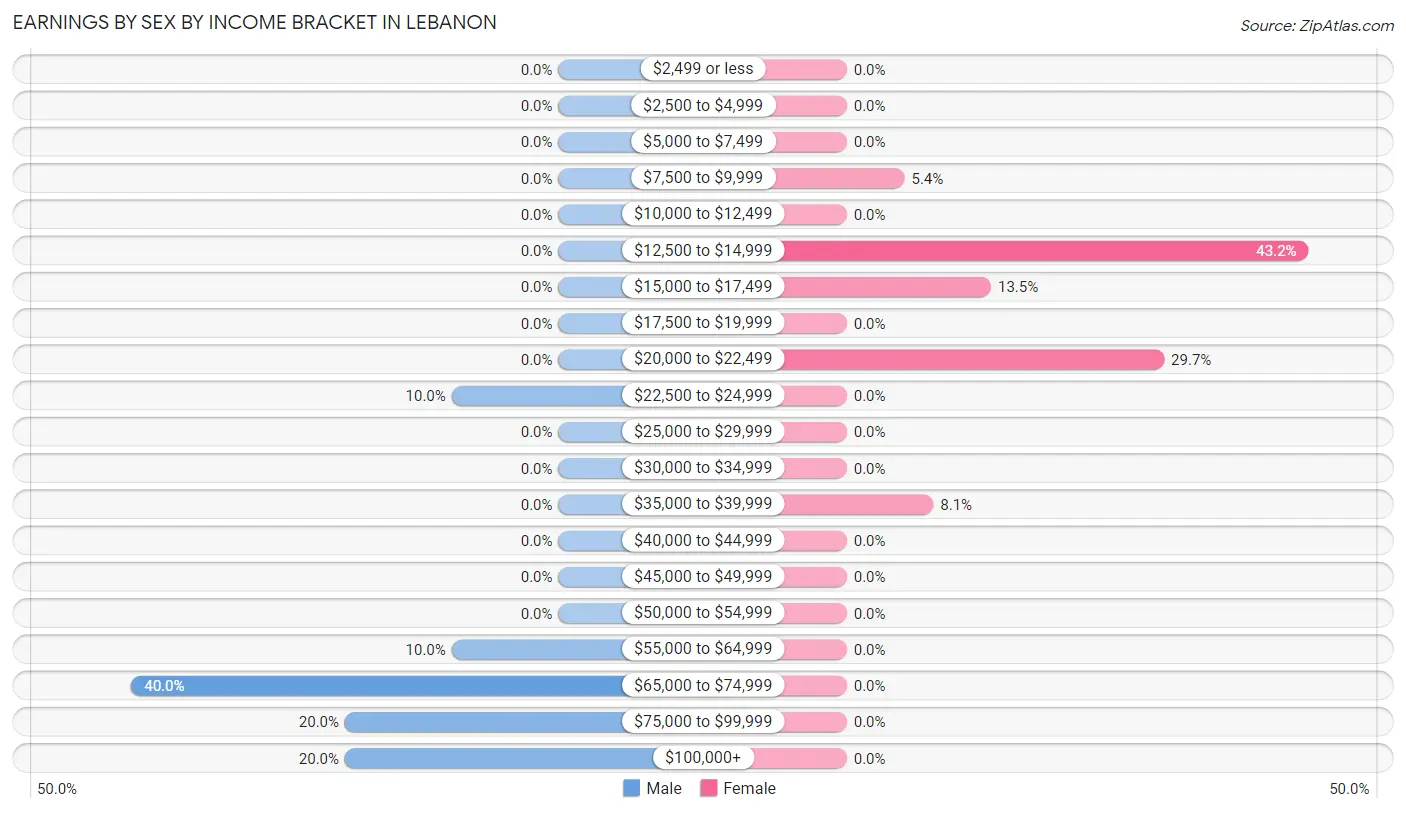
Earnings by Sex by Income Bracket in Lebanon
The most common earnings brackets in Lebanon are $65,000 to $74,999 for men (4 | 40.0%) and $12,500 to $14,999 for women (16 | 43.2%).
| Income | Male | Female |
| $2,499 or less | 0 (0.0%) | 0 (0.0%) |
| $2,500 to $4,999 | 0 (0.0%) | 0 (0.0%) |
| $5,000 to $7,499 | 0 (0.0%) | 0 (0.0%) |
| $7,500 to $9,999 | 0 (0.0%) | 2 (5.4%) |
| $10,000 to $12,499 | 0 (0.0%) | 0 (0.0%) |
| $12,500 to $14,999 | 0 (0.0%) | 16 (43.2%) |
| $15,000 to $17,499 | 0 (0.0%) | 5 (13.5%) |
| $17,500 to $19,999 | 0 (0.0%) | 0 (0.0%) |
| $20,000 to $22,499 | 0 (0.0%) | 11 (29.7%) |
| $22,500 to $24,999 | 1 (10.0%) | 0 (0.0%) |
| $25,000 to $29,999 | 0 (0.0%) | 0 (0.0%) |
| $30,000 to $34,999 | 0 (0.0%) | 0 (0.0%) |
| $35,000 to $39,999 | 0 (0.0%) | 3 (8.1%) |
| $40,000 to $44,999 | 0 (0.0%) | 0 (0.0%) |
| $45,000 to $49,999 | 0 (0.0%) | 0 (0.0%) |
| $50,000 to $54,999 | 0 (0.0%) | 0 (0.0%) |
| $55,000 to $64,999 | 1 (10.0%) | 0 (0.0%) |
| $65,000 to $74,999 | 4 (40.0%) | 0 (0.0%) |
| $75,000 to $99,999 | 2 (20.0%) | 0 (0.0%) |
| $100,000+ | 2 (20.0%) | 0 (0.0%) |
| Total | 10 (100.0%) | 37 (100.0%) |
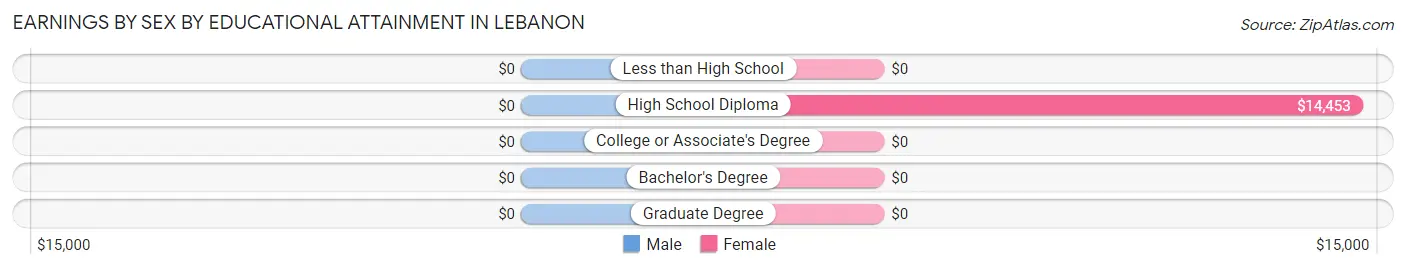
Earnings by Sex by Educational Attainment in Lebanon
| Educational Attainment | Male Income | Female Income |
| Less than High School | - | - |
| High School Diploma | - | - |
| College or Associate's Degree | - | - |
| Bachelor's Degree | - | - |
| Graduate Degree | - | - |
| Total | $74,375 | $15,250 |
Family Income in Lebanon
Family Income Brackets in Lebanon
According to the Lebanon family income data, there are 7 families falling into the $25,000 to $34,999 income range, which is the most common income bracket and makes up 38.9% of all families.
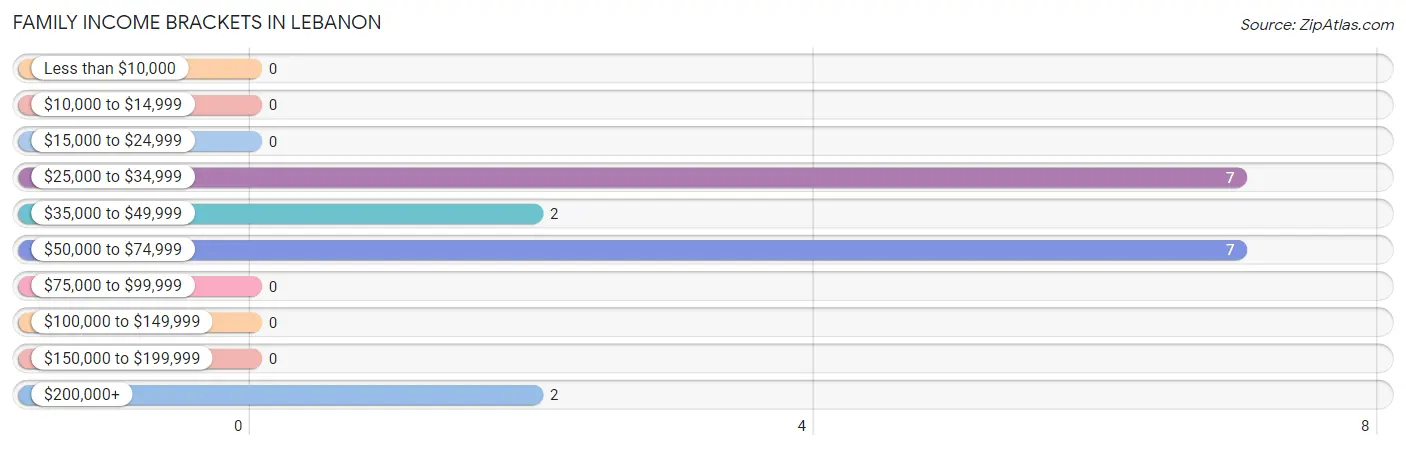
| Income Bracket | # Families | % Families |
| Less than $10,000 | 0 | 0.0% |
| $10,000 to $14,999 | 0 | 0.0% |
| $15,000 to $24,999 | 0 | 0.0% |
| $25,000 to $34,999 | 7 | 38.9% |
| $35,000 to $49,999 | 2 | 11.1% |
| $50,000 to $74,999 | 7 | 38.9% |
| $75,000 to $99,999 | 0 | 0.0% |
| $100,000 to $149,999 | 0 | 0.0% |
| $150,000 to $199,999 | 0 | 0.0% |
| $200,000+ | 2 | 11.1% |
Family Income by Famaliy Size in Lebanon
2-person families (9 | 50.0%) account for the highest median family income in Lebanon with $73,438 per family, while 2-person families (9 | 50.0%) have the highest median income of $36,719 per family member.
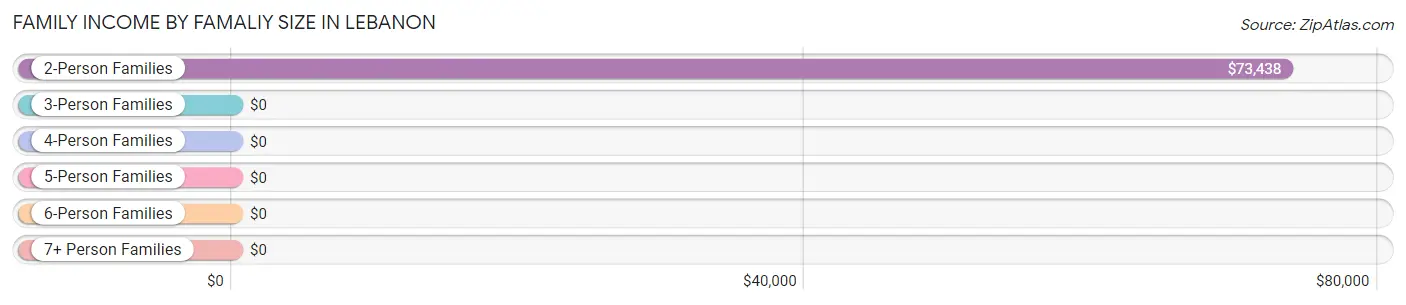
| Income Bracket | # Families | Median Income |
| 2-Person Families | 9 (50.0%) | $73,438 |
| 3-Person Families | 9 (50.0%) | $0 |
| 4-Person Families | 0 (0.0%) | $0 |
| 5-Person Families | 0 (0.0%) | $0 |
| 6-Person Families | 0 (0.0%) | $0 |
| 7+ Person Families | 0 (0.0%) | $0 |
| Total | 18 (100.0%) | $48,750 |
Family Income by Number of Earners in Lebanon
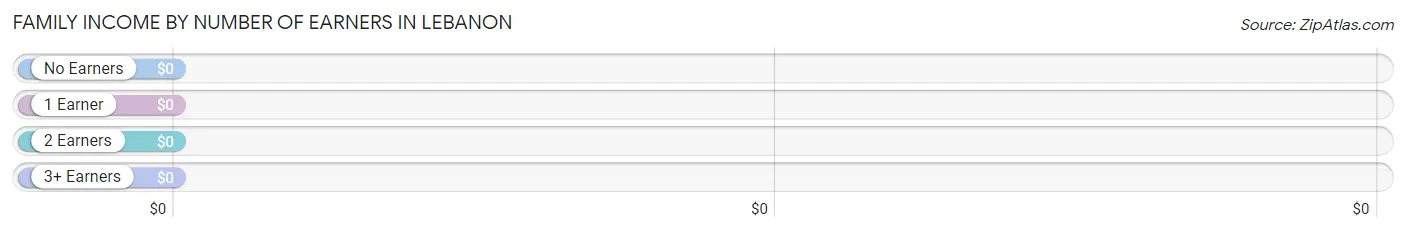
| Number of Earners | # Families | Median Income |
| No Earners | 2 (11.1%) | $0 |
| 1 Earner | 5 (27.8%) | $0 |
| 2 Earners | 11 (61.1%) | $0 |
| 3+ Earners | 0 (0.0%) | $0 |
| Total | 18 (100.0%) | $48,750 |
Household Income in Lebanon
Household Income Brackets in Lebanon
With 7 households falling in the category, the $25,000 to $34,999 income range is the most frequent in Lebanon, accounting for 29.2% of all households.
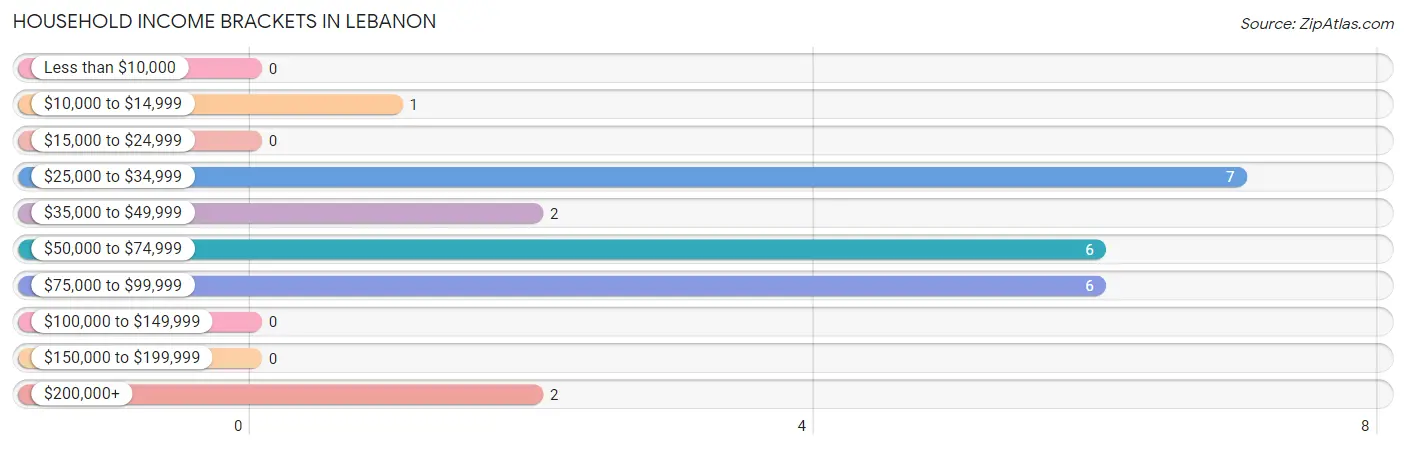
| Income Bracket | # Households | % Households |
| Less than $10,000 | 0 | 0.0% |
| $10,000 to $14,999 | 1 | 4.2% |
| $15,000 to $24,999 | 0 | 0.0% |
| $25,000 to $34,999 | 7 | 29.2% |
| $35,000 to $49,999 | 2 | 8.3% |
| $50,000 to $74,999 | 6 | 25.0% |
| $75,000 to $99,999 | 6 | 25.0% |
| $100,000 to $149,999 | 0 | 0.0% |
| $150,000 to $199,999 | 0 | 0.0% |
| $200,000+ | 2 | 8.3% |
Household Income by Householder Age in Lebanon
The median household income in Lebanon is $58,750, with the highest median household income of $58,125 found in the 45 to 64 years age bracket for the primary householder. A total of 14 households (58.3%) fall into this category.
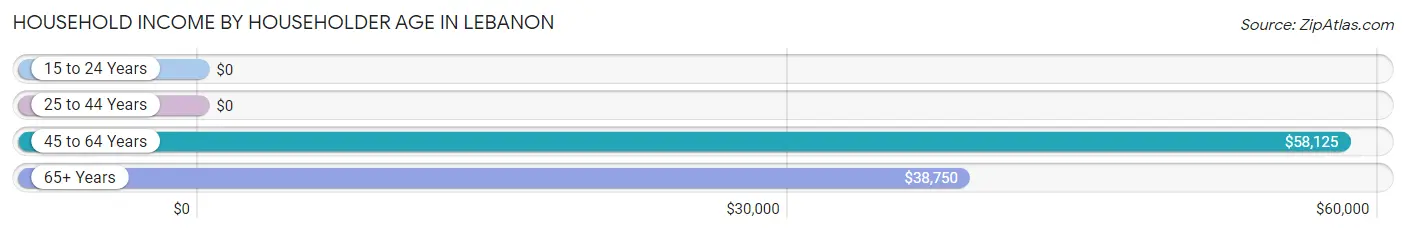
| Income Bracket | # Households | Median Income |
| 15 to 24 Years | 0 (0.0%) | $0 |
| 25 to 44 Years | 4 (16.7%) | $0 |
| 45 to 64 Years | 14 (58.3%) | $58,125 |
| 65+ Years | 6 (25.0%) | $38,750 |
| Total | 24 (100.0%) | $58,750 |
Poverty in Lebanon
Income Below Poverty by Sex and Age in Lebanon
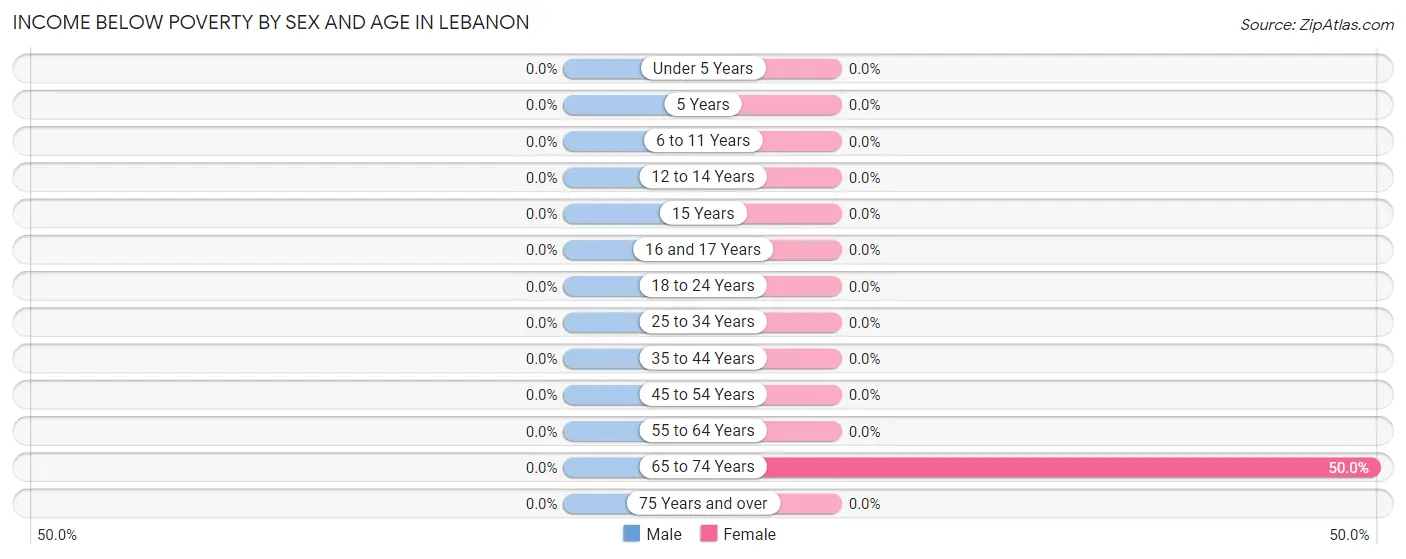
| Age Bracket | Male | Female |
| Under 5 Years | 0 (0.0%) | 0 (0.0%) |
| 5 Years | 0 (0.0%) | 0 (0.0%) |
| 6 to 11 Years | 0 (0.0%) | 0 (0.0%) |
| 12 to 14 Years | 0 (0.0%) | 0 (0.0%) |
| 15 Years | 0 (0.0%) | 0 (0.0%) |
| 16 and 17 Years | 0 (0.0%) | 0 (0.0%) |
| 18 to 24 Years | 0 (0.0%) | 0 (0.0%) |
| 25 to 34 Years | 0 (0.0%) | 0 (0.0%) |
| 35 to 44 Years | 0 (0.0%) | 0 (0.0%) |
| 45 to 54 Years | 0 (0.0%) | 0 (0.0%) |
| 55 to 64 Years | 0 (0.0%) | 0 (0.0%) |
| 65 to 74 Years | 0 (0.0%) | 1 (50.0%) |
| 75 Years and over | 0 (0.0%) | 0 (0.0%) |
| Total | 0 (0.0%) | 1 (2.0%) |
Income Above Poverty by Sex and Age in Lebanon
According to the poverty statistics in Lebanon, males aged 6 to 11 years and females aged under 5 years are the age groups that are most secure financially, with 100.0% of males and 100.0% of females in these age groups living above the poverty line.
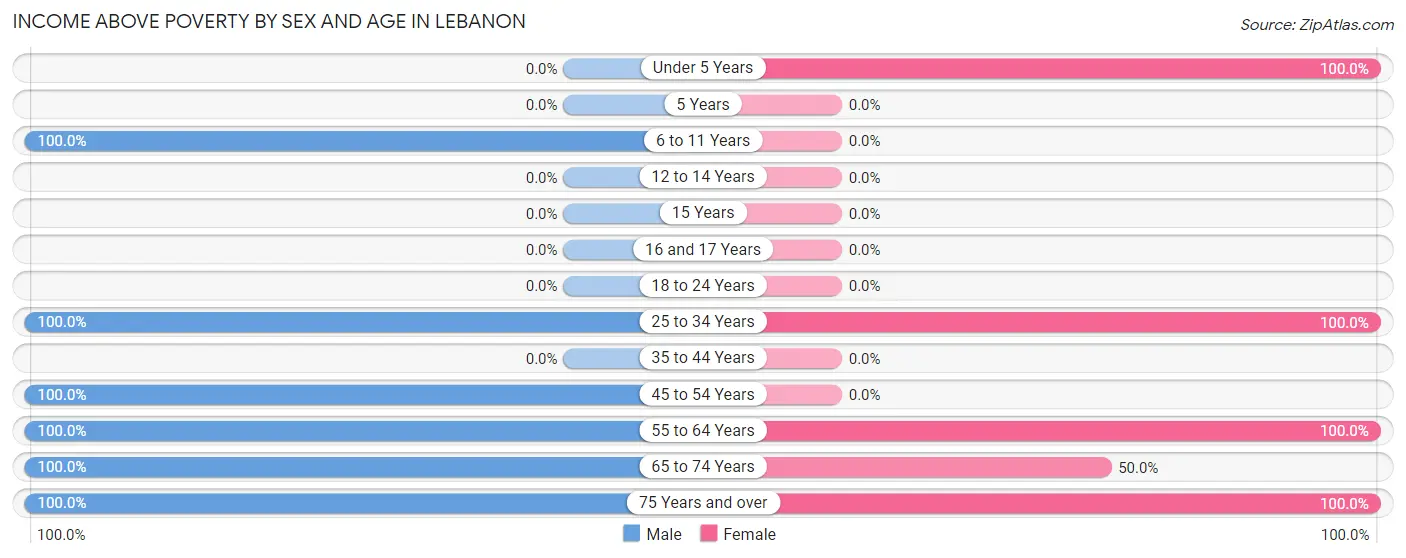
| Age Bracket | Male | Female |
| Under 5 Years | 0 (0.0%) | 10 (100.0%) |
| 5 Years | 0 (0.0%) | 0 (0.0%) |
| 6 to 11 Years | 10 (100.0%) | 0 (0.0%) |
| 12 to 14 Years | 0 (0.0%) | 0 (0.0%) |
| 15 Years | 0 (0.0%) | 0 (0.0%) |
| 16 and 17 Years | 0 (0.0%) | 0 (0.0%) |
| 18 to 24 Years | 0 (0.0%) | 0 (0.0%) |
| 25 to 34 Years | 4 (100.0%) | 24 (100.0%) |
| 35 to 44 Years | 0 (0.0%) | 0 (0.0%) |
| 45 to 54 Years | 1 (100.0%) | 0 (0.0%) |
| 55 to 64 Years | 4 (100.0%) | 11 (100.0%) |
| 65 to 74 Years | 3 (100.0%) | 1 (50.0%) |
| 75 Years and over | 2 (100.0%) | 4 (100.0%) |
| Total | 24 (100.0%) | 50 (98.0%) |
Income Below Poverty Among Married-Couple Families in Lebanon
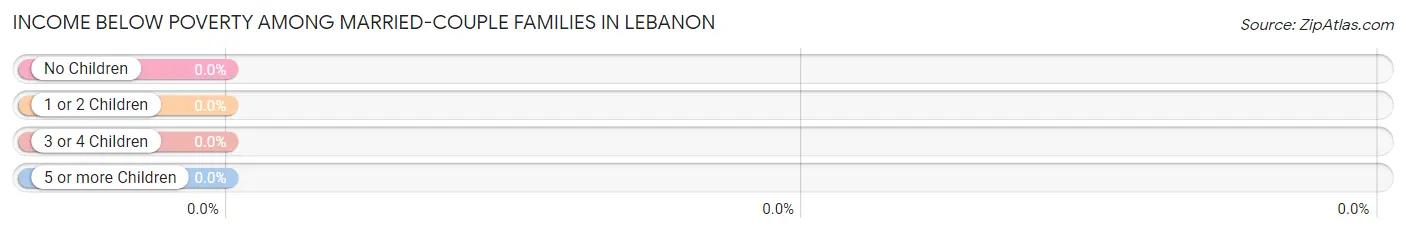
| Children | Above Poverty | Below Poverty |
| No Children | 5 (100.0%) | 0 (0.0%) |
| 1 or 2 Children | 0 (0.0%) | 0 (0.0%) |
| 3 or 4 Children | 0 (0.0%) | 0 (0.0%) |
| 5 or more Children | 0 (0.0%) | 0 (0.0%) |
| Total | 5 (100.0%) | 0 (0.0%) |
Income Below Poverty Among Single-Parent Households in Lebanon
| Children | Single Father | Single Mother |
| No Children | 0 (0.0%) | 0 (0.0%) |
| 1 or 2 Children | 0 (0.0%) | 0 (0.0%) |
| 3 or 4 Children | 0 (0.0%) | 0 (0.0%) |
| 5 or more Children | 0 (0.0%) | 0 (0.0%) |
| Total | 0 (0.0%) | 0 (0.0%) |
Income Below Poverty Among Married-Couple vs Single-Parent Households in Lebanon
| Children | Married-Couple Families | Single-Parent Households |
| No Children | 0 (0.0%) | 0 (0.0%) |
| 1 or 2 Children | 0 (0.0%) | 0 (0.0%) |
| 3 or 4 Children | 0 (0.0%) | 0 (0.0%) |
| 5 or more Children | 0 (0.0%) | 0 (0.0%) |
| Total | 0 (0.0%) | 0 (0.0%) |
Race in Lebanon
The most populous races in Lebanon are , and White / Caucasian (78 | 100.0%).
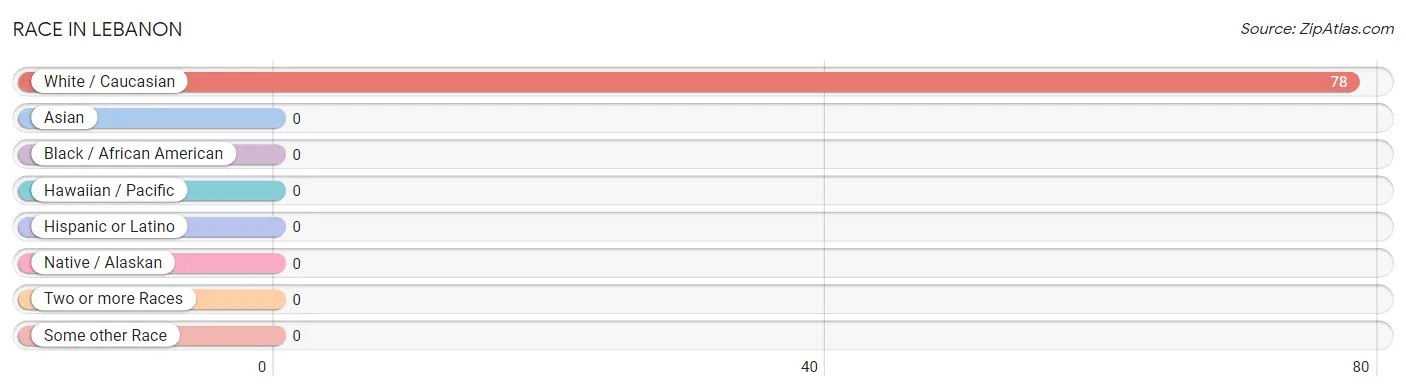
| Race | # Population | % Population |
| Asian | 0 | 0.0% |
| Black / African American | 0 | 0.0% |
| Hawaiian / Pacific | 0 | 0.0% |
| Hispanic or Latino | 0 | 0.0% |
| Native / Alaskan | 0 | 0.0% |
| White / Caucasian | 78 | 100.0% |
| Two or more Races | 0 | 0.0% |
| Some other Race | 0 | 0.0% |
| Total | 78 | 100.0% |
Ancestry in Lebanon
The most populous ancestries reported in Lebanon are Dutch (8 | 10.3%), American (4 | 5.1%), Norwegian (4 | 5.1%), French (2 | 2.6%), and French Canadian (2 | 2.6%), together accounting for 25.6% of all Lebanon residents.
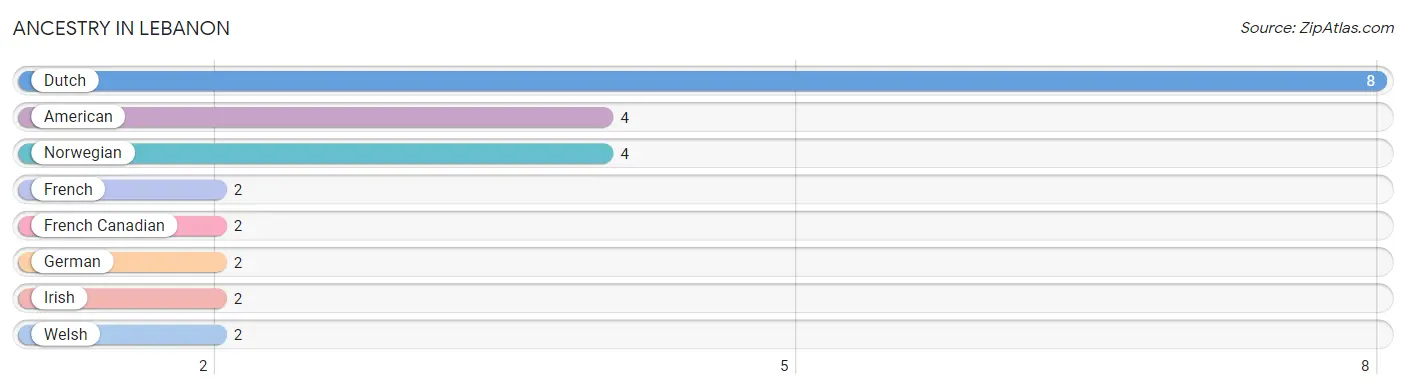
| Ancestry | # Population | % Population |
| American | 4 | 5.1% |
| Dutch | 8 | 10.3% |
| French | 2 | 2.6% |
| French Canadian | 2 | 2.6% |
| German | 2 | 2.6% |
| Irish | 2 | 2.6% |
| Norwegian | 4 | 5.1% |
| Welsh | 2 | 2.6% | View All 8 Rows |
Immigrants in Lebanon

| Immigration Origin | # Population | % Population | View All 0 Rows |
Sex and Age in Lebanon
Sex and Age in Lebanon
The most populous age groups in Lebanon are 5 to 9 Years (10 | 41.7%) for men and 25 to 29 Years (16 | 29.6%) for women.
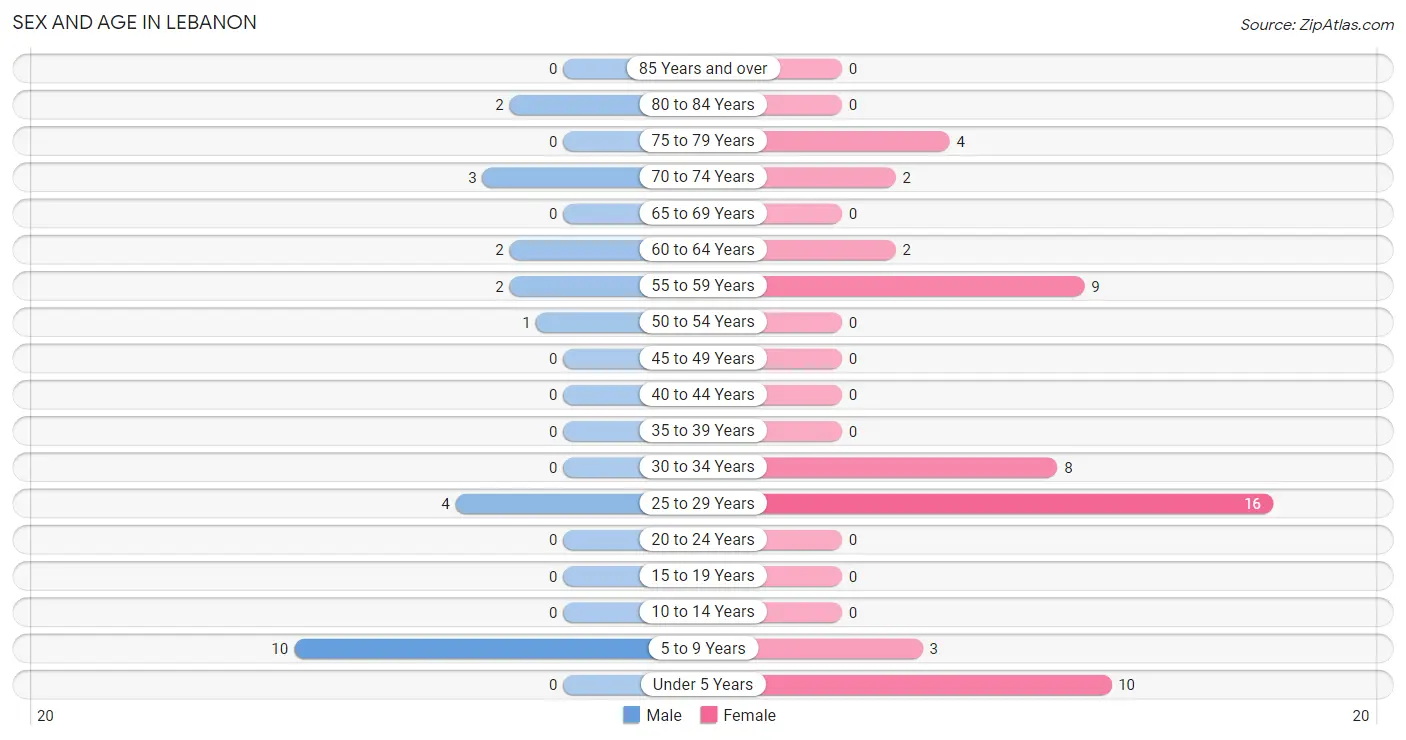
| Age Bracket | Male | Female |
| Under 5 Years | 0 (0.0%) | 10 (18.5%) |
| 5 to 9 Years | 10 (41.7%) | 3 (5.6%) |
| 10 to 14 Years | 0 (0.0%) | 0 (0.0%) |
| 15 to 19 Years | 0 (0.0%) | 0 (0.0%) |
| 20 to 24 Years | 0 (0.0%) | 0 (0.0%) |
| 25 to 29 Years | 4 (16.7%) | 16 (29.6%) |
| 30 to 34 Years | 0 (0.0%) | 8 (14.8%) |
| 35 to 39 Years | 0 (0.0%) | 0 (0.0%) |
| 40 to 44 Years | 0 (0.0%) | 0 (0.0%) |
| 45 to 49 Years | 0 (0.0%) | 0 (0.0%) |
| 50 to 54 Years | 1 (4.2%) | 0 (0.0%) |
| 55 to 59 Years | 2 (8.3%) | 9 (16.7%) |
| 60 to 64 Years | 2 (8.3%) | 2 (3.7%) |
| 65 to 69 Years | 0 (0.0%) | 0 (0.0%) |
| 70 to 74 Years | 3 (12.5%) | 2 (3.7%) |
| 75 to 79 Years | 0 (0.0%) | 4 (7.4%) |
| 80 to 84 Years | 2 (8.3%) | 0 (0.0%) |
| 85 Years and over | 0 (0.0%) | 0 (0.0%) |
| Total | 24 (100.0%) | 54 (100.0%) |
Families and Households in Lebanon
Median Family Size in Lebanon
The median family size in Lebanon is 3.44 persons per family, with single female/mother families (9 | 50.0%) accounting for the largest median family size of 4.22 persons per family. On the other hand, married-couple families (5 | 27.8%) represent the smallest median family size with 2.00 persons per family.
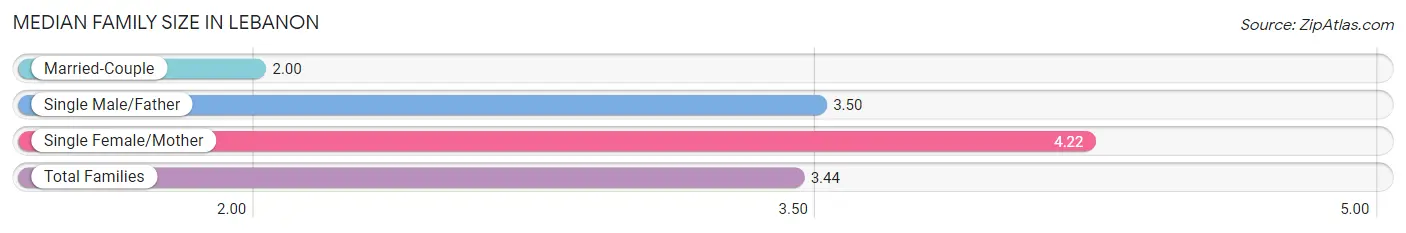
| Family Type | # Families | Family Size |
| Married-Couple | 5 (27.8%) | 2.00 |
| Single Male/Father | 4 (22.2%) | 3.50 |
| Single Female/Mother | 9 (50.0%) | 4.22 |
| Total Families | 18 (100.0%) | 3.44 |
Median Household Size in Lebanon
The median household size in Lebanon is 3.25 persons per household, with single male/father households (4 | 16.7%) accounting for the largest median household size of 5.5 persons per household. non-family households (6 | 25.0%) represent the smallest median household size with 1.33 persons per household.
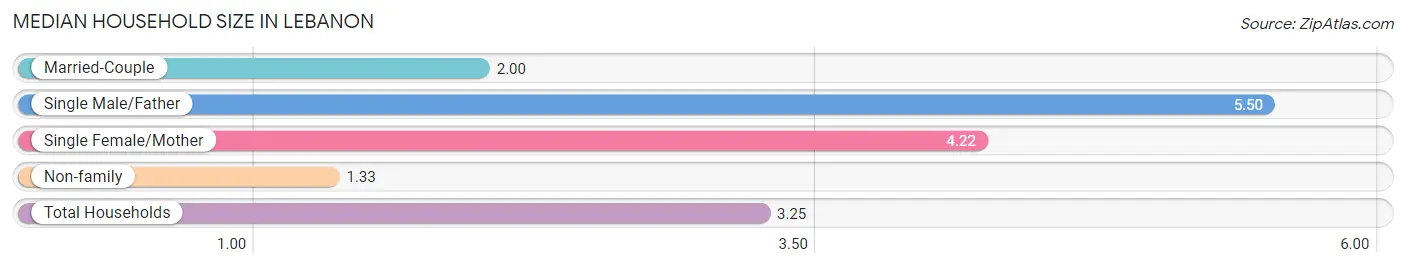
| Household Type | # Households | Household Size |
| Married-Couple | 5 (20.8%) | 2.00 |
| Single Male/Father | 4 (16.7%) | 5.50 |
| Single Female/Mother | 9 (37.5%) | 4.22 |
| Non-family | 6 (25.0%) | 1.33 |
| Total Households | 24 (100.0%) | 3.25 |
Household Size by Marriage Status in Lebanon
Out of a total of 24 households in Lebanon, 18 (75.0%) are family households, while 6 (25.0%) are nonfamily households. The most numerous type of family households are 3-person households, comprising 9, and the most common type of nonfamily households are 1-person households, comprising 4.
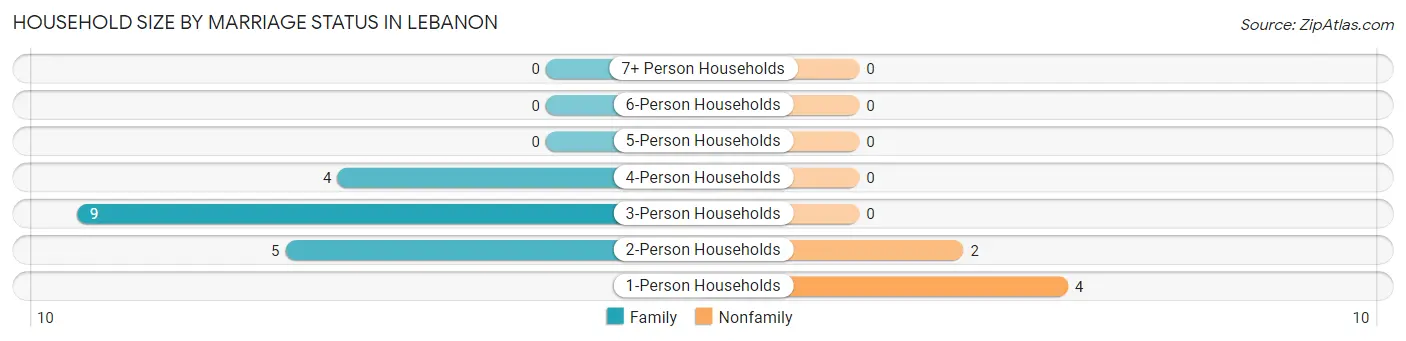
| Household Size | Family Households | Nonfamily Households |
| 1-Person Households | - | 4 (16.7%) |
| 2-Person Households | 5 (20.8%) | 2 (8.3%) |
| 3-Person Households | 9 (37.5%) | 0 (0.0%) |
| 4-Person Households | 4 (16.7%) | 0 (0.0%) |
| 5-Person Households | 0 (0.0%) | 0 (0.0%) |
| 6-Person Households | 0 (0.0%) | 0 (0.0%) |
| 7+ Person Households | 0 (0.0%) | 0 (0.0%) |
| Total | 18 (75.0%) | 6 (25.0%) |
Female Fertility in Lebanon
Fertility by Age in Lebanon
Average fertility rate in Lebanon is 208.0 births per 1,000 women. Women in the age bracket of 20 to 34 years have the highest fertility rate with 208.0 births per 1,000 women. Women in the age bracket of 20 to 34 years acount for 100.0% of all women with births.
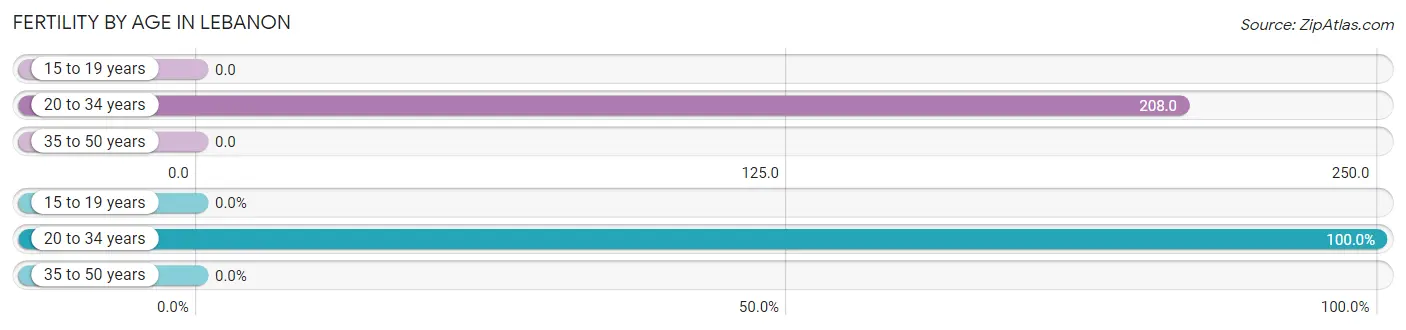
| Age Bracket | Women with Births | Births / 1,000 Women |
| 15 to 19 years | 0 (0.0%) | 0.0 |
| 20 to 34 years | 5 (100.0%) | 208.0 |
| 35 to 50 years | 0 (0.0%) | 0.0 |
| Total | 5 (100.0%) | 208.0 |
Fertility by Age by Marriage Status in Lebanon
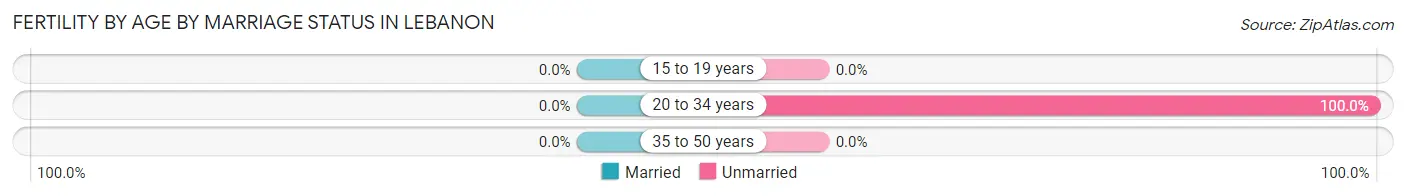
| Age Bracket | Married | Unmarried |
| 15 to 19 years | 0 (0.0%) | 0 (0.0%) |
| 20 to 34 years | 0 (0.0%) | 5 (100.0%) |
| 35 to 50 years | 0 (0.0%) | 0 (0.0%) |
| Total | 0 (0.0%) | 5 (100.0%) |
Fertility by Education in Lebanon
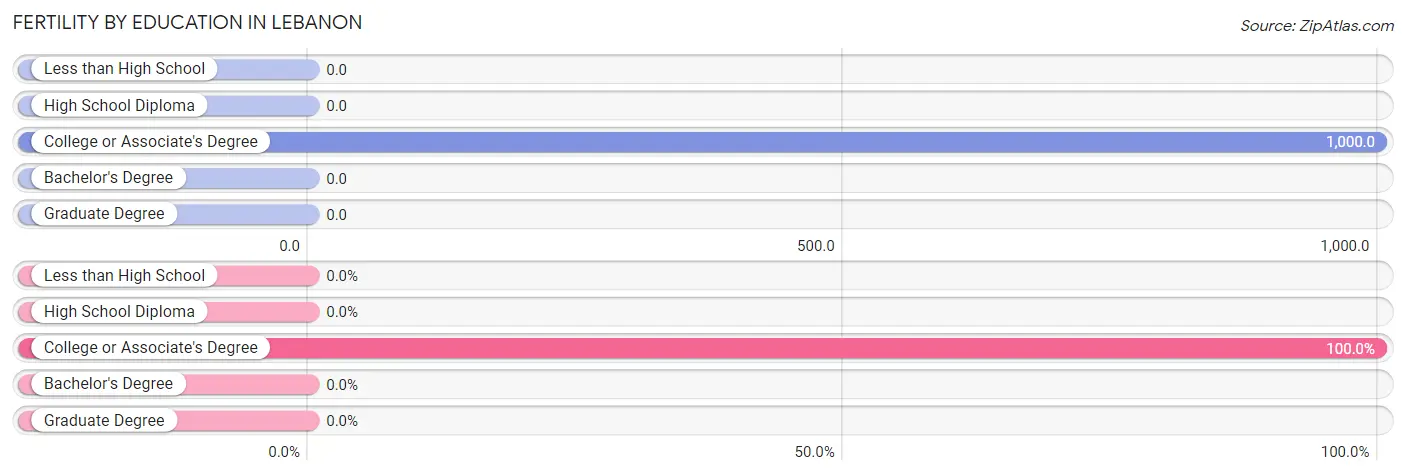
| Educational Attainment | Women with Births | Births / 1,000 Women |
| Less than High School | 0 (0.0%) | 0.0 |
| High School Diploma | 0 (0.0%) | 0.0 |
| College or Associate's Degree | 5 (100.0%) | 1,000.0 |
| Bachelor's Degree | 0 (0.0%) | 0.0 |
| Graduate Degree | 0 (0.0%) | 0.0 |
| Total | 5 (100.0%) | 208.0 |
Fertility by Education by Marriage Status in Lebanon
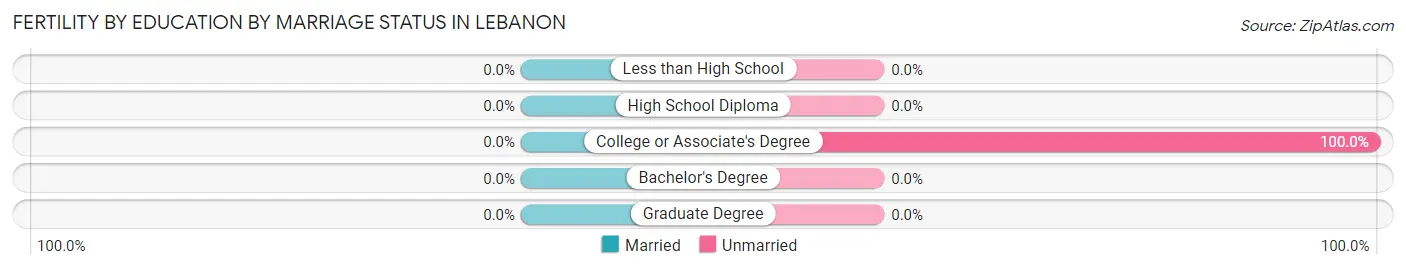
| Educational Attainment | Married | Unmarried |
| Less than High School | 0 (0.0%) | 0 (0.0%) |
| High School Diploma | 0 (0.0%) | 0 (0.0%) |
| College or Associate's Degree | 0 (0.0%) | 5 (100.0%) |
| Bachelor's Degree | 0 (0.0%) | 0 (0.0%) |
| Graduate Degree | 0 (0.0%) | 0 (0.0%) |
| Total | 0 (0.0%) | 5 (100.0%) |
Employment Characteristics in Lebanon
Employment by Class of Employer in Lebanon
Among the 47 employed individuals in Lebanon, private company employees (32 | 68.1%), self-employed (incorporated) (7 | 14.9%), and self-employed (not incorporated) (4 | 8.5%) make up the most common classes of employment.
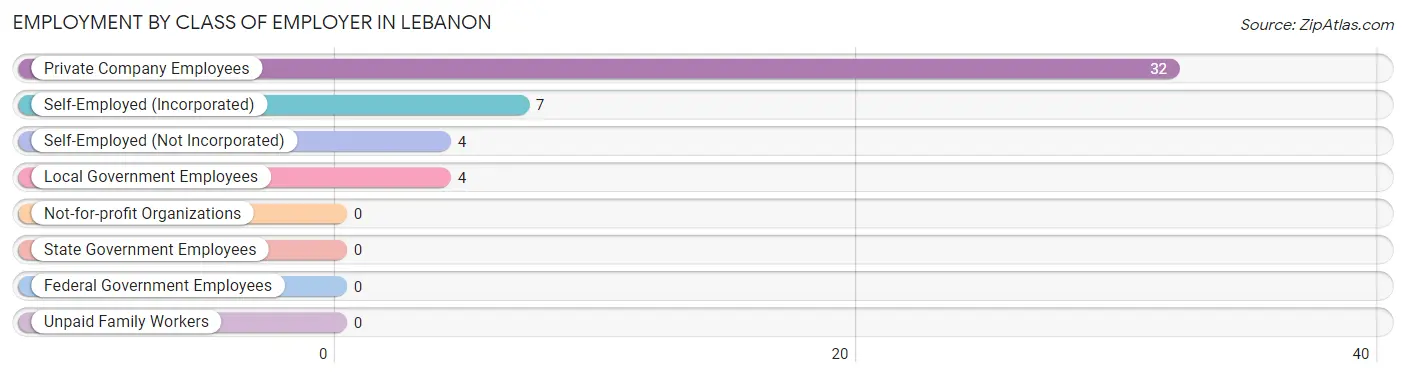
| Employer Class | # Employees | % Employees |
| Private Company Employees | 32 | 68.1% |
| Self-Employed (Incorporated) | 7 | 14.9% |
| Self-Employed (Not Incorporated) | 4 | 8.5% |
| Not-for-profit Organizations | 0 | 0.0% |
| Local Government Employees | 4 | 8.5% |
| State Government Employees | 0 | 0.0% |
| Federal Government Employees | 0 | 0.0% |
| Unpaid Family Workers | 0 | 0.0% |
| Total | 47 | 100.0% |
Employment Status by Age in Lebanon
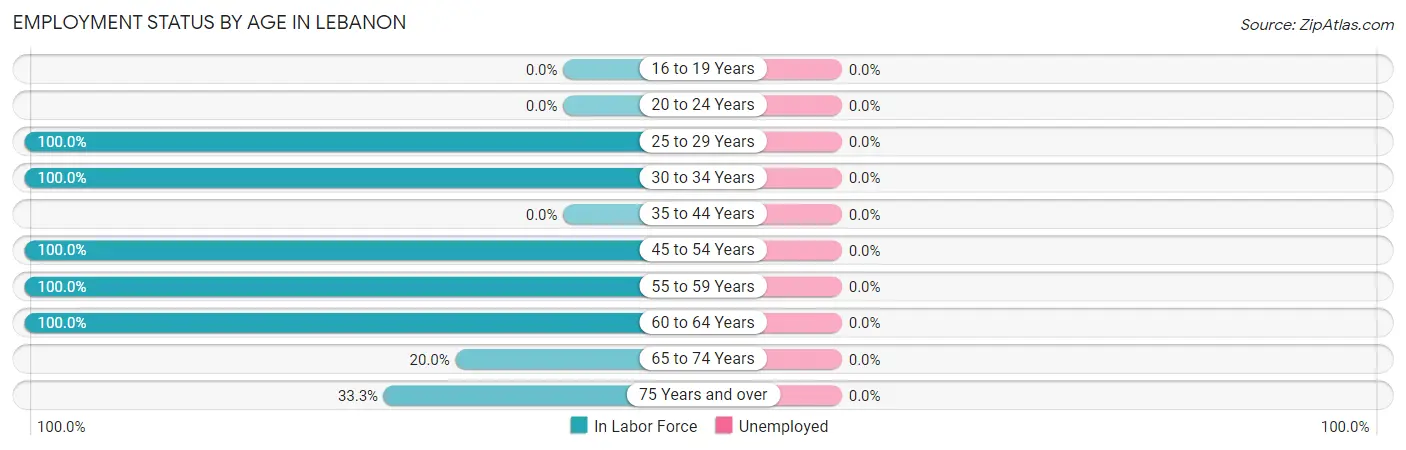
| Age Bracket | In Labor Force | Unemployed |
| 16 to 19 Years | 0 (0.0%) | 0 (0.0%) |
| 20 to 24 Years | 0 (0.0%) | 0 (0.0%) |
| 25 to 29 Years | 20 (100.0%) | 0 (0.0%) |
| 30 to 34 Years | 8 (100.0%) | 0 (0.0%) |
| 35 to 44 Years | 0 (0.0%) | 0 (0.0%) |
| 45 to 54 Years | 1 (100.0%) | 0 (0.0%) |
| 55 to 59 Years | 11 (100.0%) | 0 (0.0%) |
| 60 to 64 Years | 4 (100.0%) | 0 (0.0%) |
| 65 to 74 Years | 1 (20.0%) | 0 (0.0%) |
| 75 Years and over | 2 (33.3%) | 0 (0.0%) |
| Total | 47 (85.5%) | 0 (0.0%) |
Employment Status by Educational Attainment in Lebanon
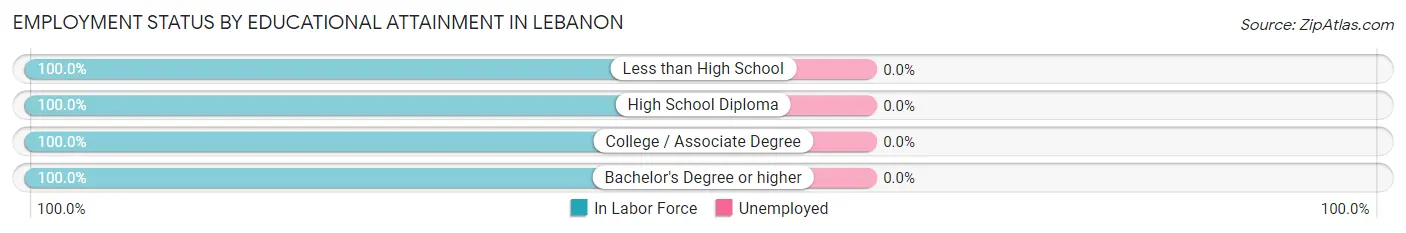
| Educational Attainment | In Labor Force | Unemployed |
| Less than High School | 3 (100.0%) | 0 (0.0%) |
| High School Diploma | 27 (100.0%) | 0 (0.0%) |
| College / Associate Degree | 13 (100.0%) | 0 (0.0%) |
| Bachelor's Degree or higher | 1 (100.0%) | 0 (0.0%) |
| Total | 44 (100.0%) | 0 (0.0%) |
Employment Occupations by Sex in Lebanon
Management, Business, Science and Arts Occupations
The most common Management, Business, Science and Arts occupations in Lebanon are Management (2 | 4.3%), Community & Social Service (1 | 2.1%), and Education Instruction & Library (1 | 2.1%).
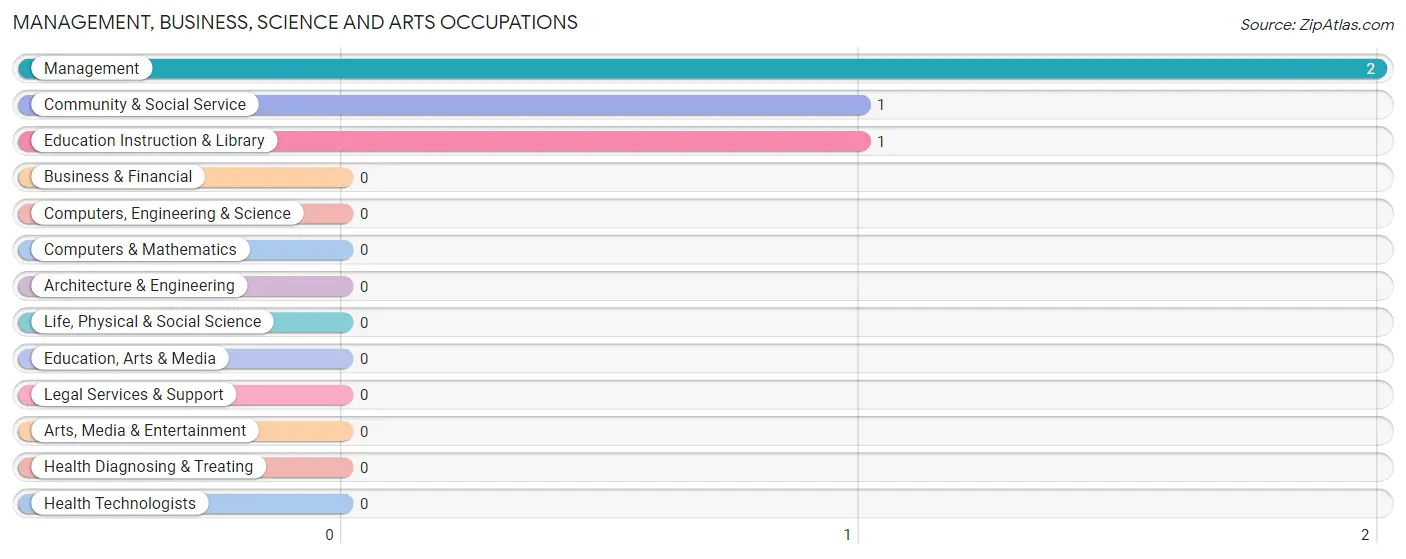
Management, Business, Science and Arts Occupations by Sex
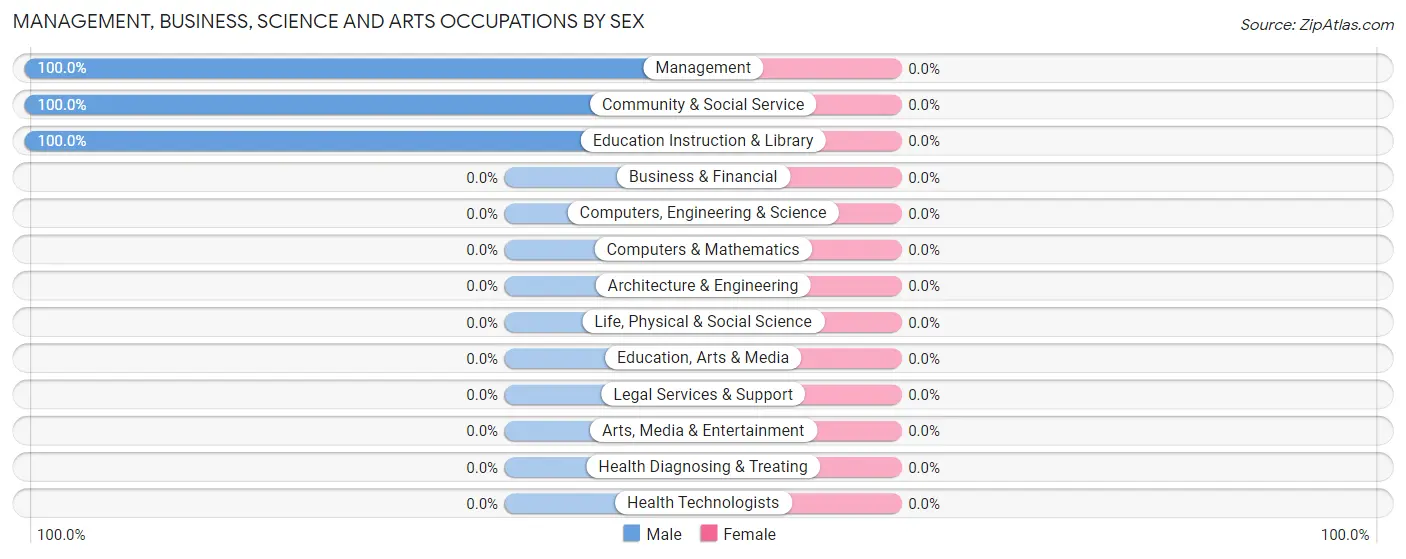
| Occupation | Male | Female |
| Management | 2 (100.0%) | 0 (0.0%) |
| Business & Financial | 0 (0.0%) | 0 (0.0%) |
| Computers, Engineering & Science | 0 (0.0%) | 0 (0.0%) |
| Computers & Mathematics | 0 (0.0%) | 0 (0.0%) |
| Architecture & Engineering | 0 (0.0%) | 0 (0.0%) |
| Life, Physical & Social Science | 0 (0.0%) | 0 (0.0%) |
| Community & Social Service | 1 (100.0%) | 0 (0.0%) |
| Education, Arts & Media | 0 (0.0%) | 0 (0.0%) |
| Legal Services & Support | 0 (0.0%) | 0 (0.0%) |
| Education Instruction & Library | 1 (100.0%) | 0 (0.0%) |
| Arts, Media & Entertainment | 0 (0.0%) | 0 (0.0%) |
| Health Diagnosing & Treating | 0 (0.0%) | 0 (0.0%) |
| Health Technologists | 0 (0.0%) | 0 (0.0%) |
| Total (Category) | 3 (100.0%) | 0 (0.0%) |
| Total (Overall) | 10 (21.3%) | 37 (78.7%) |
Services Occupations
The most common Services occupations in Lebanon are Food Preparation & Serving (28 | 59.6%), and Cleaning & Maintenance (7 | 14.9%).
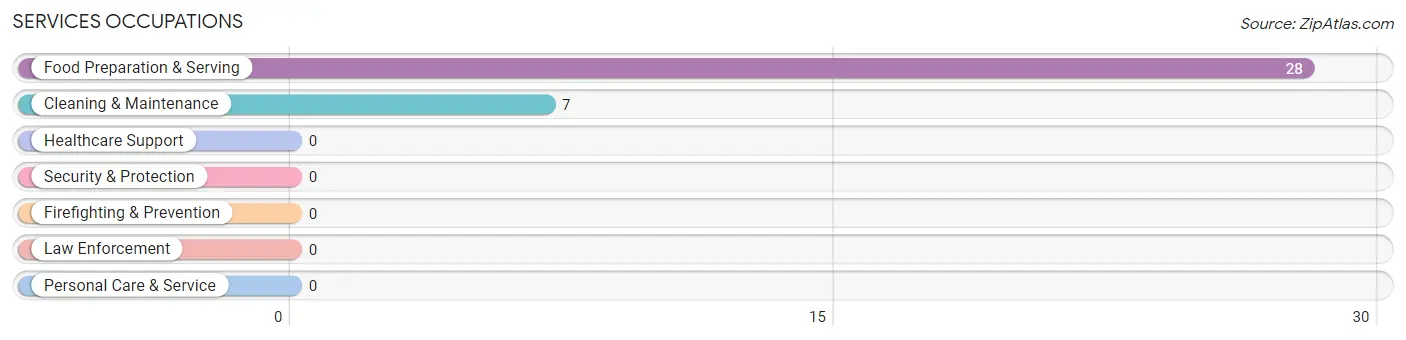
Services Occupations by Sex
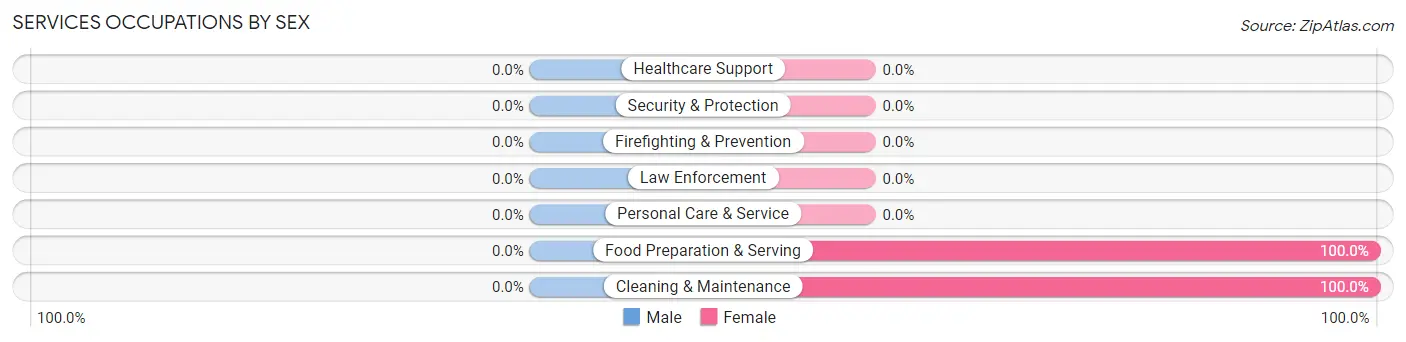
| Occupation | Male | Female |
| Healthcare Support | 0 (0.0%) | 0 (0.0%) |
| Security & Protection | 0 (0.0%) | 0 (0.0%) |
| Firefighting & Prevention | 0 (0.0%) | 0 (0.0%) |
| Law Enforcement | 0 (0.0%) | 0 (0.0%) |
| Food Preparation & Serving | 0 (0.0%) | 28 (100.0%) |
| Cleaning & Maintenance | 0 (0.0%) | 7 (100.0%) |
| Personal Care & Service | 0 (0.0%) | 0 (0.0%) |
| Total (Category) | 0 (0.0%) | 35 (100.0%) |
| Total (Overall) | 10 (21.3%) | 37 (78.7%) |
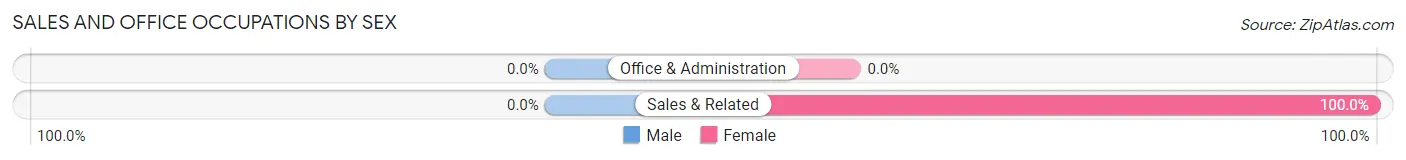
Sales and Office Occupations
The most common Sales and Office occupations in Lebanon are , and Sales & Related (2 | 4.3%).
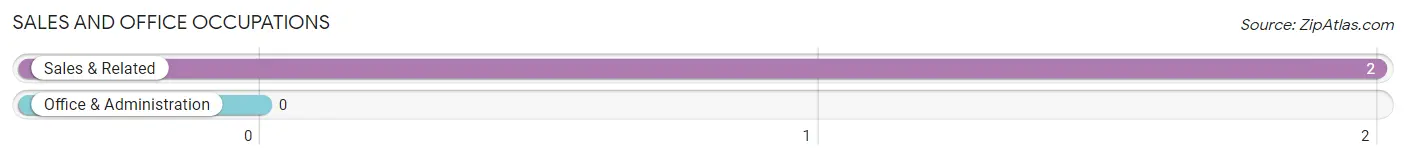
Sales and Office Occupations by Sex
| Occupation | Male | Female |
| Sales & Related | 0 (0.0%) | 2 (100.0%) |
| Office & Administration | 0 (0.0%) | 0 (0.0%) |
| Total (Category) | 0 (0.0%) | 2 (100.0%) |
| Total (Overall) | 10 (21.3%) | 37 (78.7%) |
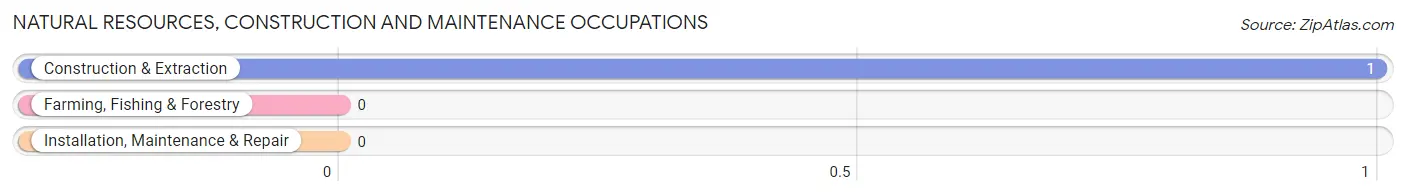
Natural Resources, Construction and Maintenance Occupations
The most common Natural Resources, Construction and Maintenance occupations in Lebanon are , and Construction & Extraction (1 | 2.1%).
Natural Resources, Construction and Maintenance Occupations by Sex
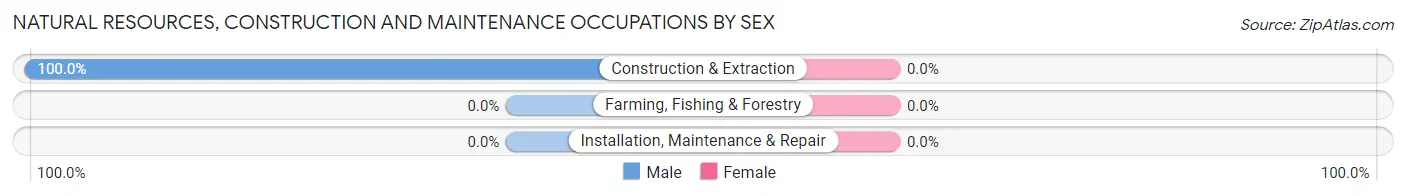
| Occupation | Male | Female |
| Farming, Fishing & Forestry | 0 (0.0%) | 0 (0.0%) |
| Construction & Extraction | 1 (100.0%) | 0 (0.0%) |
| Installation, Maintenance & Repair | 0 (0.0%) | 0 (0.0%) |
| Total (Category) | 1 (100.0%) | 0 (0.0%) |
| Total (Overall) | 10 (21.3%) | 37 (78.7%) |
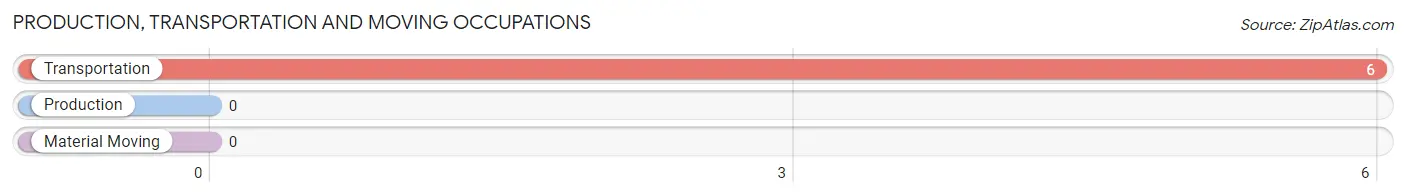
Production, Transportation and Moving Occupations
The most common Production, Transportation and Moving occupations in Lebanon are , and Transportation (6 | 12.8%).
Production, Transportation and Moving Occupations by Sex
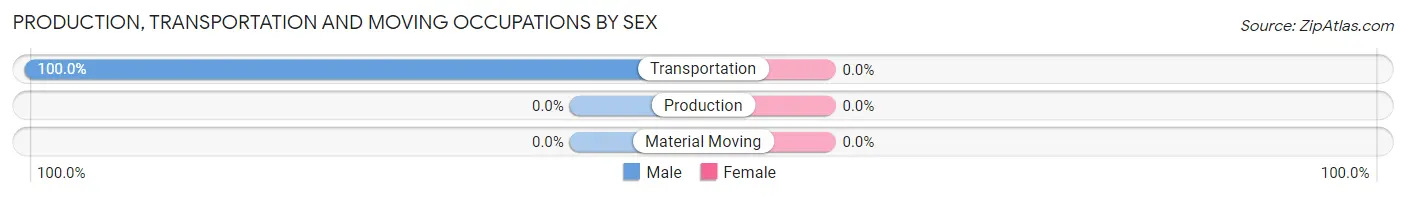
| Occupation | Male | Female |
| Production | 0 (0.0%) | 0 (0.0%) |
| Transportation | 6 (100.0%) | 0 (0.0%) |
| Material Moving | 0 (0.0%) | 0 (0.0%) |
| Total (Category) | 6 (100.0%) | 0 (0.0%) |
| Total (Overall) | 10 (21.3%) | 37 (78.7%) |
Employment Industries by Sex in Lebanon
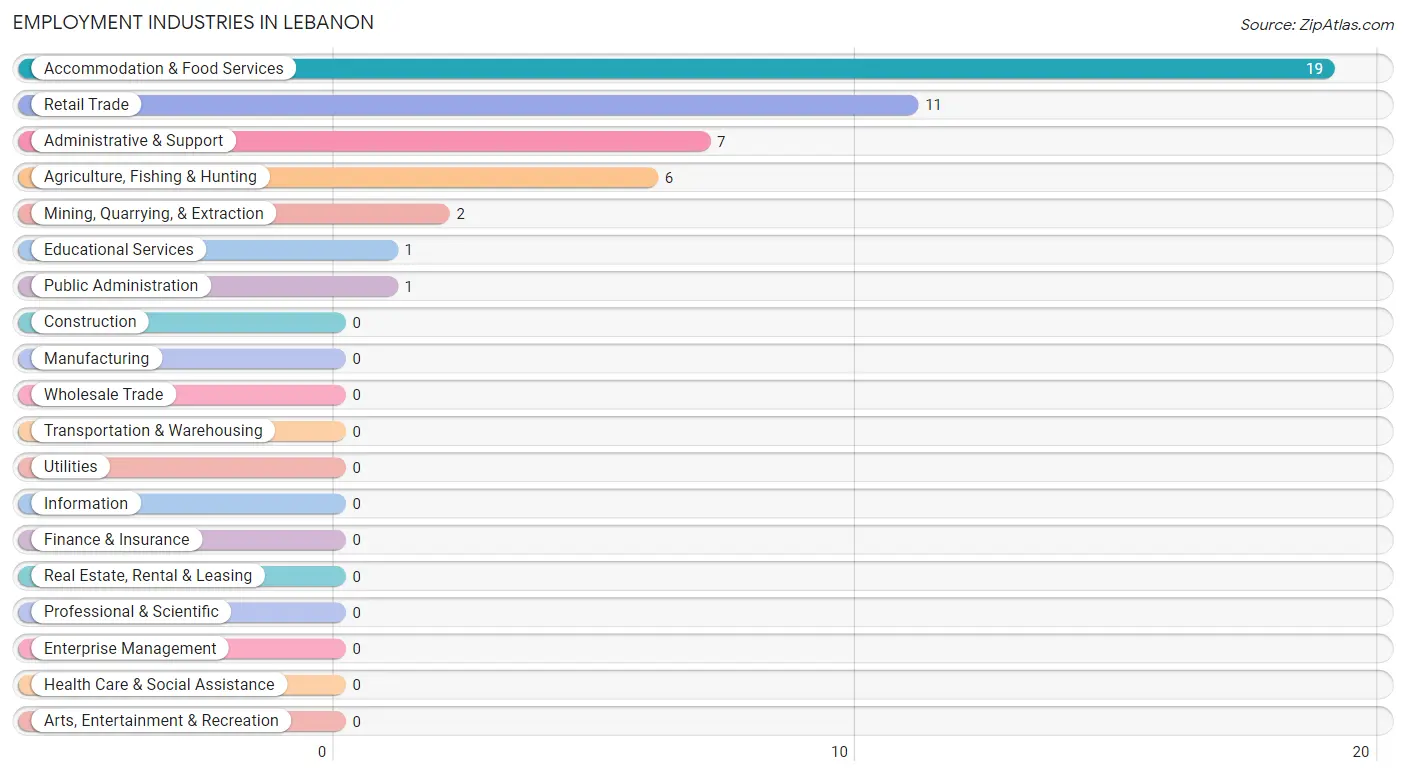
Employment Industries in Lebanon
The major employment industries in Lebanon include Accommodation & Food Services (19 | 40.4%), Retail Trade (11 | 23.4%), Administrative & Support (7 | 14.9%), Agriculture, Fishing & Hunting (6 | 12.8%), and Mining, Quarrying, & Extraction (2 | 4.3%).
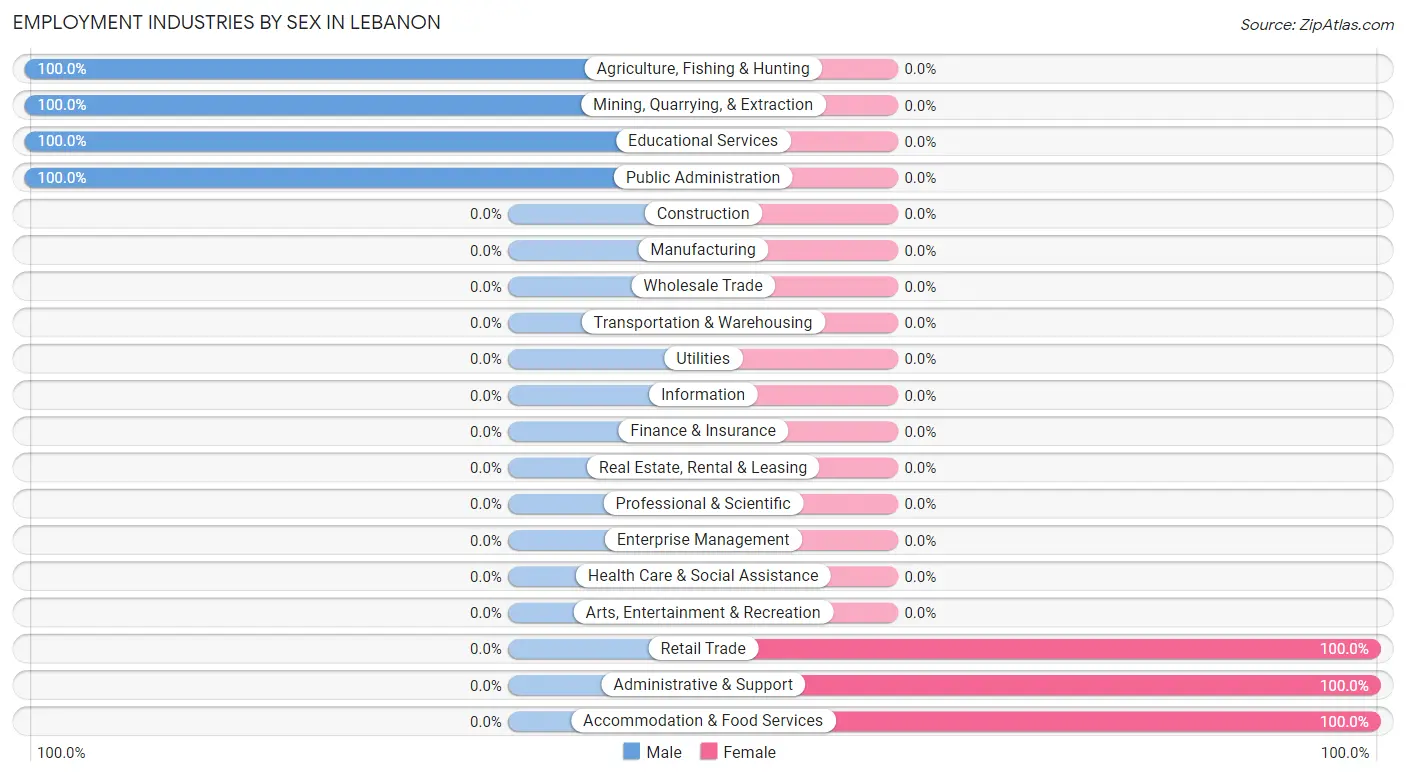
Employment Industries by Sex in Lebanon
The Lebanon industries that see more men than women are Agriculture, Fishing & Hunting (100.0%), Mining, Quarrying, & Extraction (100.0%), and Educational Services (100.0%), whereas the industries that tend to have a higher number of women are Retail Trade (100.0%), Administrative & Support (100.0%), and Accommodation & Food Services (100.0%).
| Industry | Male | Female |
| Agriculture, Fishing & Hunting | 6 (100.0%) | 0 (0.0%) |
| Mining, Quarrying, & Extraction | 2 (100.0%) | 0 (0.0%) |
| Construction | 0 (0.0%) | 0 (0.0%) |
| Manufacturing | 0 (0.0%) | 0 (0.0%) |
| Wholesale Trade | 0 (0.0%) | 0 (0.0%) |
| Retail Trade | 0 (0.0%) | 11 (100.0%) |
| Transportation & Warehousing | 0 (0.0%) | 0 (0.0%) |
| Utilities | 0 (0.0%) | 0 (0.0%) |
| Information | 0 (0.0%) | 0 (0.0%) |
| Finance & Insurance | 0 (0.0%) | 0 (0.0%) |
| Real Estate, Rental & Leasing | 0 (0.0%) | 0 (0.0%) |
| Professional & Scientific | 0 (0.0%) | 0 (0.0%) |
| Enterprise Management | 0 (0.0%) | 0 (0.0%) |
| Administrative & Support | 0 (0.0%) | 7 (100.0%) |
| Educational Services | 1 (100.0%) | 0 (0.0%) |
| Health Care & Social Assistance | 0 (0.0%) | 0 (0.0%) |
| Arts, Entertainment & Recreation | 0 (0.0%) | 0 (0.0%) |
| Accommodation & Food Services | 0 (0.0%) | 19 (100.0%) |
| Public Administration | 1 (100.0%) | 0 (0.0%) |
| Total | 10 (21.3%) | 37 (78.7%) |
Education in Lebanon
School Enrollment in Lebanon
The most common levels of schooling among the 10 students in Lebanon are kindergarten (8 | 80.0%), and elementary school (2 | 20.0%).
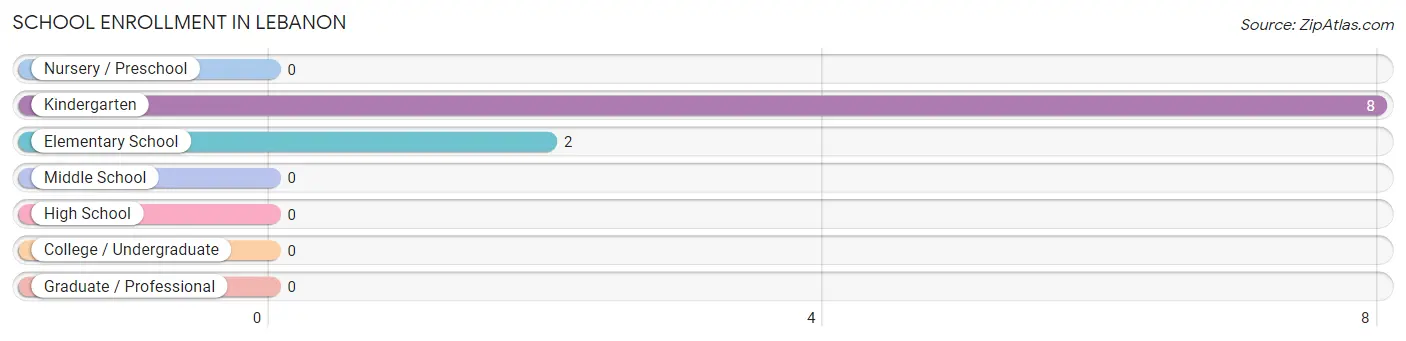
| School Level | # Students | % Students |
| Nursery / Preschool | 0 | 0.0% |
| Kindergarten | 8 | 80.0% |
| Elementary School | 2 | 20.0% |
| Middle School | 0 | 0.0% |
| High School | 0 | 0.0% |
| College / Undergraduate | 0 | 0.0% |
| Graduate / Professional | 0 | 0.0% |
| Total | 10 | 100.0% |
School Enrollment by Age by Funding Source in Lebanon
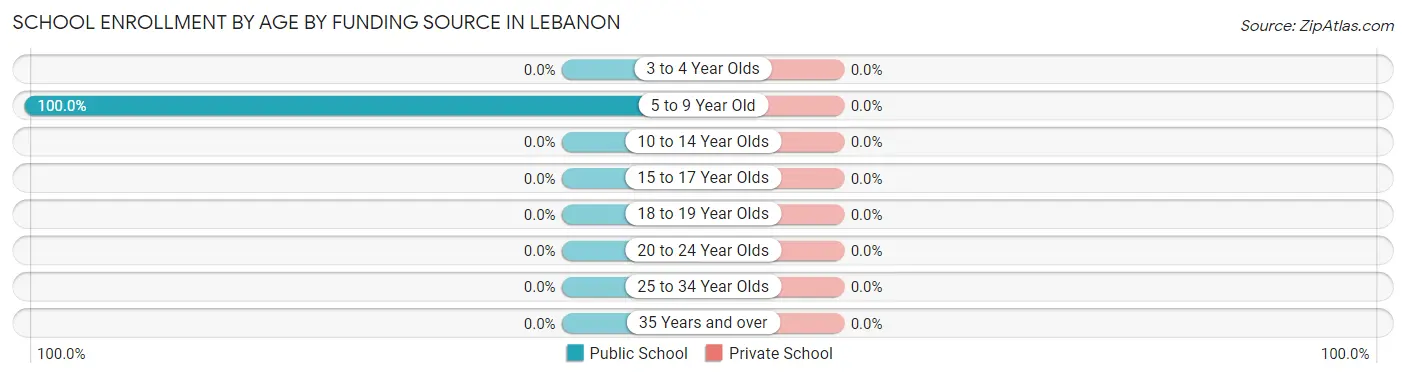
| Age Bracket | Public School | Private School |
| 3 to 4 Year Olds | 0 (0.0%) | 0 (0.0%) |
| 5 to 9 Year Old | 10 (100.0%) | 0 (0.0%) |
| 10 to 14 Year Olds | 0 (0.0%) | 0 (0.0%) |
| 15 to 17 Year Olds | 0 (0.0%) | 0 (0.0%) |
| 18 to 19 Year Olds | 0 (0.0%) | 0 (0.0%) |
| 20 to 24 Year Olds | 0 (0.0%) | 0 (0.0%) |
| 25 to 34 Year Olds | 0 (0.0%) | 0 (0.0%) |
| 35 Years and over | 0 (0.0%) | 0 (0.0%) |
| Total | 10 (100.0%) | 0 (0.0%) |
Educational Attainment by Field of Study in Lebanon
Business (2 | 66.7%), and bio, nature & agricultural (1 | 33.3%) are the most common fields of study among 3 individuals in Lebanon who have obtained a bachelor's degree or higher.
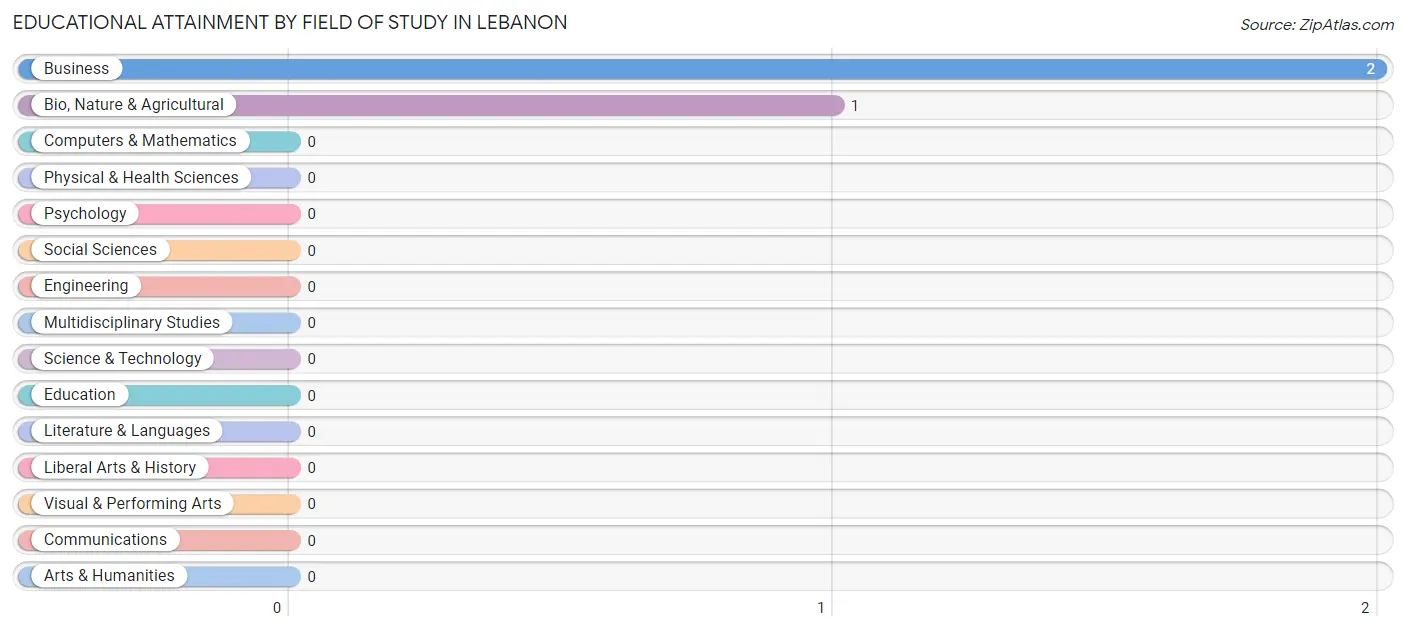
| Field of Study | # Graduates | % Graduates |
| Computers & Mathematics | 0 | 0.0% |
| Bio, Nature & Agricultural | 1 | 33.3% |
| Physical & Health Sciences | 0 | 0.0% |
| Psychology | 0 | 0.0% |
| Social Sciences | 0 | 0.0% |
| Engineering | 0 | 0.0% |
| Multidisciplinary Studies | 0 | 0.0% |
| Science & Technology | 0 | 0.0% |
| Business | 2 | 66.7% |
| Education | 0 | 0.0% |
| Literature & Languages | 0 | 0.0% |
| Liberal Arts & History | 0 | 0.0% |
| Visual & Performing Arts | 0 | 0.0% |
| Communications | 0 | 0.0% |
| Arts & Humanities | 0 | 0.0% |
| Total | 3 | 100.0% |
Transportation & Commute in Lebanon
Vehicle Availability by Sex in Lebanon
The most prevalent vehicle ownership categories in Lebanon are males with 2 vehicles (5, accounting for 50.0%) and females with 2 vehicles (8, making up 13.5%).
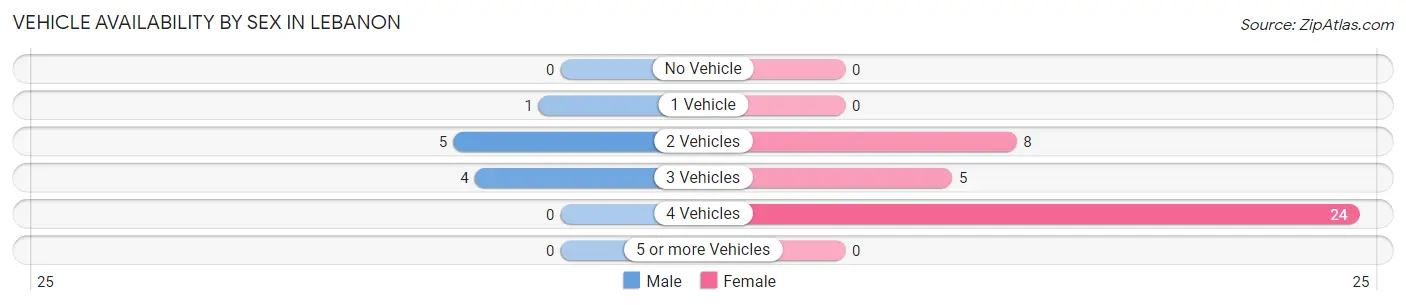
| Vehicles Available | Male | Female |
| No Vehicle | 0 (0.0%) | 0 (0.0%) |
| 1 Vehicle | 1 (10.0%) | 0 (0.0%) |
| 2 Vehicles | 5 (50.0%) | 8 (21.6%) |
| 3 Vehicles | 4 (40.0%) | 5 (13.5%) |
| 4 Vehicles | 0 (0.0%) | 24 (64.9%) |
| 5 or more Vehicles | 0 (0.0%) | 0 (0.0%) |
| Total | 10 (100.0%) | 37 (100.0%) |
Commute Time in Lebanon
The most frequently occuring commute durations in Lebanon are 10 to 14 minutes (31 commuters, 66.0%), 5 to 9 minutes (5 commuters, 10.6%), and 15 to 19 minutes (5 commuters, 10.6%).
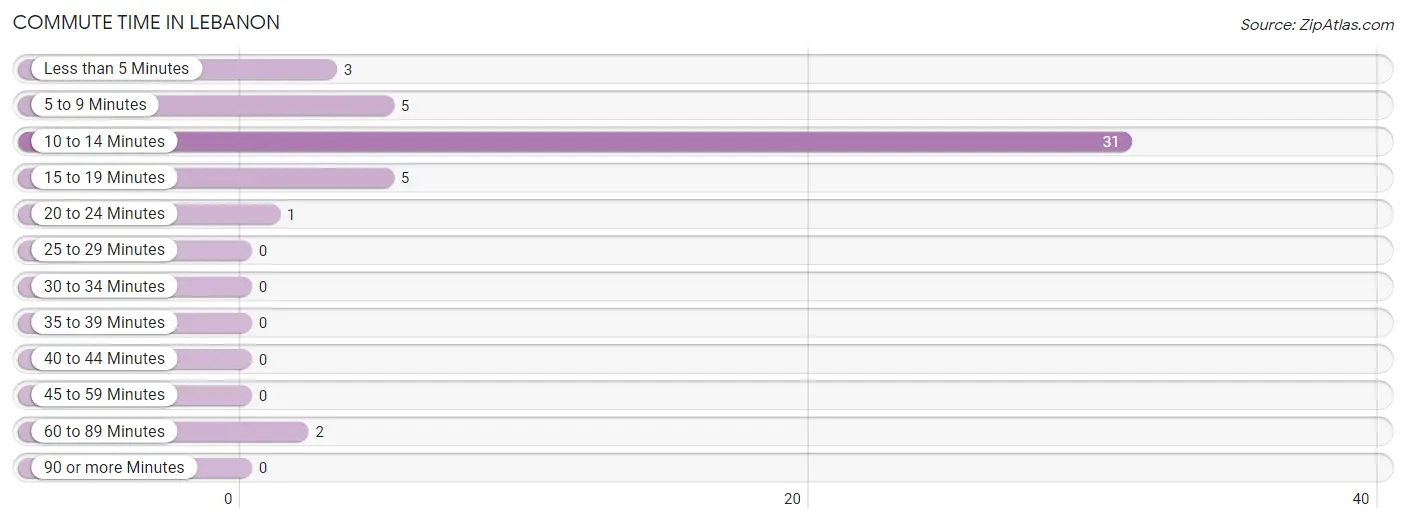
| Commute Time | # Commuters | % Commuters |
| Less than 5 Minutes | 3 | 6.4% |
| 5 to 9 Minutes | 5 | 10.6% |
| 10 to 14 Minutes | 31 | 66.0% |
| 15 to 19 Minutes | 5 | 10.6% |
| 20 to 24 Minutes | 1 | 2.1% |
| 25 to 29 Minutes | 0 | 0.0% |
| 30 to 34 Minutes | 0 | 0.0% |
| 35 to 39 Minutes | 0 | 0.0% |
| 40 to 44 Minutes | 0 | 0.0% |
| 45 to 59 Minutes | 0 | 0.0% |
| 60 to 89 Minutes | 2 | 4.3% |
| 90 or more Minutes | 0 | 0.0% |
Commute Time by Sex in Lebanon
The most common commute times in Lebanon are 10 to 14 minutes (4 commuters, 40.0%) for males and 10 to 14 minutes (27 commuters, 73.0%) for females.
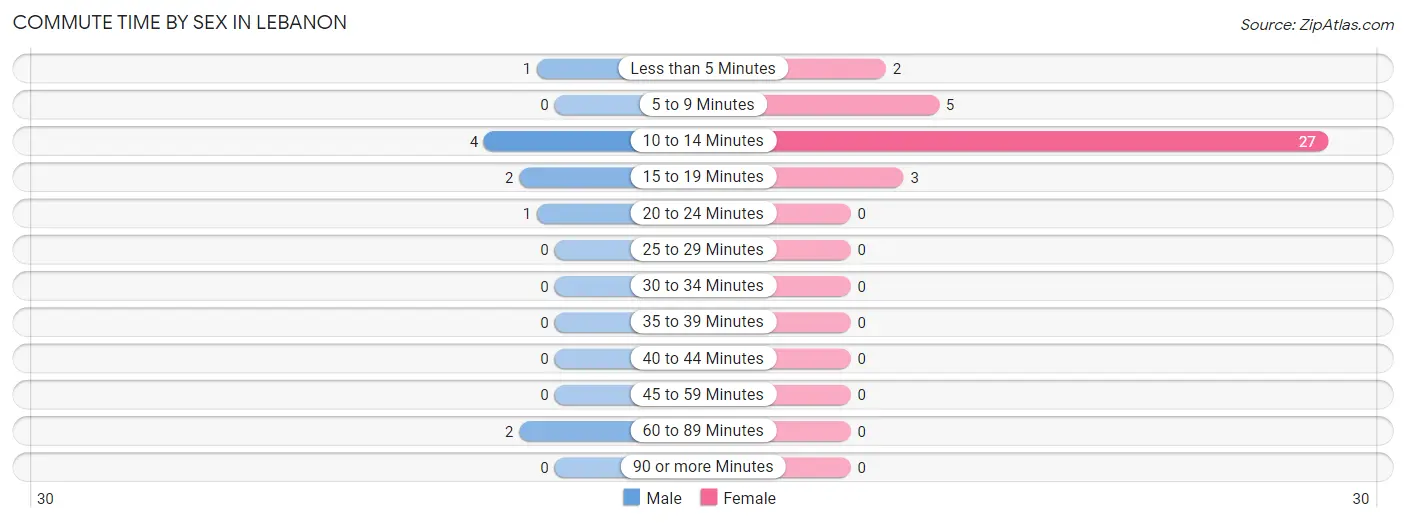
| Commute Time | Male | Female |
| Less than 5 Minutes | 1 (10.0%) | 2 (5.4%) |
| 5 to 9 Minutes | 0 (0.0%) | 5 (13.5%) |
| 10 to 14 Minutes | 4 (40.0%) | 27 (73.0%) |
| 15 to 19 Minutes | 2 (20.0%) | 3 (8.1%) |
| 20 to 24 Minutes | 1 (10.0%) | 0 (0.0%) |
| 25 to 29 Minutes | 0 (0.0%) | 0 (0.0%) |
| 30 to 34 Minutes | 0 (0.0%) | 0 (0.0%) |
| 35 to 39 Minutes | 0 (0.0%) | 0 (0.0%) |
| 40 to 44 Minutes | 0 (0.0%) | 0 (0.0%) |
| 45 to 59 Minutes | 0 (0.0%) | 0 (0.0%) |
| 60 to 89 Minutes | 2 (20.0%) | 0 (0.0%) |
| 90 or more Minutes | 0 (0.0%) | 0 (0.0%) |
Time of Departure to Work by Sex in Lebanon
The most frequent times of departure to work in Lebanon are 7:00 AM to 7:29 AM (10, 100.0%) for males and 9:00 AM to 9:59 AM (16, 43.2%) for females.
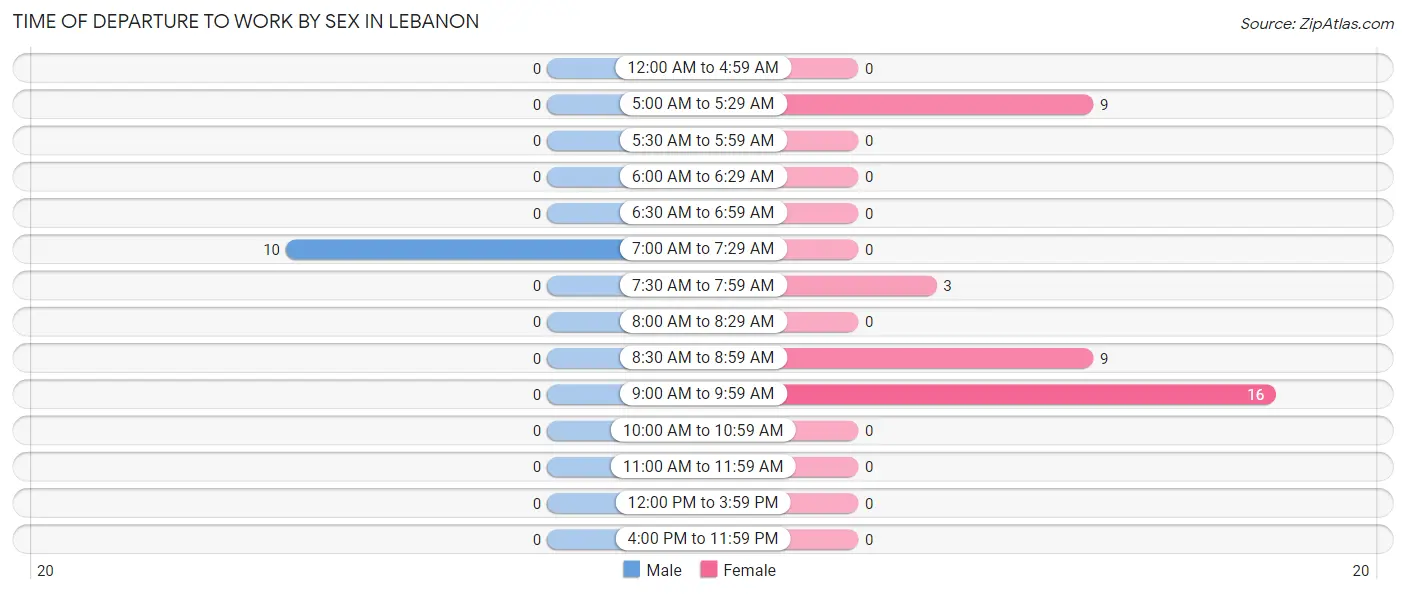
| Time of Departure | Male | Female |
| 12:00 AM to 4:59 AM | 0 (0.0%) | 0 (0.0%) |
| 5:00 AM to 5:29 AM | 0 (0.0%) | 9 (24.3%) |
| 5:30 AM to 5:59 AM | 0 (0.0%) | 0 (0.0%) |
| 6:00 AM to 6:29 AM | 0 (0.0%) | 0 (0.0%) |
| 6:30 AM to 6:59 AM | 0 (0.0%) | 0 (0.0%) |
| 7:00 AM to 7:29 AM | 10 (100.0%) | 0 (0.0%) |
| 7:30 AM to 7:59 AM | 0 (0.0%) | 3 (8.1%) |
| 8:00 AM to 8:29 AM | 0 (0.0%) | 0 (0.0%) |
| 8:30 AM to 8:59 AM | 0 (0.0%) | 9 (24.3%) |
| 9:00 AM to 9:59 AM | 0 (0.0%) | 16 (43.2%) |
| 10:00 AM to 10:59 AM | 0 (0.0%) | 0 (0.0%) |
| 11:00 AM to 11:59 AM | 0 (0.0%) | 0 (0.0%) |
| 12:00 PM to 3:59 PM | 0 (0.0%) | 0 (0.0%) |
| 4:00 PM to 11:59 PM | 0 (0.0%) | 0 (0.0%) |
| Total | 10 (100.0%) | 37 (100.0%) |
Housing Occupancy in Lebanon
Occupancy by Ownership in Lebanon
Of the total 24 dwellings in Lebanon, owner-occupied units account for 22 (91.7%), while renter-occupied units make up 2 (8.3%).
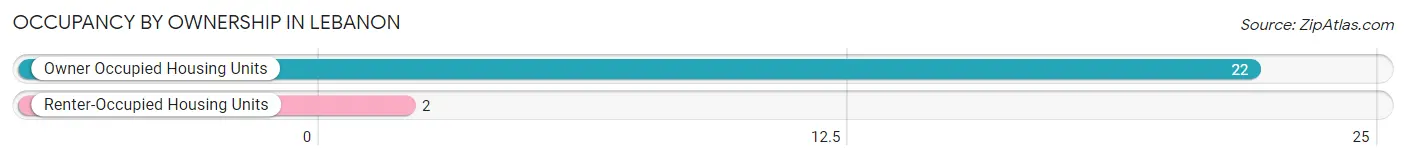
| Occupancy | # Housing Units | % Housing Units |
| Owner Occupied Housing Units | 22 | 91.7% |
| Renter-Occupied Housing Units | 2 | 8.3% |
| Total Occupied Housing Units | 24 | 100.0% |
Occupancy by Household Size in Lebanon
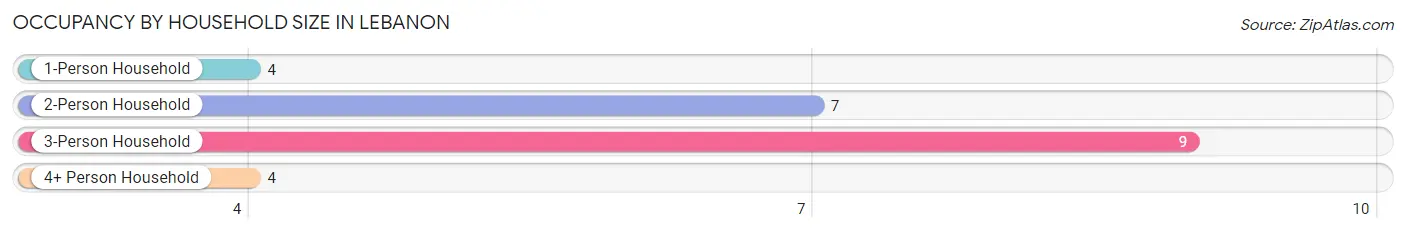
| Household Size | # Housing Units | % Housing Units |
| 1-Person Household | 4 | 16.7% |
| 2-Person Household | 7 | 29.2% |
| 3-Person Household | 9 | 37.5% |
| 4+ Person Household | 4 | 16.7% |
| Total Housing Units | 24 | 100.0% |
Occupancy by Ownership by Household Size in Lebanon
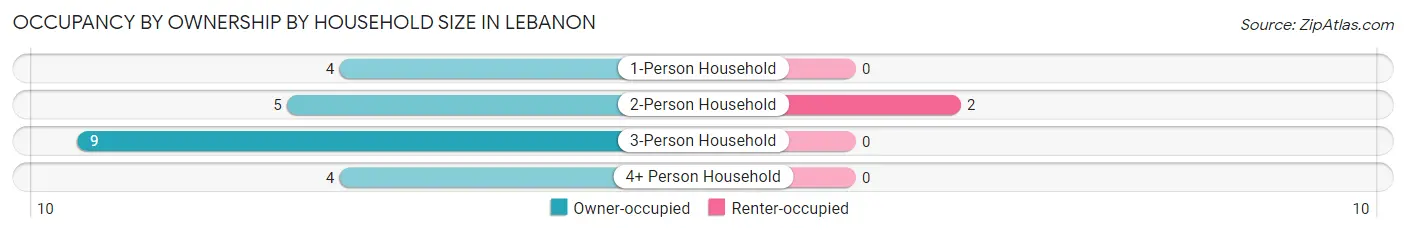
| Household Size | Owner-occupied | Renter-occupied |
| 1-Person Household | 4 (100.0%) | 0 (0.0%) |
| 2-Person Household | 5 (71.4%) | 2 (28.6%) |
| 3-Person Household | 9 (100.0%) | 0 (0.0%) |
| 4+ Person Household | 4 (100.0%) | 0 (0.0%) |
| Total Housing Units | 22 (91.7%) | 2 (8.3%) |
Occupancy by Educational Attainment in Lebanon
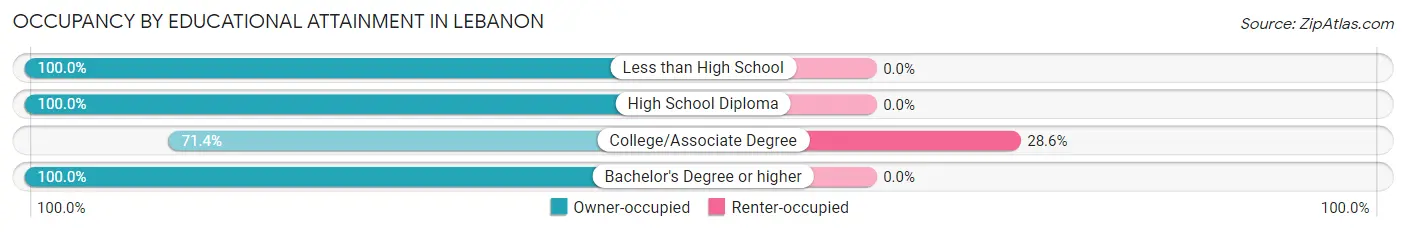
| Household Size | Owner-occupied | Renter-occupied |
| Less than High School | 5 (100.0%) | 0 (0.0%) |
| High School Diploma | 11 (100.0%) | 0 (0.0%) |
| College/Associate Degree | 5 (71.4%) | 2 (28.6%) |
| Bachelor's Degree or higher | 1 (100.0%) | 0 (0.0%) |
Occupancy by Age of Householder in Lebanon
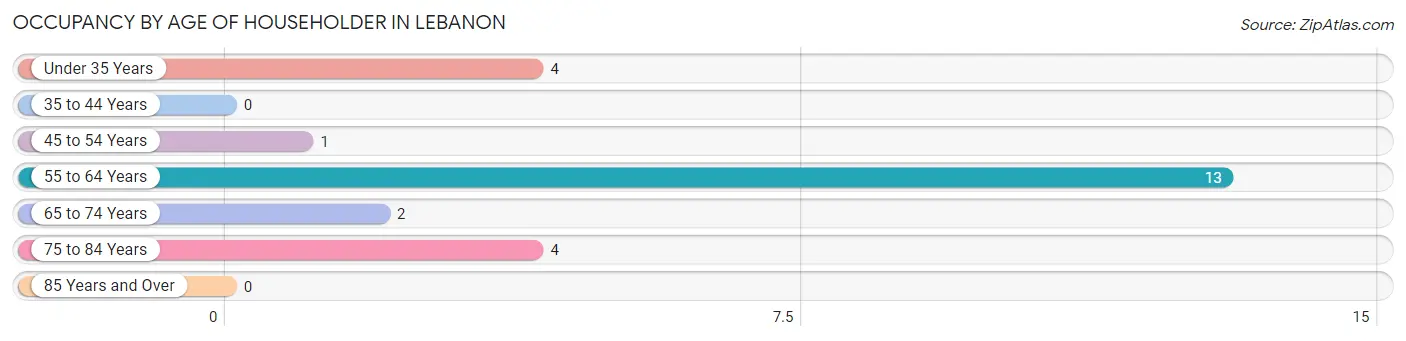
| Age Bracket | # Households | % Households |
| Under 35 Years | 4 | 16.7% |
| 35 to 44 Years | 0 | 0.0% |
| 45 to 54 Years | 1 | 4.2% |
| 55 to 64 Years | 13 | 54.2% |
| 65 to 74 Years | 2 | 8.3% |
| 75 to 84 Years | 4 | 16.7% |
| 85 Years and Over | 0 | 0.0% |
| Total | 24 | 100.0% |
Housing Finances in Lebanon
Median Income by Occupancy in Lebanon
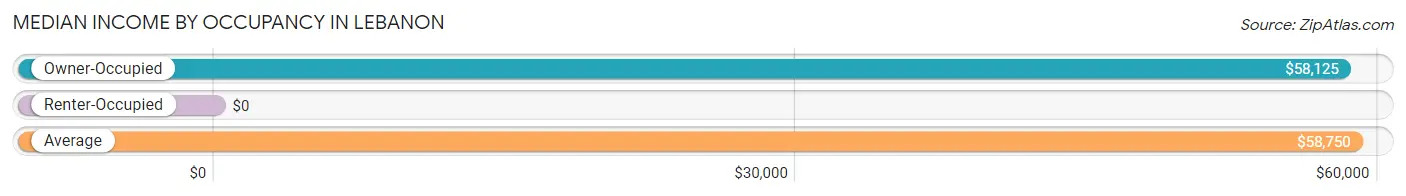
| Occupancy Type | # Households | Median Income |
| Owner-Occupied | 22 (91.7%) | $58,125 |
| Renter-Occupied | 2 (8.3%) | $0 |
| Average | 24 (100.0%) | $58,750 |
Occupancy by Householder Income Bracket in Lebanon
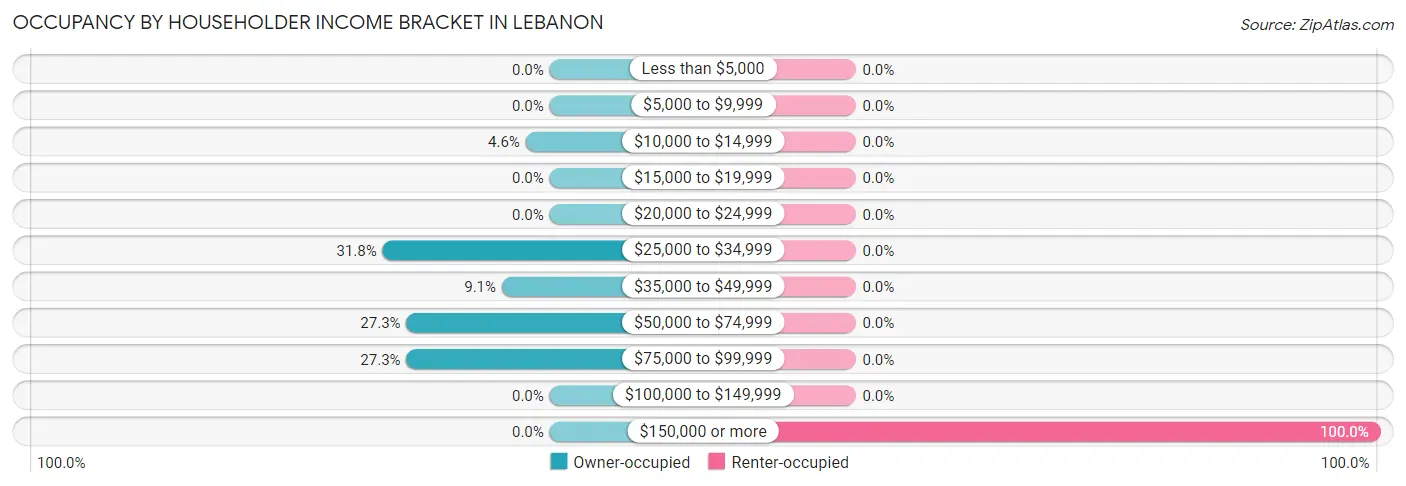
| Income Bracket | Owner-occupied | Renter-occupied |
| Less than $5,000 | 0 (0.0%) | 0 (0.0%) |
| $5,000 to $9,999 | 0 (0.0%) | 0 (0.0%) |
| $10,000 to $14,999 | 1 (4.5%) | 0 (0.0%) |
| $15,000 to $19,999 | 0 (0.0%) | 0 (0.0%) |
| $20,000 to $24,999 | 0 (0.0%) | 0 (0.0%) |
| $25,000 to $34,999 | 7 (31.8%) | 0 (0.0%) |
| $35,000 to $49,999 | 2 (9.1%) | 0 (0.0%) |
| $50,000 to $74,999 | 6 (27.3%) | 0 (0.0%) |
| $75,000 to $99,999 | 6 (27.3%) | 0 (0.0%) |
| $100,000 to $149,999 | 0 (0.0%) | 0 (0.0%) |
| $150,000 or more | 0 (0.0%) | 2 (100.0%) |
| Total | 22 (100.0%) | 2 (100.0%) |
Monthly Housing Cost Tiers in Lebanon
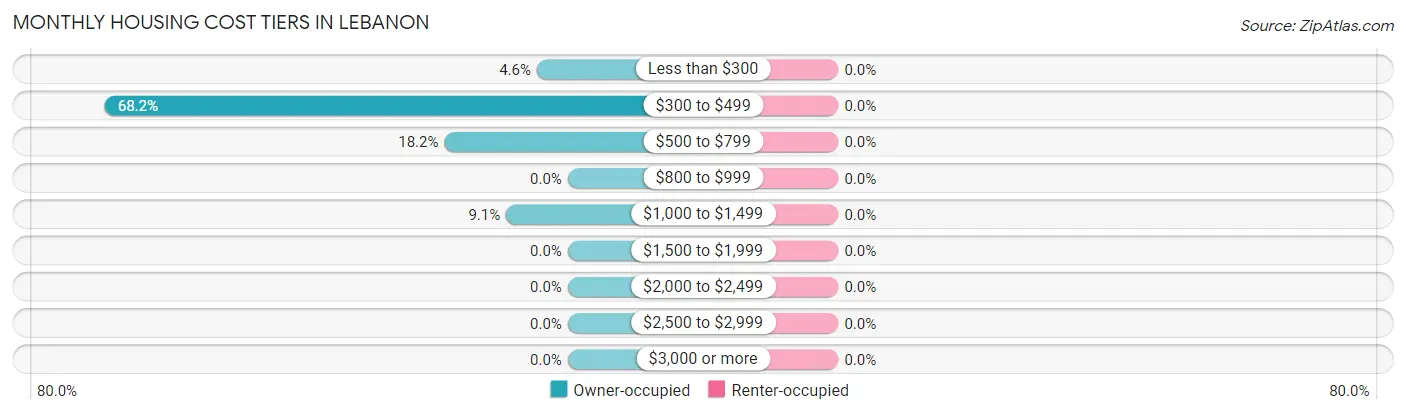
| Monthly Cost | Owner-occupied | Renter-occupied |
| Less than $300 | 1 (4.5%) | 0 (0.0%) |
| $300 to $499 | 15 (68.2%) | 0 (0.0%) |
| $500 to $799 | 4 (18.2%) | 0 (0.0%) |
| $800 to $999 | 0 (0.0%) | 0 (0.0%) |
| $1,000 to $1,499 | 2 (9.1%) | 0 (0.0%) |
| $1,500 to $1,999 | 0 (0.0%) | 0 (0.0%) |
| $2,000 to $2,499 | 0 (0.0%) | 0 (0.0%) |
| $2,500 to $2,999 | 0 (0.0%) | 0 (0.0%) |
| $3,000 or more | 0 (0.0%) | 0 (0.0%) |
| Total | 22 (100.0%) | 2 (100.0%) |
Physical Housing Characteristics in Lebanon
Housing Structures in Lebanon
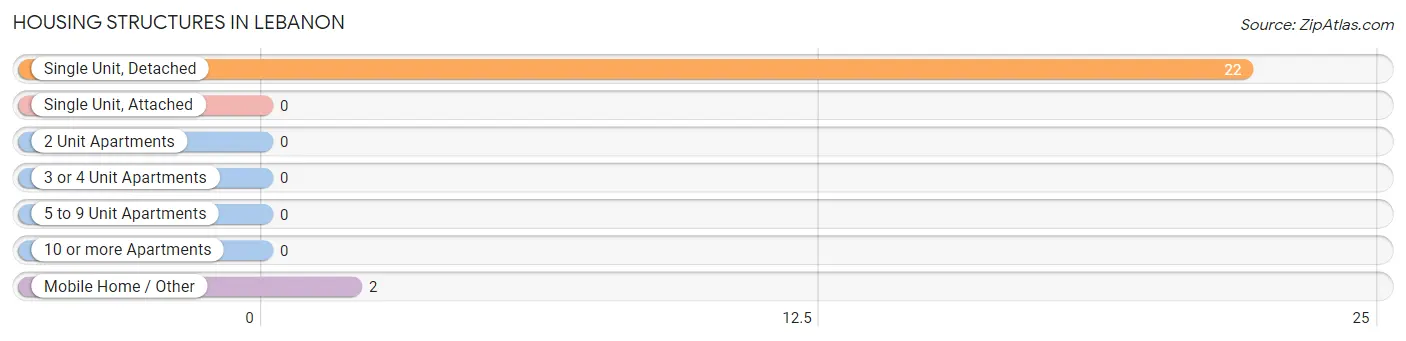
| Structure Type | # Housing Units | % Housing Units |
| Single Unit, Detached | 22 | 91.7% |
| Single Unit, Attached | 0 | 0.0% |
| 2 Unit Apartments | 0 | 0.0% |
| 3 or 4 Unit Apartments | 0 | 0.0% |
| 5 to 9 Unit Apartments | 0 | 0.0% |
| 10 or more Apartments | 0 | 0.0% |
| Mobile Home / Other | 2 | 8.3% |
| Total | 24 | 100.0% |
Housing Structures by Occupancy in Lebanon
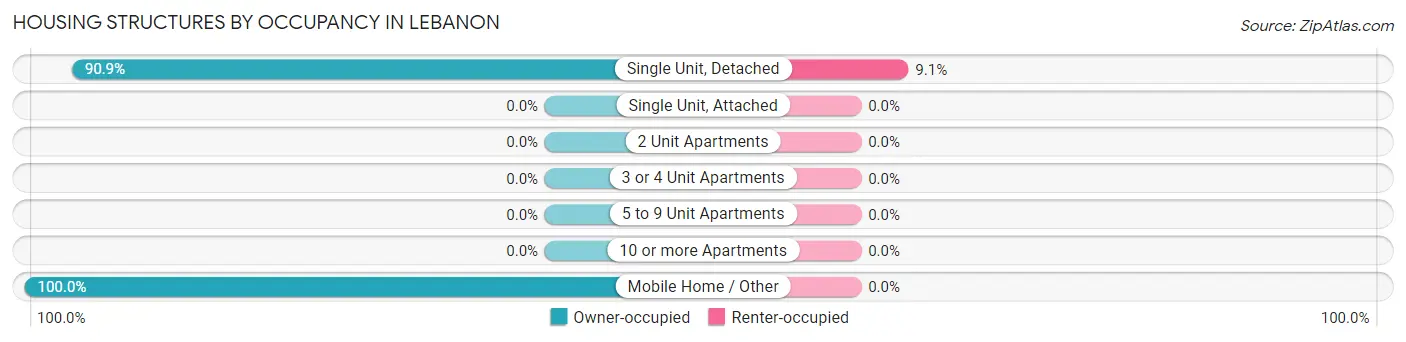
| Structure Type | Owner-occupied | Renter-occupied |
| Single Unit, Detached | 20 (90.9%) | 2 (9.1%) |
| Single Unit, Attached | 0 (0.0%) | 0 (0.0%) |
| 2 Unit Apartments | 0 (0.0%) | 0 (0.0%) |
| 3 or 4 Unit Apartments | 0 (0.0%) | 0 (0.0%) |
| 5 to 9 Unit Apartments | 0 (0.0%) | 0 (0.0%) |
| 10 or more Apartments | 0 (0.0%) | 0 (0.0%) |
| Mobile Home / Other | 2 (100.0%) | 0 (0.0%) |
| Total | 22 (91.7%) | 2 (8.3%) |
Housing Structures by Number of Rooms in Lebanon
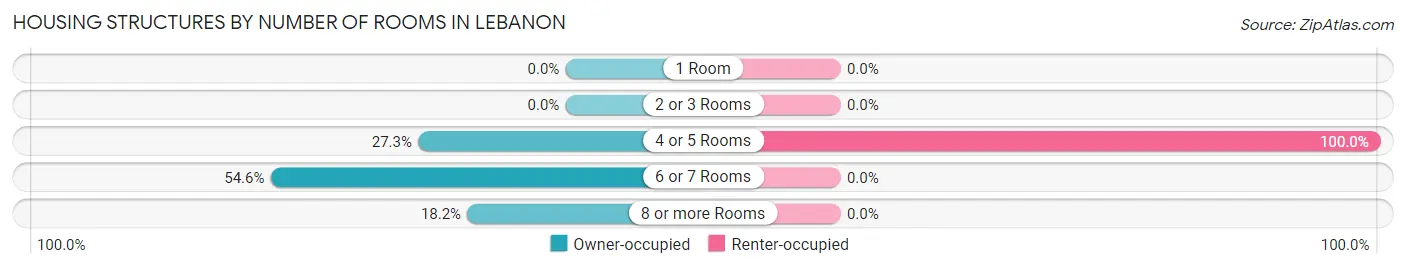
| Number of Rooms | Owner-occupied | Renter-occupied |
| 1 Room | 0 (0.0%) | 0 (0.0%) |
| 2 or 3 Rooms | 0 (0.0%) | 0 (0.0%) |
| 4 or 5 Rooms | 6 (27.3%) | 2 (100.0%) |
| 6 or 7 Rooms | 12 (54.5%) | 0 (0.0%) |
| 8 or more Rooms | 4 (18.2%) | 0 (0.0%) |
| Total | 22 (100.0%) | 2 (100.0%) |
Housing Structure by Heating Type in Lebanon
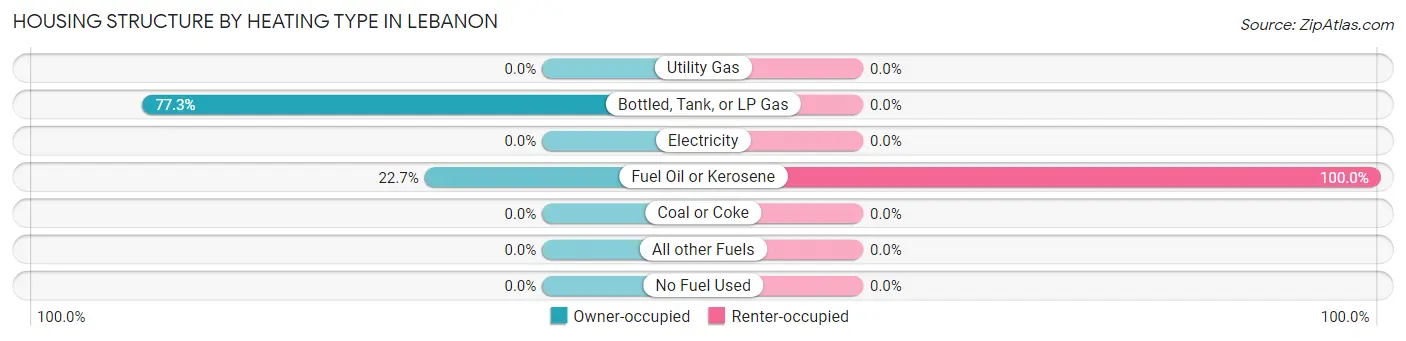
| Heating Type | Owner-occupied | Renter-occupied |
| Utility Gas | 0 (0.0%) | 0 (0.0%) |
| Bottled, Tank, or LP Gas | 17 (77.3%) | 0 (0.0%) |
| Electricity | 0 (0.0%) | 0 (0.0%) |
| Fuel Oil or Kerosene | 5 (22.7%) | 2 (100.0%) |
| Coal or Coke | 0 (0.0%) | 0 (0.0%) |
| All other Fuels | 0 (0.0%) | 0 (0.0%) |
| No Fuel Used | 0 (0.0%) | 0 (0.0%) |
| Total | 22 (100.0%) | 2 (100.0%) |
Household Vehicle Usage in Lebanon
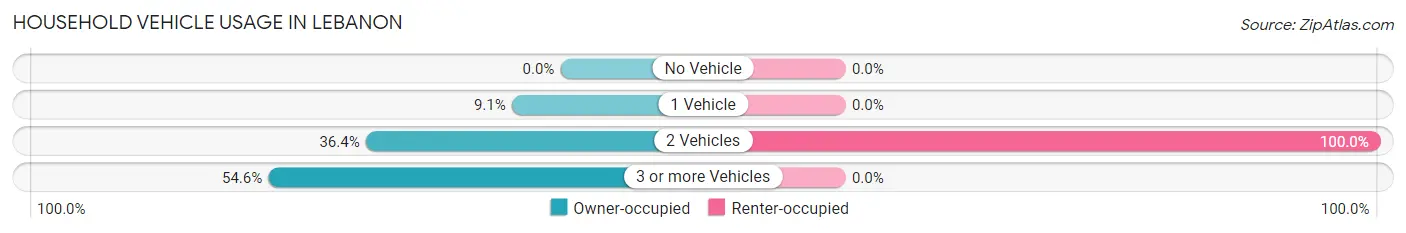
| Vehicles per Household | Owner-occupied | Renter-occupied |
| No Vehicle | 0 (0.0%) | 0 (0.0%) |
| 1 Vehicle | 2 (9.1%) | 0 (0.0%) |
| 2 Vehicles | 8 (36.4%) | 2 (100.0%) |
| 3 or more Vehicles | 12 (54.5%) | 0 (0.0%) |
| Total | 22 (100.0%) | 2 (100.0%) |
Real Estate & Mortgages in Lebanon
Real Estate and Mortgage Overview in Lebanon
| Characteristic | Without Mortgage | With Mortgage |
| Housing Units | 18 | 4 |
| Median Property Value | $9,999 | $0 |
| Median Household Income | $38,750 | $0 |
| Monthly Housing Costs | $333 | $0 |
| Real Estate Taxes | - | - |
Property Value by Mortgage Status in Lebanon
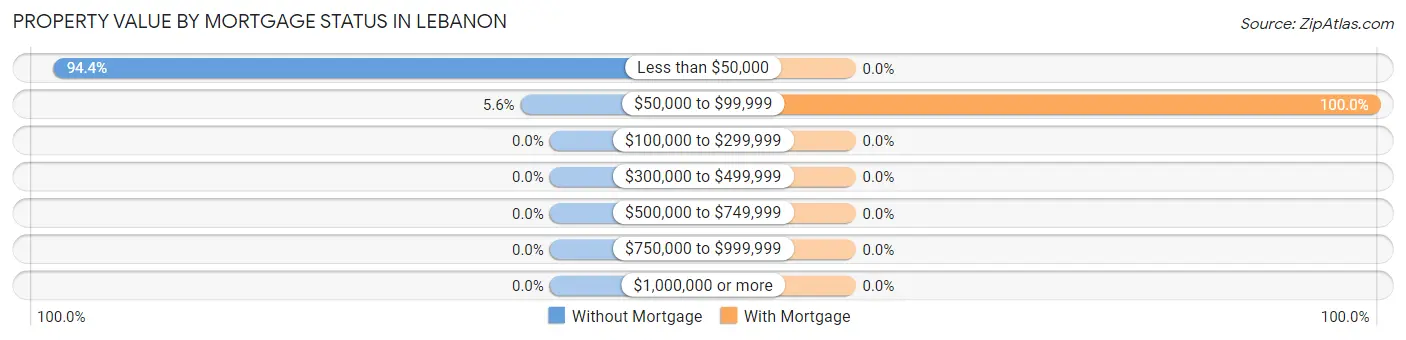
| Property Value | Without Mortgage | With Mortgage |
| Less than $50,000 | 17 (94.4%) | 0 (0.0%) |
| $50,000 to $99,999 | 1 (5.6%) | 4 (100.0%) |
| $100,000 to $299,999 | 0 (0.0%) | 0 (0.0%) |
| $300,000 to $499,999 | 0 (0.0%) | 0 (0.0%) |
| $500,000 to $749,999 | 0 (0.0%) | 0 (0.0%) |
| $750,000 to $999,999 | 0 (0.0%) | 0 (0.0%) |
| $1,000,000 or more | 0 (0.0%) | 0 (0.0%) |
| Total | 18 (100.0%) | 4 (100.0%) |
Household Income by Mortgage Status in Lebanon
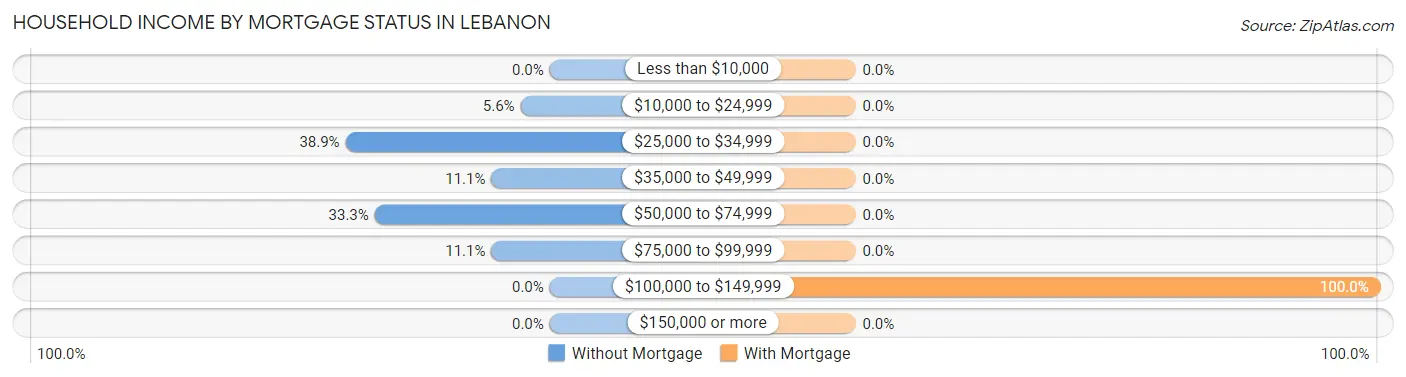
| Household Income | Without Mortgage | With Mortgage |
| Less than $10,000 | 0 (0.0%) | 0 (0.0%) |
| $10,000 to $24,999 | 1 (5.6%) | 0 (0.0%) |
| $25,000 to $34,999 | 7 (38.9%) | 0 (0.0%) |
| $35,000 to $49,999 | 2 (11.1%) | 0 (0.0%) |
| $50,000 to $74,999 | 6 (33.3%) | 0 (0.0%) |
| $75,000 to $99,999 | 2 (11.1%) | 0 (0.0%) |
| $100,000 to $149,999 | 0 (0.0%) | 4 (100.0%) |
| $150,000 or more | 0 (0.0%) | 0 (0.0%) |
| Total | 18 (100.0%) | 4 (100.0%) |
Property Value to Household Income Ratio in Lebanon
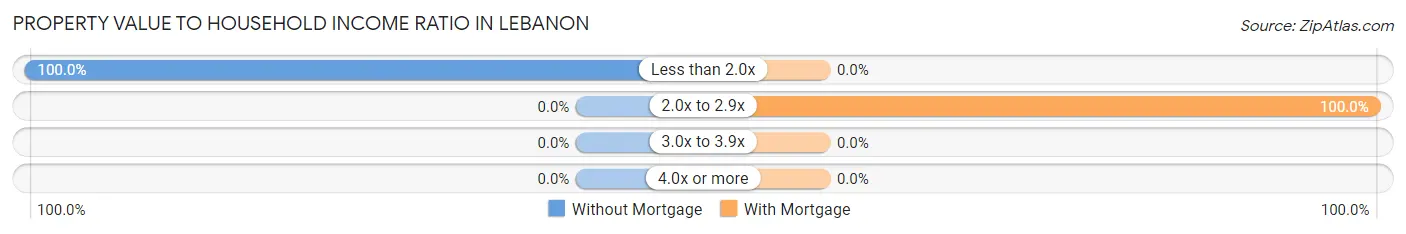
| Value-to-Income Ratio | Without Mortgage | With Mortgage |
| Less than 2.0x | 18 (100.0%) | 0 (0.0%) |
| 2.0x to 2.9x | 0 (0.0%) | 4 (100.0%) |
| 3.0x to 3.9x | 0 (0.0%) | 0 (0.0%) |
| 4.0x or more | 0 (0.0%) | 0 (0.0%) |
| Total | 18 (100.0%) | 4 (100.0%) |
Real Estate Taxes by Mortgage Status in Lebanon
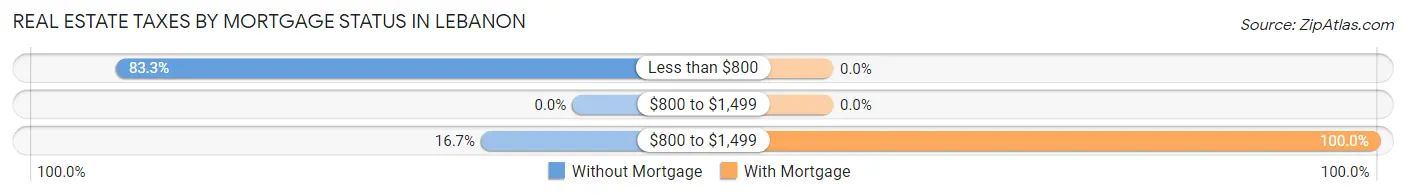
| Property Taxes | Without Mortgage | With Mortgage |
| Less than $800 | 15 (83.3%) | 0 (0.0%) |
| $800 to $1,499 | 0 (0.0%) | 0 (0.0%) |
| $800 to $1,499 | 3 (16.7%) | 4 (100.0%) |
| Total | 18 (100.0%) | 4 (100.0%) |
Health & Disability in Lebanon
Health Insurance Coverage by Age in Lebanon
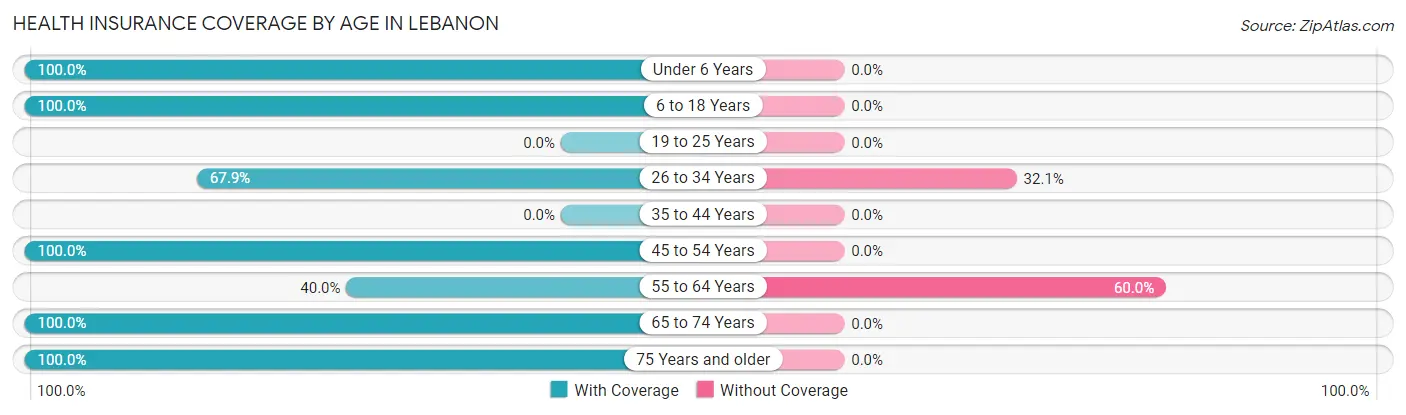
| Age Bracket | With Coverage | Without Coverage |
| Under 6 Years | 10 (100.0%) | 0 (0.0%) |
| 6 to 18 Years | 13 (100.0%) | 0 (0.0%) |
| 19 to 25 Years | 0 (0.0%) | 0 (0.0%) |
| 26 to 34 Years | 19 (67.9%) | 9 (32.1%) |
| 35 to 44 Years | 0 (0.0%) | 0 (0.0%) |
| 45 to 54 Years | 1 (100.0%) | 0 (0.0%) |
| 55 to 64 Years | 6 (40.0%) | 9 (60.0%) |
| 65 to 74 Years | 5 (100.0%) | 0 (0.0%) |
| 75 Years and older | 6 (100.0%) | 0 (0.0%) |
| Total | 60 (76.9%) | 18 (23.1%) |
Health Insurance Coverage by Citizenship Status in Lebanon
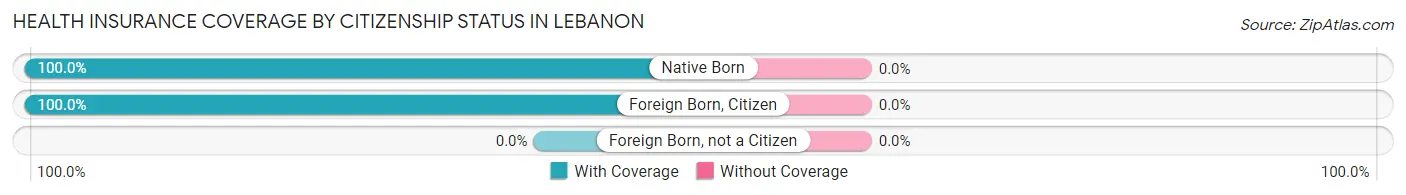
| Citizenship Status | With Coverage | Without Coverage |
| Native Born | 10 (100.0%) | 0 (0.0%) |
| Foreign Born, Citizen | 13 (100.0%) | 0 (0.0%) |
| Foreign Born, not a Citizen | 0 (0.0%) | 0 (0.0%) |
Health Insurance Coverage by Household Income in Lebanon
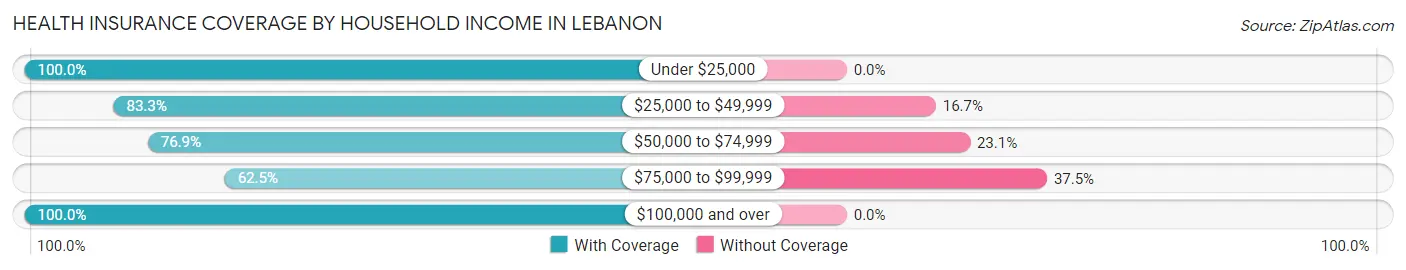
| Household Income | With Coverage | Without Coverage |
| Under $25,000 | 1 (100.0%) | 0 (0.0%) |
| $25,000 to $49,999 | 30 (83.3%) | 6 (16.7%) |
| $50,000 to $74,999 | 10 (76.9%) | 3 (23.1%) |
| $75,000 to $99,999 | 15 (62.5%) | 9 (37.5%) |
| $100,000 and over | 4 (100.0%) | 0 (0.0%) |
Public vs Private Health Insurance Coverage by Age in Lebanon
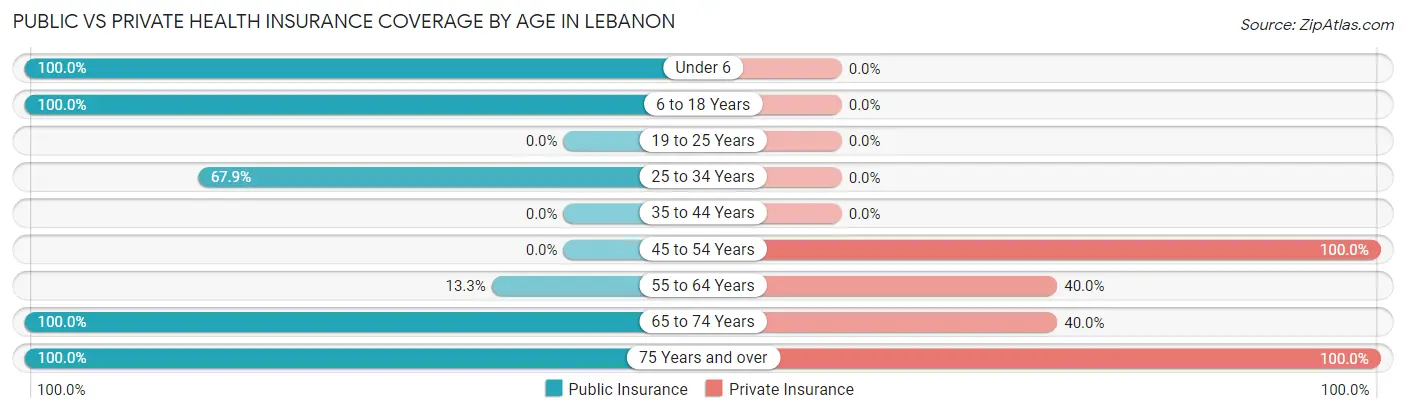
| Age Bracket | Public Insurance | Private Insurance |
| Under 6 | 10 (100.0%) | 0 (0.0%) |
| 6 to 18 Years | 13 (100.0%) | 0 (0.0%) |
| 19 to 25 Years | 0 (0.0%) | 0 (0.0%) |
| 25 to 34 Years | 19 (67.9%) | 0 (0.0%) |
| 35 to 44 Years | 0 (0.0%) | 0 (0.0%) |
| 45 to 54 Years | 0 (0.0%) | 1 (100.0%) |
| 55 to 64 Years | 2 (13.3%) | 6 (40.0%) |
| 65 to 74 Years | 5 (100.0%) | 2 (40.0%) |
| 75 Years and over | 6 (100.0%) | 6 (100.0%) |
| Total | 55 (70.5%) | 15 (19.2%) |
Disability Status by Sex by Age in Lebanon
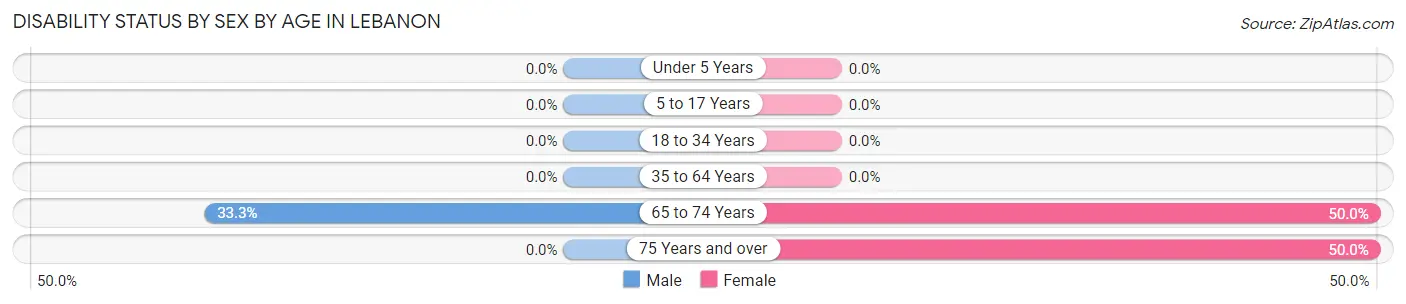
| Age Bracket | Male | Female |
| Under 5 Years | 0 (0.0%) | 0 (0.0%) |
| 5 to 17 Years | 0 (0.0%) | 0 (0.0%) |
| 18 to 34 Years | 0 (0.0%) | 0 (0.0%) |
| 35 to 64 Years | 0 (0.0%) | 0 (0.0%) |
| 65 to 74 Years | 1 (33.3%) | 1 (50.0%) |
| 75 Years and over | 0 (0.0%) | 2 (50.0%) |
Disability Class by Sex by Age in Lebanon
Disability Class: Hearing Difficulty
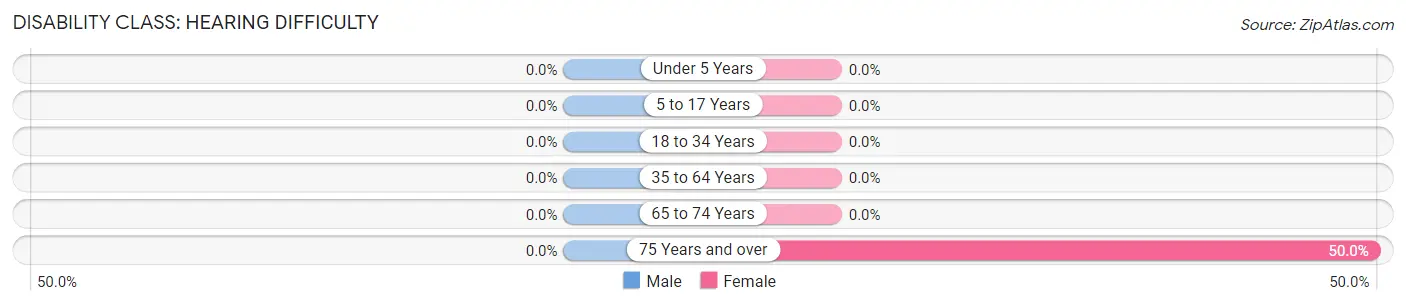
| Age Bracket | Male | Female |
| Under 5 Years | 0 (0.0%) | 0 (0.0%) |
| 5 to 17 Years | 0 (0.0%) | 0 (0.0%) |
| 18 to 34 Years | 0 (0.0%) | 0 (0.0%) |
| 35 to 64 Years | 0 (0.0%) | 0 (0.0%) |
| 65 to 74 Years | 0 (0.0%) | 0 (0.0%) |
| 75 Years and over | 0 (0.0%) | 2 (50.0%) |
Disability Class: Vision Difficulty
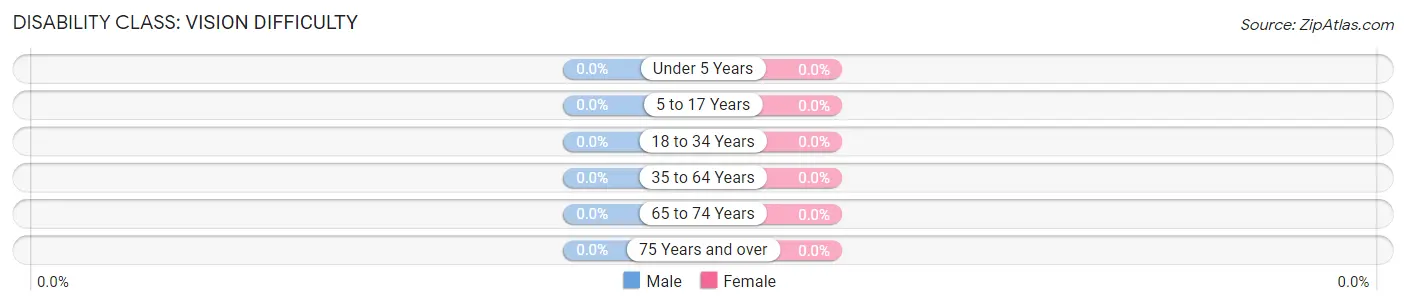
| Age Bracket | Male | Female |
| Under 5 Years | 0 (0.0%) | 0 (0.0%) |
| 5 to 17 Years | 0 (0.0%) | 0 (0.0%) |
| 18 to 34 Years | 0 (0.0%) | 0 (0.0%) |
| 35 to 64 Years | 0 (0.0%) | 0 (0.0%) |
| 65 to 74 Years | 0 (0.0%) | 0 (0.0%) |
| 75 Years and over | 0 (0.0%) | 0 (0.0%) |
Disability Class: Cognitive Difficulty
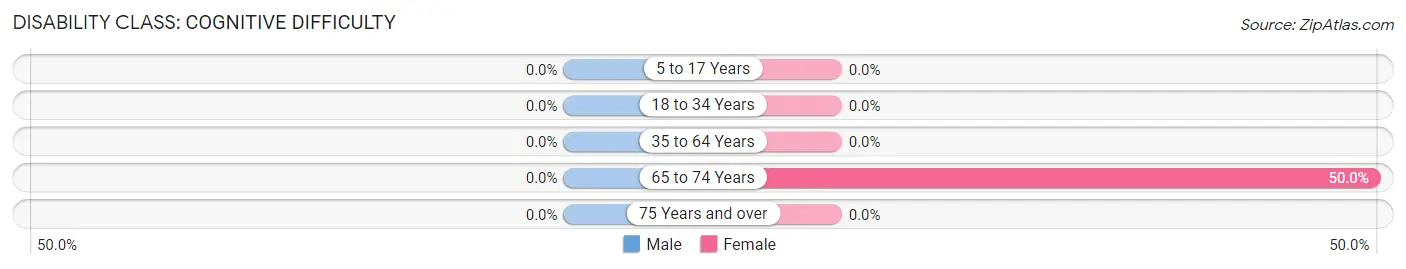
| Age Bracket | Male | Female |
| 5 to 17 Years | 0 (0.0%) | 0 (0.0%) |
| 18 to 34 Years | 0 (0.0%) | 0 (0.0%) |
| 35 to 64 Years | 0 (0.0%) | 0 (0.0%) |
| 65 to 74 Years | 0 (0.0%) | 1 (50.0%) |
| 75 Years and over | 0 (0.0%) | 0 (0.0%) |
Disability Class: Ambulatory Difficulty
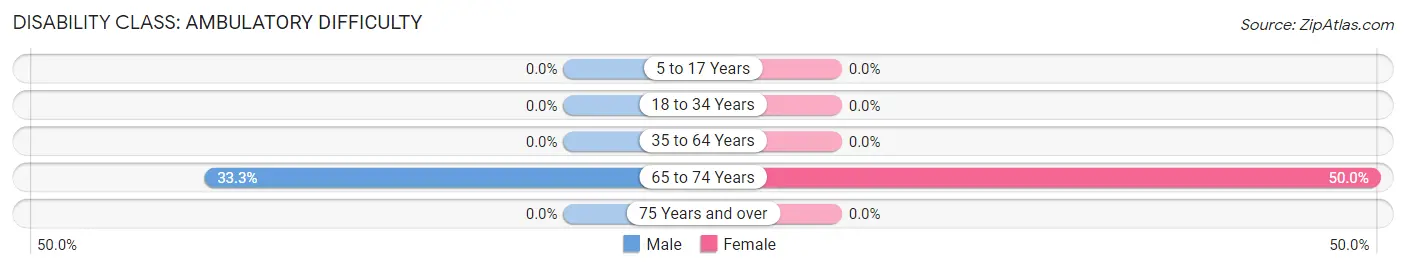
| Age Bracket | Male | Female |
| 5 to 17 Years | 0 (0.0%) | 0 (0.0%) |
| 18 to 34 Years | 0 (0.0%) | 0 (0.0%) |
| 35 to 64 Years | 0 (0.0%) | 0 (0.0%) |
| 65 to 74 Years | 1 (33.3%) | 1 (50.0%) |
| 75 Years and over | 0 (0.0%) | 0 (0.0%) |
Disability Class: Self-Care Difficulty
| Age Bracket | Male | Female |
| 5 to 17 Years | 0 (0.0%) | 0 (0.0%) |
| 18 to 34 Years | 0 (0.0%) | 0 (0.0%) |
| 35 to 64 Years | 0 (0.0%) | 0 (0.0%) |
| 65 to 74 Years | 0 (0.0%) | 0 (0.0%) |
| 75 Years and over | 0 (0.0%) | 0 (0.0%) |
Technology Access in Lebanon
Computing Device Access in Lebanon
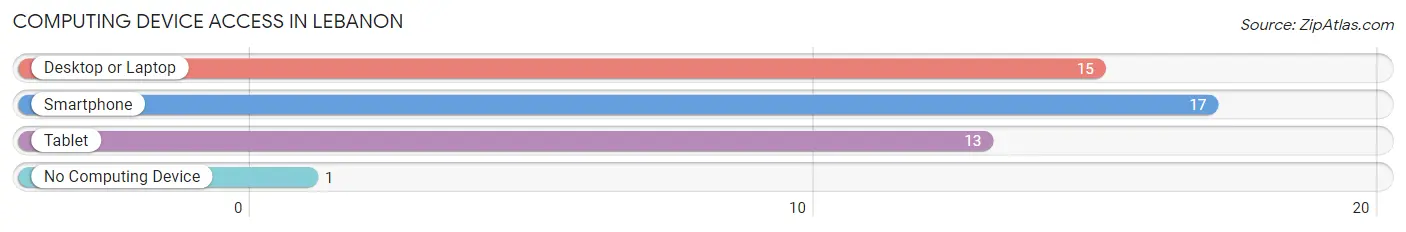
| Device Type | # Households | % Households |
| Desktop or Laptop | 15 | 62.5% |
| Smartphone | 17 | 70.8% |
| Tablet | 13 | 54.2% |
| No Computing Device | 1 | 4.2% |
| Total | 24 | 100.0% |
Internet Access in Lebanon
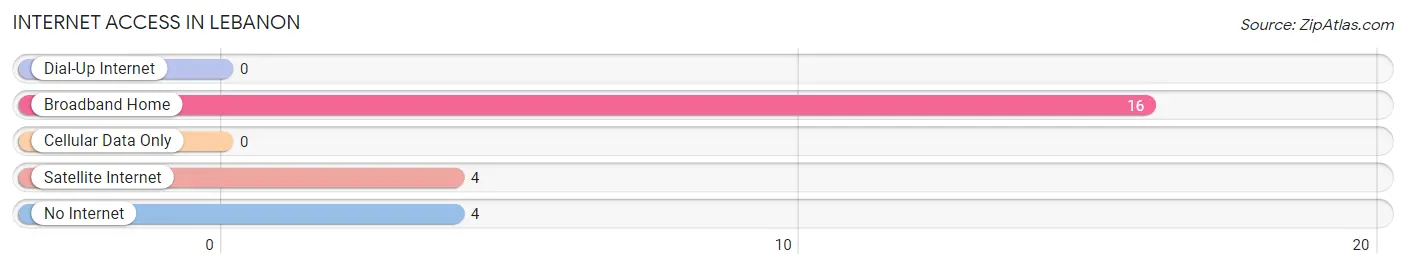
| Internet Type | # Households | % Households |
| Dial-Up Internet | 0 | 0.0% |
| Broadband Home | 16 | 66.7% |
| Cellular Data Only | 0 | 0.0% |
| Satellite Internet | 4 | 16.7% |
| No Internet | 4 | 16.7% |
| Total | 24 | 100.0% |
Lebanon Summary
Lebanon, South Dakota is a small town located in the southeastern corner of the state, just north of the Missouri River. It is part of the Sioux Falls metropolitan area and is home to a population of just over 1,000 people. The town was founded in 1883 and has a rich history of farming, ranching, and small business.
Geography
Lebanon is located in the southeastern corner of South Dakota, just north of the Missouri River. It is part of the Sioux Falls metropolitan area and is bordered by the towns of Sioux Falls, Brandon, and Harrisburg. The town is situated on a flat plain, with the Big Sioux River running through it. The town is surrounded by rolling hills and farmland, with the Big Sioux River providing a scenic backdrop.
The town is located in the Central Plains region of the United States, and is part of the Great Plains region. The climate is generally mild, with hot summers and cold winters. The average temperature in the summer is around 75 degrees Fahrenheit, and the average temperature in the winter is around 25 degrees Fahrenheit.
Economy
Lebanon’s economy is largely based on agriculture and small business. The town is home to several small businesses, including a grocery store, a hardware store, and a few restaurants. The town also has a few small manufacturing companies, including a furniture factory and a plastics factory.
The town is also home to several farms, which produce a variety of crops, including corn, soybeans, wheat, and hay. The town is also home to several ranches, which raise cattle, horses, and other livestock.
Demographics
As of the 2010 census, the population of Lebanon was 1,039. The population is predominantly white, with a small percentage of African Americans, Native Americans, and other races. The median age of the population is 43.7 years, and the median household income is $45,000.
The town is home to several churches, including the First Baptist Church, the United Methodist Church, and the Church of Jesus Christ of Latter-day Saints. The town also has a public library, a post office, and a few parks.
Conclusion
Lebanon, South Dakota is a small town located in the southeastern corner of the state, just north of the Missouri River. It is part of the Sioux Falls metropolitan area and is home to a population of just over 1,000 people. The town was founded in 1883 and has a rich history of farming, ranching, and small business. The town’s economy is largely based on agriculture and small business, and the population is predominantly white. The town is home to several churches, a public library, a post office, and a few parks.
Common Questions
What is Per Capita Income in Lebanon?
Per Capita income in Lebanon is $32,838.
What is the Median Family Income in Lebanon?
Median Family Income in Lebanon is $48,750.
What is the Median Household income in Lebanon?
Median Household Income in Lebanon is $58,750.
What is Income or Wage Gap in Lebanon?
Income or Wage Gap in Lebanon is 79.5%.
Women in Lebanon earn 20.5 cents for every dollar earned by a man.
What is Inequality or Gini Index in Lebanon?
Inequality or Gini Index in Lebanon is 0.51.
What is the Total Population of Lebanon?
Total Population of Lebanon is 78.
What is the Total Male Population of Lebanon?
Total Male Population of Lebanon is 24.
What is the Total Female Population of Lebanon?
Total Female Population of Lebanon is 54.
What is the Ratio of Males per 100 Females in Lebanon?
There are 44.44 Males per 100 Females in Lebanon.
What is the Ratio of Females per 100 Males in Lebanon?
There are 225.00 Females per 100 Males in Lebanon.
What is the Median Population Age in Lebanon?
Median Population Age in Lebanon is 29.8 Years.
What is the Average Family Size in Lebanon
Average Family Size in Lebanon is 3.4 People.
What is the Average Household Size in Lebanon
Average Household Size in Lebanon is 3.2 People.
How Large is the Labor Force in Lebanon?
There are 47 People in the Labor Forcein in Lebanon.
What is the Percentage of People in the Labor Force in Lebanon?
85.5% of People are in the Labor Force in Lebanon.