Gregory, SD Map & Demographics
Gregory Map
Gregory Overview
$28,856
PER CAPITA INCOME
$78,958
AVG FAMILY INCOME
$46,071
AVG HOUSEHOLD INCOME
14.2%
WAGE / INCOME GAP [ % ]
85.8¢/ $1
WAGE / INCOME GAP [ $ ]
0.44
INEQUALITY / GINI INDEX
1,393
TOTAL POPULATION
681
MALE POPULATION
712
FEMALE POPULATION
95.65
MALES / 100 FEMALES
104.55
FEMALES / 100 MALES
44.0
MEDIAN AGE
3.6
AVG FAMILY SIZE
2.3
AVG HOUSEHOLD SIZE
743
LABOR FORCE [ PEOPLE ]
68.7%
PERCENT IN LABOR FORCE
3.1%
UNEMPLOYMENT RATE
Gregory Zip Codes
Gregory Area Codes
Income in Gregory
Income Overview in Gregory
Per Capita Income in Gregory is $28,856, while median incomes of families and households are $78,958 and $46,071 respectively.
| Characteristic | Number | Measure |
| Per Capita Income | 1,393 | $28,856 |
| Median Family Income | 283 | $78,958 |
| Mean Family Income | 283 | $88,418 |
| Median Household Income | 584 | $46,071 |
| Mean Household Income | 584 | $65,180 |
| Income Deficit | 283 | $0 |
| Wage / Income Gap (%) | 1,393 | 14.16% |
| Wage / Income Gap ($) | 1,393 | 85.84¢ per $1 |
| Gini / Inequality Index | 1,393 | 0.44 |
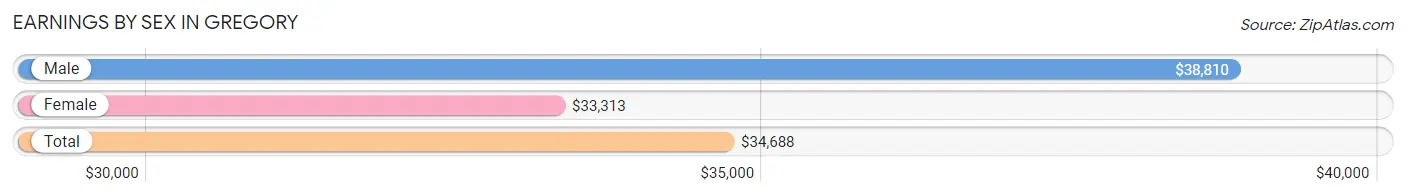
Earnings by Sex in Gregory
Average Earnings in Gregory are $34,688, $38,810 for men and $33,313 for women, a difference of 14.2%.
| Sex | Number | Average Earnings |
| Male | 390 (50.3%) | $38,810 |
| Female | 385 (49.7%) | $33,313 |
| Total | 775 (100.0%) | $34,688 |
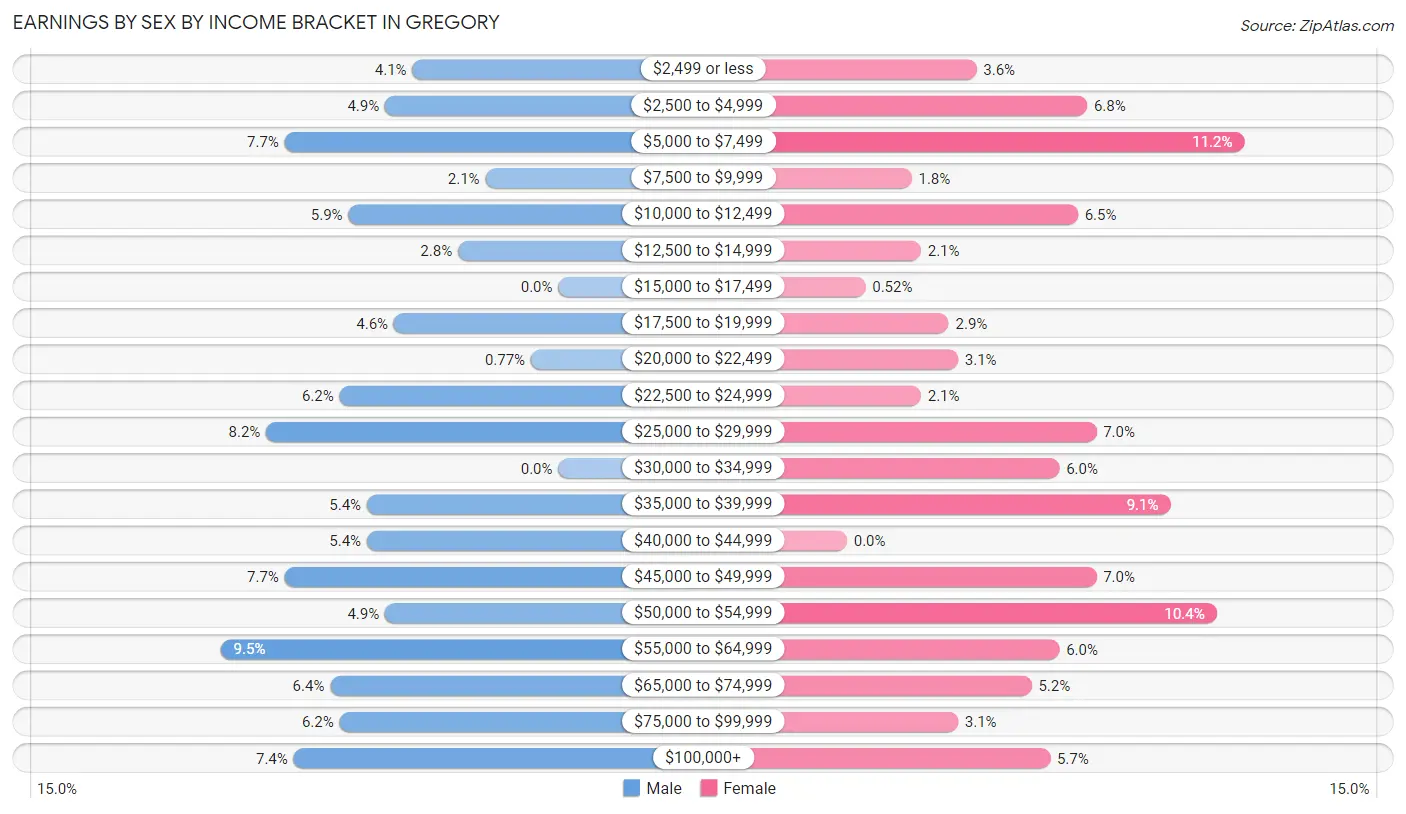
Earnings by Sex by Income Bracket in Gregory
The most common earnings brackets in Gregory are $55,000 to $64,999 for men (37 | 9.5%) and $5,000 to $7,499 for women (43 | 11.2%).
| Income | Male | Female |
| $2,499 or less | 16 (4.1%) | 14 (3.6%) |
| $2,500 to $4,999 | 19 (4.9%) | 26 (6.8%) |
| $5,000 to $7,499 | 30 (7.7%) | 43 (11.2%) |
| $7,500 to $9,999 | 8 (2.1%) | 7 (1.8%) |
| $10,000 to $12,499 | 23 (5.9%) | 25 (6.5%) |
| $12,500 to $14,999 | 11 (2.8%) | 8 (2.1%) |
| $15,000 to $17,499 | 0 (0.0%) | 2 (0.5%) |
| $17,500 to $19,999 | 18 (4.6%) | 11 (2.9%) |
| $20,000 to $22,499 | 3 (0.8%) | 12 (3.1%) |
| $22,500 to $24,999 | 24 (6.1%) | 8 (2.1%) |
| $25,000 to $29,999 | 32 (8.2%) | 27 (7.0%) |
| $30,000 to $34,999 | 0 (0.0%) | 23 (6.0%) |
| $35,000 to $39,999 | 21 (5.4%) | 35 (9.1%) |
| $40,000 to $44,999 | 21 (5.4%) | 0 (0.0%) |
| $45,000 to $49,999 | 30 (7.7%) | 27 (7.0%) |
| $50,000 to $54,999 | 19 (4.9%) | 40 (10.4%) |
| $55,000 to $64,999 | 37 (9.5%) | 23 (6.0%) |
| $65,000 to $74,999 | 25 (6.4%) | 20 (5.2%) |
| $75,000 to $99,999 | 24 (6.1%) | 12 (3.1%) |
| $100,000+ | 29 (7.4%) | 22 (5.7%) |
| Total | 390 (100.0%) | 385 (100.0%) |
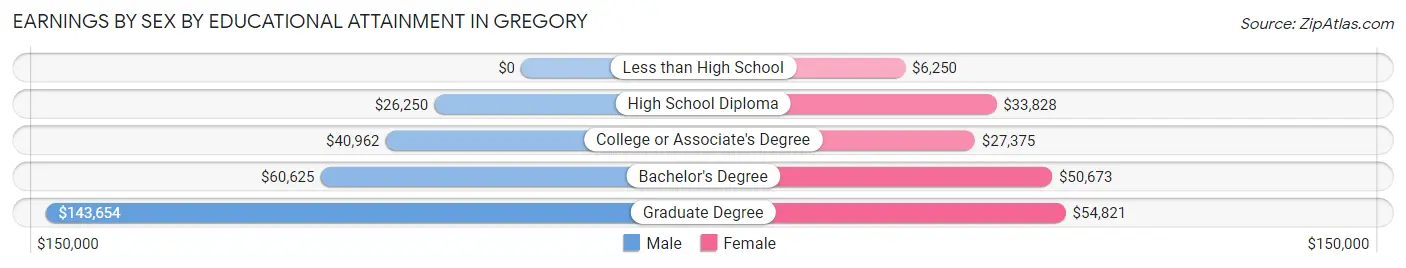
Earnings by Sex by Educational Attainment in Gregory
Average earnings in Gregory are $40,583 for men and $34,375 for women, a difference of 15.3%. Men with an educational attainment of graduate degree enjoy the highest average annual earnings of $143,654, while those with high school diploma education earn the least with $26,250. Women with an educational attainment of graduate degree earn the most with the average annual earnings of $54,821, while those with less than high school education have the smallest earnings of $6,250.
| Educational Attainment | Male Income | Female Income |
| Less than High School | - | - |
| High School Diploma | $26,250 | $33,828 |
| College or Associate's Degree | $40,962 | $27,375 |
| Bachelor's Degree | $60,625 | $50,673 |
| Graduate Degree | $143,654 | $54,821 |
| Total | $40,583 | $34,375 |
Family Income in Gregory
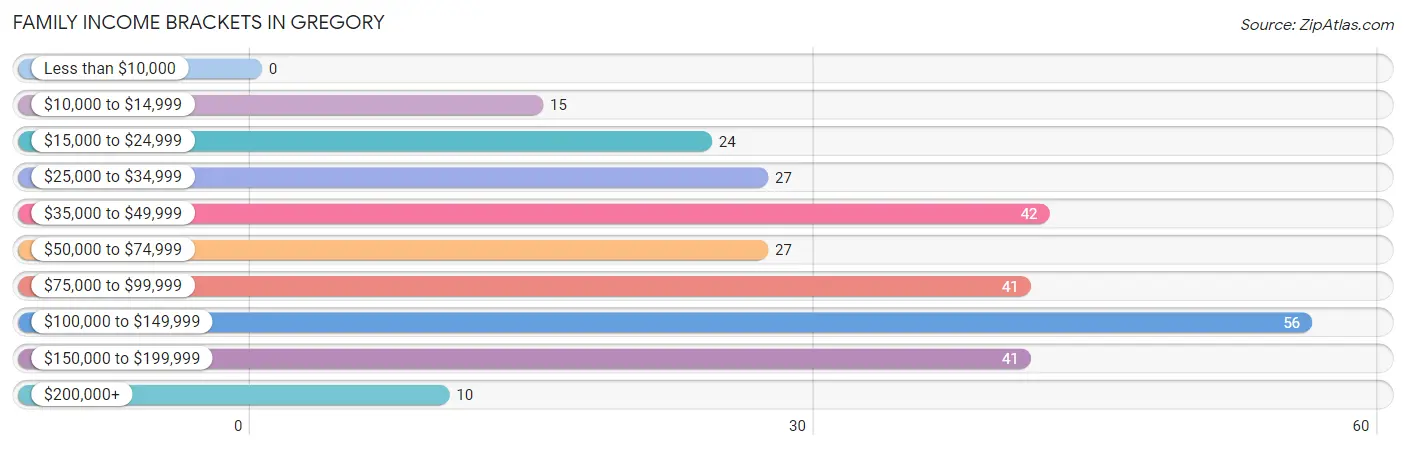
Family Income Brackets in Gregory
According to the Gregory family income data, there are 56 families falling into the $100,000 to $149,999 income range, which is the most common income bracket and makes up 19.8% of all families.
| Income Bracket | # Families | % Families |
| Less than $10,000 | 0 | 0.0% |
| $10,000 to $14,999 | 15 | 5.3% |
| $15,000 to $24,999 | 24 | 8.5% |
| $25,000 to $34,999 | 27 | 9.5% |
| $35,000 to $49,999 | 42 | 14.8% |
| $50,000 to $74,999 | 27 | 9.5% |
| $75,000 to $99,999 | 41 | 14.5% |
| $100,000 to $149,999 | 56 | 19.8% |
| $150,000 to $199,999 | 41 | 14.5% |
| $200,000+ | 10 | 3.5% |
Family Income by Famaliy Size in Gregory
4-person families (52 | 18.4%) account for the highest median family income in Gregory with $140,625 per family, while 4-person families (52 | 18.4%) have the highest median income of $35,156 per family member.

| Income Bracket | # Families | Median Income |
| 2-Person Families | 158 (55.8%) | $55,833 |
| 3-Person Families | 38 (13.4%) | $63,750 |
| 4-Person Families | 52 (18.4%) | $140,625 |
| 5-Person Families | 32 (11.3%) | $113,125 |
| 6-Person Families | 3 (1.1%) | $0 |
| 7+ Person Families | 0 (0.0%) | $0 |
| Total | 283 (100.0%) | $78,958 |
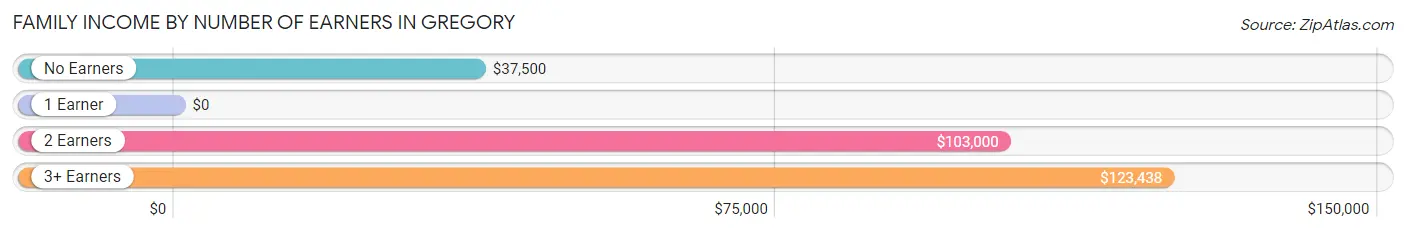
Family Income by Number of Earners in Gregory
| Number of Earners | # Families | Median Income |
| No Earners | 38 (13.4%) | $37,500 |
| 1 Earner | 62 (21.9%) | $0 |
| 2 Earners | 152 (53.7%) | $103,000 |
| 3+ Earners | 31 (11.0%) | $123,438 |
| Total | 283 (100.0%) | $78,958 |
Household Income in Gregory
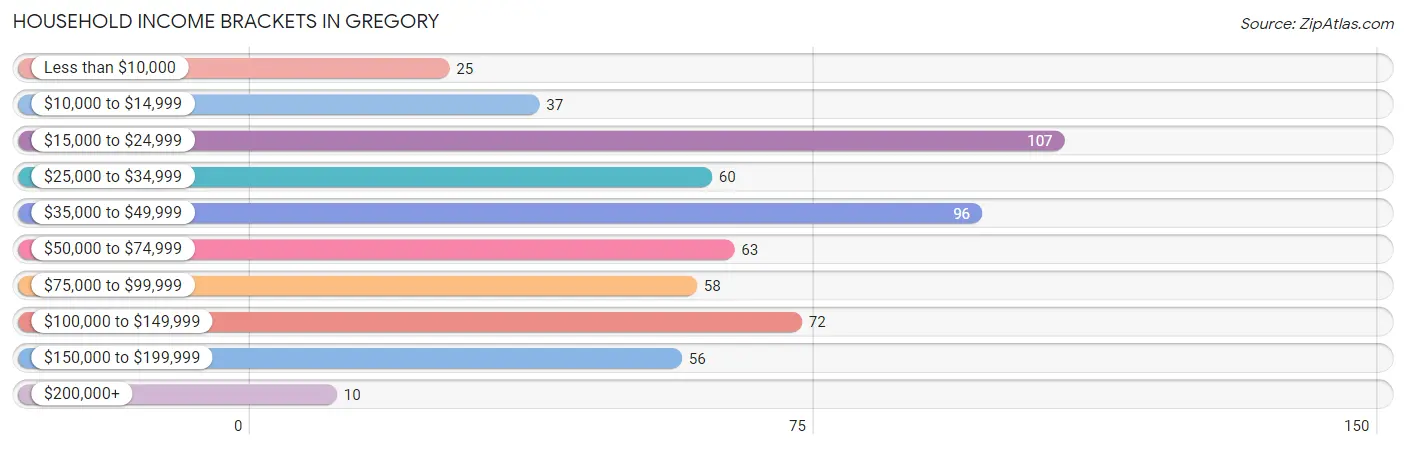
Household Income Brackets in Gregory
With 107 households falling in the category, the $15,000 to $24,999 income range is the most frequent in Gregory, accounting for 18.3% of all households. In contrast, only 10 households (1.7%) fall into the $200,000+ income bracket, making it the least populous group.
| Income Bracket | # Households | % Households |
| Less than $10,000 | 25 | 4.3% |
| $10,000 to $14,999 | 37 | 6.3% |
| $15,000 to $24,999 | 107 | 18.3% |
| $25,000 to $34,999 | 60 | 10.3% |
| $35,000 to $49,999 | 96 | 16.4% |
| $50,000 to $74,999 | 63 | 10.8% |
| $75,000 to $99,999 | 58 | 9.9% |
| $100,000 to $149,999 | 72 | 12.3% |
| $150,000 to $199,999 | 56 | 9.6% |
| $200,000+ | 10 | 1.7% |
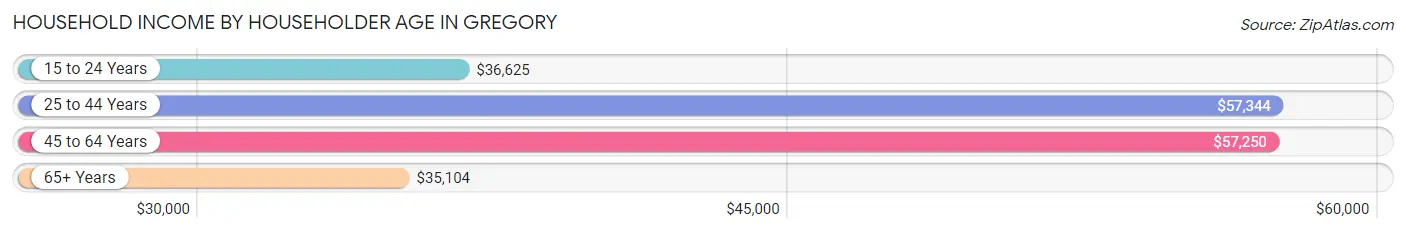
Household Income by Householder Age in Gregory
The median household income in Gregory is $46,071, with the highest median household income of $57,344 found in the 25 to 44 years age bracket for the primary householder. A total of 143 households (24.5%) fall into this category. Meanwhile, the 65+ years age bracket for the primary householder has the lowest median household income of $35,104, with 205 households (35.1%) in this group.
| Income Bracket | # Households | Median Income |
| 15 to 24 Years | 19 (3.3%) | $36,625 |
| 25 to 44 Years | 143 (24.5%) | $57,344 |
| 45 to 64 Years | 217 (37.2%) | $57,250 |
| 65+ Years | 205 (35.1%) | $35,104 |
| Total | 584 (100.0%) | $46,071 |
Poverty in Gregory
Income Below Poverty by Sex and Age in Gregory
With 12.5% poverty level for males and 10.2% for females among the residents of Gregory, 35 to 44 year old males and 16 and 17 year old females are the most vulnerable to poverty, with 46 males (45.5%) and 9 females (52.9%) in their respective age groups living below the poverty level.

| Age Bracket | Male | Female |
| Under 5 Years | 8 (27.6%) | 0 (0.0%) |
| 5 Years | 0 (0.0%) | 0 (0.0%) |
| 6 to 11 Years | 0 (0.0%) | 0 (0.0%) |
| 12 to 14 Years | 0 (0.0%) | 0 (0.0%) |
| 15 Years | 0 (0.0%) | 4 (13.3%) |
| 16 and 17 Years | 0 (0.0%) | 9 (52.9%) |
| 18 to 24 Years | 9 (37.5%) | 6 (9.4%) |
| 25 to 34 Years | 12 (15.4%) | 0 (0.0%) |
| 35 to 44 Years | 46 (45.5%) | 2 (2.8%) |
| 45 to 54 Years | 0 (0.0%) | 2 (2.2%) |
| 55 to 64 Years | 8 (8.8%) | 10 (8.4%) |
| 65 to 74 Years | 0 (0.0%) | 14 (19.4%) |
| 75 Years and over | 0 (0.0%) | 22 (31.9%) |
| Total | 83 (12.5%) | 69 (10.2%) |
Income Above Poverty by Sex and Age in Gregory
According to the poverty statistics in Gregory, males aged 5 years and females aged under 5 years are the age groups that are most secure financially, with 100.0% of males and 100.0% of females in these age groups living above the poverty line.
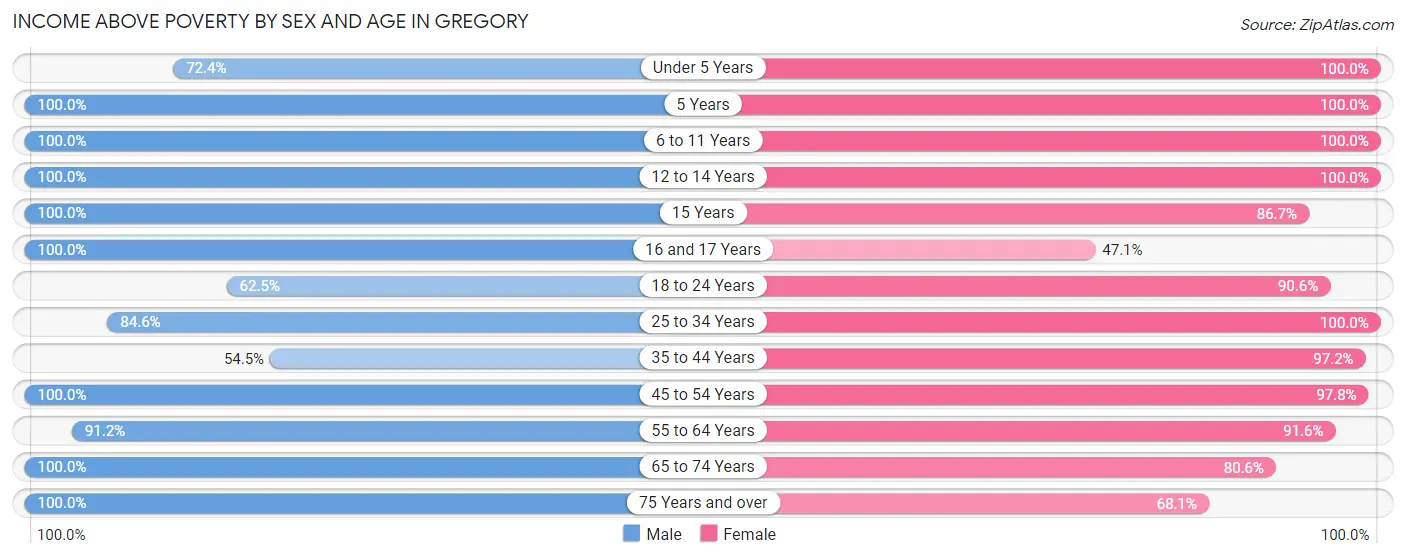
| Age Bracket | Male | Female |
| Under 5 Years | 21 (72.4%) | 45 (100.0%) |
| 5 Years | 11 (100.0%) | 14 (100.0%) |
| 6 to 11 Years | 49 (100.0%) | 49 (100.0%) |
| 12 to 14 Years | 31 (100.0%) | 11 (100.0%) |
| 15 Years | 43 (100.0%) | 26 (86.7%) |
| 16 and 17 Years | 15 (100.0%) | 8 (47.1%) |
| 18 to 24 Years | 15 (62.5%) | 58 (90.6%) |
| 25 to 34 Years | 66 (84.6%) | 28 (100.0%) |
| 35 to 44 Years | 55 (54.5%) | 69 (97.2%) |
| 45 to 54 Years | 63 (100.0%) | 87 (97.8%) |
| 55 to 64 Years | 83 (91.2%) | 109 (91.6%) |
| 65 to 74 Years | 98 (100.0%) | 58 (80.6%) |
| 75 Years and over | 32 (100.0%) | 47 (68.1%) |
| Total | 582 (87.5%) | 609 (89.8%) |
Income Below Poverty Among Married-Couple Families in Gregory
The poverty statistics for married-couple families in Gregory show that 2.2% or 5 of the total 230 families live below the poverty line. Families with no children have the highest poverty rate of 3.8%, comprising of 5 families. On the other hand, families with 1 or 2 children have the lowest poverty rate of 0.0%, which includes 0 families.
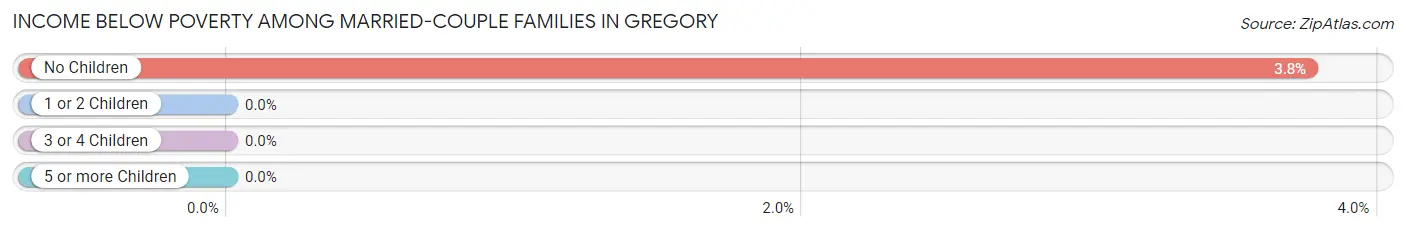
| Children | Above Poverty | Below Poverty |
| No Children | 128 (96.2%) | 5 (3.8%) |
| 1 or 2 Children | 75 (100.0%) | 0 (0.0%) |
| 3 or 4 Children | 22 (100.0%) | 0 (0.0%) |
| 5 or more Children | 0 (0.0%) | 0 (0.0%) |
| Total | 225 (97.8%) | 5 (2.2%) |
Income Below Poverty Among Single-Parent Households in Gregory
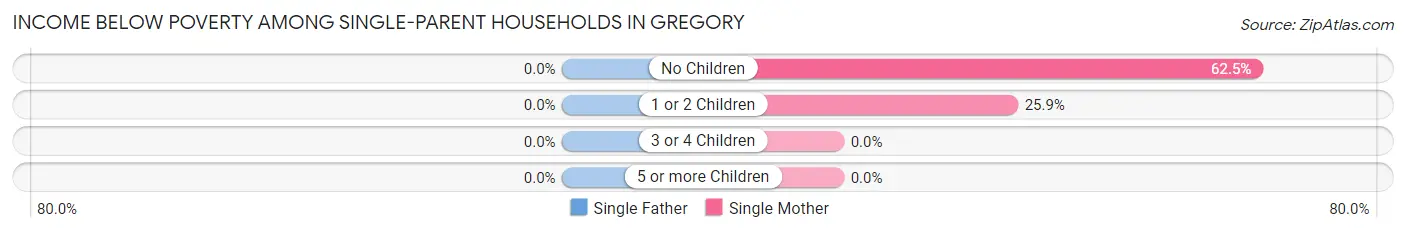
| Children | Single Father | Single Mother |
| No Children | 0 (0.0%) | 10 (62.5%) |
| 1 or 2 Children | 0 (0.0%) | 7 (25.9%) |
| 3 or 4 Children | 0 (0.0%) | 0 (0.0%) |
| 5 or more Children | 0 (0.0%) | 0 (0.0%) |
| Total | 0 (0.0%) | 17 (39.5%) |
Income Below Poverty Among Married-Couple vs Single-Parent Households in Gregory
The poverty data for Gregory shows that 5 of the married-couple family households (2.2%) and 17 of the single-parent households (32.1%) are living below the poverty level. Within the married-couple family households, those with no children have the highest poverty rate, with 5 households (3.8%) falling below the poverty line. Among the single-parent households, those with no children have the highest poverty rate, with 10 household (62.5%) living below poverty.
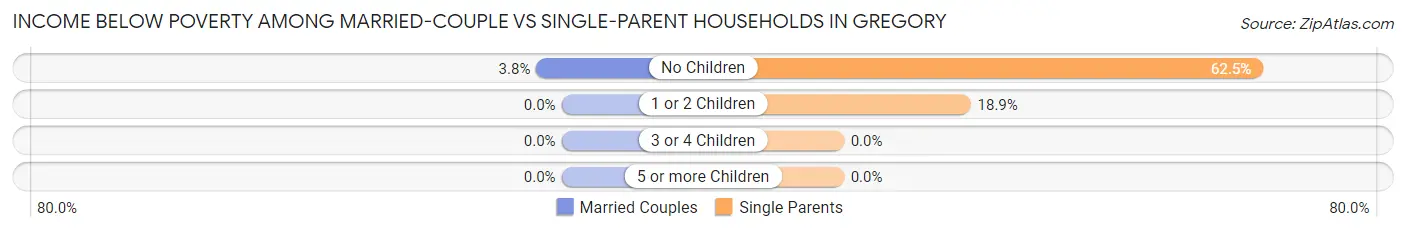
| Children | Married-Couple Families | Single-Parent Households |
| No Children | 5 (3.8%) | 10 (62.5%) |
| 1 or 2 Children | 0 (0.0%) | 7 (18.9%) |
| 3 or 4 Children | 0 (0.0%) | 0 (0.0%) |
| 5 or more Children | 0 (0.0%) | 0 (0.0%) |
| Total | 5 (2.2%) | 17 (32.1%) |
Race in Gregory
The most populous races in Gregory are White / Caucasian (1,249 | 89.7%), Two or more Races (85 | 6.1%), and Hispanic or Latino (77 | 5.5%).
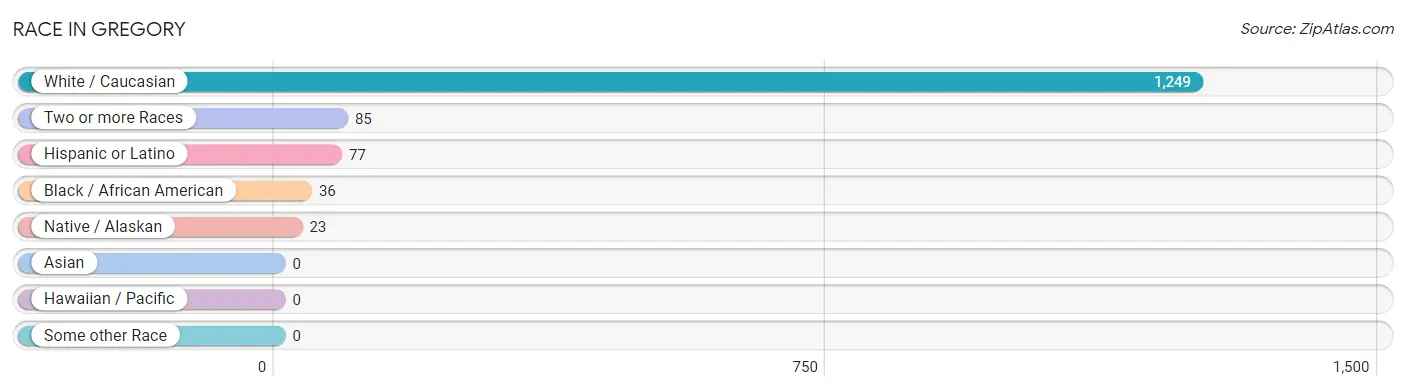
| Race | # Population | % Population |
| Asian | 0 | 0.0% |
| Black / African American | 36 | 2.6% |
| Hawaiian / Pacific | 0 | 0.0% |
| Hispanic or Latino | 77 | 5.5% |
| Native / Alaskan | 23 | 1.7% |
| White / Caucasian | 1,249 | 89.7% |
| Two or more Races | 85 | 6.1% |
| Some other Race | 0 | 0.0% |
| Total | 1,393 | 100.0% |
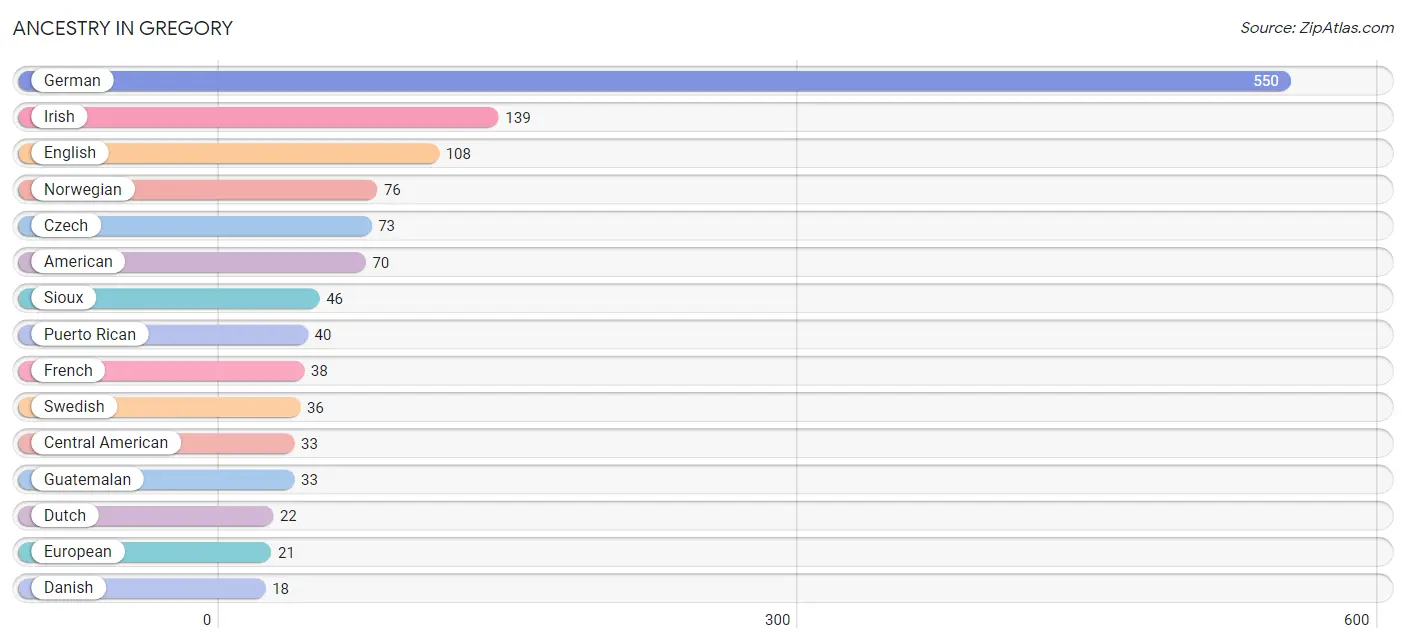
Ancestry in Gregory
The most populous ancestries reported in Gregory are German (550 | 39.5%), Irish (139 | 10.0%), English (108 | 7.7%), Norwegian (76 | 5.5%), and Czech (73 | 5.2%), together accounting for 67.9% of all Gregory residents.
| Ancestry | # Population | % Population |
| American | 70 | 5.0% |
| Austrian | 1 | 0.1% |
| Belgian | 3 | 0.2% |
| British | 6 | 0.4% |
| Cajun | 1 | 0.1% |
| Central American | 33 | 2.4% |
| Central American Indian | 6 | 0.4% |
| Cherokee | 6 | 0.4% |
| Czech | 73 | 5.2% |
| Czechoslovakian | 12 | 0.9% |
| Danish | 18 | 1.3% |
| Dutch | 22 | 1.6% |
| Eastern European | 3 | 0.2% |
| English | 108 | 7.7% |
| European | 21 | 1.5% |
| French | 38 | 2.7% |
| German | 550 | 39.5% |
| Guatemalan | 33 | 2.4% |
| Irish | 139 | 10.0% |
| Italian | 3 | 0.2% |
| Korean | 10 | 0.7% |
| Norwegian | 76 | 5.5% |
| Pennsylvania German | 2 | 0.1% |
| Polish | 11 | 0.8% |
| Puerto Rican | 40 | 2.9% |
| Russian | 15 | 1.1% |
| Scandinavian | 6 | 0.4% |
| Scotch-Irish | 12 | 0.9% |
| Sioux | 46 | 3.3% |
| Spanish | 4 | 0.3% |
| Sri Lankan | 2 | 0.1% |
| Swedish | 36 | 2.6% |
| Welsh | 4 | 0.3% | View All 33 Rows |
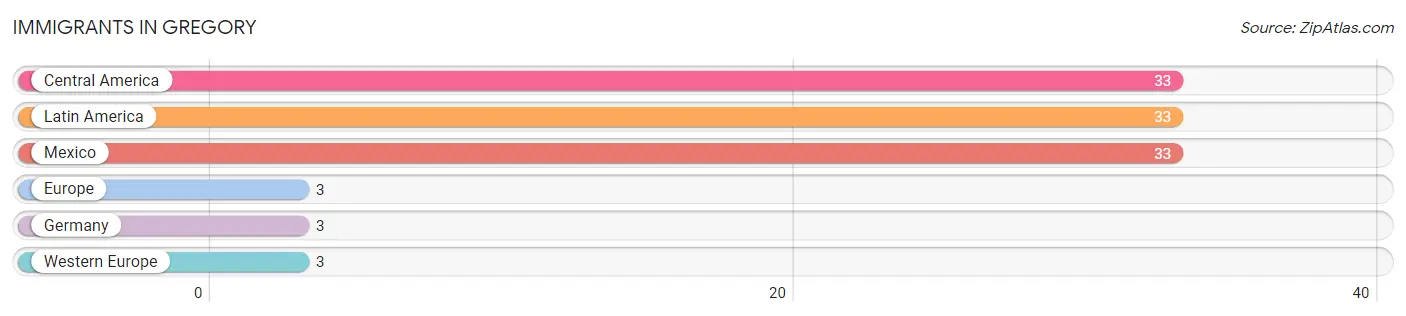
Immigrants in Gregory
The most numerous immigrant groups reported in Gregory came from Central America (33 | 2.4%), Latin America (33 | 2.4%), Mexico (33 | 2.4%), Europe (3 | 0.2%), and Germany (3 | 0.2%), together accounting for 7.5% of all Gregory residents.
| Immigration Origin | # Population | % Population |
| Central America | 33 | 2.4% |
| Europe | 3 | 0.2% |
| Germany | 3 | 0.2% |
| Latin America | 33 | 2.4% |
| Mexico | 33 | 2.4% |
| Western Europe | 3 | 0.2% | View All 6 Rows |
Sex and Age in Gregory
Sex and Age in Gregory
The most populous age groups in Gregory are 65 to 69 Years (74 | 10.9%) for men and 15 to 19 Years (95 | 13.3%) for women.
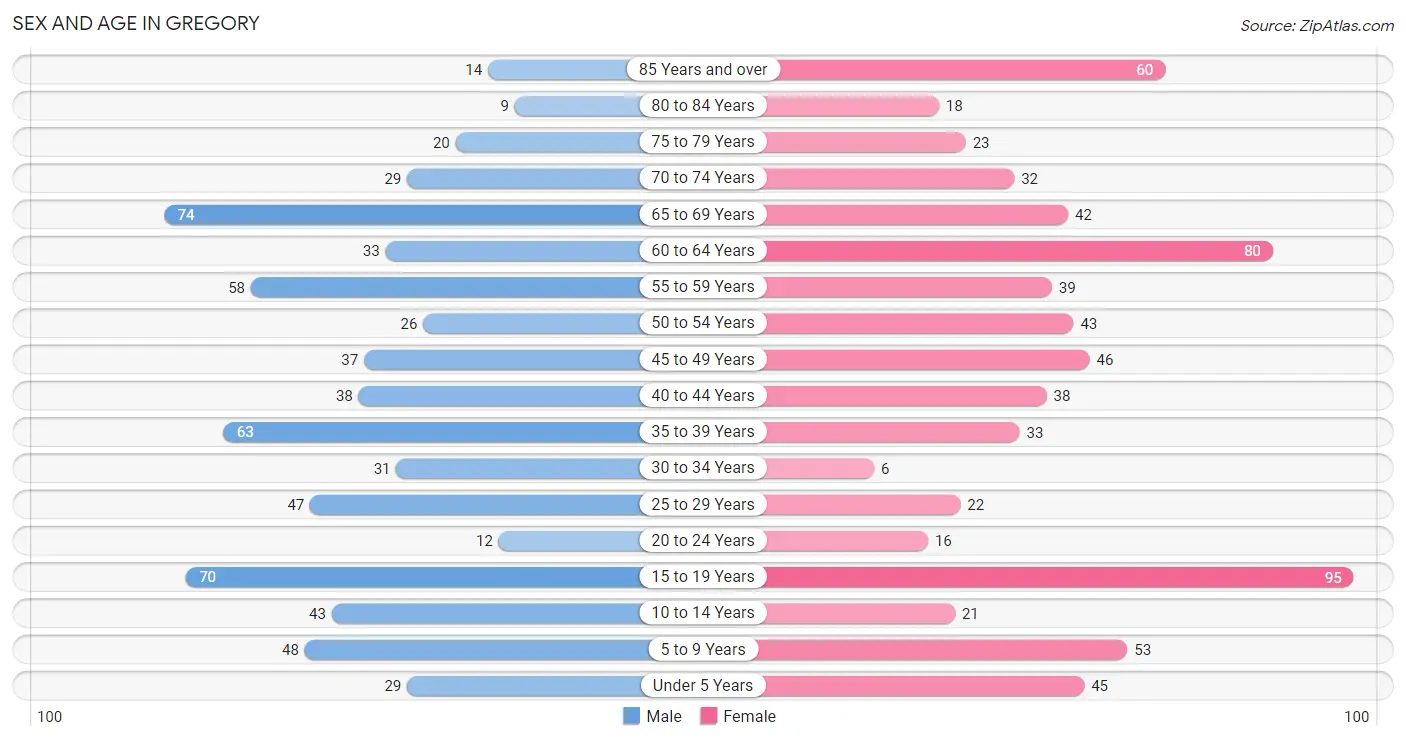
| Age Bracket | Male | Female |
| Under 5 Years | 29 (4.3%) | 45 (6.3%) |
| 5 to 9 Years | 48 (7.0%) | 53 (7.4%) |
| 10 to 14 Years | 43 (6.3%) | 21 (2.9%) |
| 15 to 19 Years | 70 (10.3%) | 95 (13.3%) |
| 20 to 24 Years | 12 (1.8%) | 16 (2.2%) |
| 25 to 29 Years | 47 (6.9%) | 22 (3.1%) |
| 30 to 34 Years | 31 (4.5%) | 6 (0.8%) |
| 35 to 39 Years | 63 (9.2%) | 33 (4.6%) |
| 40 to 44 Years | 38 (5.6%) | 38 (5.3%) |
| 45 to 49 Years | 37 (5.4%) | 46 (6.5%) |
| 50 to 54 Years | 26 (3.8%) | 43 (6.0%) |
| 55 to 59 Years | 58 (8.5%) | 39 (5.5%) |
| 60 to 64 Years | 33 (4.9%) | 80 (11.2%) |
| 65 to 69 Years | 74 (10.9%) | 42 (5.9%) |
| 70 to 74 Years | 29 (4.3%) | 32 (4.5%) |
| 75 to 79 Years | 20 (2.9%) | 23 (3.2%) |
| 80 to 84 Years | 9 (1.3%) | 18 (2.5%) |
| 85 Years and over | 14 (2.1%) | 60 (8.4%) |
| Total | 681 (100.0%) | 712 (100.0%) |
Families and Households in Gregory
Median Family Size in Gregory
The median family size in Gregory is 3.60 persons per family, with married-couple families (230 | 81.3%) accounting for the largest median family size of 3.71 persons per family. On the other hand, single male/father families (10 | 3.5%) represent the smallest median family size with 3.00 persons per family.
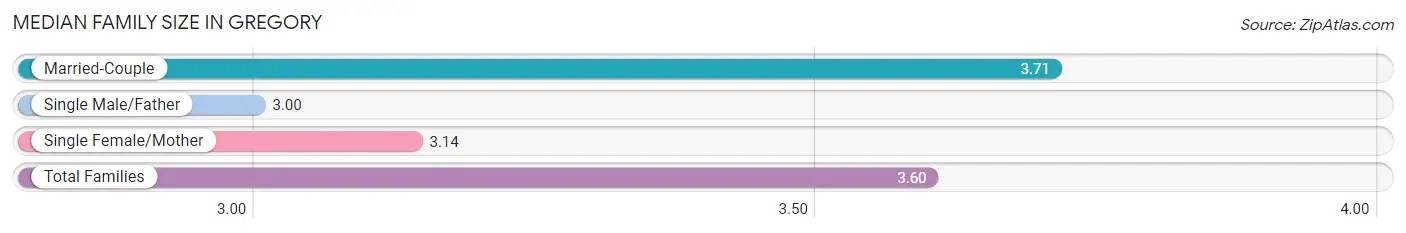
| Family Type | # Families | Family Size |
| Married-Couple | 230 (81.3%) | 3.71 |
| Single Male/Father | 10 (3.5%) | 3.00 |
| Single Female/Mother | 43 (15.2%) | 3.14 |
| Total Families | 283 (100.0%) | 3.60 |
Median Household Size in Gregory
The median household size in Gregory is 2.30 persons per household, with married-couple households (230 | 39.4%) accounting for the largest median household size of 3.71 persons per household. non-family households (301 | 51.5%) represent the smallest median household size with 1.05 persons per household.
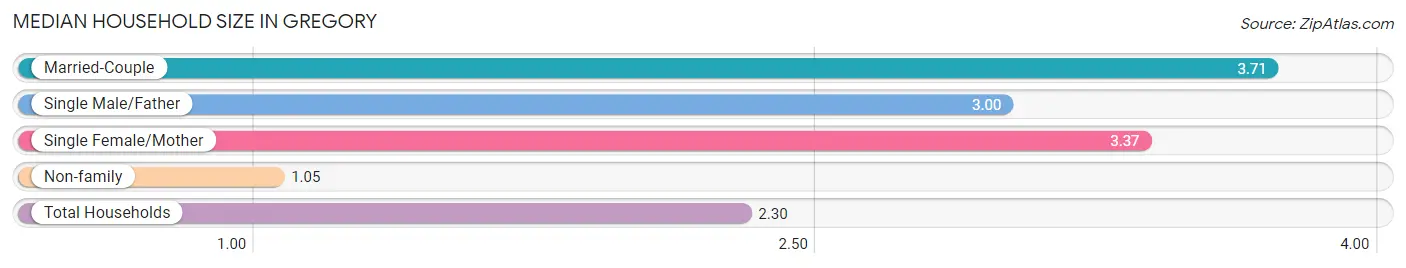
| Household Type | # Households | Household Size |
| Married-Couple | 230 (39.4%) | 3.71 |
| Single Male/Father | 10 (1.7%) | 3.00 |
| Single Female/Mother | 43 (7.4%) | 3.37 |
| Non-family | 301 (51.5%) | 1.05 |
| Total Households | 584 (100.0%) | 2.30 |
Household Size by Marriage Status in Gregory
Out of a total of 584 households in Gregory, 283 (48.5%) are family households, while 301 (51.5%) are nonfamily households. The most numerous type of family households are 2-person households, comprising 158, and the most common type of nonfamily households are 1-person households, comprising 282.
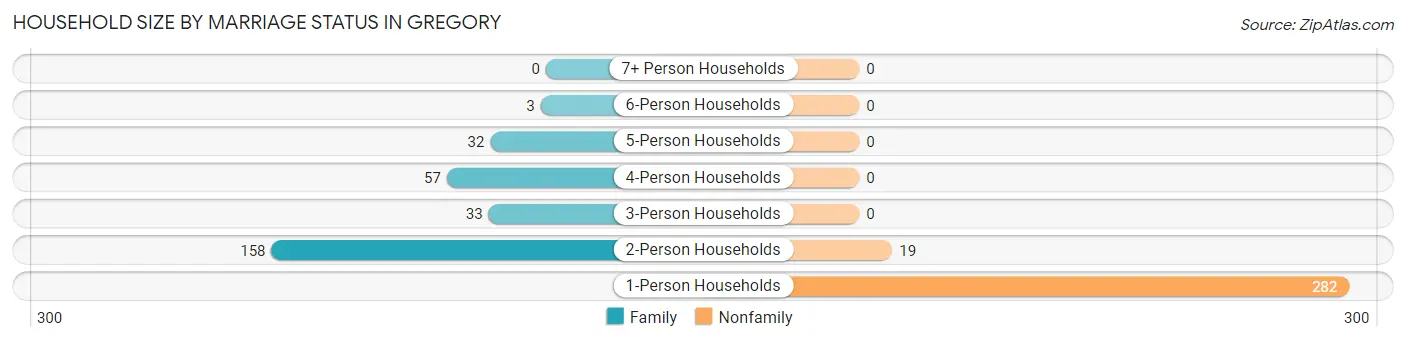
| Household Size | Family Households | Nonfamily Households |
| 1-Person Households | - | 282 (48.3%) |
| 2-Person Households | 158 (27.1%) | 19 (3.3%) |
| 3-Person Households | 33 (5.7%) | 0 (0.0%) |
| 4-Person Households | 57 (9.8%) | 0 (0.0%) |
| 5-Person Households | 32 (5.5%) | 0 (0.0%) |
| 6-Person Households | 3 (0.5%) | 0 (0.0%) |
| 7+ Person Households | 0 (0.0%) | 0 (0.0%) |
| Total | 283 (48.5%) | 301 (51.5%) |
Female Fertility in Gregory
Fertility by Age in Gregory
Average fertility rate in Gregory is 26.0 births per 1,000 women. Women in the age bracket of 20 to 34 years have the highest fertility rate with 68.0 births per 1,000 women. Women in the age bracket of 35 to 50 years acount for 57.1% of all women with births.
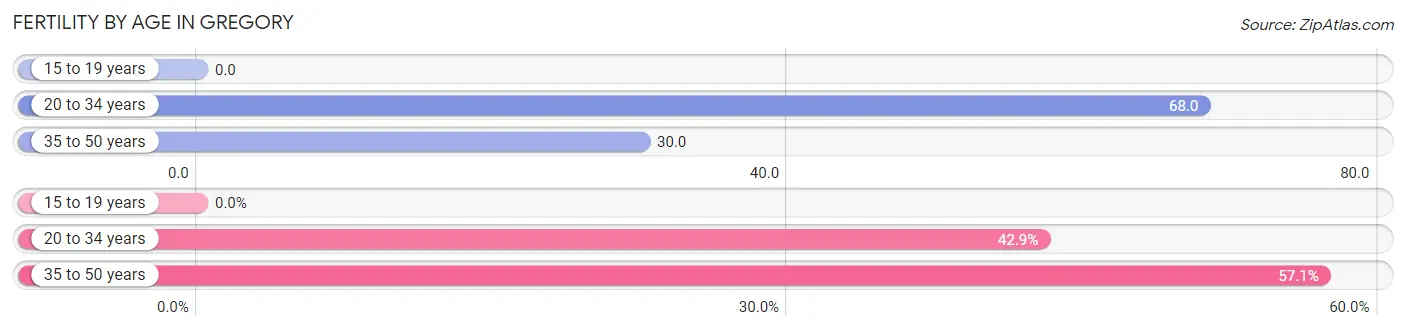
| Age Bracket | Women with Births | Births / 1,000 Women |
| 15 to 19 years | 0 (0.0%) | 0.0 |
| 20 to 34 years | 3 (42.9%) | 68.0 |
| 35 to 50 years | 4 (57.1%) | 30.0 |
| Total | 7 (100.0%) | 26.0 |
Fertility by Age by Marriage Status in Gregory
57.1% of women with births (7) in Gregory are married. The highest percentage of unmarried women with births falls into 20 to 34 years age bracket with 100.0% of them unmarried at the time of birth, while the lowest percentage of unmarried women with births belong to 35 to 50 years age bracket with 0.0% of them unmarried.
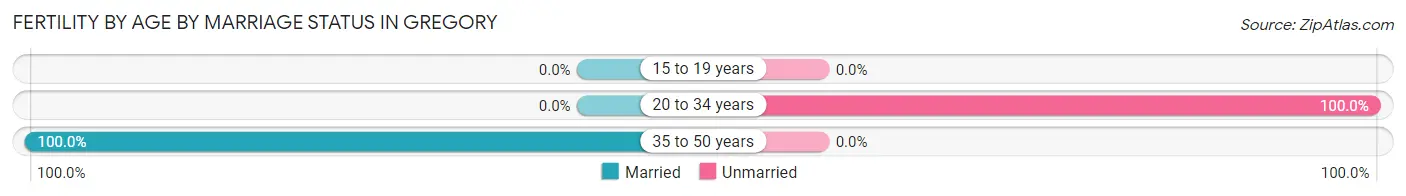
| Age Bracket | Married | Unmarried |
| 15 to 19 years | 0 (0.0%) | 0 (0.0%) |
| 20 to 34 years | 0 (0.0%) | 3 (100.0%) |
| 35 to 50 years | 4 (100.0%) | 0 (0.0%) |
| Total | 4 (57.1%) | 3 (42.9%) |
Fertility by Education in Gregory
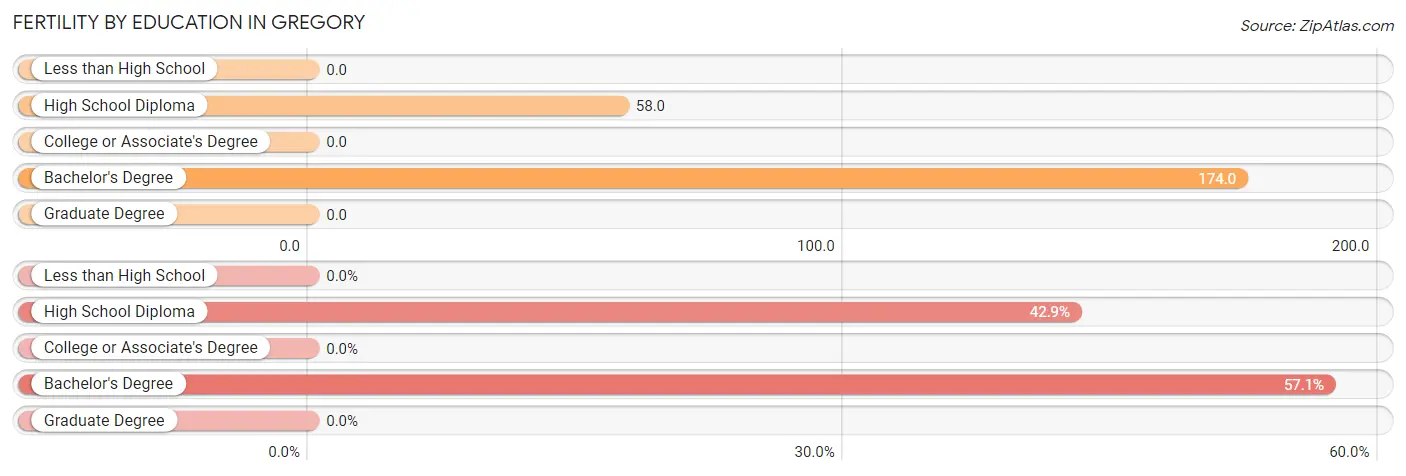
| Educational Attainment | Women with Births | Births / 1,000 Women |
| Less than High School | 0 (0.0%) | 0.0 |
| High School Diploma | 3 (42.9%) | 58.0 |
| College or Associate's Degree | 0 (0.0%) | 0.0 |
| Bachelor's Degree | 4 (57.1%) | 174.0 |
| Graduate Degree | 0 (0.0%) | 0.0 |
| Total | 7 (100.0%) | 26.0 |
Fertility by Education by Marriage Status in Gregory
42.9% of women with births in Gregory are unmarried. Women with the educational attainment of bachelor's degree are most likely to be married with 100.0% of them married at childbirth, while women with the educational attainment of high school diploma are least likely to be married with 100.0% of them unmarried at childbirth.
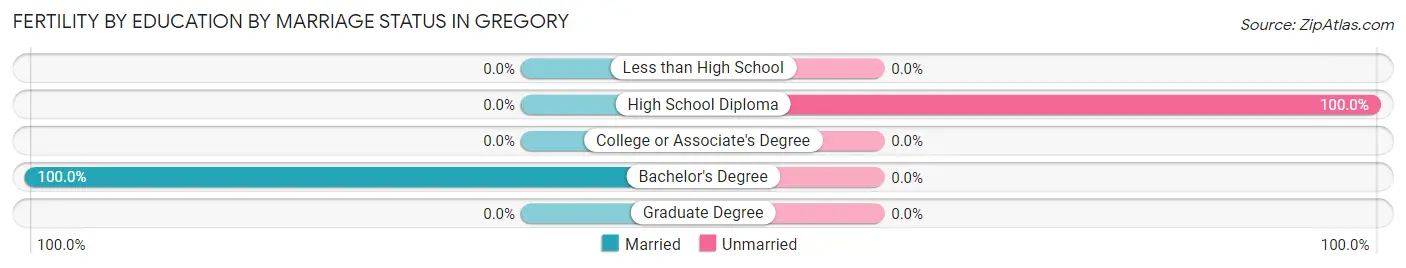
| Educational Attainment | Married | Unmarried |
| Less than High School | 0 (0.0%) | 0 (0.0%) |
| High School Diploma | 0 (0.0%) | 3 (100.0%) |
| College or Associate's Degree | 0 (0.0%) | 0 (0.0%) |
| Bachelor's Degree | 4 (100.0%) | 0 (0.0%) |
| Graduate Degree | 0 (0.0%) | 0 (0.0%) |
| Total | 4 (57.1%) | 3 (42.9%) |
Employment Characteristics in Gregory
Employment by Class of Employer in Gregory
Among the 693 employed individuals in Gregory, private company employees (381 | 55.0%), local government employees (83 | 12.0%), and self-employed (not incorporated) (82 | 11.8%) make up the most common classes of employment.
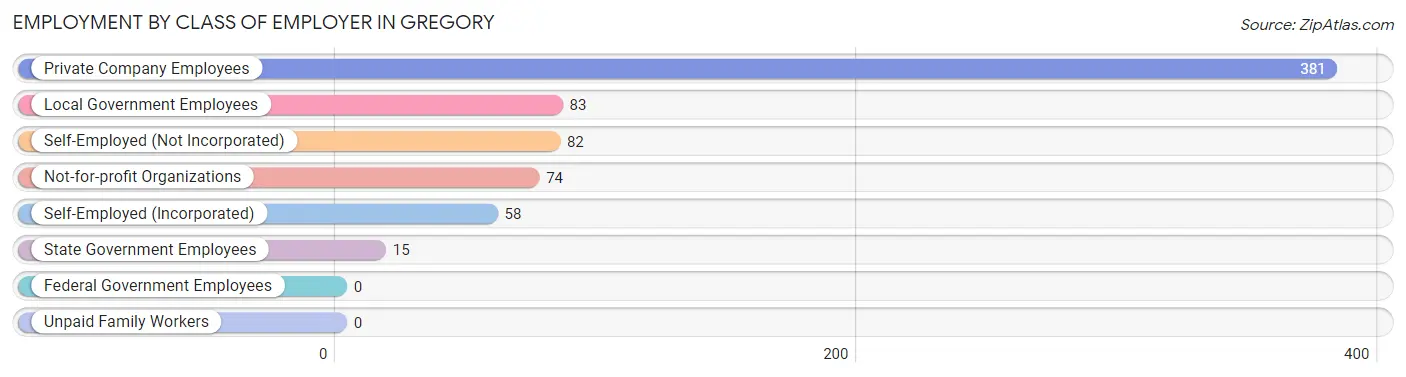
| Employer Class | # Employees | % Employees |
| Private Company Employees | 381 | 55.0% |
| Self-Employed (Incorporated) | 58 | 8.4% |
| Self-Employed (Not Incorporated) | 82 | 11.8% |
| Not-for-profit Organizations | 74 | 10.7% |
| Local Government Employees | 83 | 12.0% |
| State Government Employees | 15 | 2.2% |
| Federal Government Employees | 0 | 0.0% |
| Unpaid Family Workers | 0 | 0.0% |
| Total | 693 | 100.0% |
Employment Status by Age in Gregory
According to the labor force statistics for Gregory, out of the total population over 16 years of age (1,081), 68.7% or 743 individuals are in the labor force, with 3.1% or 23 of them unemployed. The age group with the highest labor force participation rate is 25 to 29 years, with 100.0% or 69 individuals in the labor force. Within the labor force, the 16 to 19 years age range has the highest percentage of unemployed individuals, with 11.3% or 8 of them being unemployed.
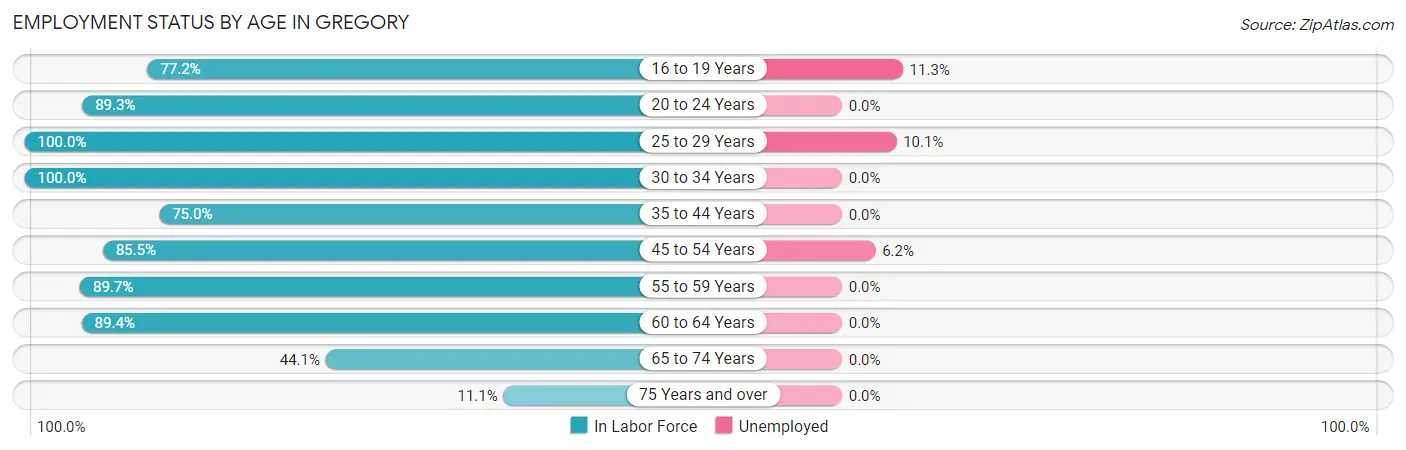
| Age Bracket | In Labor Force | Unemployed |
| 16 to 19 Years | 71 (77.2%) | 8 (11.3%) |
| 20 to 24 Years | 25 (89.3%) | 0 (0.0%) |
| 25 to 29 Years | 69 (100.0%) | 7 (10.1%) |
| 30 to 34 Years | 37 (100.0%) | 0 (0.0%) |
| 35 to 44 Years | 129 (75.0%) | 0 (0.0%) |
| 45 to 54 Years | 130 (85.5%) | 8 (6.2%) |
| 55 to 59 Years | 87 (89.7%) | 0 (0.0%) |
| 60 to 64 Years | 101 (89.4%) | 0 (0.0%) |
| 65 to 74 Years | 78 (44.1%) | 0 (0.0%) |
| 75 Years and over | 16 (11.1%) | 0 (0.0%) |
| Total | 743 (68.7%) | 23 (3.1%) |
Employment Status by Educational Attainment in Gregory
According to labor force statistics for Gregory, 86.4% of individuals (553) out of the total population between 25 and 64 years of age (640) are in the labor force, with 2.7% or 15 of them being unemployed. The group with the highest labor force participation rate are those with the educational attainment of bachelor's degree or higher, with 97.0% or 131 individuals in the labor force. Within the labor force, individuals with high school diploma education have the highest percentage of unemployment, with 8.3% or 15 of them being unemployed.
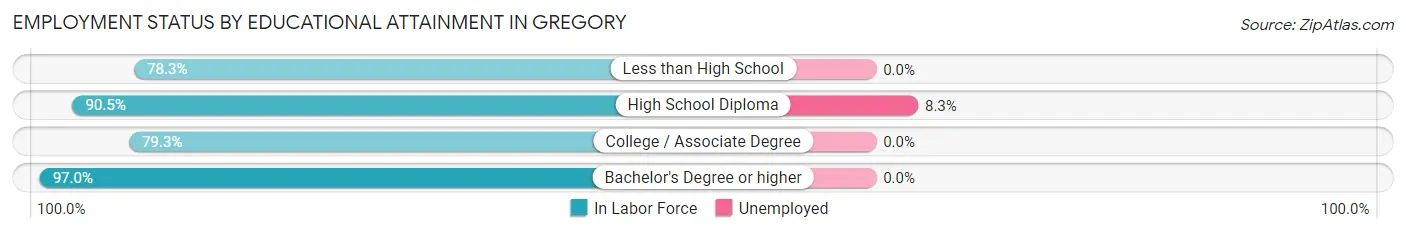
| Educational Attainment | In Labor Force | Unemployed |
| Less than High School | 47 (78.3%) | 0 (0.0%) |
| High School Diploma | 180 (90.5%) | 17 (8.3%) |
| College / Associate Degree | 195 (79.3%) | 0 (0.0%) |
| Bachelor's Degree or higher | 131 (97.0%) | 0 (0.0%) |
| Total | 553 (86.4%) | 17 (2.7%) |
Employment Occupations by Sex in Gregory
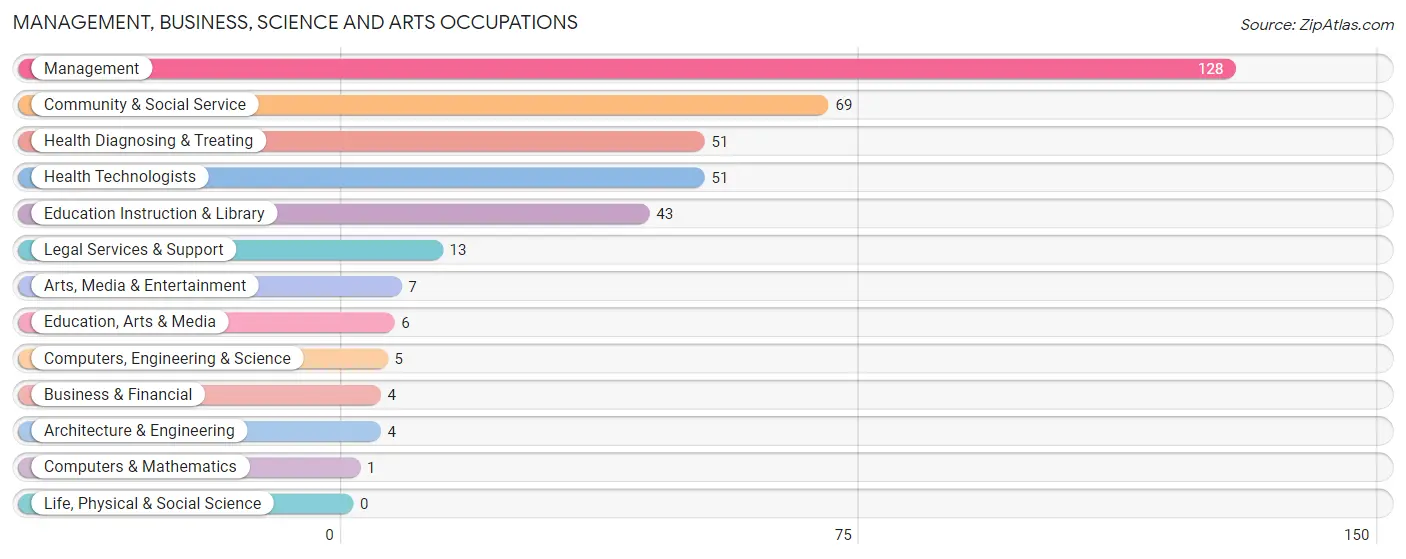
Management, Business, Science and Arts Occupations
The most common Management, Business, Science and Arts occupations in Gregory are Management (128 | 17.8%), Community & Social Service (69 | 9.6%), Health Diagnosing & Treating (51 | 7.1%), Health Technologists (51 | 7.1%), and Education Instruction & Library (43 | 6.0%).
Management, Business, Science and Arts Occupations by Sex
Within the Management, Business, Science and Arts occupations in Gregory, the most male-oriented occupations are Computers & Mathematics (100.0%), Management (76.6%), and Education, Arts & Media (66.7%), while the most female-oriented occupations are Business & Financial (100.0%), Architecture & Engineering (100.0%), and Arts, Media & Entertainment (100.0%).
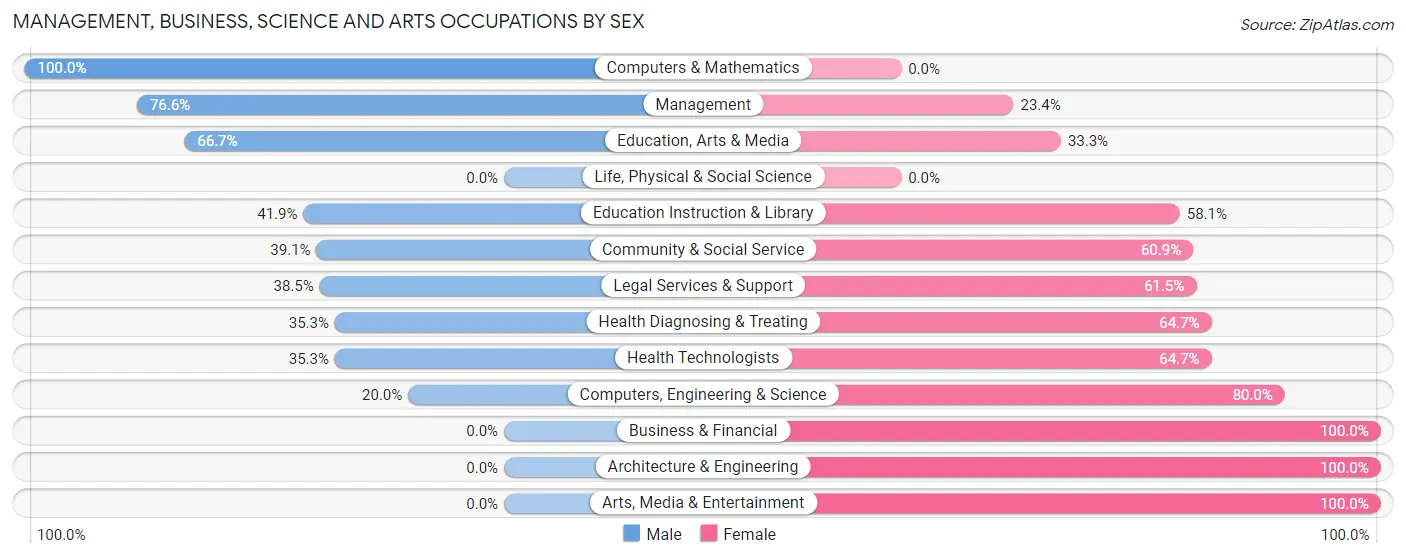
| Occupation | Male | Female |
| Management | 98 (76.6%) | 30 (23.4%) |
| Business & Financial | 0 (0.0%) | 4 (100.0%) |
| Computers, Engineering & Science | 1 (20.0%) | 4 (80.0%) |
| Computers & Mathematics | 1 (100.0%) | 0 (0.0%) |
| Architecture & Engineering | 0 (0.0%) | 4 (100.0%) |
| Life, Physical & Social Science | 0 (0.0%) | 0 (0.0%) |
| Community & Social Service | 27 (39.1%) | 42 (60.9%) |
| Education, Arts & Media | 4 (66.7%) | 2 (33.3%) |
| Legal Services & Support | 5 (38.5%) | 8 (61.5%) |
| Education Instruction & Library | 18 (41.9%) | 25 (58.1%) |
| Arts, Media & Entertainment | 0 (0.0%) | 7 (100.0%) |
| Health Diagnosing & Treating | 18 (35.3%) | 33 (64.7%) |
| Health Technologists | 18 (35.3%) | 33 (64.7%) |
| Total (Category) | 144 (56.0%) | 113 (44.0%) |
| Total (Overall) | 362 (50.3%) | 358 (49.7%) |
Services Occupations
The most common Services occupations in Gregory are Food Preparation & Serving (86 | 11.9%), Healthcare Support (25 | 3.5%), Cleaning & Maintenance (22 | 3.1%), Personal Care & Service (11 | 1.5%), and Security & Protection (2 | 0.3%).
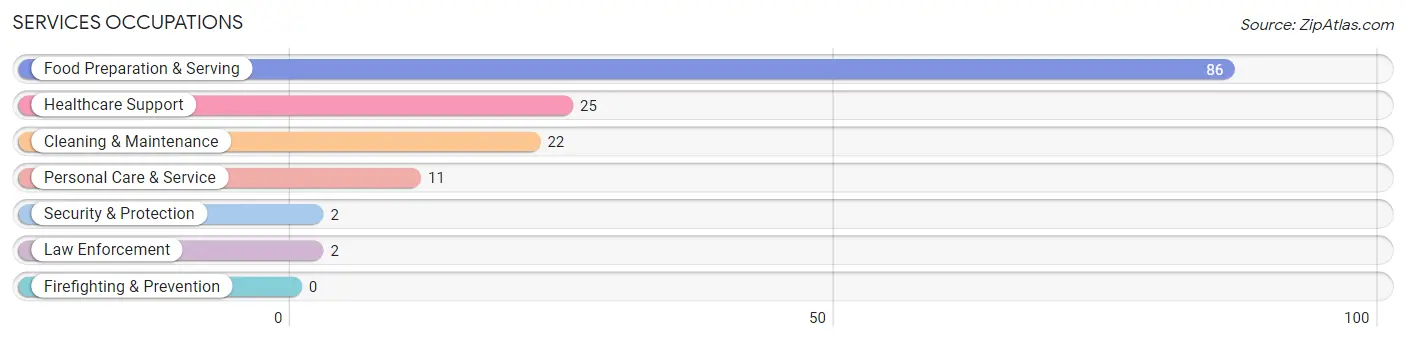
Services Occupations by Sex
Within the Services occupations in Gregory, the most male-oriented occupations are Security & Protection (100.0%), Law Enforcement (100.0%), and Cleaning & Maintenance (68.2%), while the most female-oriented occupations are Personal Care & Service (100.0%), Food Preparation & Serving (95.4%), and Healthcare Support (76.0%).

| Occupation | Male | Female |
| Healthcare Support | 6 (24.0%) | 19 (76.0%) |
| Security & Protection | 2 (100.0%) | 0 (0.0%) |
| Firefighting & Prevention | 0 (0.0%) | 0 (0.0%) |
| Law Enforcement | 2 (100.0%) | 0 (0.0%) |
| Food Preparation & Serving | 4 (4.6%) | 82 (95.4%) |
| Cleaning & Maintenance | 15 (68.2%) | 7 (31.8%) |
| Personal Care & Service | 0 (0.0%) | 11 (100.0%) |
| Total (Category) | 27 (18.5%) | 119 (81.5%) |
| Total (Overall) | 362 (50.3%) | 358 (49.7%) |
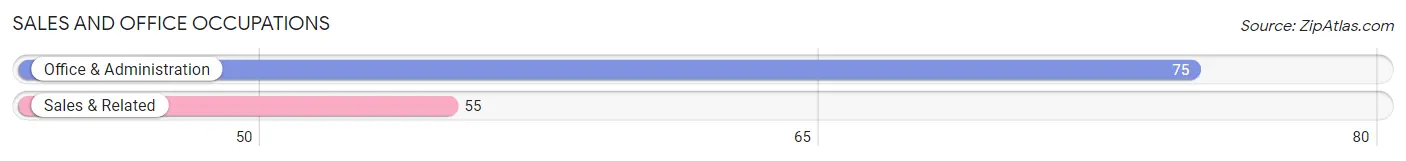
Sales and Office Occupations
The most common Sales and Office occupations in Gregory are Office & Administration (75 | 10.4%), and Sales & Related (55 | 7.6%).
Sales and Office Occupations by Sex
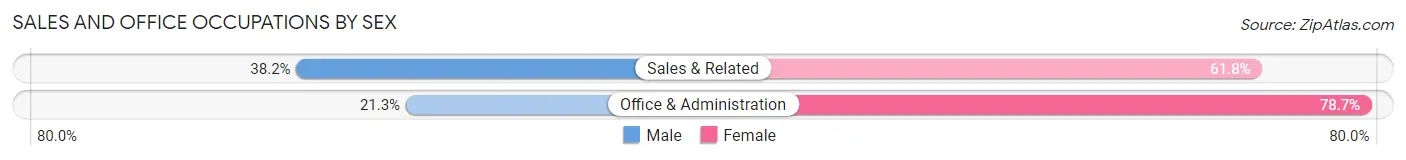
| Occupation | Male | Female |
| Sales & Related | 21 (38.2%) | 34 (61.8%) |
| Office & Administration | 16 (21.3%) | 59 (78.7%) |
| Total (Category) | 37 (28.5%) | 93 (71.5%) |
| Total (Overall) | 362 (50.3%) | 358 (49.7%) |
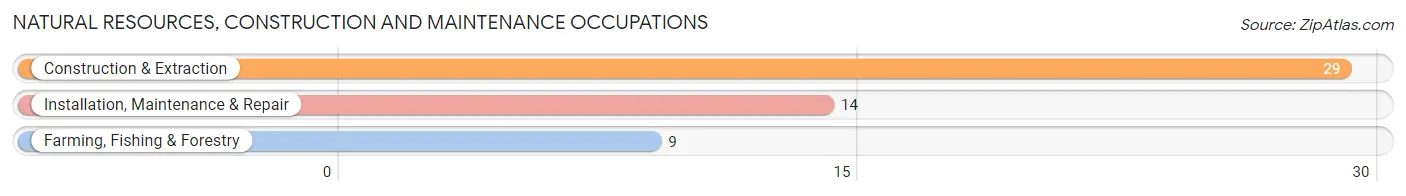
Natural Resources, Construction and Maintenance Occupations
The most common Natural Resources, Construction and Maintenance occupations in Gregory are Construction & Extraction (29 | 4.0%), Installation, Maintenance & Repair (14 | 1.9%), and Farming, Fishing & Forestry (9 | 1.3%).
Natural Resources, Construction and Maintenance Occupations by Sex
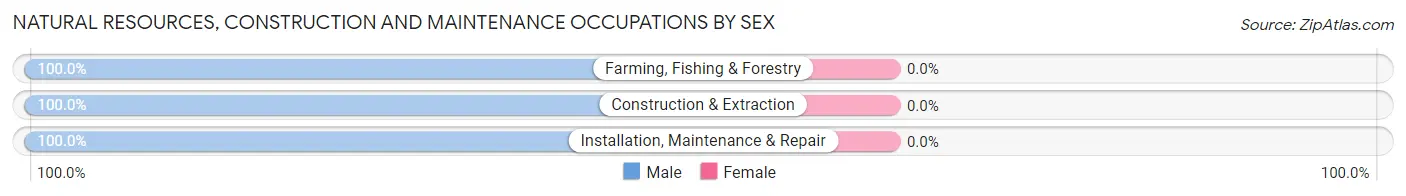
| Occupation | Male | Female |
| Farming, Fishing & Forestry | 9 (100.0%) | 0 (0.0%) |
| Construction & Extraction | 29 (100.0%) | 0 (0.0%) |
| Installation, Maintenance & Repair | 14 (100.0%) | 0 (0.0%) |
| Total (Category) | 52 (100.0%) | 0 (0.0%) |
| Total (Overall) | 362 (50.3%) | 358 (49.7%) |
Production, Transportation and Moving Occupations
The most common Production, Transportation and Moving occupations in Gregory are Transportation (55 | 7.6%), Production (50 | 6.9%), and Material Moving (30 | 4.2%).
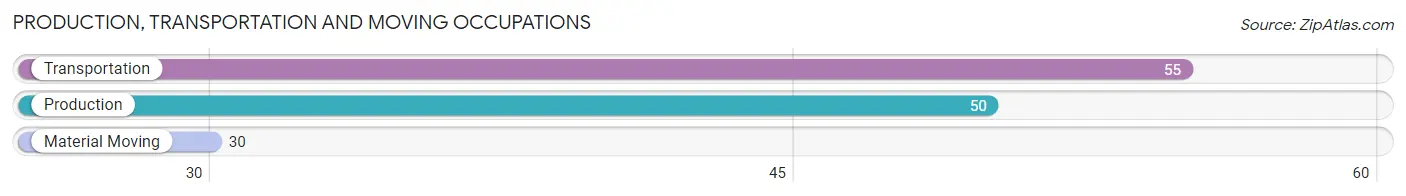
Production, Transportation and Moving Occupations by Sex
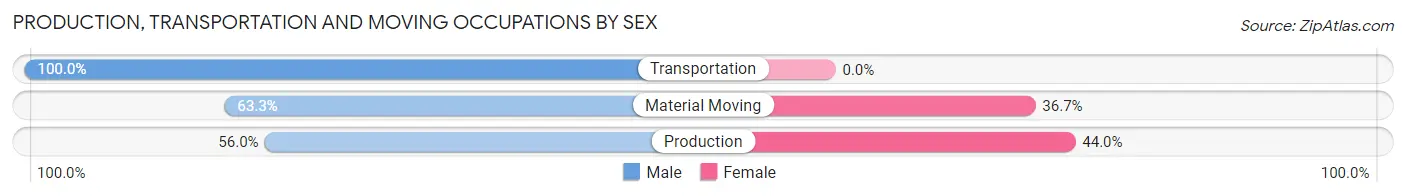
| Occupation | Male | Female |
| Production | 28 (56.0%) | 22 (44.0%) |
| Transportation | 55 (100.0%) | 0 (0.0%) |
| Material Moving | 19 (63.3%) | 11 (36.7%) |
| Total (Category) | 102 (75.6%) | 33 (24.4%) |
| Total (Overall) | 362 (50.3%) | 358 (49.7%) |
Employment Industries by Sex in Gregory
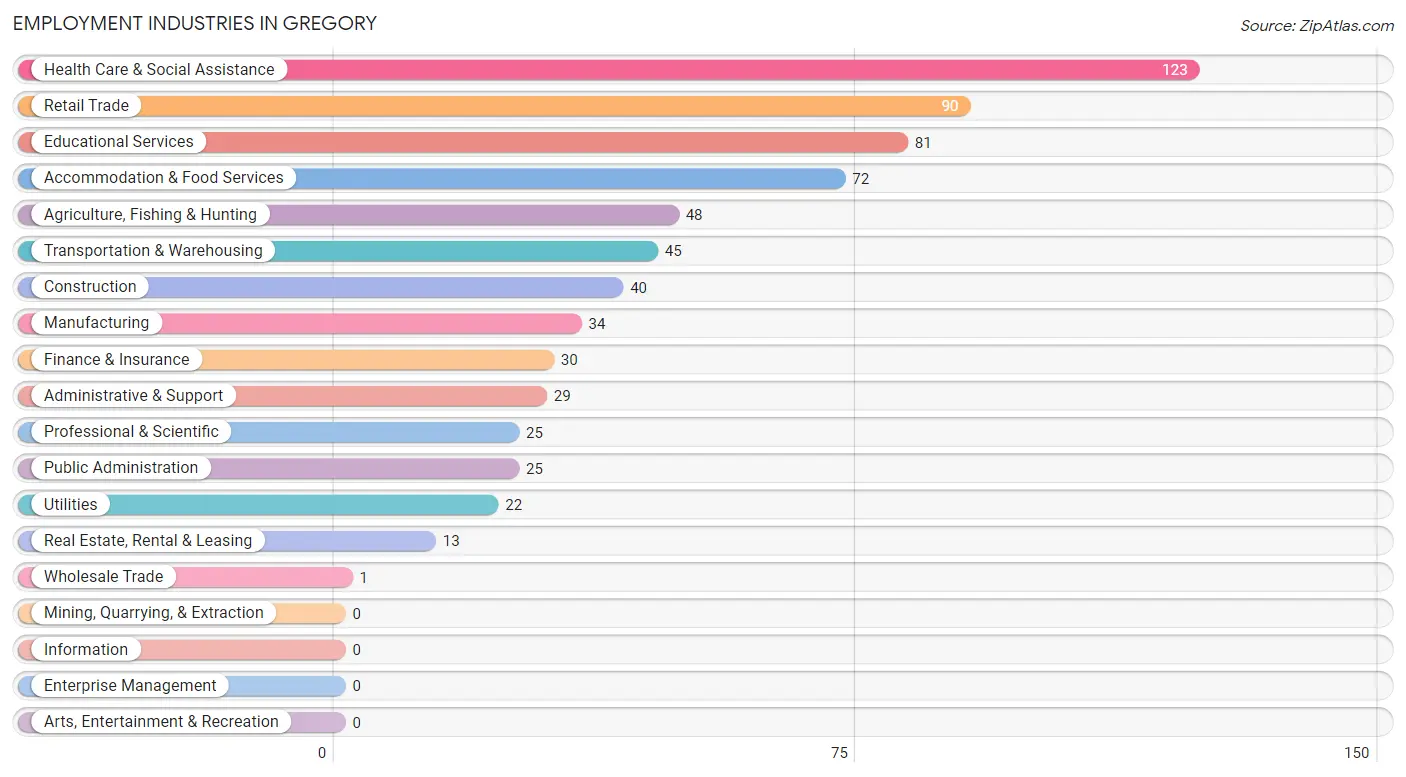
Employment Industries in Gregory
The major employment industries in Gregory include Health Care & Social Assistance (123 | 17.1%), Retail Trade (90 | 12.5%), Educational Services (81 | 11.3%), Accommodation & Food Services (72 | 10.0%), and Agriculture, Fishing & Hunting (48 | 6.7%).
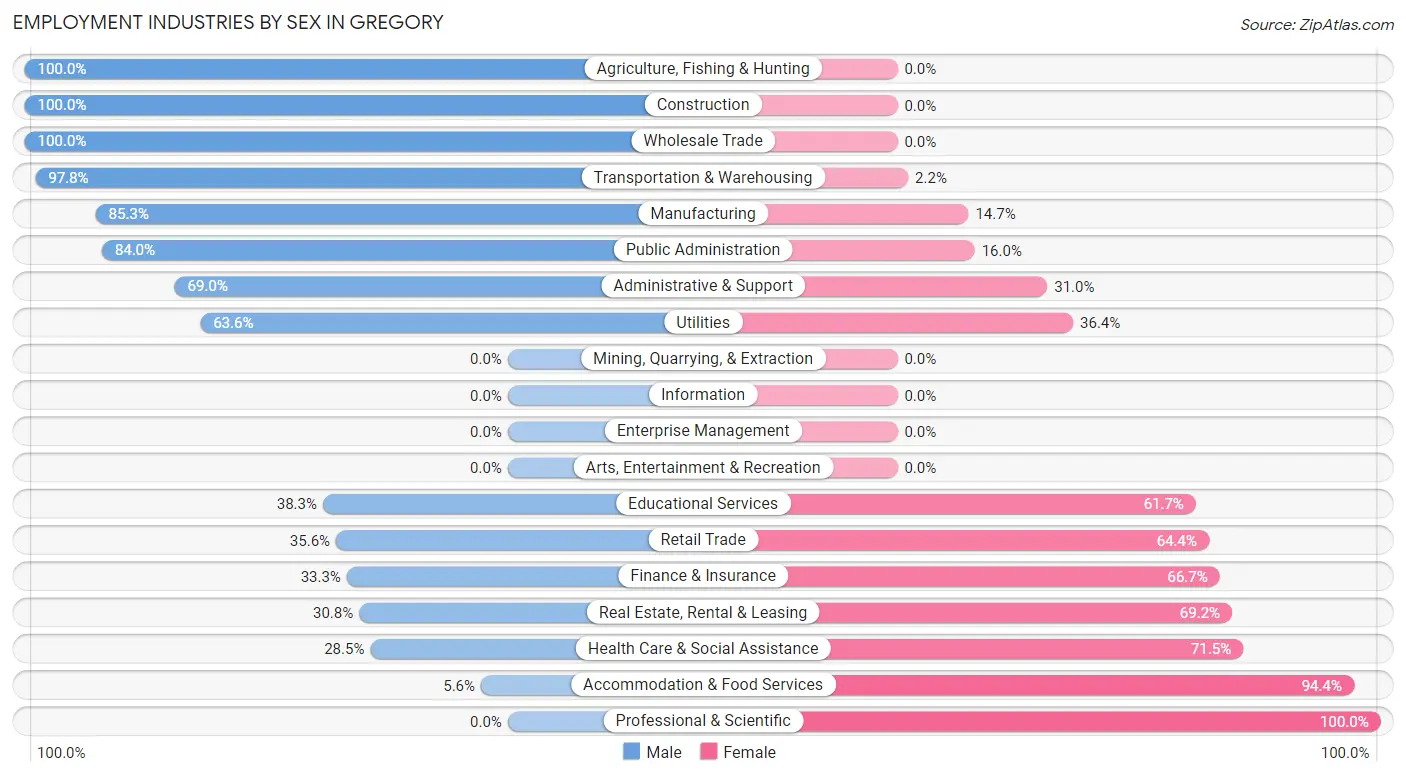
Employment Industries by Sex in Gregory
The Gregory industries that see more men than women are Agriculture, Fishing & Hunting (100.0%), Construction (100.0%), and Wholesale Trade (100.0%), whereas the industries that tend to have a higher number of women are Professional & Scientific (100.0%), Accommodation & Food Services (94.4%), and Health Care & Social Assistance (71.5%).
| Industry | Male | Female |
| Agriculture, Fishing & Hunting | 48 (100.0%) | 0 (0.0%) |
| Mining, Quarrying, & Extraction | 0 (0.0%) | 0 (0.0%) |
| Construction | 40 (100.0%) | 0 (0.0%) |
| Manufacturing | 29 (85.3%) | 5 (14.7%) |
| Wholesale Trade | 1 (100.0%) | 0 (0.0%) |
| Retail Trade | 32 (35.6%) | 58 (64.4%) |
| Transportation & Warehousing | 44 (97.8%) | 1 (2.2%) |
| Utilities | 14 (63.6%) | 8 (36.4%) |
| Information | 0 (0.0%) | 0 (0.0%) |
| Finance & Insurance | 10 (33.3%) | 20 (66.7%) |
| Real Estate, Rental & Leasing | 4 (30.8%) | 9 (69.2%) |
| Professional & Scientific | 0 (0.0%) | 25 (100.0%) |
| Enterprise Management | 0 (0.0%) | 0 (0.0%) |
| Administrative & Support | 20 (69.0%) | 9 (31.0%) |
| Educational Services | 31 (38.3%) | 50 (61.7%) |
| Health Care & Social Assistance | 35 (28.5%) | 88 (71.5%) |
| Arts, Entertainment & Recreation | 0 (0.0%) | 0 (0.0%) |
| Accommodation & Food Services | 4 (5.6%) | 68 (94.4%) |
| Public Administration | 21 (84.0%) | 4 (16.0%) |
| Total | 362 (50.3%) | 358 (49.7%) |
Education in Gregory
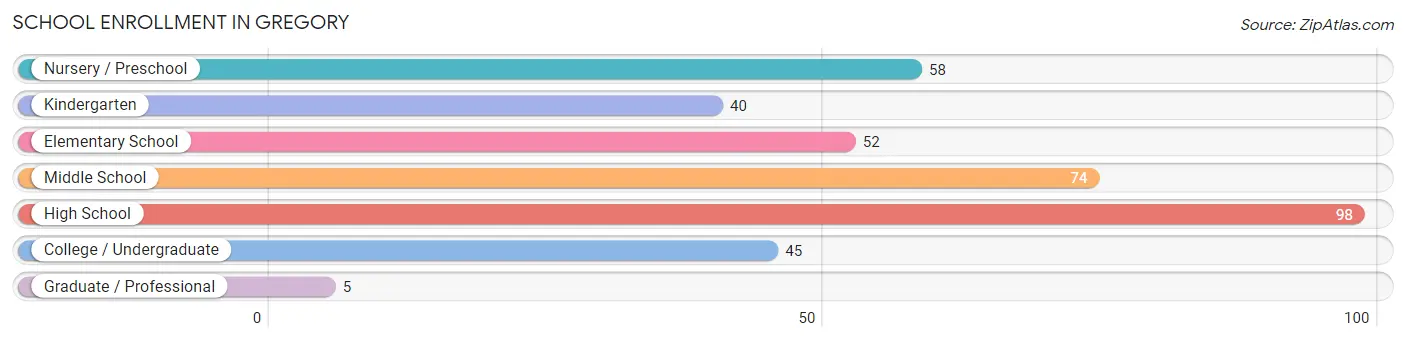
School Enrollment in Gregory
The most common levels of schooling among the 372 students in Gregory are high school (98 | 26.3%), middle school (74 | 19.9%), and nursery / preschool (58 | 15.6%).
| School Level | # Students | % Students |
| Nursery / Preschool | 58 | 15.6% |
| Kindergarten | 40 | 10.7% |
| Elementary School | 52 | 14.0% |
| Middle School | 74 | 19.9% |
| High School | 98 | 26.3% |
| College / Undergraduate | 45 | 12.1% |
| Graduate / Professional | 5 | 1.3% |
| Total | 372 | 100.0% |
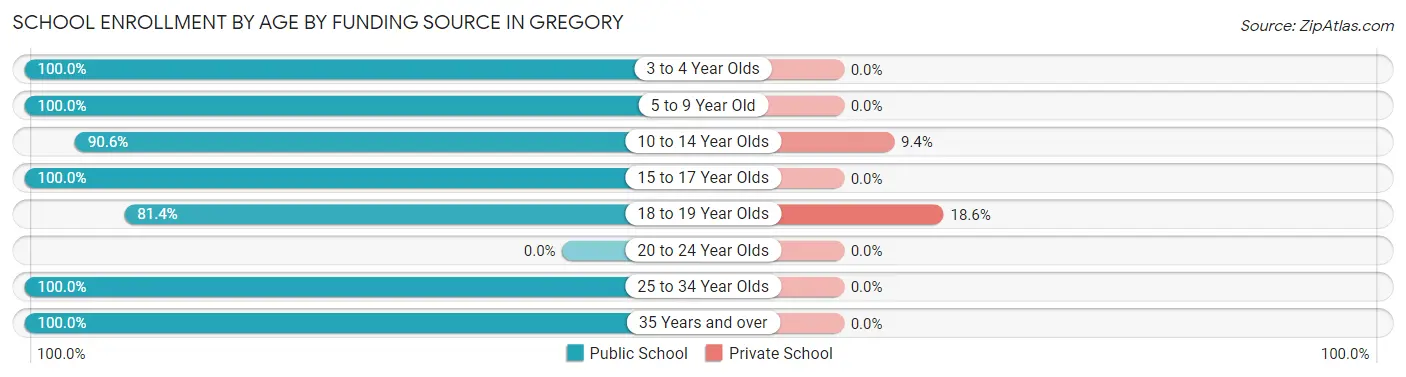
School Enrollment by Age by Funding Source in Gregory
Out of a total of 372 students who are enrolled in schools in Gregory, 14 (3.8%) attend a private institution, while the remaining 358 (96.2%) are enrolled in public schools. The age group of 18 to 19 year olds has the highest likelihood of being enrolled in private schools, with 8 (18.6% in the age bracket) enrolled. Conversely, the age group of 3 to 4 year olds has the lowest likelihood of being enrolled in a private school, with 38 (100.0% in the age bracket) attending a public institution.
| Age Bracket | Public School | Private School |
| 3 to 4 Year Olds | 38 (100.0%) | 0 (0.0%) |
| 5 to 9 Year Old | 101 (100.0%) | 0 (0.0%) |
| 10 to 14 Year Olds | 58 (90.6%) | 6 (9.4%) |
| 15 to 17 Year Olds | 105 (100.0%) | 0 (0.0%) |
| 18 to 19 Year Olds | 35 (81.4%) | 8 (18.6%) |
| 20 to 24 Year Olds | 0 (0.0%) | 0 (0.0%) |
| 25 to 34 Year Olds | 16 (100.0%) | 0 (0.0%) |
| 35 Years and over | 5 (100.0%) | 0 (0.0%) |
| Total | 358 (96.2%) | 14 (3.8%) |
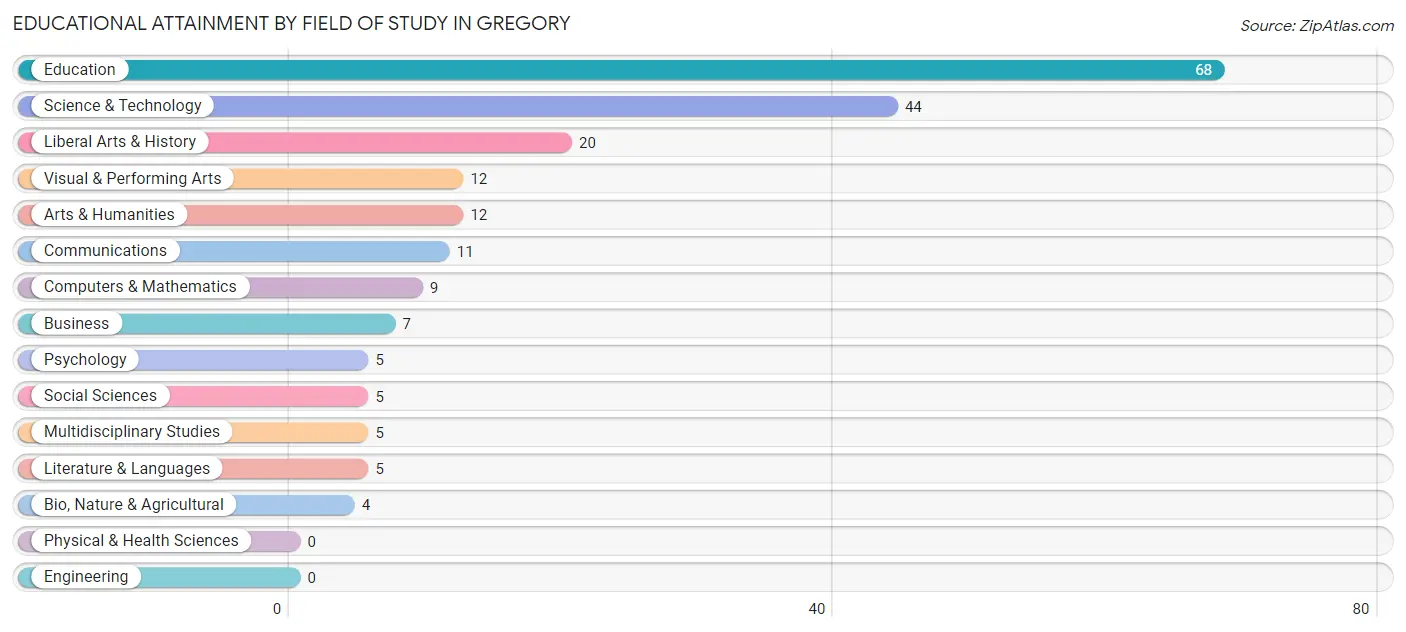
Educational Attainment by Field of Study in Gregory
Education (68 | 32.9%), science & technology (44 | 21.3%), liberal arts & history (20 | 9.7%), visual & performing arts (12 | 5.8%), and arts & humanities (12 | 5.8%) are the most common fields of study among 207 individuals in Gregory who have obtained a bachelor's degree or higher.
| Field of Study | # Graduates | % Graduates |
| Computers & Mathematics | 9 | 4.3% |
| Bio, Nature & Agricultural | 4 | 1.9% |
| Physical & Health Sciences | 0 | 0.0% |
| Psychology | 5 | 2.4% |
| Social Sciences | 5 | 2.4% |
| Engineering | 0 | 0.0% |
| Multidisciplinary Studies | 5 | 2.4% |
| Science & Technology | 44 | 21.3% |
| Business | 7 | 3.4% |
| Education | 68 | 32.9% |
| Literature & Languages | 5 | 2.4% |
| Liberal Arts & History | 20 | 9.7% |
| Visual & Performing Arts | 12 | 5.8% |
| Communications | 11 | 5.3% |
| Arts & Humanities | 12 | 5.8% |
| Total | 207 | 100.0% |
Transportation & Commute in Gregory
Vehicle Availability by Sex in Gregory
The most prevalent vehicle ownership categories in Gregory are males with 2 vehicles (128, accounting for 35.8%) and females with 2 vehicles (91, making up 38.1%).
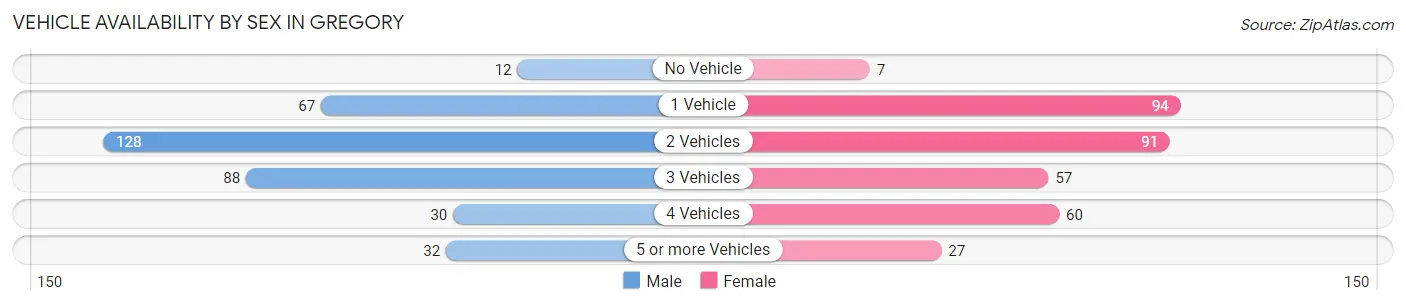
| Vehicles Available | Male | Female |
| No Vehicle | 12 (3.4%) | 7 (2.1%) |
| 1 Vehicle | 67 (18.8%) | 94 (28.0%) |
| 2 Vehicles | 128 (35.8%) | 91 (27.1%) |
| 3 Vehicles | 88 (24.6%) | 57 (17.0%) |
| 4 Vehicles | 30 (8.4%) | 60 (17.9%) |
| 5 or more Vehicles | 32 (9.0%) | 27 (8.0%) |
| Total | 357 (100.0%) | 336 (100.0%) |
Commute Time in Gregory
The most frequently occuring commute durations in Gregory are 5 to 9 minutes (163 commuters, 25.2%), less than 5 minutes (145 commuters, 22.4%), and 10 to 14 minutes (97 commuters, 15.0%).
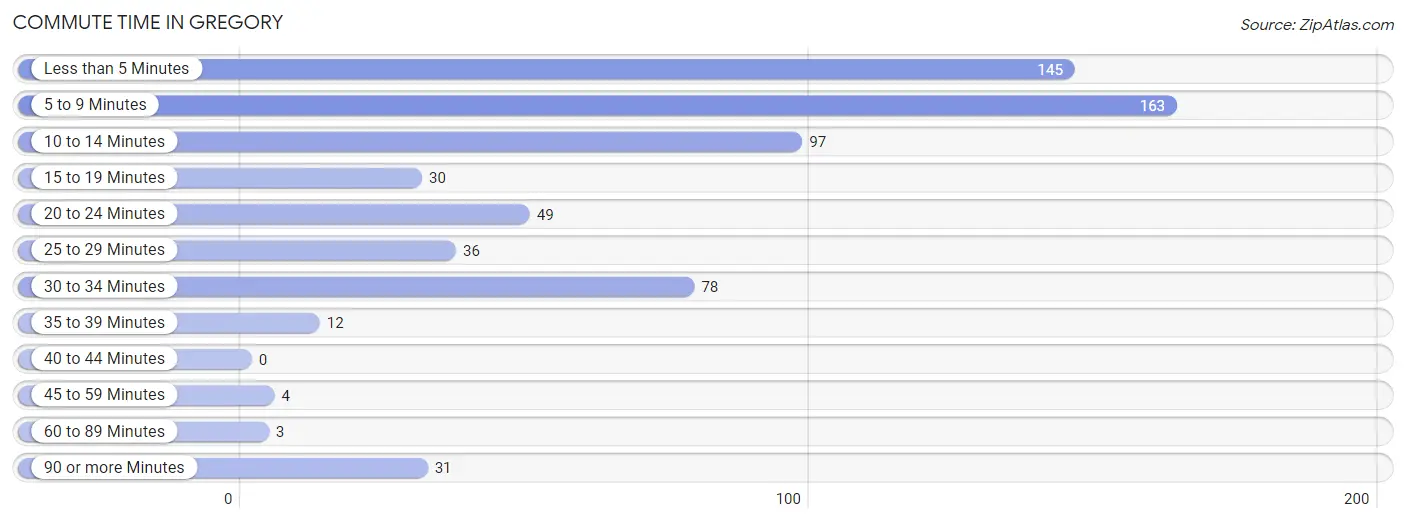
| Commute Time | # Commuters | % Commuters |
| Less than 5 Minutes | 145 | 22.4% |
| 5 to 9 Minutes | 163 | 25.2% |
| 10 to 14 Minutes | 97 | 15.0% |
| 15 to 19 Minutes | 30 | 4.6% |
| 20 to 24 Minutes | 49 | 7.6% |
| 25 to 29 Minutes | 36 | 5.6% |
| 30 to 34 Minutes | 78 | 12.0% |
| 35 to 39 Minutes | 12 | 1.8% |
| 40 to 44 Minutes | 0 | 0.0% |
| 45 to 59 Minutes | 4 | 0.6% |
| 60 to 89 Minutes | 3 | 0.5% |
| 90 or more Minutes | 31 | 4.8% |
Commute Time by Sex in Gregory
The most common commute times in Gregory are 5 to 9 minutes (86 commuters, 24.4%) for males and 5 to 9 minutes (77 commuters, 26.1%) for females.
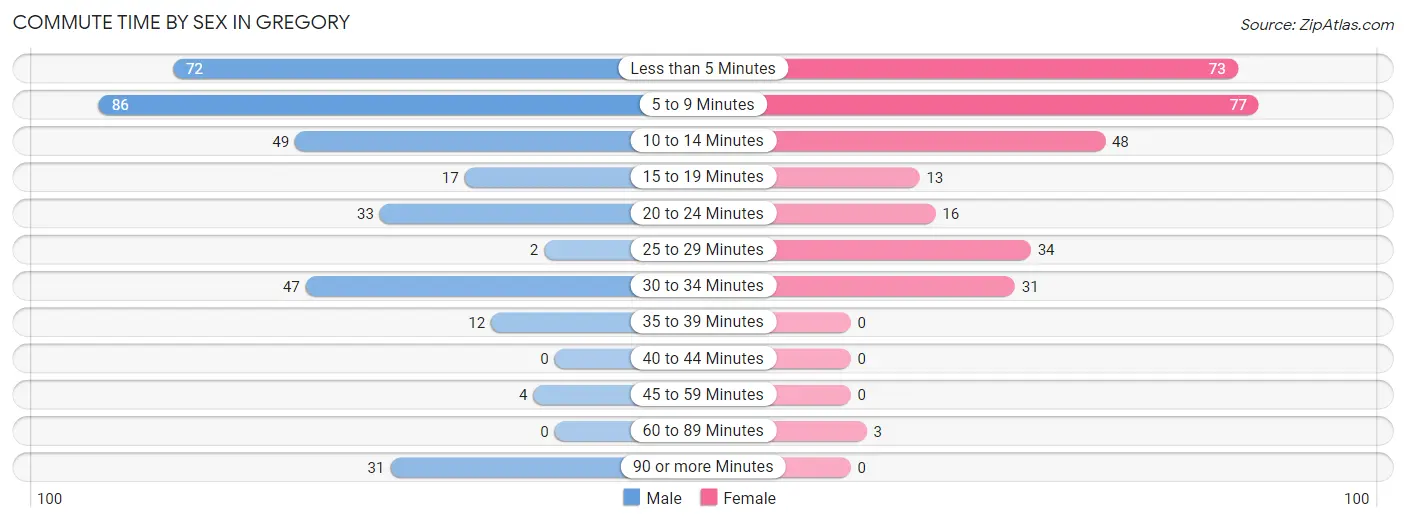
| Commute Time | Male | Female |
| Less than 5 Minutes | 72 (20.4%) | 73 (24.7%) |
| 5 to 9 Minutes | 86 (24.4%) | 77 (26.1%) |
| 10 to 14 Minutes | 49 (13.9%) | 48 (16.3%) |
| 15 to 19 Minutes | 17 (4.8%) | 13 (4.4%) |
| 20 to 24 Minutes | 33 (9.3%) | 16 (5.4%) |
| 25 to 29 Minutes | 2 (0.6%) | 34 (11.5%) |
| 30 to 34 Minutes | 47 (13.3%) | 31 (10.5%) |
| 35 to 39 Minutes | 12 (3.4%) | 0 (0.0%) |
| 40 to 44 Minutes | 0 (0.0%) | 0 (0.0%) |
| 45 to 59 Minutes | 4 (1.1%) | 0 (0.0%) |
| 60 to 89 Minutes | 0 (0.0%) | 3 (1.0%) |
| 90 or more Minutes | 31 (8.8%) | 0 (0.0%) |
Time of Departure to Work by Sex in Gregory
The most frequent times of departure to work in Gregory are 7:30 AM to 7:59 AM (108, 30.6%) for males and 7:30 AM to 7:59 AM (72, 24.4%) for females.
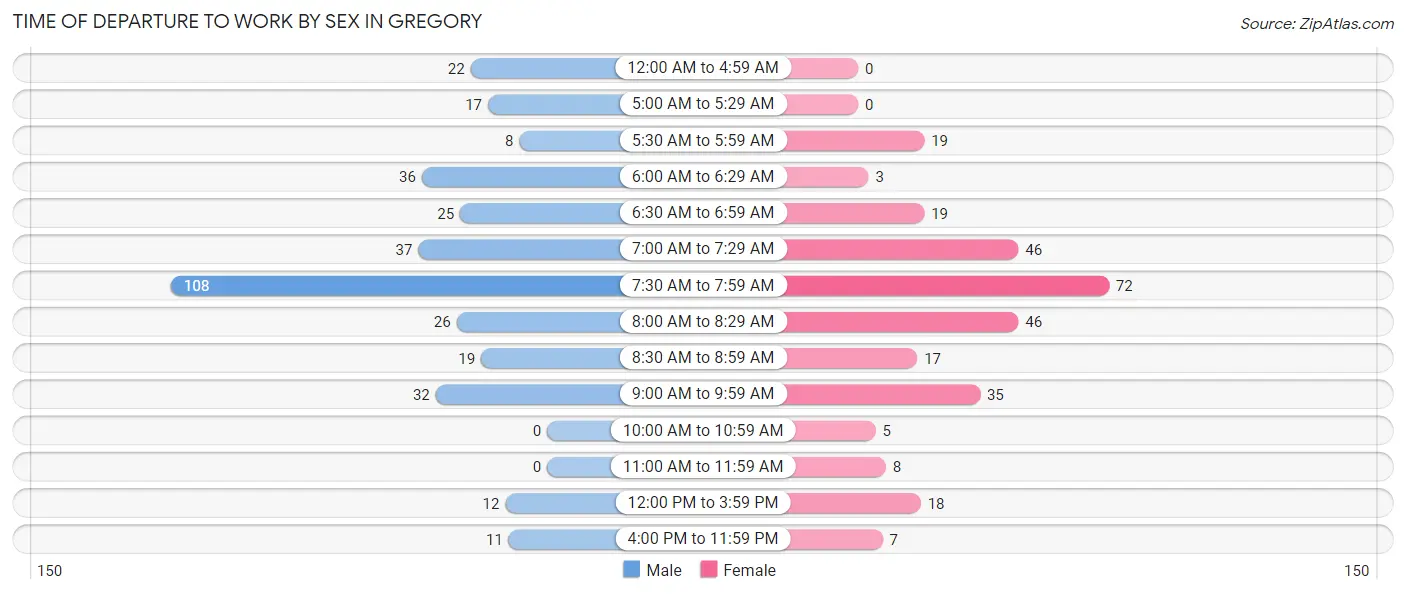
| Time of Departure | Male | Female |
| 12:00 AM to 4:59 AM | 22 (6.2%) | 0 (0.0%) |
| 5:00 AM to 5:29 AM | 17 (4.8%) | 0 (0.0%) |
| 5:30 AM to 5:59 AM | 8 (2.3%) | 19 (6.4%) |
| 6:00 AM to 6:29 AM | 36 (10.2%) | 3 (1.0%) |
| 6:30 AM to 6:59 AM | 25 (7.1%) | 19 (6.4%) |
| 7:00 AM to 7:29 AM | 37 (10.5%) | 46 (15.6%) |
| 7:30 AM to 7:59 AM | 108 (30.6%) | 72 (24.4%) |
| 8:00 AM to 8:29 AM | 26 (7.4%) | 46 (15.6%) |
| 8:30 AM to 8:59 AM | 19 (5.4%) | 17 (5.8%) |
| 9:00 AM to 9:59 AM | 32 (9.1%) | 35 (11.9%) |
| 10:00 AM to 10:59 AM | 0 (0.0%) | 5 (1.7%) |
| 11:00 AM to 11:59 AM | 0 (0.0%) | 8 (2.7%) |
| 12:00 PM to 3:59 PM | 12 (3.4%) | 18 (6.1%) |
| 4:00 PM to 11:59 PM | 11 (3.1%) | 7 (2.4%) |
| Total | 353 (100.0%) | 295 (100.0%) |
Housing Occupancy in Gregory
Occupancy by Ownership in Gregory
Of the total 584 dwellings in Gregory, owner-occupied units account for 431 (73.8%), while renter-occupied units make up 153 (26.2%).
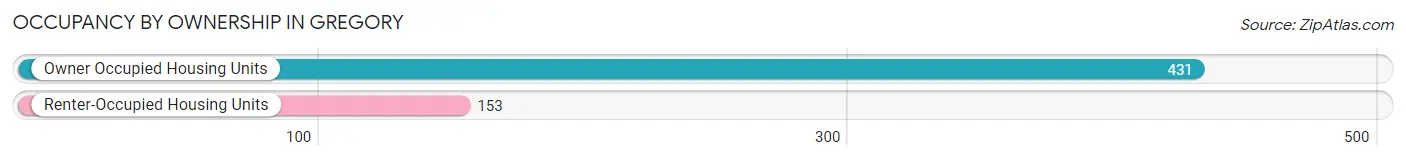
| Occupancy | # Housing Units | % Housing Units |
| Owner Occupied Housing Units | 431 | 73.8% |
| Renter-Occupied Housing Units | 153 | 26.2% |
| Total Occupied Housing Units | 584 | 100.0% |
Occupancy by Household Size in Gregory
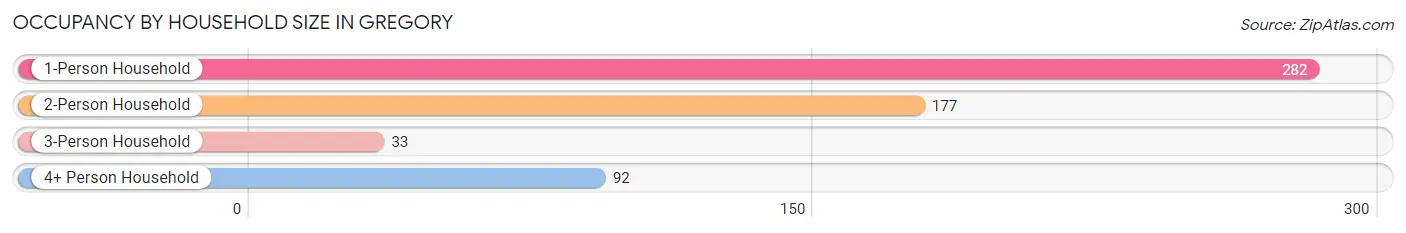
| Household Size | # Housing Units | % Housing Units |
| 1-Person Household | 282 | 48.3% |
| 2-Person Household | 177 | 30.3% |
| 3-Person Household | 33 | 5.7% |
| 4+ Person Household | 92 | 15.8% |
| Total Housing Units | 584 | 100.0% |
Occupancy by Ownership by Household Size in Gregory
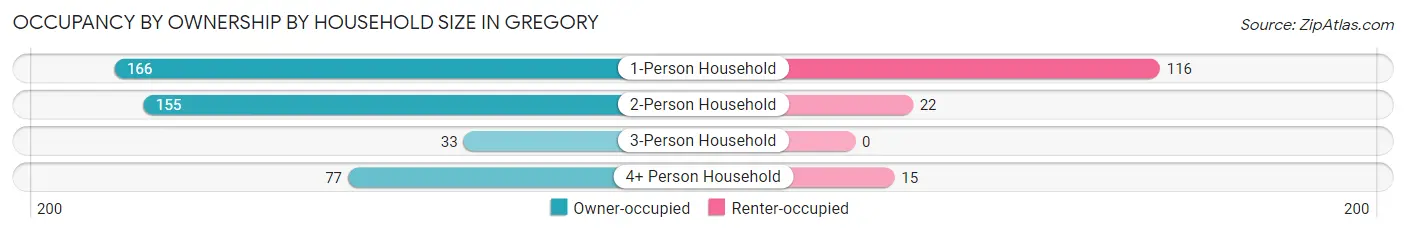
| Household Size | Owner-occupied | Renter-occupied |
| 1-Person Household | 166 (58.9%) | 116 (41.1%) |
| 2-Person Household | 155 (87.6%) | 22 (12.4%) |
| 3-Person Household | 33 (100.0%) | 0 (0.0%) |
| 4+ Person Household | 77 (83.7%) | 15 (16.3%) |
| Total Housing Units | 431 (73.8%) | 153 (26.2%) |
Occupancy by Educational Attainment in Gregory
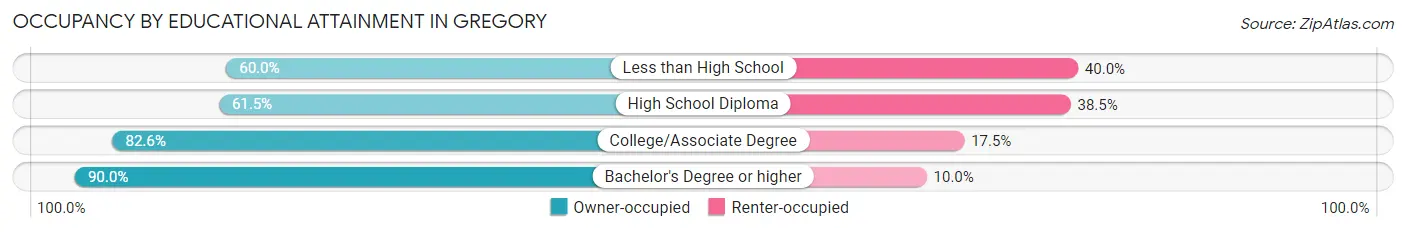
| Household Size | Owner-occupied | Renter-occupied |
| Less than High School | 48 (60.0%) | 32 (40.0%) |
| High School Diploma | 118 (61.5%) | 74 (38.5%) |
| College/Associate Degree | 175 (82.6%) | 37 (17.4%) |
| Bachelor's Degree or higher | 90 (90.0%) | 10 (10.0%) |
Occupancy by Age of Householder in Gregory
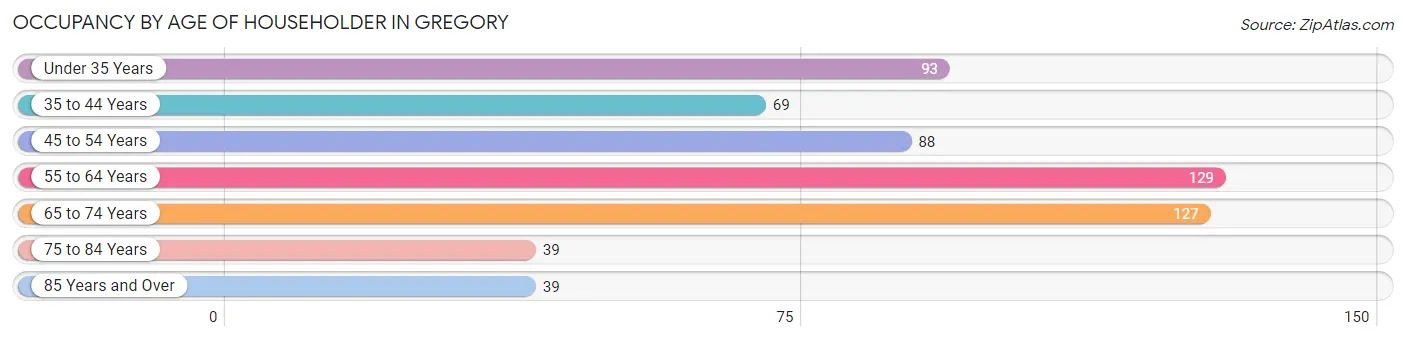
| Age Bracket | # Households | % Households |
| Under 35 Years | 93 | 15.9% |
| 35 to 44 Years | 69 | 11.8% |
| 45 to 54 Years | 88 | 15.1% |
| 55 to 64 Years | 129 | 22.1% |
| 65 to 74 Years | 127 | 21.7% |
| 75 to 84 Years | 39 | 6.7% |
| 85 Years and Over | 39 | 6.7% |
| Total | 584 | 100.0% |
Housing Finances in Gregory
Median Income by Occupancy in Gregory
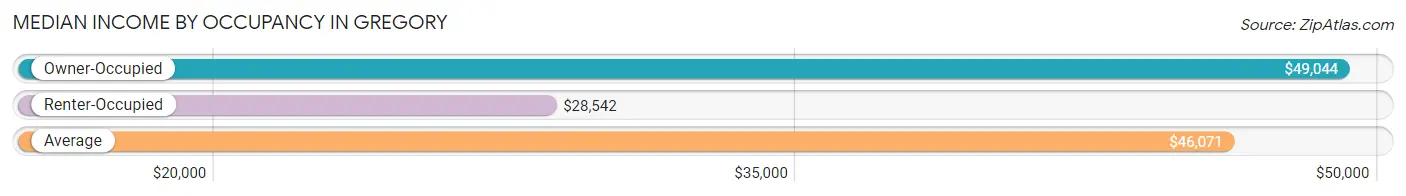
| Occupancy Type | # Households | Median Income |
| Owner-Occupied | 431 (73.8%) | $49,044 |
| Renter-Occupied | 153 (26.2%) | $28,542 |
| Average | 584 (100.0%) | $46,071 |
Occupancy by Householder Income Bracket in Gregory
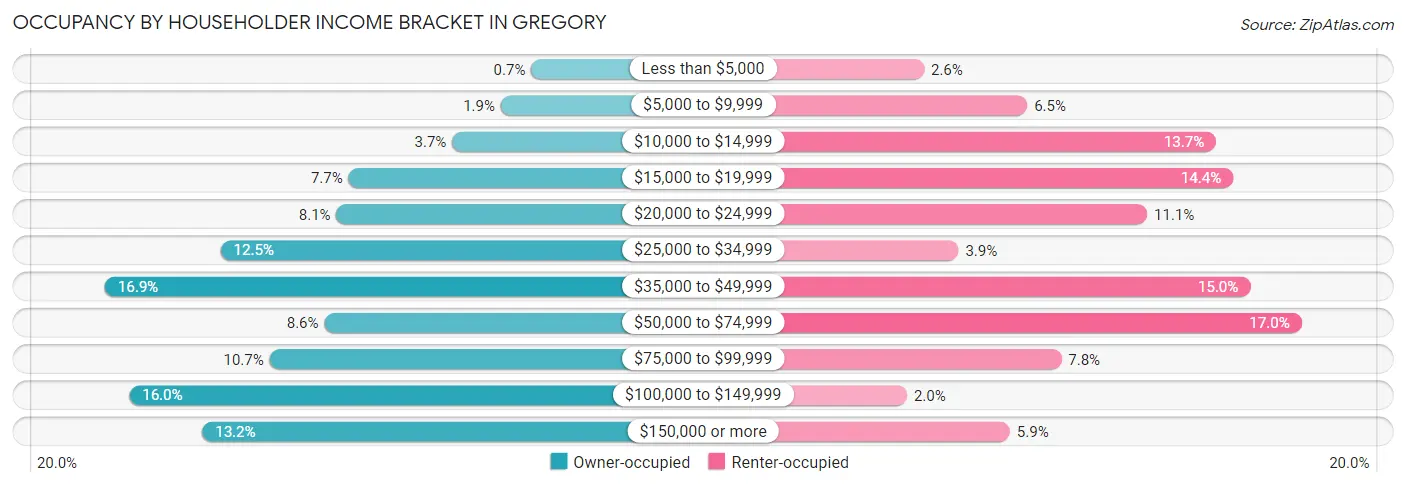
| Income Bracket | Owner-occupied | Renter-occupied |
| Less than $5,000 | 3 (0.7%) | 4 (2.6%) |
| $5,000 to $9,999 | 8 (1.9%) | 10 (6.5%) |
| $10,000 to $14,999 | 16 (3.7%) | 21 (13.7%) |
| $15,000 to $19,999 | 33 (7.7%) | 22 (14.4%) |
| $20,000 to $24,999 | 35 (8.1%) | 17 (11.1%) |
| $25,000 to $34,999 | 54 (12.5%) | 6 (3.9%) |
| $35,000 to $49,999 | 73 (16.9%) | 23 (15.0%) |
| $50,000 to $74,999 | 37 (8.6%) | 26 (17.0%) |
| $75,000 to $99,999 | 46 (10.7%) | 12 (7.8%) |
| $100,000 to $149,999 | 69 (16.0%) | 3 (2.0%) |
| $150,000 or more | 57 (13.2%) | 9 (5.9%) |
| Total | 431 (100.0%) | 153 (100.0%) |
Monthly Housing Cost Tiers in Gregory
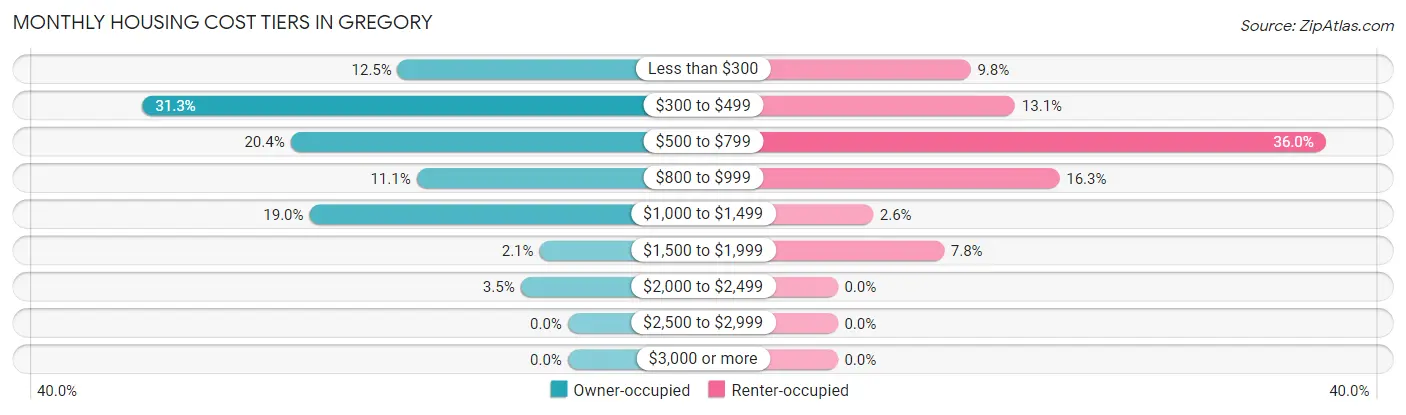
| Monthly Cost | Owner-occupied | Renter-occupied |
| Less than $300 | 54 (12.5%) | 15 (9.8%) |
| $300 to $499 | 135 (31.3%) | 20 (13.1%) |
| $500 to $799 | 88 (20.4%) | 55 (35.9%) |
| $800 to $999 | 48 (11.1%) | 25 (16.3%) |
| $1,000 to $1,499 | 82 (19.0%) | 4 (2.6%) |
| $1,500 to $1,999 | 9 (2.1%) | 12 (7.8%) |
| $2,000 to $2,499 | 15 (3.5%) | 0 (0.0%) |
| $2,500 to $2,999 | 0 (0.0%) | 0 (0.0%) |
| $3,000 or more | 0 (0.0%) | 0 (0.0%) |
| Total | 431 (100.0%) | 153 (100.0%) |
Physical Housing Characteristics in Gregory
Housing Structures in Gregory
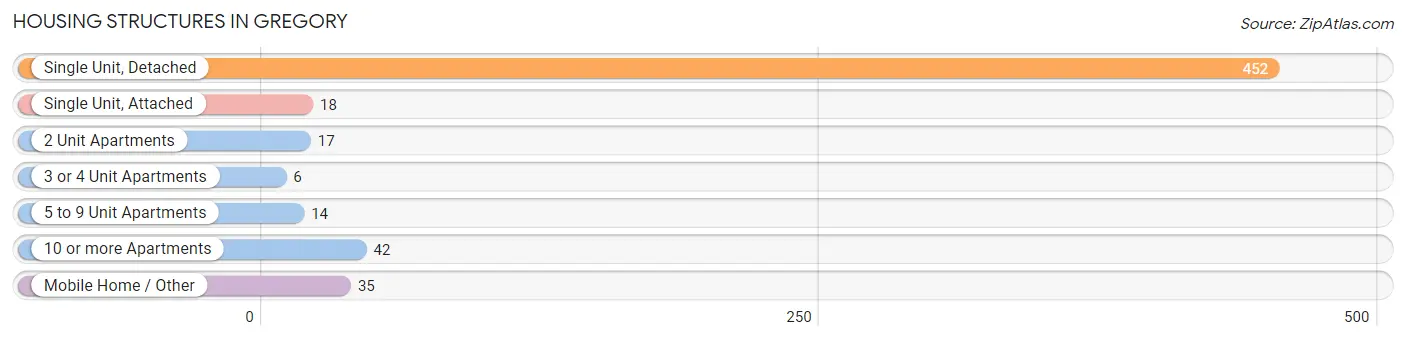
| Structure Type | # Housing Units | % Housing Units |
| Single Unit, Detached | 452 | 77.4% |
| Single Unit, Attached | 18 | 3.1% |
| 2 Unit Apartments | 17 | 2.9% |
| 3 or 4 Unit Apartments | 6 | 1.0% |
| 5 to 9 Unit Apartments | 14 | 2.4% |
| 10 or more Apartments | 42 | 7.2% |
| Mobile Home / Other | 35 | 6.0% |
| Total | 584 | 100.0% |
Housing Structures by Occupancy in Gregory
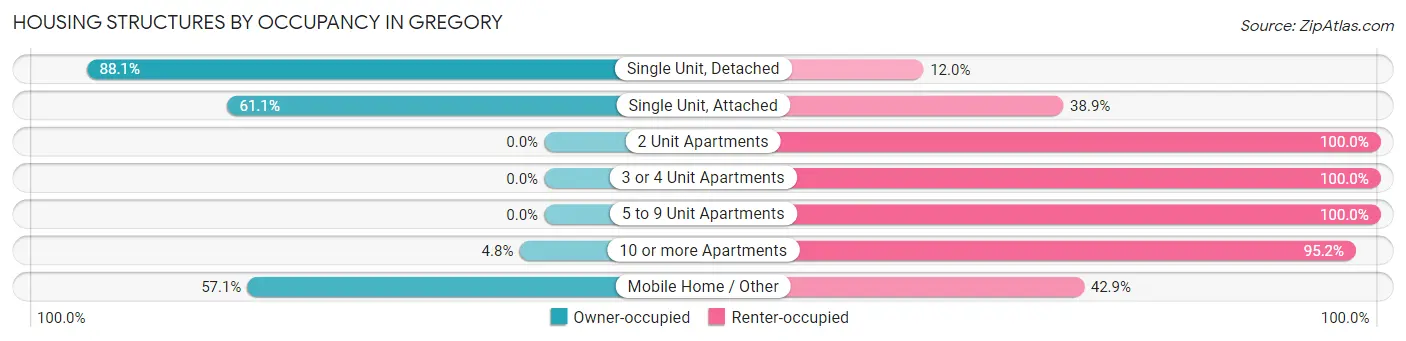
| Structure Type | Owner-occupied | Renter-occupied |
| Single Unit, Detached | 398 (88.0%) | 54 (11.9%) |
| Single Unit, Attached | 11 (61.1%) | 7 (38.9%) |
| 2 Unit Apartments | 0 (0.0%) | 17 (100.0%) |
| 3 or 4 Unit Apartments | 0 (0.0%) | 6 (100.0%) |
| 5 to 9 Unit Apartments | 0 (0.0%) | 14 (100.0%) |
| 10 or more Apartments | 2 (4.8%) | 40 (95.2%) |
| Mobile Home / Other | 20 (57.1%) | 15 (42.9%) |
| Total | 431 (73.8%) | 153 (26.2%) |
Housing Structures by Number of Rooms in Gregory
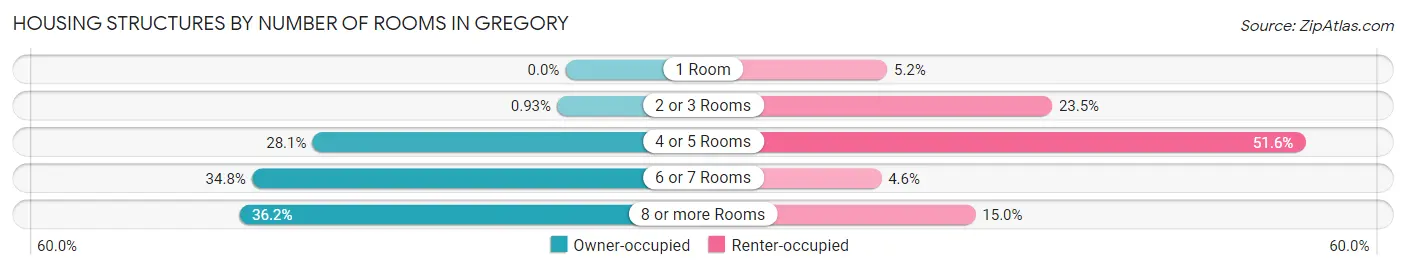
| Number of Rooms | Owner-occupied | Renter-occupied |
| 1 Room | 0 (0.0%) | 8 (5.2%) |
| 2 or 3 Rooms | 4 (0.9%) | 36 (23.5%) |
| 4 or 5 Rooms | 121 (28.1%) | 79 (51.6%) |
| 6 or 7 Rooms | 150 (34.8%) | 7 (4.6%) |
| 8 or more Rooms | 156 (36.2%) | 23 (15.0%) |
| Total | 431 (100.0%) | 153 (100.0%) |
Housing Structure by Heating Type in Gregory
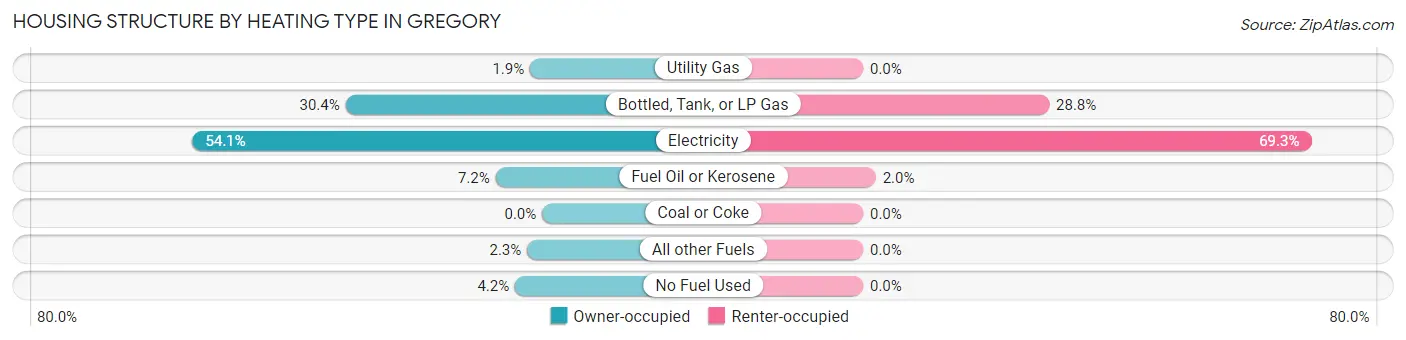
| Heating Type | Owner-occupied | Renter-occupied |
| Utility Gas | 8 (1.9%) | 0 (0.0%) |
| Bottled, Tank, or LP Gas | 131 (30.4%) | 44 (28.8%) |
| Electricity | 233 (54.1%) | 106 (69.3%) |
| Fuel Oil or Kerosene | 31 (7.2%) | 3 (2.0%) |
| Coal or Coke | 0 (0.0%) | 0 (0.0%) |
| All other Fuels | 10 (2.3%) | 0 (0.0%) |
| No Fuel Used | 18 (4.2%) | 0 (0.0%) |
| Total | 431 (100.0%) | 153 (100.0%) |
Household Vehicle Usage in Gregory

| Vehicles per Household | Owner-occupied | Renter-occupied |
| No Vehicle | 16 (3.7%) | 11 (7.2%) |
| 1 Vehicle | 79 (18.3%) | 105 (68.6%) |
| 2 Vehicles | 150 (34.8%) | 19 (12.4%) |
| 3 or more Vehicles | 186 (43.2%) | 18 (11.8%) |
| Total | 431 (100.0%) | 153 (100.0%) |
Real Estate & Mortgages in Gregory
Real Estate and Mortgage Overview in Gregory
| Characteristic | Without Mortgage | With Mortgage |
| Housing Units | 301 | 130 |
| Median Property Value | $92,900 | $127,900 |
| Median Household Income | $39,083 | $29 |
| Monthly Housing Costs | $454 | $0 |
| Real Estate Taxes | $1,408 | $4 |
Property Value by Mortgage Status in Gregory
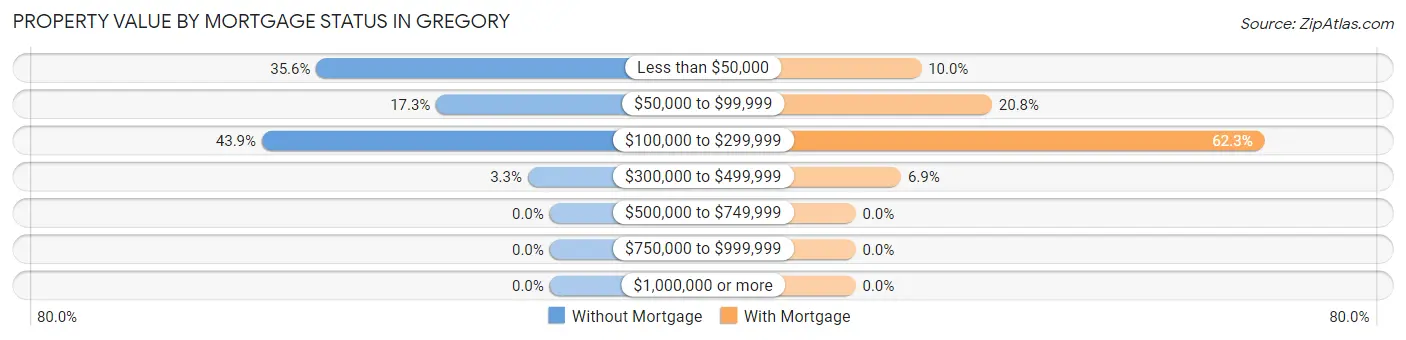
| Property Value | Without Mortgage | With Mortgage |
| Less than $50,000 | 107 (35.5%) | 13 (10.0%) |
| $50,000 to $99,999 | 52 (17.3%) | 27 (20.8%) |
| $100,000 to $299,999 | 132 (43.9%) | 81 (62.3%) |
| $300,000 to $499,999 | 10 (3.3%) | 9 (6.9%) |
| $500,000 to $749,999 | 0 (0.0%) | 0 (0.0%) |
| $750,000 to $999,999 | 0 (0.0%) | 0 (0.0%) |
| $1,000,000 or more | 0 (0.0%) | 0 (0.0%) |
| Total | 301 (100.0%) | 130 (100.0%) |
Household Income by Mortgage Status in Gregory
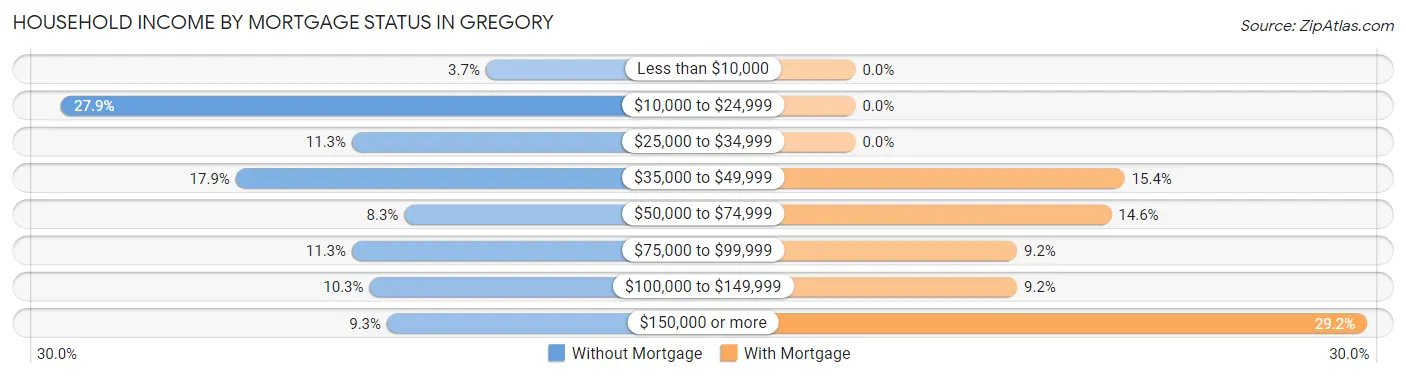
| Household Income | Without Mortgage | With Mortgage |
| Less than $10,000 | 11 (3.6%) | 0 (0.0%) |
| $10,000 to $24,999 | 84 (27.9%) | 0 (0.0%) |
| $25,000 to $34,999 | 34 (11.3%) | 0 (0.0%) |
| $35,000 to $49,999 | 54 (17.9%) | 20 (15.4%) |
| $50,000 to $74,999 | 25 (8.3%) | 19 (14.6%) |
| $75,000 to $99,999 | 34 (11.3%) | 12 (9.2%) |
| $100,000 to $149,999 | 31 (10.3%) | 12 (9.2%) |
| $150,000 or more | 28 (9.3%) | 38 (29.2%) |
| Total | 301 (100.0%) | 130 (100.0%) |
Property Value to Household Income Ratio in Gregory
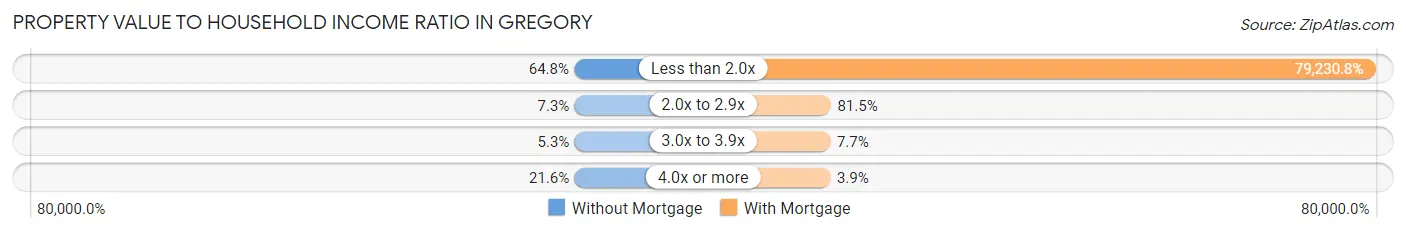
| Value-to-Income Ratio | Without Mortgage | With Mortgage |
| Less than 2.0x | 195 (64.8%) | 103,000 (79,230.8%) |
| 2.0x to 2.9x | 22 (7.3%) | 106 (81.5%) |
| 3.0x to 3.9x | 16 (5.3%) | 10 (7.7%) |
| 4.0x or more | 65 (21.6%) | 5 (3.8%) |
| Total | 301 (100.0%) | 130 (100.0%) |
Real Estate Taxes by Mortgage Status in Gregory
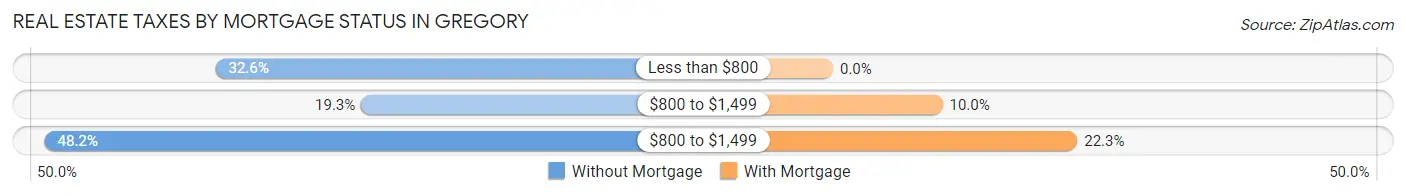
| Property Taxes | Without Mortgage | With Mortgage |
| Less than $800 | 98 (32.6%) | 0 (0.0%) |
| $800 to $1,499 | 58 (19.3%) | 13 (10.0%) |
| $800 to $1,499 | 145 (48.2%) | 29 (22.3%) |
| Total | 301 (100.0%) | 130 (100.0%) |
Health & Disability in Gregory
Health Insurance Coverage by Age in Gregory
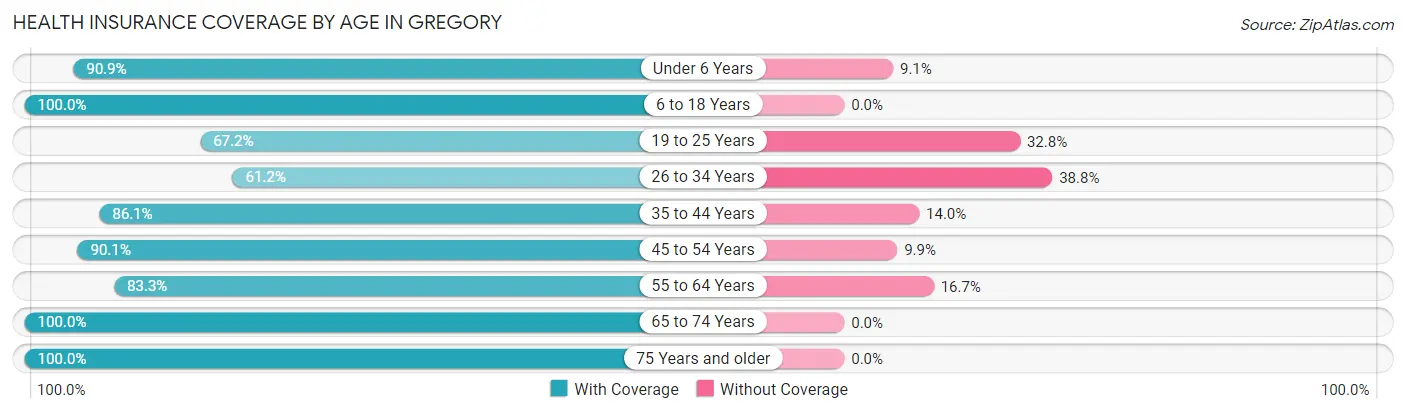
| Age Bracket | With Coverage | Without Coverage |
| Under 6 Years | 90 (90.9%) | 9 (9.1%) |
| 6 to 18 Years | 283 (100.0%) | 0 (0.0%) |
| 19 to 25 Years | 39 (67.2%) | 19 (32.8%) |
| 26 to 34 Years | 60 (61.2%) | 38 (38.8%) |
| 35 to 44 Years | 148 (86.1%) | 24 (14.0%) |
| 45 to 54 Years | 137 (90.1%) | 15 (9.9%) |
| 55 to 64 Years | 175 (83.3%) | 35 (16.7%) |
| 65 to 74 Years | 170 (100.0%) | 0 (0.0%) |
| 75 Years and older | 101 (100.0%) | 0 (0.0%) |
| Total | 1,203 (89.6%) | 140 (10.4%) |
Health Insurance Coverage by Citizenship Status in Gregory
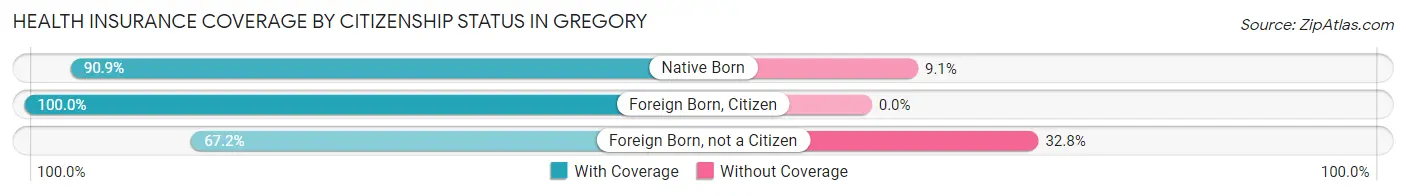
| Citizenship Status | With Coverage | Without Coverage |
| Native Born | 90 (90.9%) | 9 (9.1%) |
| Foreign Born, Citizen | 283 (100.0%) | 0 (0.0%) |
| Foreign Born, not a Citizen | 39 (67.2%) | 19 (32.8%) |
Health Insurance Coverage by Household Income in Gregory
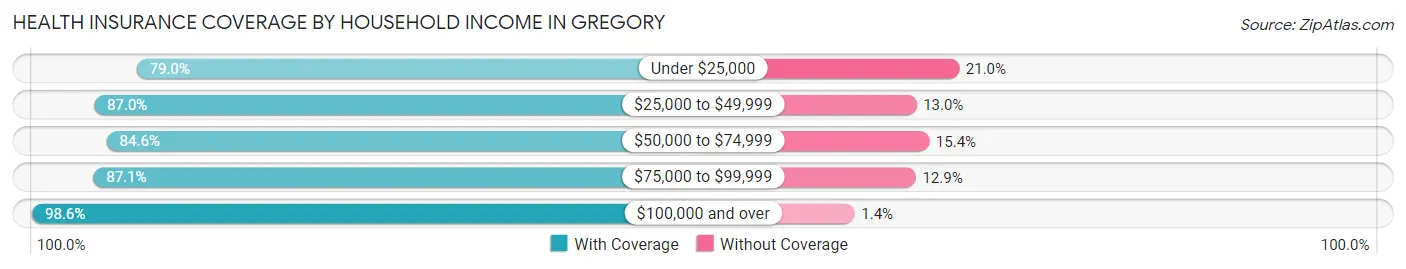
| Household Income | With Coverage | Without Coverage |
| Under $25,000 | 207 (79.0%) | 55 (21.0%) |
| $25,000 to $49,999 | 241 (87.0%) | 36 (13.0%) |
| $50,000 to $74,999 | 88 (84.6%) | 16 (15.4%) |
| $75,000 to $99,999 | 176 (87.1%) | 26 (12.9%) |
| $100,000 and over | 491 (98.6%) | 7 (1.4%) |
Public vs Private Health Insurance Coverage by Age in Gregory
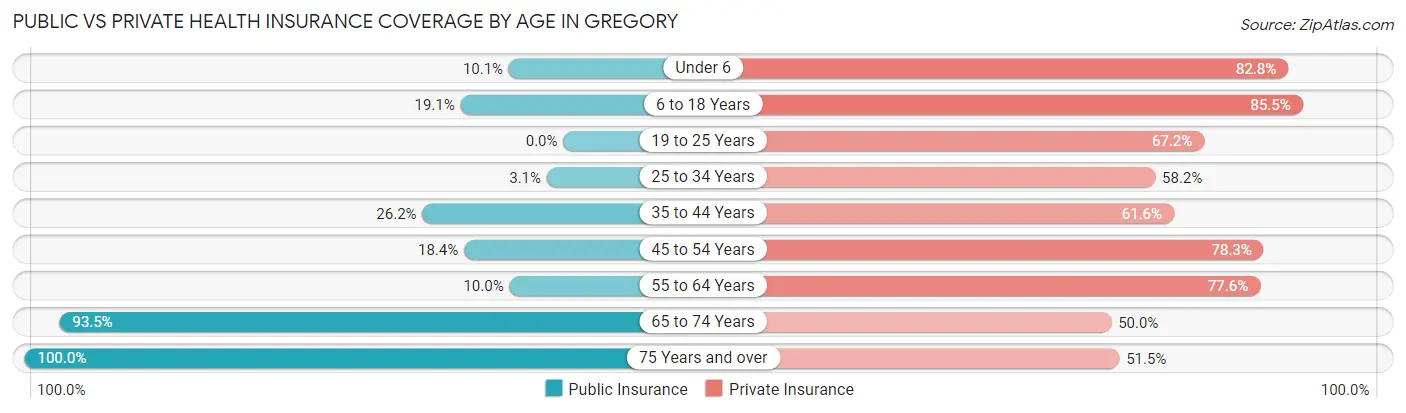
| Age Bracket | Public Insurance | Private Insurance |
| Under 6 | 10 (10.1%) | 82 (82.8%) |
| 6 to 18 Years | 54 (19.1%) | 242 (85.5%) |
| 19 to 25 Years | 0 (0.0%) | 39 (67.2%) |
| 25 to 34 Years | 3 (3.1%) | 57 (58.2%) |
| 35 to 44 Years | 45 (26.2%) | 106 (61.6%) |
| 45 to 54 Years | 28 (18.4%) | 119 (78.3%) |
| 55 to 64 Years | 21 (10.0%) | 163 (77.6%) |
| 65 to 74 Years | 159 (93.5%) | 85 (50.0%) |
| 75 Years and over | 101 (100.0%) | 52 (51.5%) |
| Total | 421 (31.4%) | 945 (70.4%) |
Disability Status by Sex by Age in Gregory
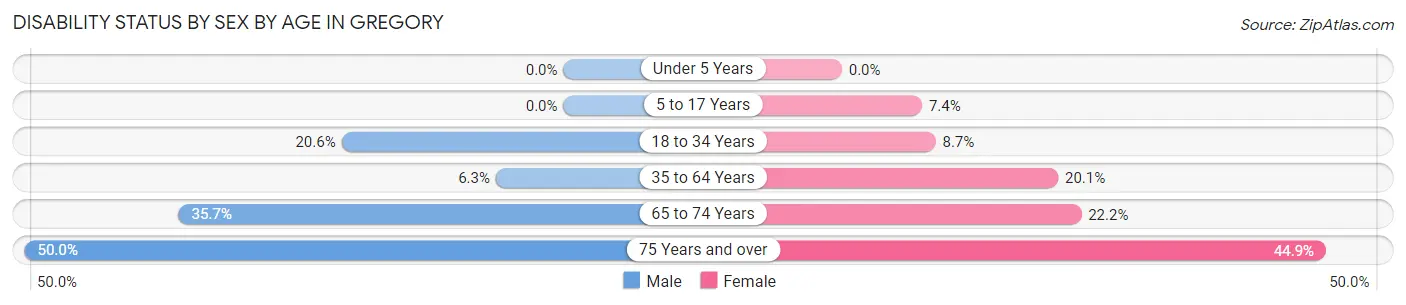
| Age Bracket | Male | Female |
| Under 5 Years | 0 (0.0%) | 0 (0.0%) |
| 5 to 17 Years | 0 (0.0%) | 9 (7.4%) |
| 18 to 34 Years | 21 (20.6%) | 8 (8.7%) |
| 35 to 64 Years | 16 (6.3%) | 56 (20.1%) |
| 65 to 74 Years | 35 (35.7%) | 16 (22.2%) |
| 75 Years and over | 16 (50.0%) | 31 (44.9%) |
Disability Class by Sex by Age in Gregory
Disability Class: Hearing Difficulty
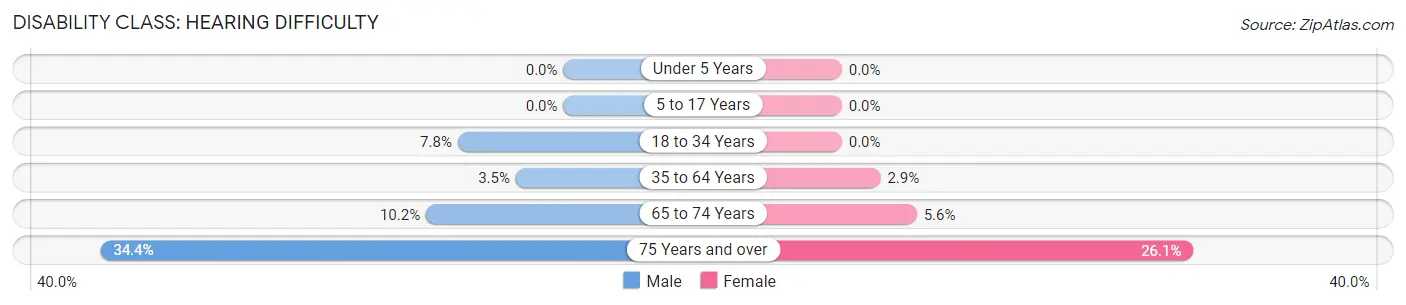
| Age Bracket | Male | Female |
| Under 5 Years | 0 (0.0%) | 0 (0.0%) |
| 5 to 17 Years | 0 (0.0%) | 0 (0.0%) |
| 18 to 34 Years | 8 (7.8%) | 0 (0.0%) |
| 35 to 64 Years | 9 (3.5%) | 8 (2.9%) |
| 65 to 74 Years | 10 (10.2%) | 4 (5.6%) |
| 75 Years and over | 11 (34.4%) | 18 (26.1%) |
Disability Class: Vision Difficulty
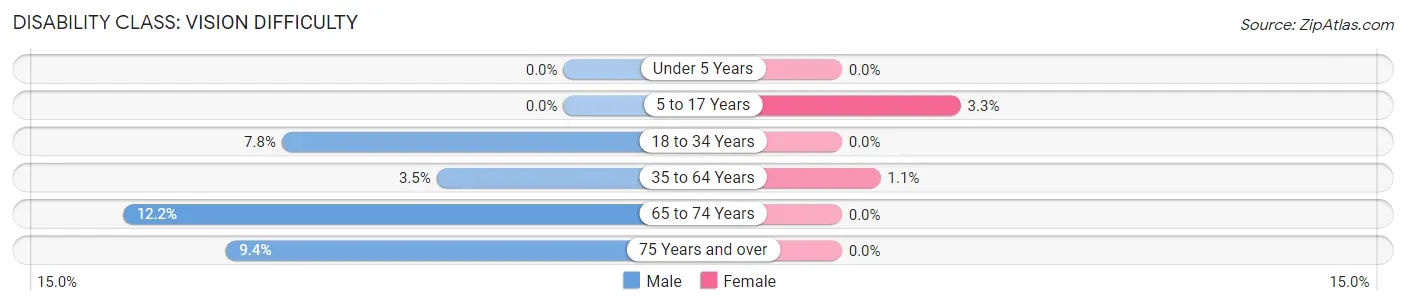
| Age Bracket | Male | Female |
| Under 5 Years | 0 (0.0%) | 0 (0.0%) |
| 5 to 17 Years | 0 (0.0%) | 4 (3.3%) |
| 18 to 34 Years | 8 (7.8%) | 0 (0.0%) |
| 35 to 64 Years | 9 (3.5%) | 3 (1.1%) |
| 65 to 74 Years | 12 (12.2%) | 0 (0.0%) |
| 75 Years and over | 3 (9.4%) | 0 (0.0%) |
Disability Class: Cognitive Difficulty
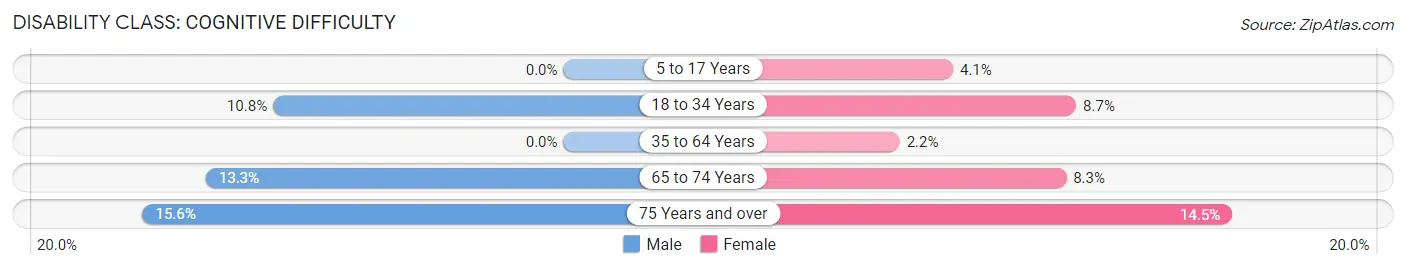
| Age Bracket | Male | Female |
| 5 to 17 Years | 0 (0.0%) | 5 (4.1%) |
| 18 to 34 Years | 11 (10.8%) | 8 (8.7%) |
| 35 to 64 Years | 0 (0.0%) | 6 (2.1%) |
| 65 to 74 Years | 13 (13.3%) | 6 (8.3%) |
| 75 Years and over | 5 (15.6%) | 10 (14.5%) |
Disability Class: Ambulatory Difficulty
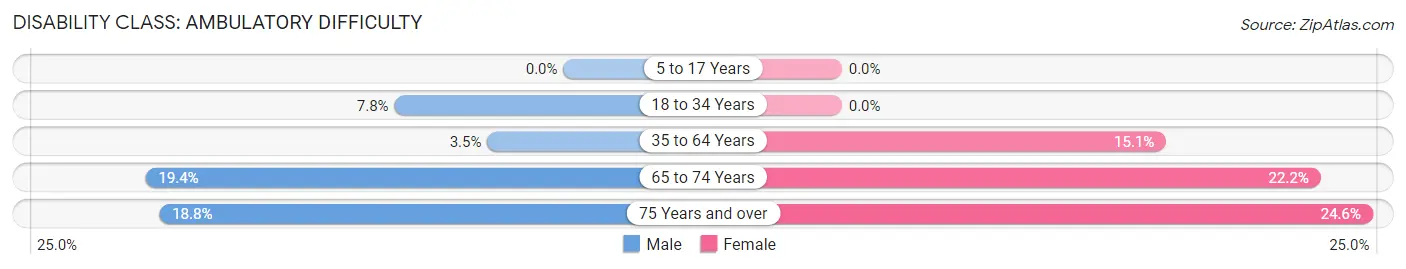
| Age Bracket | Male | Female |
| 5 to 17 Years | 0 (0.0%) | 0 (0.0%) |
| 18 to 34 Years | 8 (7.8%) | 0 (0.0%) |
| 35 to 64 Years | 9 (3.5%) | 42 (15.0%) |
| 65 to 74 Years | 19 (19.4%) | 16 (22.2%) |
| 75 Years and over | 6 (18.8%) | 17 (24.6%) |
Disability Class: Self-Care Difficulty
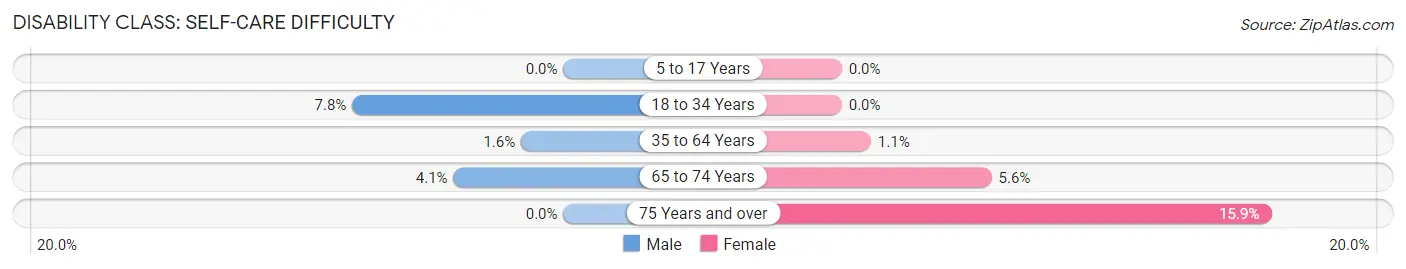
| Age Bracket | Male | Female |
| 5 to 17 Years | 0 (0.0%) | 0 (0.0%) |
| 18 to 34 Years | 8 (7.8%) | 0 (0.0%) |
| 35 to 64 Years | 4 (1.6%) | 3 (1.1%) |
| 65 to 74 Years | 4 (4.1%) | 4 (5.6%) |
| 75 Years and over | 0 (0.0%) | 11 (15.9%) |
Technology Access in Gregory
Computing Device Access in Gregory
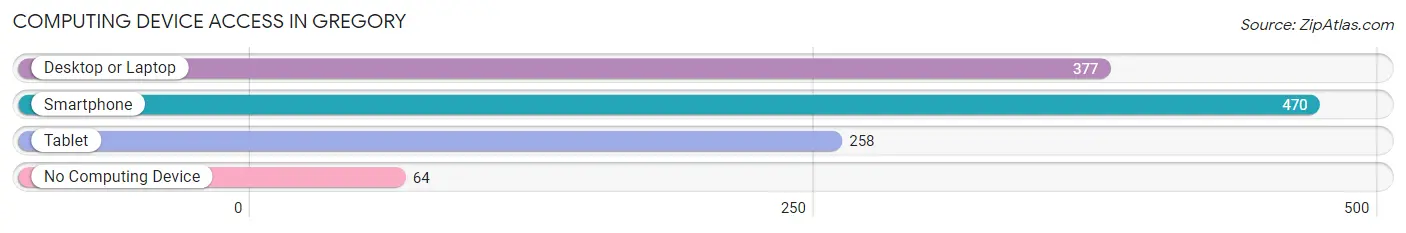
| Device Type | # Households | % Households |
| Desktop or Laptop | 377 | 64.5% |
| Smartphone | 470 | 80.5% |
| Tablet | 258 | 44.2% |
| No Computing Device | 64 | 11.0% |
| Total | 584 | 100.0% |
Internet Access in Gregory
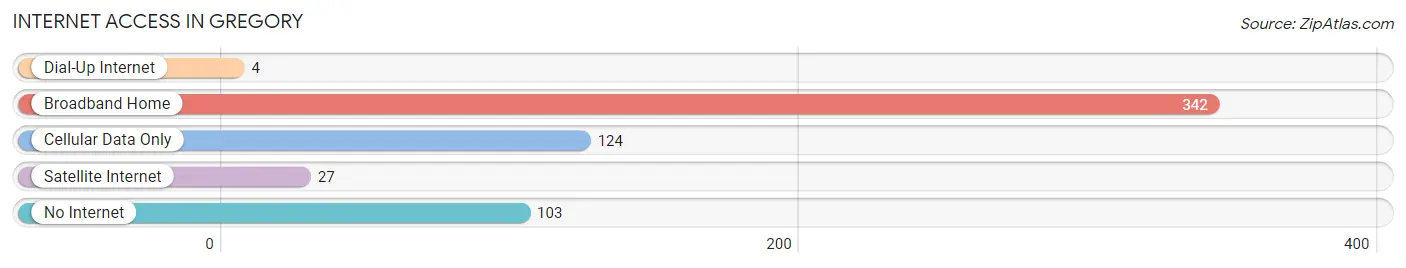
| Internet Type | # Households | % Households |
| Dial-Up Internet | 4 | 0.7% |
| Broadband Home | 342 | 58.6% |
| Cellular Data Only | 124 | 21.2% |
| Satellite Internet | 27 | 4.6% |
| No Internet | 103 | 17.6% |
| Total | 584 | 100.0% |
Gregory Summary
History
Gregory, South Dakota is a small town located in the southeastern corner of the state. It was founded in 1883 by a group of settlers from Wisconsin, who were looking for a place to settle and start a new life. The town was named after the first settler, John Gregory, who was a Civil War veteran.
The town grew quickly, and by the early 1900s, it had become a thriving agricultural community. The town was home to a variety of businesses, including a bank, a hotel, a general store, a blacksmith shop, and a post office.
In the early 1900s, the town was also home to a number of churches, including the First Congregational Church, the Methodist Episcopal Church, and the Catholic Church. The town also had a school, which was built in 1891.
In the 1920s, the town began to experience a decline in population, as many of the settlers moved away to larger cities. However, the town was able to remain a viable community, thanks to its strong agricultural base.
In the 1950s, the town experienced a resurgence in population, as many of the settlers returned to the area. This was due in part to the construction of the nearby Fort Randall Dam, which provided jobs and economic opportunities for the town.
Today, Gregory is a small town with a population of just over 1,000 people. It is still a primarily agricultural community, with many of the residents working in the farming and ranching industries.
Geography
Gregory is located in the southeastern corner of South Dakota, in Gregory County. It is situated on the banks of the Missouri River, and is surrounded by rolling hills and prairies. The town is located about 50 miles from the state capital of Pierre.
The town is located in a semi-arid climate, with hot summers and cold winters. The average annual temperature is around 50 degrees Fahrenheit, and the average annual precipitation is around 20 inches.
Economy
The economy of Gregory is primarily based on agriculture. The town is home to a number of farms and ranches, which produce a variety of crops, including corn, wheat, soybeans, and hay. The town is also home to a number of businesses, including a bank, a hotel, a general store, and a post office.
The town is also home to a number of manufacturing businesses, which produce a variety of products, including furniture, clothing, and food products.
Demographics
As of the 2010 census, the population of Gregory was 1,039. The racial makeup of the town was 97.3% White, 0.3% African American, 0.2% Native American, 0.2% Asian, 0.1% Pacific Islander, 0.7% from other races, and 1.3% from two or more races. Hispanic or Latino of any race were 1.7% of the population.
The median income for a household in the town was $37,500, and the median income for a family was $45,000. The per capita income for the town was $18,845. About 11.2% of families and 14.2% of the population were below the poverty line, including 18.2% of those under age 18 and 8.3% of those age 65 or over.
Common Questions
What is Per Capita Income in Gregory?
Per Capita income in Gregory is $28,856.
What is the Median Family Income in Gregory?
Median Family Income in Gregory is $78,958.
What is the Median Household income in Gregory?
Median Household Income in Gregory is $46,071.
What is Income or Wage Gap in Gregory?
Income or Wage Gap in Gregory is 14.2%.
Women in Gregory earn 85.8 cents for every dollar earned by a man.
What is Inequality or Gini Index in Gregory?
Inequality or Gini Index in Gregory is 0.44.
What is the Total Population of Gregory?
Total Population of Gregory is 1,393.
What is the Total Male Population of Gregory?
Total Male Population of Gregory is 681.
What is the Total Female Population of Gregory?
Total Female Population of Gregory is 712.
What is the Ratio of Males per 100 Females in Gregory?
There are 95.65 Males per 100 Females in Gregory.
What is the Ratio of Females per 100 Males in Gregory?
There are 104.55 Females per 100 Males in Gregory.
What is the Median Population Age in Gregory?
Median Population Age in Gregory is 44.0 Years.
What is the Average Family Size in Gregory
Average Family Size in Gregory is 3.6 People.
What is the Average Household Size in Gregory
Average Household Size in Gregory is 2.3 People.
How Large is the Labor Force in Gregory?
There are 743 People in the Labor Forcein in Gregory.
What is the Percentage of People in the Labor Force in Gregory?
68.7% of People are in the Labor Force in Gregory.
What is the Unemployment Rate in Gregory?
Unemployment Rate in Gregory is 3.1%.