Fairfax, SD Map & Demographics
Fairfax Map
Fairfax Overview
$27,925
PER CAPITA INCOME
$68,333
AVG FAMILY INCOME
$41,250
AVG HOUSEHOLD INCOME
7.5%
WAGE / INCOME GAP [ % ]
92.5¢/ $1
WAGE / INCOME GAP [ $ ]
0.45
INEQUALITY / GINI INDEX
135
TOTAL POPULATION
50
MALE POPULATION
85
FEMALE POPULATION
58.82
MALES / 100 FEMALES
170.00
FEMALES / 100 MALES
45.3
MEDIAN AGE
3.1
AVG FAMILY SIZE
2.0
AVG HOUSEHOLD SIZE
66
LABOR FORCE [ PEOPLE ]
66.7%
PERCENT IN LABOR FORCE
Fairfax Zip Codes
Fairfax Area Codes
Income in Fairfax
Income Overview in Fairfax
Per Capita Income in Fairfax is $27,925, while median incomes of families and households are $68,333 and $41,250 respectively.
| Characteristic | Number | Measure |
| Per Capita Income | 135 | $27,925 |
| Median Family Income | 28 | $68,333 |
| Mean Family Income | 28 | $64,925 |
| Median Household Income | 68 | $41,250 |
| Mean Household Income | 68 | $56,572 |
| Income Deficit | 28 | $0 |
| Wage / Income Gap (%) | 135 | 7.55% |
| Wage / Income Gap ($) | 135 | 92.45¢ per $1 |
| Gini / Inequality Index | 135 | 0.45 |
Earnings by Sex in Fairfax
Average Earnings in Fairfax are $31,667, $33,125 for men and $30,625 for women, a difference of 7.5%.
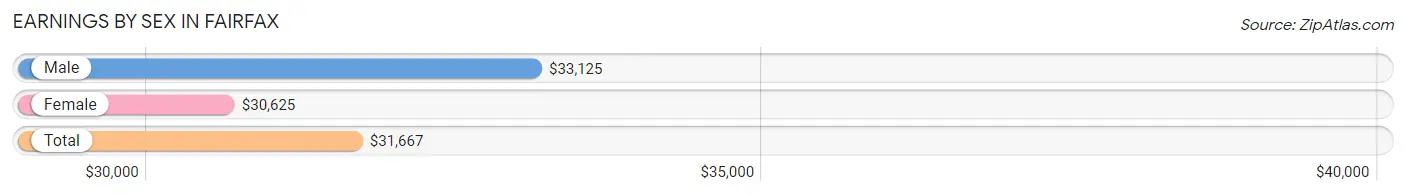
| Sex | Number | Average Earnings |
| Male | 27 (39.7%) | $33,125 |
| Female | 41 (60.3%) | $30,625 |
| Total | 68 (100.0%) | $31,667 |
Earnings by Sex by Income Bracket in Fairfax
The most common earnings brackets in Fairfax are $100,000+ for men (5 | 18.5%) and $5,000 to $7,499 for women (8 | 19.5%).
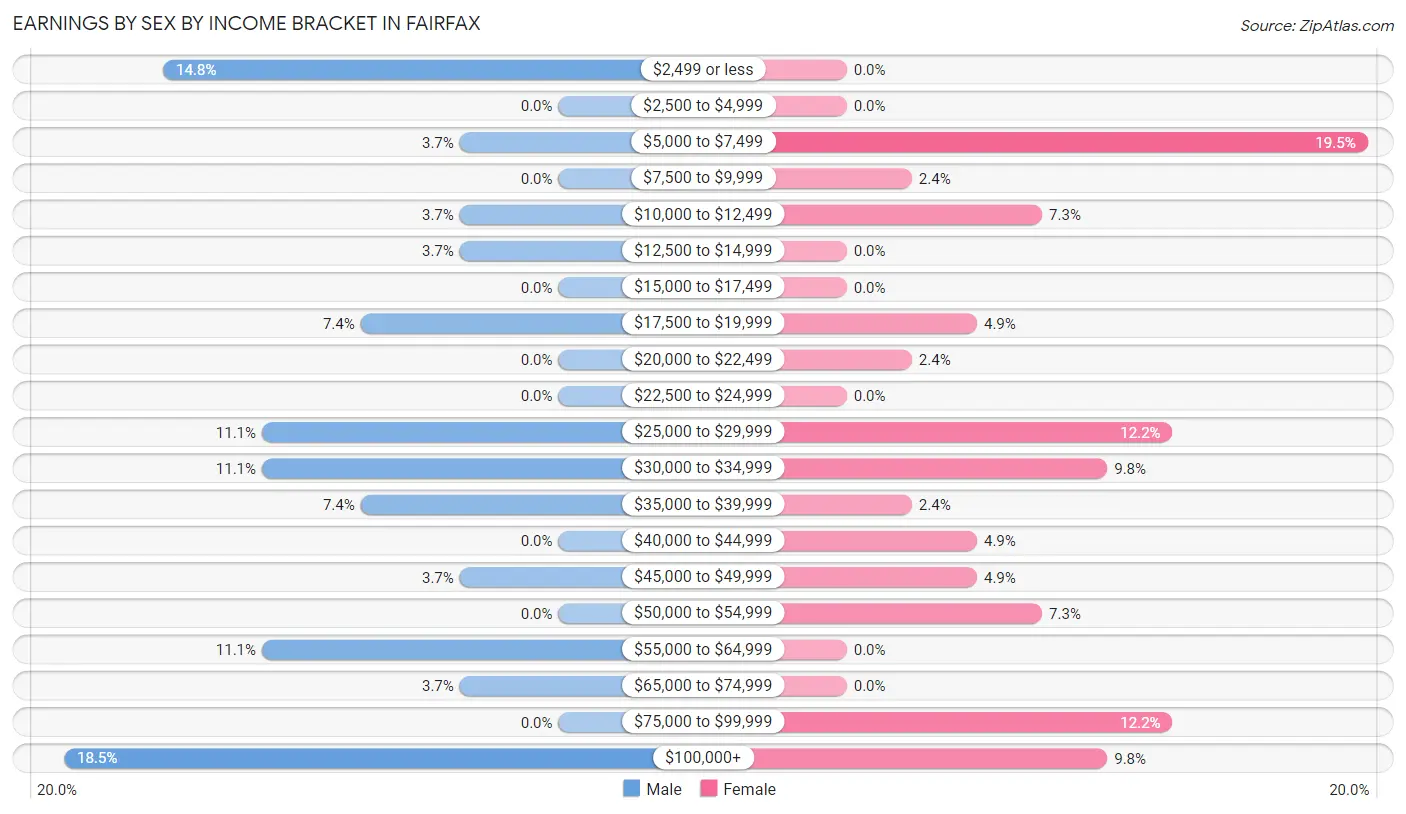
| Income | Male | Female |
| $2,499 or less | 4 (14.8%) | 0 (0.0%) |
| $2,500 to $4,999 | 0 (0.0%) | 0 (0.0%) |
| $5,000 to $7,499 | 1 (3.7%) | 8 (19.5%) |
| $7,500 to $9,999 | 0 (0.0%) | 1 (2.4%) |
| $10,000 to $12,499 | 1 (3.7%) | 3 (7.3%) |
| $12,500 to $14,999 | 1 (3.7%) | 0 (0.0%) |
| $15,000 to $17,499 | 0 (0.0%) | 0 (0.0%) |
| $17,500 to $19,999 | 2 (7.4%) | 2 (4.9%) |
| $20,000 to $22,499 | 0 (0.0%) | 1 (2.4%) |
| $22,500 to $24,999 | 0 (0.0%) | 0 (0.0%) |
| $25,000 to $29,999 | 3 (11.1%) | 5 (12.2%) |
| $30,000 to $34,999 | 3 (11.1%) | 4 (9.8%) |
| $35,000 to $39,999 | 2 (7.4%) | 1 (2.4%) |
| $40,000 to $44,999 | 0 (0.0%) | 2 (4.9%) |
| $45,000 to $49,999 | 1 (3.7%) | 2 (4.9%) |
| $50,000 to $54,999 | 0 (0.0%) | 3 (7.3%) |
| $55,000 to $64,999 | 3 (11.1%) | 0 (0.0%) |
| $65,000 to $74,999 | 1 (3.7%) | 0 (0.0%) |
| $75,000 to $99,999 | 0 (0.0%) | 5 (12.2%) |
| $100,000+ | 5 (18.5%) | 4 (9.8%) |
| Total | 27 (100.0%) | 41 (100.0%) |
Earnings by Sex by Educational Attainment in Fairfax
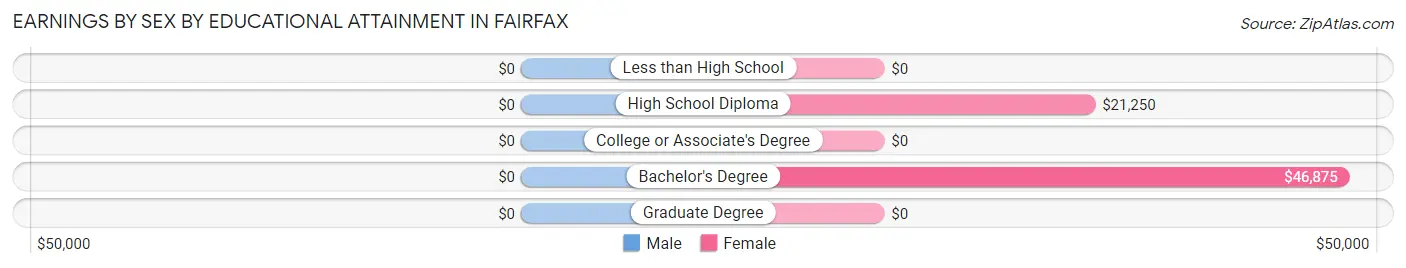
| Educational Attainment | Male Income | Female Income |
| Less than High School | - | - |
| High School Diploma | - | - |
| College or Associate's Degree | - | - |
| Bachelor's Degree | - | - |
| Graduate Degree | - | - |
| Total | $33,750 | $33,125 |
Family Income in Fairfax
Family Income Brackets in Fairfax
According to the Fairfax family income data, there are 7 families falling into the less than $10,000 income range, which is the most common income bracket and makes up 25.0% of all families.
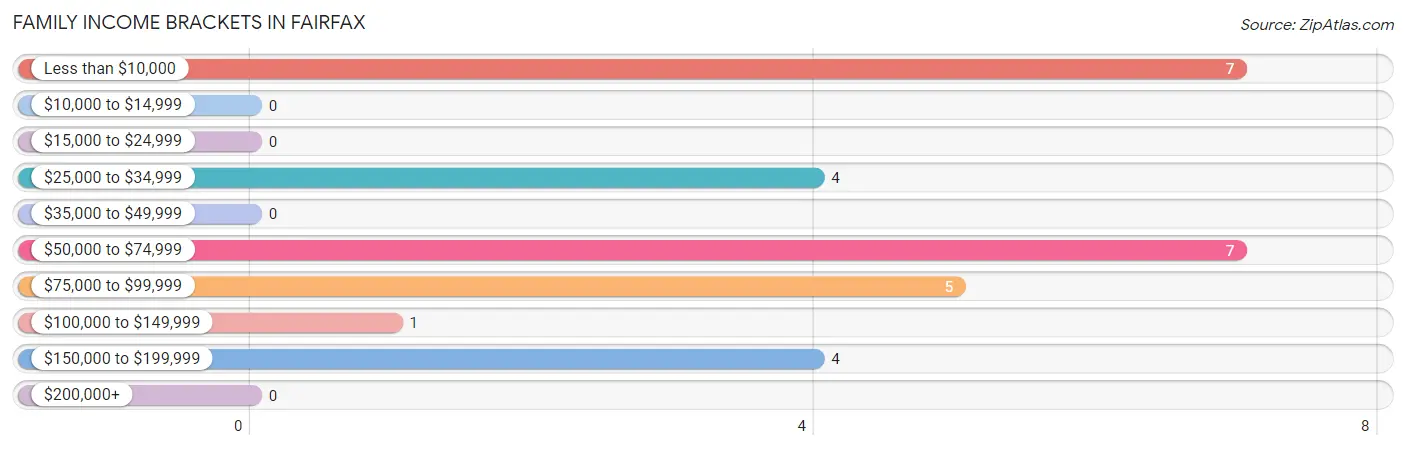
| Income Bracket | # Families | % Families |
| Less than $10,000 | 7 | 25.0% |
| $10,000 to $14,999 | 0 | 0.0% |
| $15,000 to $24,999 | 0 | 0.0% |
| $25,000 to $34,999 | 4 | 14.3% |
| $35,000 to $49,999 | 0 | 0.0% |
| $50,000 to $74,999 | 7 | 25.0% |
| $75,000 to $99,999 | 5 | 17.9% |
| $100,000 to $149,999 | 1 | 3.6% |
| $150,000 to $199,999 | 4 | 14.3% |
| $200,000+ | 0 | 0.0% |
Family Income by Famaliy Size in Fairfax
2-person families (13 | 46.4%) account for the highest median family income in Fairfax with $68,750 per family, while 2-person families (13 | 46.4%) have the highest median income of $34,375 per family member.
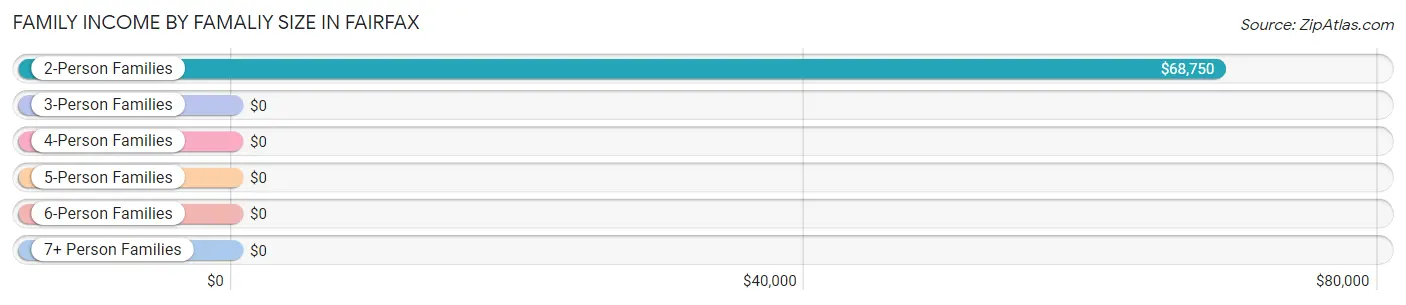
| Income Bracket | # Families | Median Income |
| 2-Person Families | 13 (46.4%) | $68,750 |
| 3-Person Families | 3 (10.7%) | $0 |
| 4-Person Families | 7 (25.0%) | $0 |
| 5-Person Families | 0 (0.0%) | $0 |
| 6-Person Families | 5 (17.9%) | $0 |
| 7+ Person Families | 0 (0.0%) | $0 |
| Total | 28 (100.0%) | $68,333 |
Family Income by Number of Earners in Fairfax
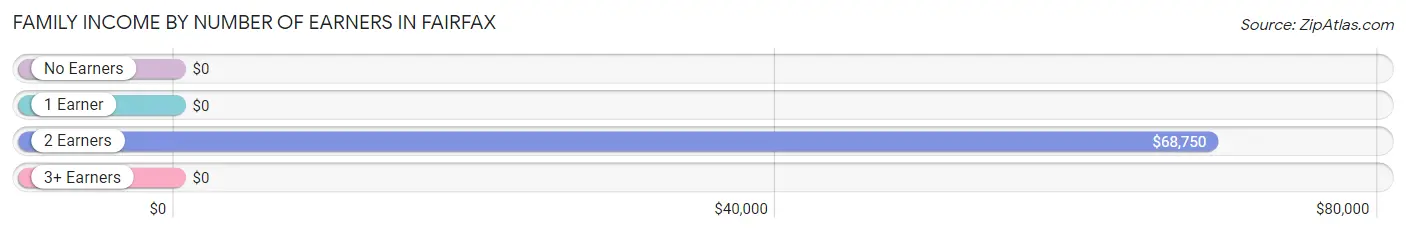
| Number of Earners | # Families | Median Income |
| No Earners | 5 (17.9%) | $0 |
| 1 Earner | 3 (10.7%) | $0 |
| 2 Earners | 20 (71.4%) | $68,750 |
| 3+ Earners | 0 (0.0%) | $0 |
| Total | 28 (100.0%) | $68,333 |
Household Income in Fairfax
Household Income Brackets in Fairfax
With 11 households falling in the category, the $15,000 to $24,999 income range is the most frequent in Fairfax, accounting for 16.2% of all households.
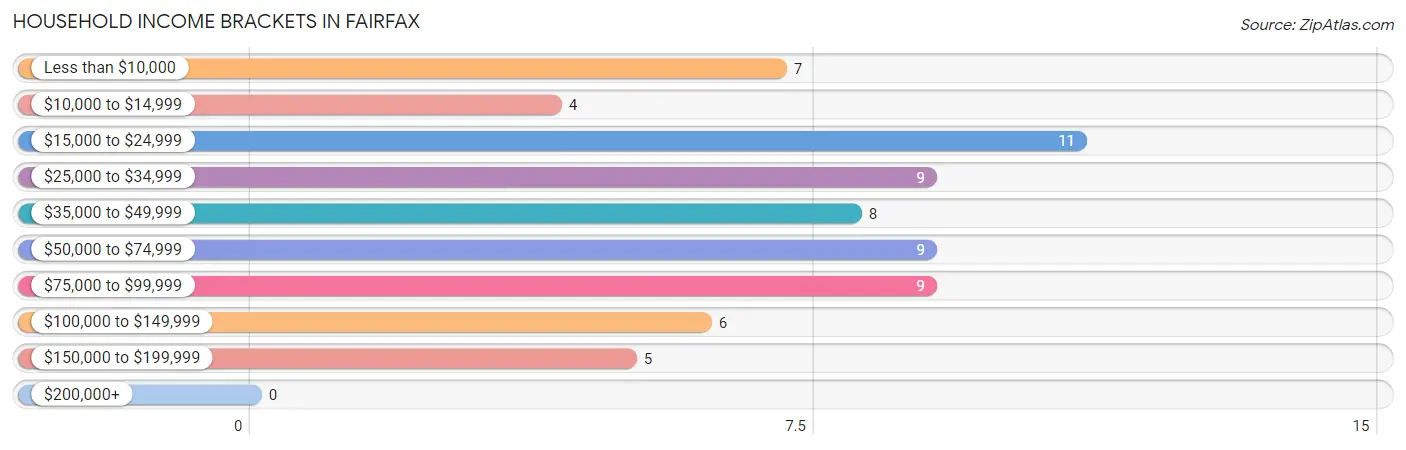
| Income Bracket | # Households | % Households |
| Less than $10,000 | 7 | 10.3% |
| $10,000 to $14,999 | 4 | 5.9% |
| $15,000 to $24,999 | 11 | 16.2% |
| $25,000 to $34,999 | 9 | 13.2% |
| $35,000 to $49,999 | 8 | 11.8% |
| $50,000 to $74,999 | 9 | 13.2% |
| $75,000 to $99,999 | 9 | 13.2% |
| $100,000 to $149,999 | 6 | 8.8% |
| $150,000 to $199,999 | 5 | 7.4% |
| $200,000+ | 0 | 0.0% |
Household Income by Householder Age in Fairfax
The median household income in Fairfax is $41,250, with the highest median household income of $68,333 found in the 45 to 64 years age bracket for the primary householder. A total of 24 households (35.3%) fall into this category. Meanwhile, the 15 to 24 years age bracket for the primary householder has the lowest median household income of $0, with 3 households (4.4%) in this group.
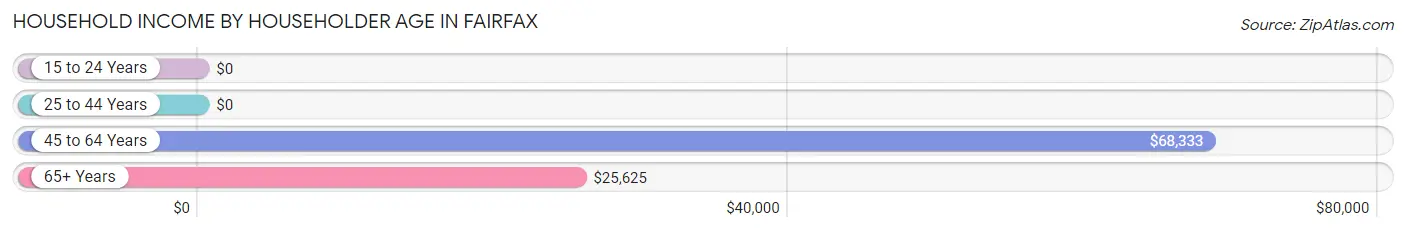
| Income Bracket | # Households | Median Income |
| 15 to 24 Years | 3 (4.4%) | $0 |
| 25 to 44 Years | 16 (23.5%) | $0 |
| 45 to 64 Years | 24 (35.3%) | $68,333 |
| 65+ Years | 25 (36.8%) | $25,625 |
| Total | 68 (100.0%) | $41,250 |
Poverty in Fairfax
Income Below Poverty by Sex and Age in Fairfax
With 12.0% poverty level for males and 18.8% for females among the residents of Fairfax, 25 to 34 year old males and under 5 year old females are the most vulnerable to poverty, with 4 males (44.4%) and 4 females (100.0%) in their respective age groups living below the poverty level.
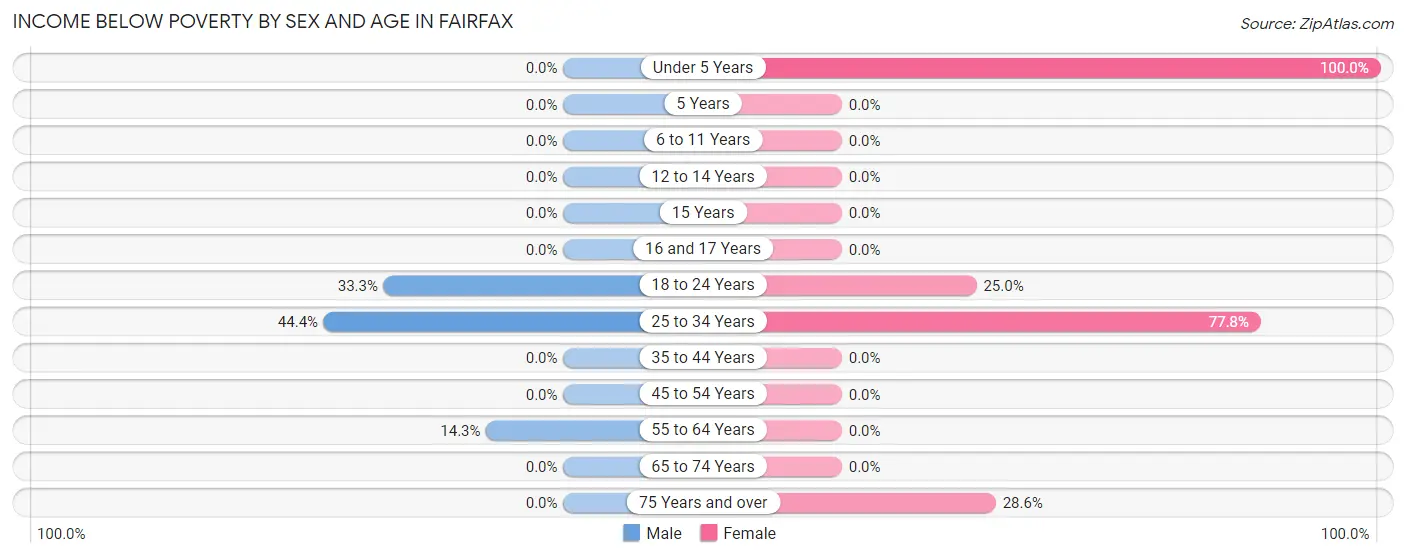
| Age Bracket | Male | Female |
| Under 5 Years | 0 (0.0%) | 4 (100.0%) |
| 5 Years | 0 (0.0%) | 0 (0.0%) |
| 6 to 11 Years | 0 (0.0%) | 0 (0.0%) |
| 12 to 14 Years | 0 (0.0%) | 0 (0.0%) |
| 15 Years | 0 (0.0%) | 0 (0.0%) |
| 16 and 17 Years | 0 (0.0%) | 0 (0.0%) |
| 18 to 24 Years | 1 (33.3%) | 1 (25.0%) |
| 25 to 34 Years | 4 (44.4%) | 7 (77.8%) |
| 35 to 44 Years | 0 (0.0%) | 0 (0.0%) |
| 45 to 54 Years | 0 (0.0%) | 0 (0.0%) |
| 55 to 64 Years | 1 (14.3%) | 0 (0.0%) |
| 65 to 74 Years | 0 (0.0%) | 0 (0.0%) |
| 75 Years and over | 0 (0.0%) | 4 (28.6%) |
| Total | 6 (12.0%) | 16 (18.8%) |
Income Above Poverty by Sex and Age in Fairfax
According to the poverty statistics in Fairfax, males aged under 5 years and females aged 6 to 11 years are the age groups that are most secure financially, with 100.0% of males and 100.0% of females in these age groups living above the poverty line.
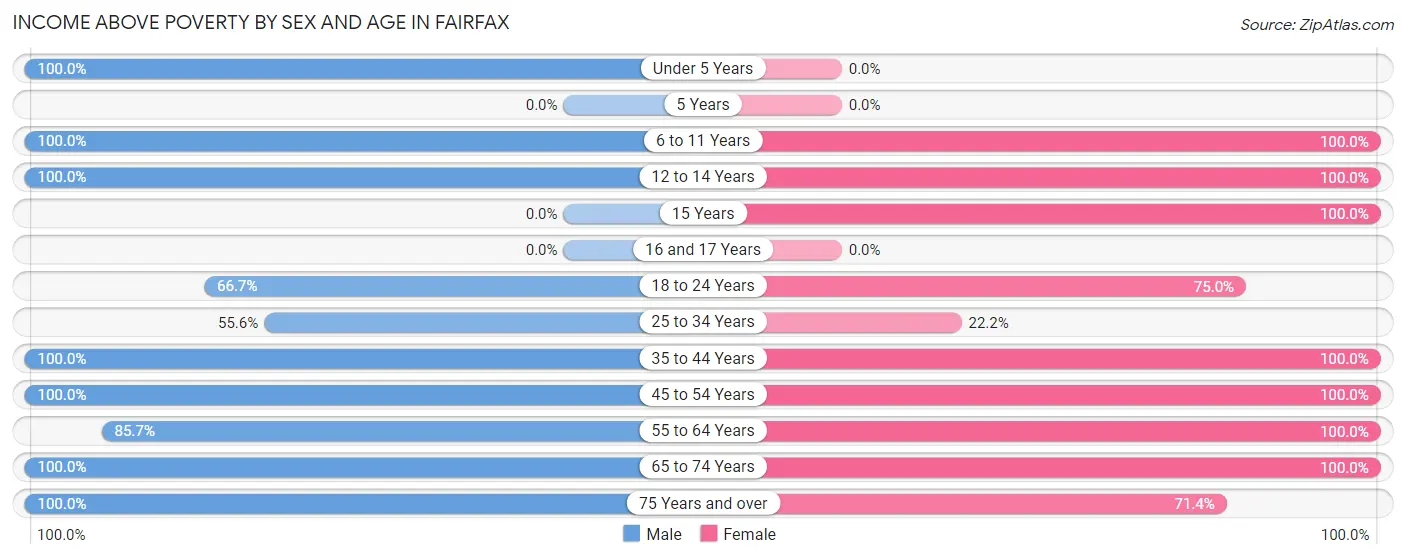
| Age Bracket | Male | Female |
| Under 5 Years | 13 (100.0%) | 0 (0.0%) |
| 5 Years | 0 (0.0%) | 0 (0.0%) |
| 6 to 11 Years | 1 (100.0%) | 10 (100.0%) |
| 12 to 14 Years | 1 (100.0%) | 1 (100.0%) |
| 15 Years | 0 (0.0%) | 6 (100.0%) |
| 16 and 17 Years | 0 (0.0%) | 0 (0.0%) |
| 18 to 24 Years | 2 (66.7%) | 3 (75.0%) |
| 25 to 34 Years | 5 (55.6%) | 2 (22.2%) |
| 35 to 44 Years | 4 (100.0%) | 2 (100.0%) |
| 45 to 54 Years | 2 (100.0%) | 11 (100.0%) |
| 55 to 64 Years | 6 (85.7%) | 15 (100.0%) |
| 65 to 74 Years | 3 (100.0%) | 9 (100.0%) |
| 75 Years and over | 7 (100.0%) | 10 (71.4%) |
| Total | 44 (88.0%) | 69 (81.2%) |
Income Below Poverty Among Married-Couple Families in Fairfax
The poverty statistics for married-couple families in Fairfax show that 25.9% or 7 of the total 27 families live below the poverty line. Families with 1 or 2 children have the highest poverty rate of 70.0%, comprising of 7 families. On the other hand, families with no children have the lowest poverty rate of 0.0%, which includes 0 families.
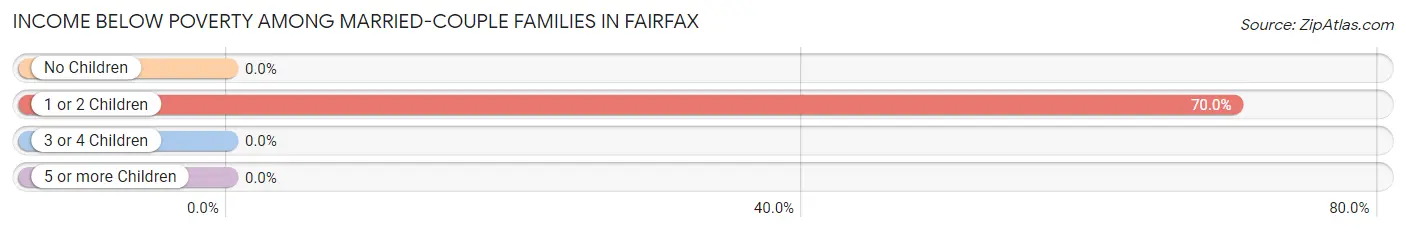
| Children | Above Poverty | Below Poverty |
| No Children | 12 (100.0%) | 0 (0.0%) |
| 1 or 2 Children | 3 (30.0%) | 7 (70.0%) |
| 3 or 4 Children | 5 (100.0%) | 0 (0.0%) |
| 5 or more Children | 0 (0.0%) | 0 (0.0%) |
| Total | 20 (74.1%) | 7 (25.9%) |
Income Below Poverty Among Single-Parent Households in Fairfax
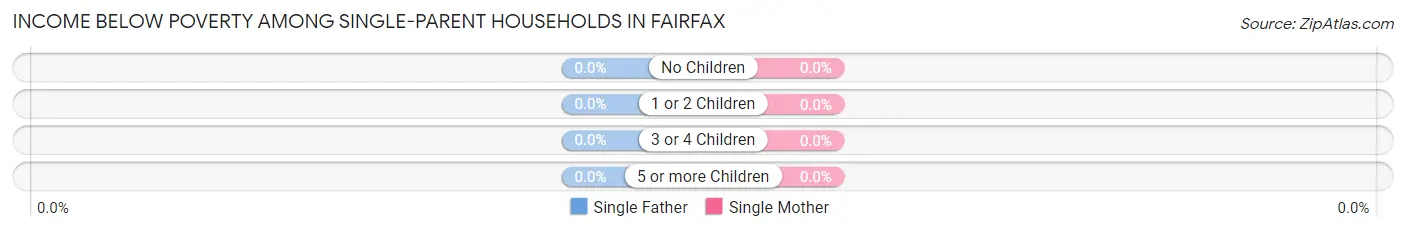
| Children | Single Father | Single Mother |
| No Children | 0 (0.0%) | 0 (0.0%) |
| 1 or 2 Children | 0 (0.0%) | 0 (0.0%) |
| 3 or 4 Children | 0 (0.0%) | 0 (0.0%) |
| 5 or more Children | 0 (0.0%) | 0 (0.0%) |
| Total | 0 (0.0%) | 0 (0.0%) |
Income Below Poverty Among Married-Couple vs Single-Parent Households in Fairfax
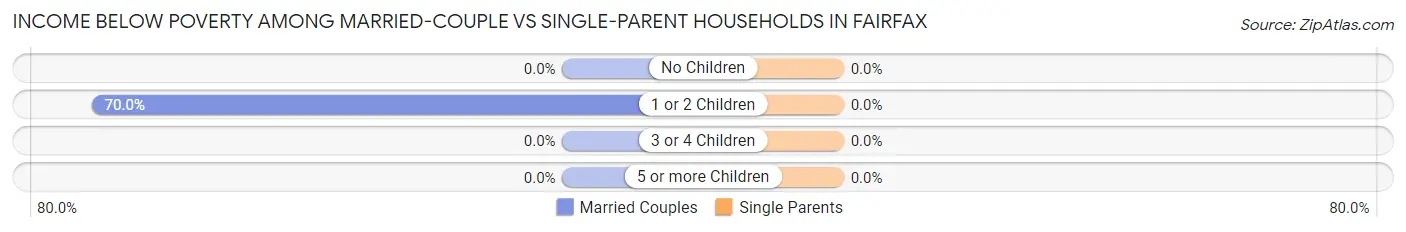
| Children | Married-Couple Families | Single-Parent Households |
| No Children | 0 (0.0%) | 0 (0.0%) |
| 1 or 2 Children | 7 (70.0%) | 0 (0.0%) |
| 3 or 4 Children | 0 (0.0%) | 0 (0.0%) |
| 5 or more Children | 0 (0.0%) | 0 (0.0%) |
| Total | 7 (25.9%) | 0 (0.0%) |
Race in Fairfax
The most populous races in Fairfax are White / Caucasian (133 | 98.5%), and Asian (2 | 1.5%).
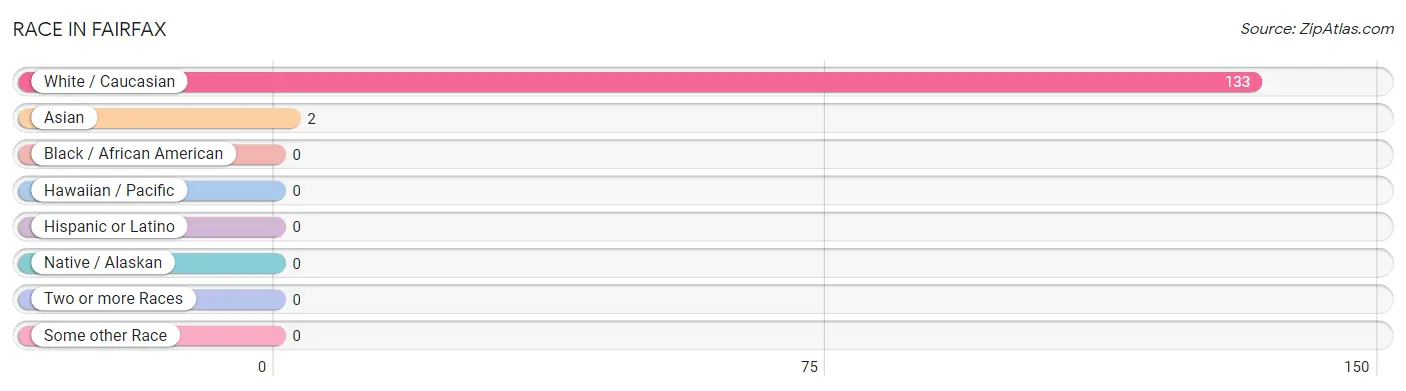
| Race | # Population | % Population |
| Asian | 2 | 1.5% |
| Black / African American | 0 | 0.0% |
| Hawaiian / Pacific | 0 | 0.0% |
| Hispanic or Latino | 0 | 0.0% |
| Native / Alaskan | 0 | 0.0% |
| White / Caucasian | 133 | 98.5% |
| Two or more Races | 0 | 0.0% |
| Some other Race | 0 | 0.0% |
| Total | 135 | 100.0% |
Ancestry in Fairfax
The most populous ancestries reported in Fairfax are German (46 | 34.1%), American (31 | 23.0%), Czech (14 | 10.4%), Dutch (8 | 5.9%), and English (8 | 5.9%), together accounting for 79.3% of all Fairfax residents.
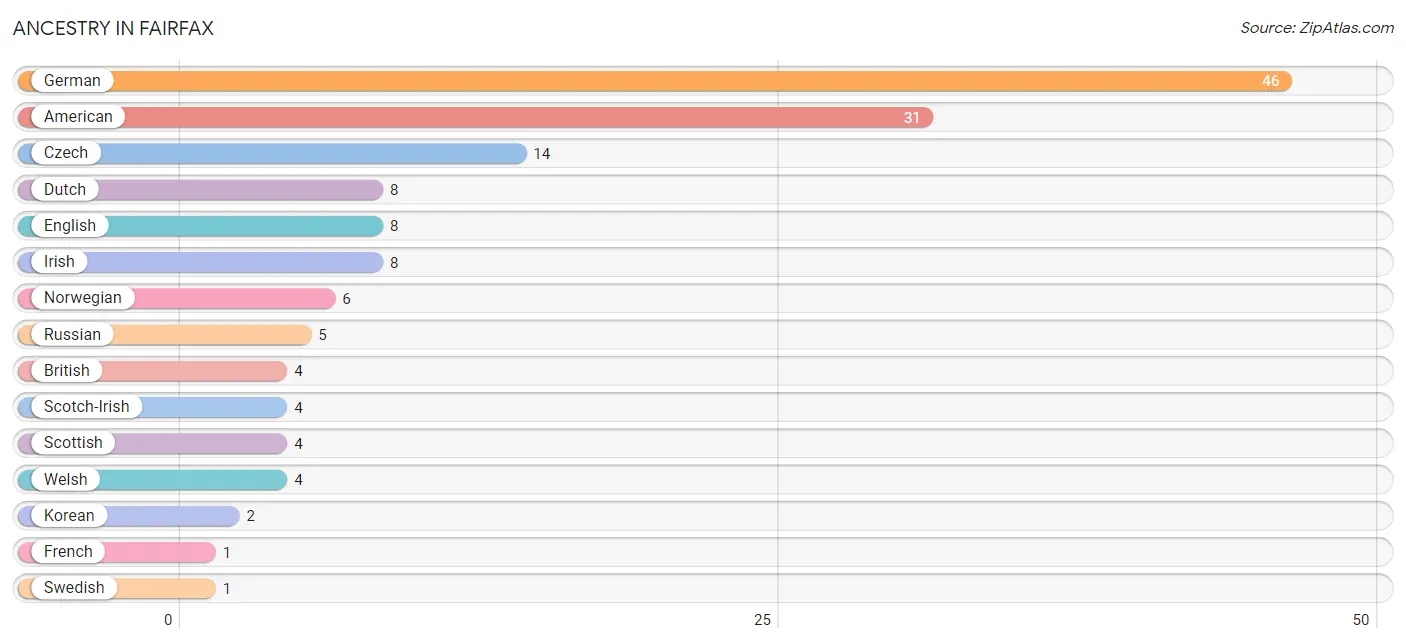
| Ancestry | # Population | % Population |
| American | 31 | 23.0% |
| British | 4 | 3.0% |
| Czech | 14 | 10.4% |
| Dutch | 8 | 5.9% |
| English | 8 | 5.9% |
| French | 1 | 0.7% |
| German | 46 | 34.1% |
| Irish | 8 | 5.9% |
| Korean | 2 | 1.5% |
| Norwegian | 6 | 4.4% |
| Russian | 5 | 3.7% |
| Scotch-Irish | 4 | 3.0% |
| Scottish | 4 | 3.0% |
| Swedish | 1 | 0.7% |
| Welsh | 4 | 3.0% | View All 15 Rows |
Immigrants in Fairfax
The most numerous immigrant groups reported in Fairfax came from Asia (2 | 1.5%), Philippines (2 | 1.5%), and South Eastern Asia (2 | 1.5%), together accounting for 4.4% of all Fairfax residents.
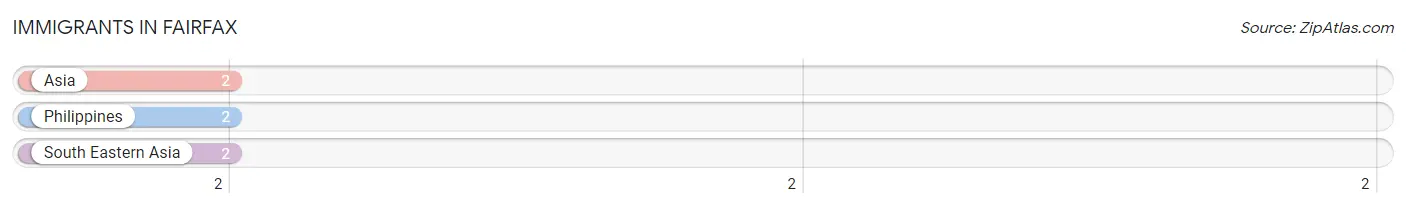
| Immigration Origin | # Population | % Population |
| Asia | 2 | 1.5% |
| Philippines | 2 | 1.5% |
| South Eastern Asia | 2 | 1.5% | View All 3 Rows |
Sex and Age in Fairfax
Sex and Age in Fairfax
The most populous age groups in Fairfax are Under 5 Years (13 | 26.0%) for men and 5 to 9 Years (10 | 11.8%) for women.
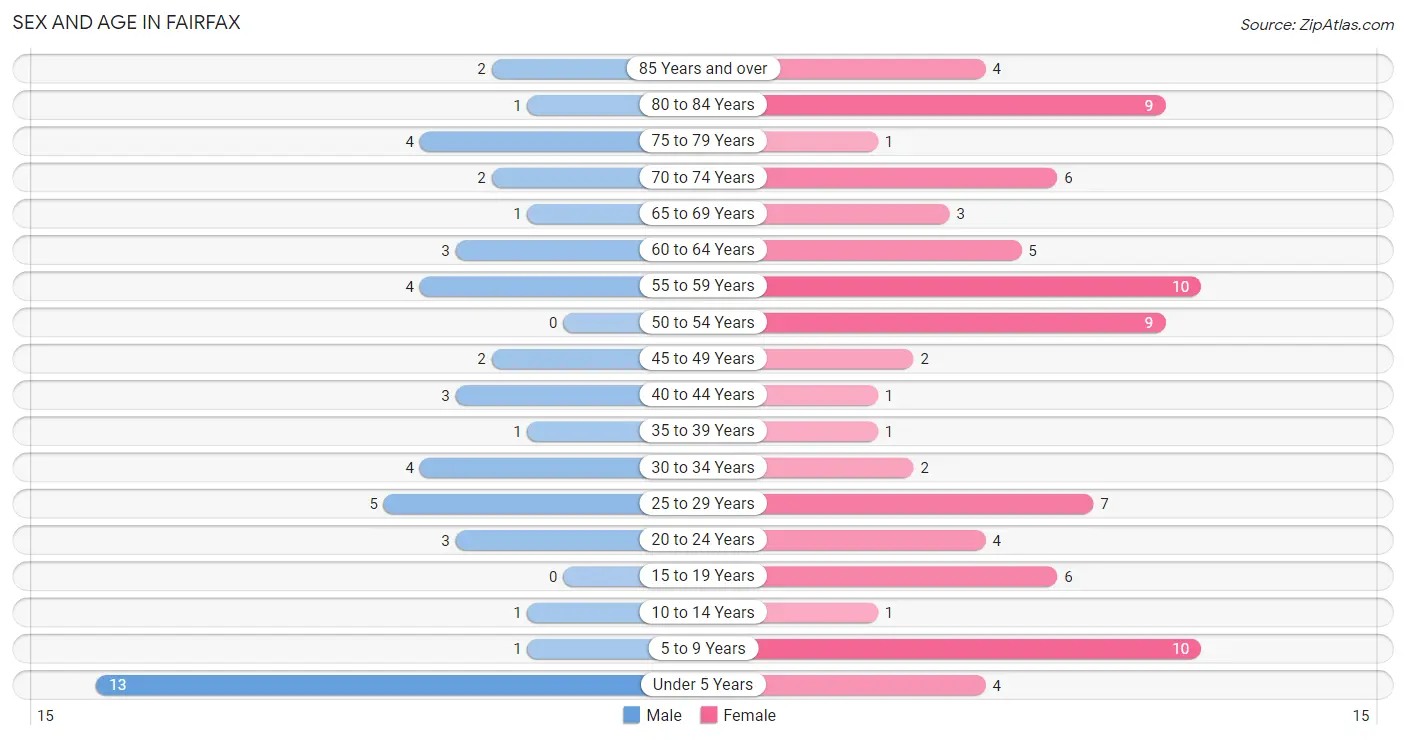
| Age Bracket | Male | Female |
| Under 5 Years | 13 (26.0%) | 4 (4.7%) |
| 5 to 9 Years | 1 (2.0%) | 10 (11.8%) |
| 10 to 14 Years | 1 (2.0%) | 1 (1.2%) |
| 15 to 19 Years | 0 (0.0%) | 6 (7.1%) |
| 20 to 24 Years | 3 (6.0%) | 4 (4.7%) |
| 25 to 29 Years | 5 (10.0%) | 7 (8.2%) |
| 30 to 34 Years | 4 (8.0%) | 2 (2.4%) |
| 35 to 39 Years | 1 (2.0%) | 1 (1.2%) |
| 40 to 44 Years | 3 (6.0%) | 1 (1.2%) |
| 45 to 49 Years | 2 (4.0%) | 2 (2.4%) |
| 50 to 54 Years | 0 (0.0%) | 9 (10.6%) |
| 55 to 59 Years | 4 (8.0%) | 10 (11.8%) |
| 60 to 64 Years | 3 (6.0%) | 5 (5.9%) |
| 65 to 69 Years | 1 (2.0%) | 3 (3.5%) |
| 70 to 74 Years | 2 (4.0%) | 6 (7.1%) |
| 75 to 79 Years | 4 (8.0%) | 1 (1.2%) |
| 80 to 84 Years | 1 (2.0%) | 9 (10.6%) |
| 85 Years and over | 2 (4.0%) | 4 (4.7%) |
| Total | 50 (100.0%) | 85 (100.0%) |
Families and Households in Fairfax
Median Family Size in Fairfax
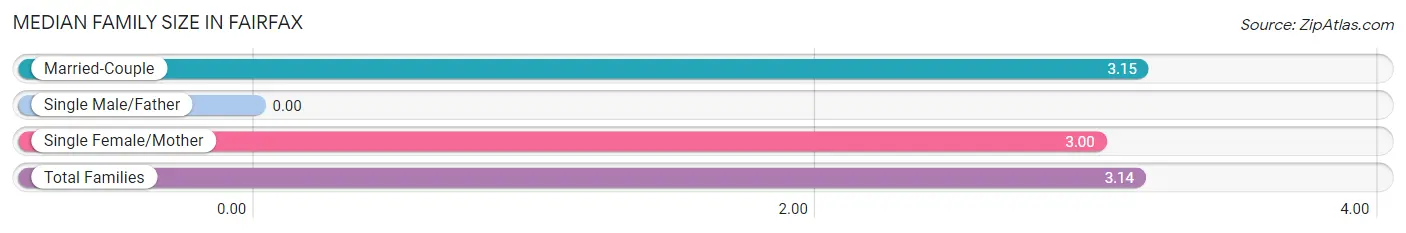
| Family Type | # Families | Family Size |
| Married-Couple | 27 (96.4%) | 3.15 |
| Single Male/Father | 0 (0.0%) | - |
| Single Female/Mother | 1 (3.6%) | 3.00 |
| Total Families | 28 (100.0%) | 3.14 |
Median Household Size in Fairfax
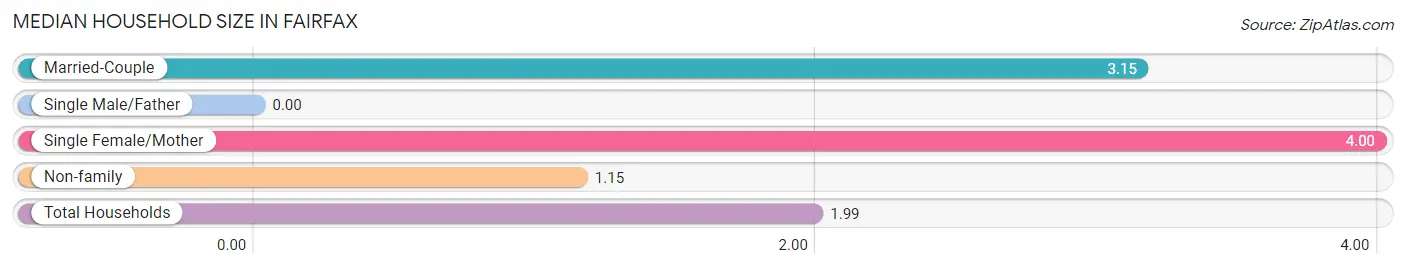
| Household Type | # Households | Household Size |
| Married-Couple | 27 (39.7%) | 3.15 |
| Single Male/Father | 0 (0.0%) | - |
| Single Female/Mother | 1 (1.5%) | 4.00 |
| Non-family | 40 (58.8%) | 1.15 |
| Total Households | 68 (100.0%) | 1.99 |
Household Size by Marriage Status in Fairfax
Out of a total of 68 households in Fairfax, 28 (41.2%) are family households, while 40 (58.8%) are nonfamily households. The most numerous type of family households are 2-person households, comprising 12, and the most common type of nonfamily households are 1-person households, comprising 35.
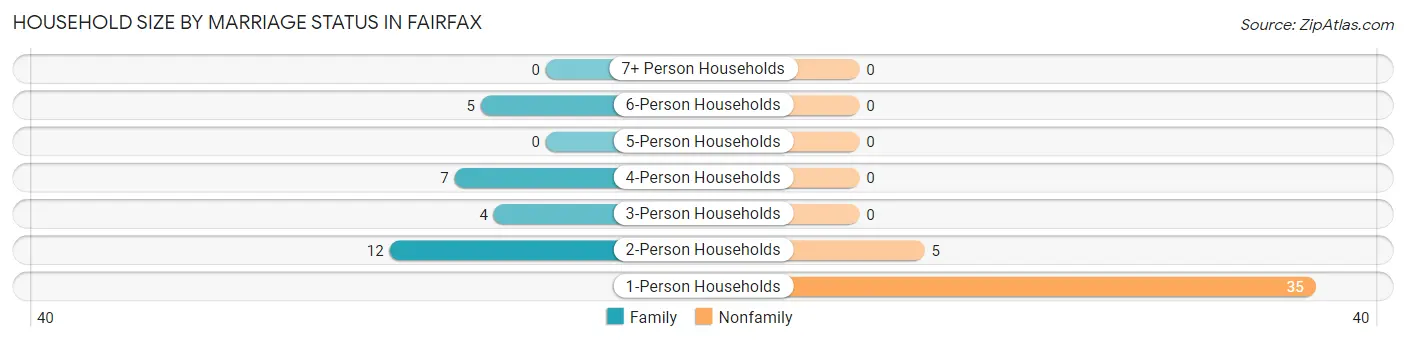
| Household Size | Family Households | Nonfamily Households |
| 1-Person Households | - | 35 (51.5%) |
| 2-Person Households | 12 (17.6%) | 5 (7.3%) |
| 3-Person Households | 4 (5.9%) | 0 (0.0%) |
| 4-Person Households | 7 (10.3%) | 0 (0.0%) |
| 5-Person Households | 0 (0.0%) | 0 (0.0%) |
| 6-Person Households | 5 (7.3%) | 0 (0.0%) |
| 7+ Person Households | 0 (0.0%) | 0 (0.0%) |
| Total | 28 (41.2%) | 40 (58.8%) |
Female Fertility in Fairfax
Fertility by Age in Fairfax
Average fertility rate in Fairfax is 391.0 births per 1,000 women. Women in the age bracket of 20 to 34 years have the highest fertility rate with 692.0 births per 1,000 women. Women in the age bracket of 20 to 34 years acount for 100.0% of all women with births.
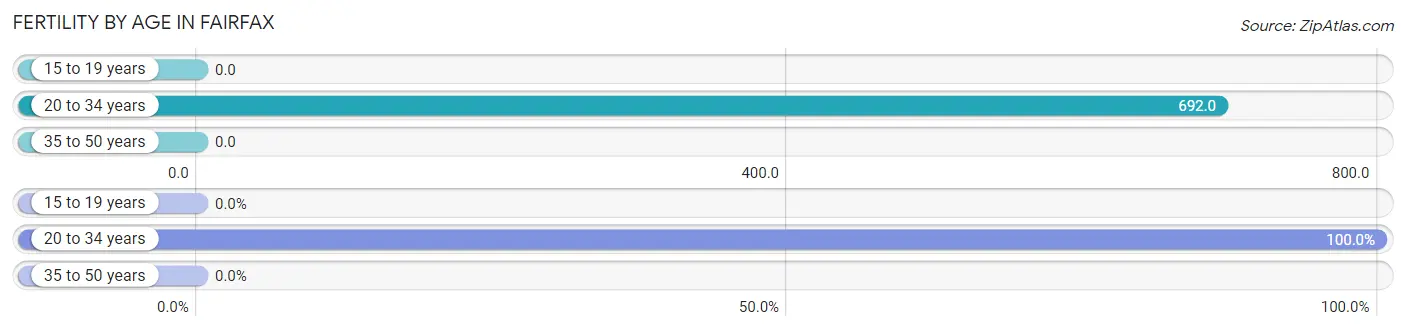
| Age Bracket | Women with Births | Births / 1,000 Women |
| 15 to 19 years | 0 (0.0%) | 0.0 |
| 20 to 34 years | 9 (100.0%) | 692.0 |
| 35 to 50 years | 0 (0.0%) | 0.0 |
| Total | 9 (100.0%) | 391.0 |
Fertility by Age by Marriage Status in Fairfax
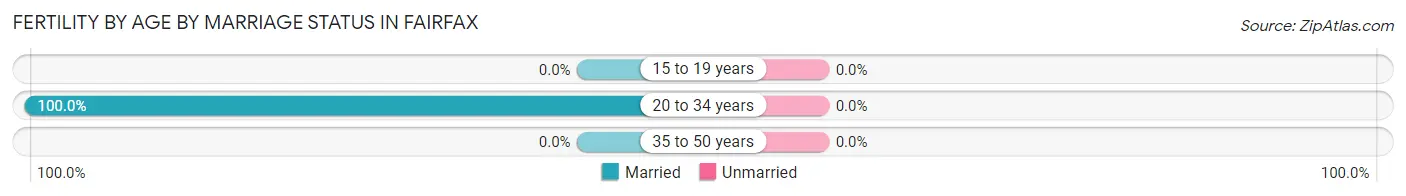
| Age Bracket | Married | Unmarried |
| 15 to 19 years | 0 (0.0%) | 0 (0.0%) |
| 20 to 34 years | 9 (100.0%) | 0 (0.0%) |
| 35 to 50 years | 0 (0.0%) | 0 (0.0%) |
| Total | 9 (100.0%) | 0 (0.0%) |
Fertility by Education in Fairfax
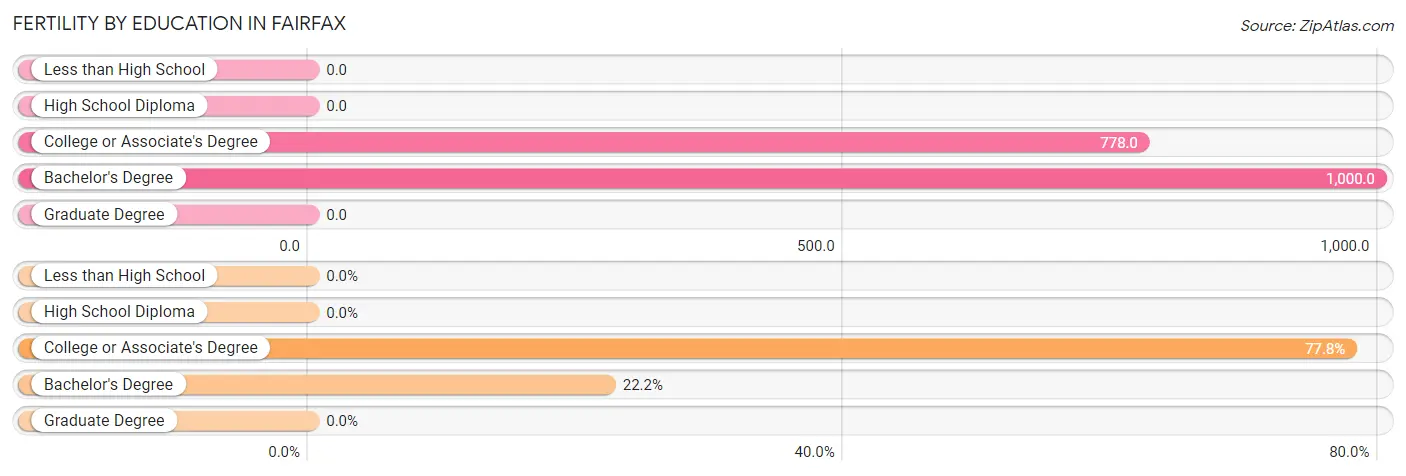
| Educational Attainment | Women with Births | Births / 1,000 Women |
| Less than High School | 0 (0.0%) | 0.0 |
| High School Diploma | 0 (0.0%) | 0.0 |
| College or Associate's Degree | 7 (77.8%) | 778.0 |
| Bachelor's Degree | 2 (22.2%) | 1,000.0 |
| Graduate Degree | 0 (0.0%) | 0.0 |
| Total | 9 (100.0%) | 391.0 |
Fertility by Education by Marriage Status in Fairfax
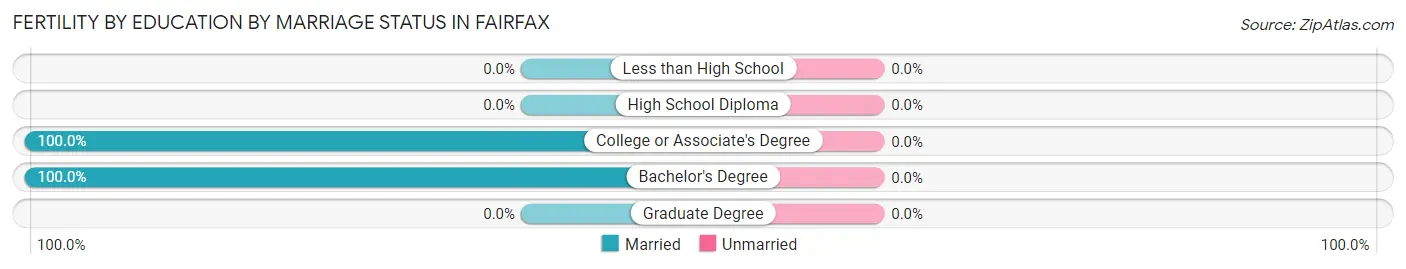
| Educational Attainment | Married | Unmarried |
| Less than High School | 0 (0.0%) | 0 (0.0%) |
| High School Diploma | 0 (0.0%) | 0 (0.0%) |
| College or Associate's Degree | 7 (100.0%) | 0 (0.0%) |
| Bachelor's Degree | 2 (100.0%) | 0 (0.0%) |
| Graduate Degree | 0 (0.0%) | 0 (0.0%) |
| Total | 9 (100.0%) | 0 (0.0%) |
Employment Characteristics in Fairfax
Employment by Class of Employer in Fairfax
Among the 66 employed individuals in Fairfax, private company employees (29 | 43.9%), self-employed (not incorporated) (16 | 24.2%), and self-employed (incorporated) (7 | 10.6%) make up the most common classes of employment.
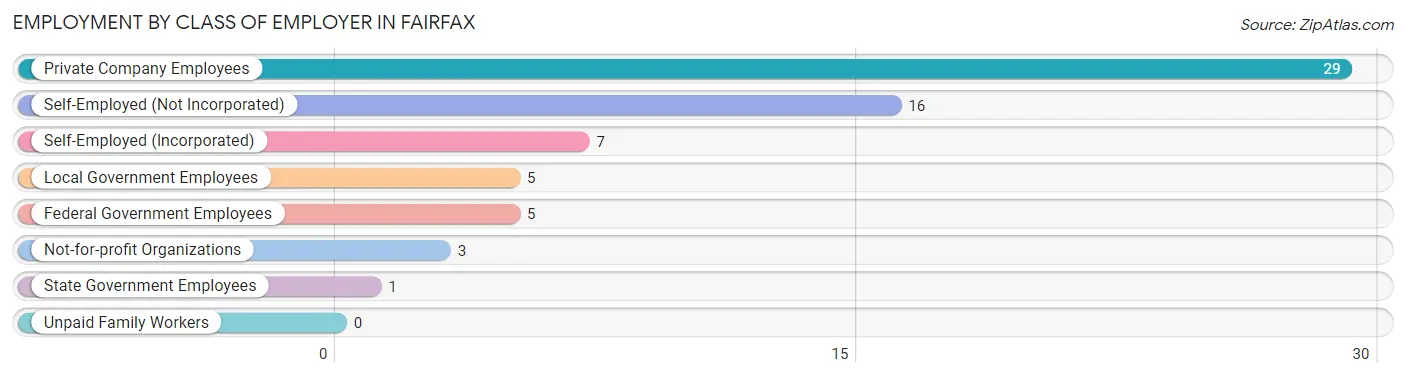
| Employer Class | # Employees | % Employees |
| Private Company Employees | 29 | 43.9% |
| Self-Employed (Incorporated) | 7 | 10.6% |
| Self-Employed (Not Incorporated) | 16 | 24.2% |
| Not-for-profit Organizations | 3 | 4.5% |
| Local Government Employees | 5 | 7.6% |
| State Government Employees | 1 | 1.5% |
| Federal Government Employees | 5 | 7.6% |
| Unpaid Family Workers | 0 | 0.0% |
| Total | 66 | 100.0% |
Employment Status by Age in Fairfax
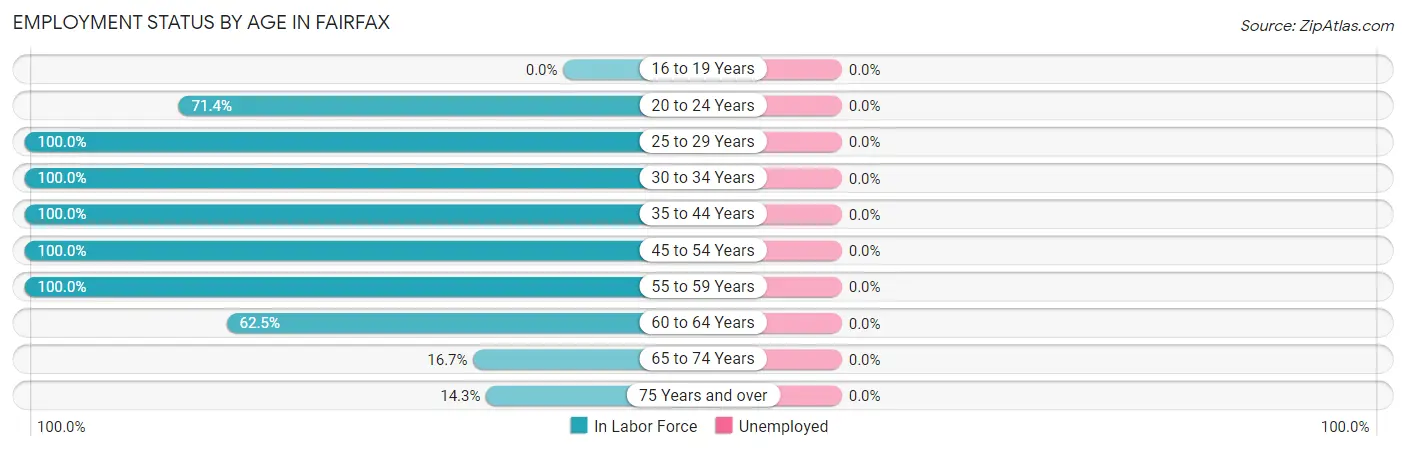
| Age Bracket | In Labor Force | Unemployed |
| 16 to 19 Years | 0 (0.0%) | 0 (0.0%) |
| 20 to 24 Years | 5 (71.4%) | 0 (0.0%) |
| 25 to 29 Years | 12 (100.0%) | 0 (0.0%) |
| 30 to 34 Years | 6 (100.0%) | 0 (0.0%) |
| 35 to 44 Years | 6 (100.0%) | 0 (0.0%) |
| 45 to 54 Years | 13 (100.0%) | 0 (0.0%) |
| 55 to 59 Years | 14 (100.0%) | 0 (0.0%) |
| 60 to 64 Years | 5 (62.5%) | 0 (0.0%) |
| 65 to 74 Years | 2 (16.7%) | 0 (0.0%) |
| 75 Years and over | 3 (14.3%) | 0 (0.0%) |
| Total | 66 (66.7%) | 0 (0.0%) |
Employment Status by Educational Attainment in Fairfax
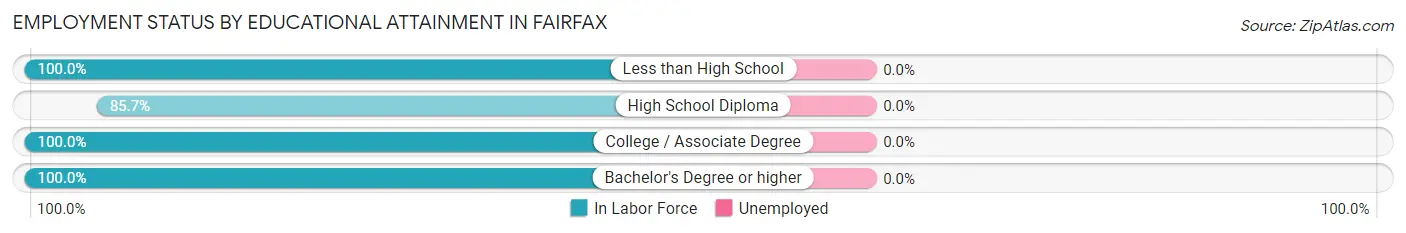
| Educational Attainment | In Labor Force | Unemployed |
| Less than High School | 2 (100.0%) | 0 (0.0%) |
| High School Diploma | 18 (85.7%) | 0 (0.0%) |
| College / Associate Degree | 27 (100.0%) | 0 (0.0%) |
| Bachelor's Degree or higher | 9 (100.0%) | 0 (0.0%) |
| Total | 56 (94.9%) | 0 (0.0%) |
Employment Occupations by Sex in Fairfax
Management, Business, Science and Arts Occupations
The most common Management, Business, Science and Arts occupations in Fairfax are Management (11 | 16.7%), Community & Social Service (6 | 9.1%), Health Diagnosing & Treating (5 | 7.6%), Health Technologists (4 | 6.1%), and Education Instruction & Library (3 | 4.5%).
Management, Business, Science and Arts Occupations by Sex
Within the Management, Business, Science and Arts occupations in Fairfax, the most male-oriented occupations are Computers, Engineering & Science (100.0%), Architecture & Engineering (100.0%), and Education, Arts & Media (100.0%), while the most female-oriented occupations are Education Instruction & Library (100.0%), Arts, Media & Entertainment (100.0%), and Health Technologists (100.0%).
| Occupation | Male | Female |
| Management | 7 (63.6%) | 4 (36.4%) |
| Business & Financial | 0 (0.0%) | 0 (0.0%) |
| Computers, Engineering & Science | 1 (100.0%) | 0 (0.0%) |
| Computers & Mathematics | 0 (0.0%) | 0 (0.0%) |
| Architecture & Engineering | 1 (100.0%) | 0 (0.0%) |
| Life, Physical & Social Science | 0 (0.0%) | 0 (0.0%) |
| Community & Social Service | 1 (16.7%) | 5 (83.3%) |
| Education, Arts & Media | 1 (100.0%) | 0 (0.0%) |
| Legal Services & Support | 0 (0.0%) | 0 (0.0%) |
| Education Instruction & Library | 0 (0.0%) | 3 (100.0%) |
| Arts, Media & Entertainment | 0 (0.0%) | 2 (100.0%) |
| Health Diagnosing & Treating | 1 (20.0%) | 4 (80.0%) |
| Health Technologists | 0 (0.0%) | 4 (100.0%) |
| Total (Category) | 10 (43.5%) | 13 (56.5%) |
| Total (Overall) | 25 (37.9%) | 41 (62.1%) |
Services Occupations
The most common Services occupations in Fairfax are Healthcare Support (7 | 10.6%), Personal Care & Service (7 | 10.6%), and Food Preparation & Serving (1 | 1.5%).
Services Occupations by Sex
| Occupation | Male | Female |
| Healthcare Support | 0 (0.0%) | 7 (100.0%) |
| Security & Protection | 0 (0.0%) | 0 (0.0%) |
| Firefighting & Prevention | 0 (0.0%) | 0 (0.0%) |
| Law Enforcement | 0 (0.0%) | 0 (0.0%) |
| Food Preparation & Serving | 0 (0.0%) | 1 (100.0%) |
| Cleaning & Maintenance | 0 (0.0%) | 0 (0.0%) |
| Personal Care & Service | 0 (0.0%) | 7 (100.0%) |
| Total (Category) | 0 (0.0%) | 15 (100.0%) |
| Total (Overall) | 25 (37.9%) | 41 (62.1%) |
Sales and Office Occupations
The most common Sales and Office occupations in Fairfax are Office & Administration (10 | 15.1%), and Sales & Related (8 | 12.1%).
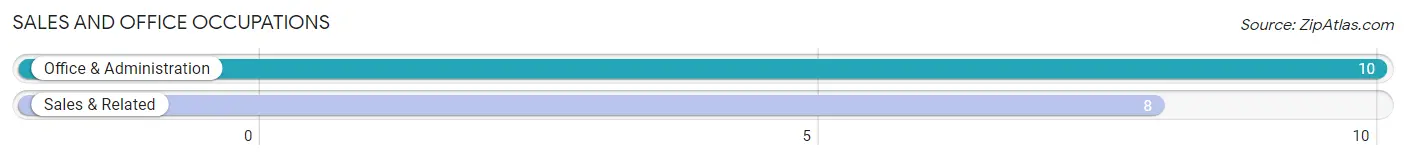
Sales and Office Occupations by Sex
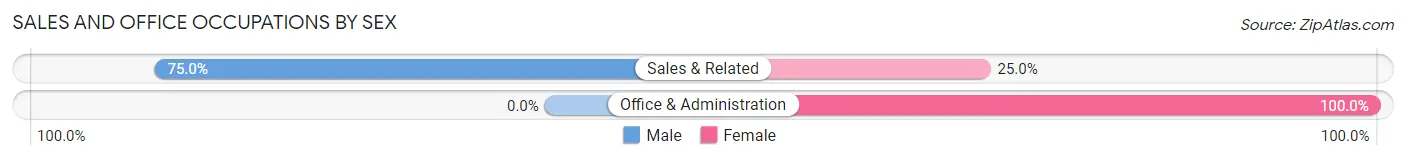
| Occupation | Male | Female |
| Sales & Related | 6 (75.0%) | 2 (25.0%) |
| Office & Administration | 0 (0.0%) | 10 (100.0%) |
| Total (Category) | 6 (33.3%) | 12 (66.7%) |
| Total (Overall) | 25 (37.9%) | 41 (62.1%) |
Natural Resources, Construction and Maintenance Occupations
The most common Natural Resources, Construction and Maintenance occupations in Fairfax are Construction & Extraction (4 | 6.1%), Installation, Maintenance & Repair (2 | 3.0%), and Farming, Fishing & Forestry (1 | 1.5%).
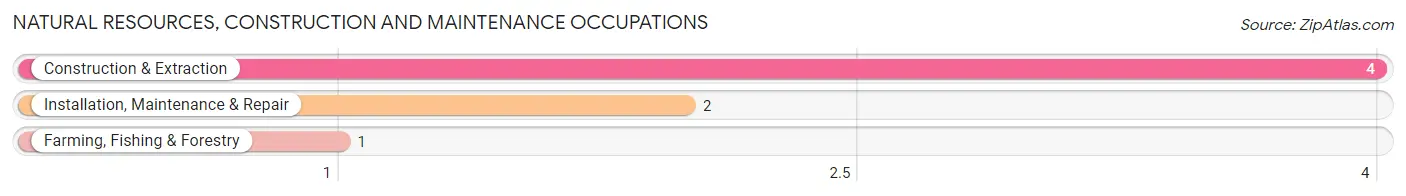
Natural Resources, Construction and Maintenance Occupations by Sex
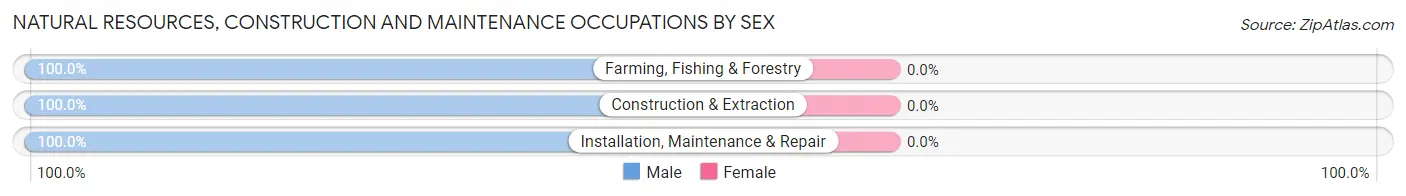
| Occupation | Male | Female |
| Farming, Fishing & Forestry | 1 (100.0%) | 0 (0.0%) |
| Construction & Extraction | 4 (100.0%) | 0 (0.0%) |
| Installation, Maintenance & Repair | 2 (100.0%) | 0 (0.0%) |
| Total (Category) | 7 (100.0%) | 0 (0.0%) |
| Total (Overall) | 25 (37.9%) | 41 (62.1%) |
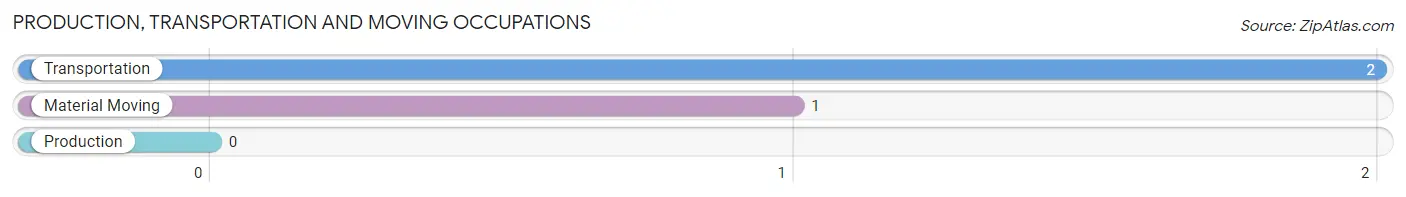
Production, Transportation and Moving Occupations
The most common Production, Transportation and Moving occupations in Fairfax are Transportation (2 | 3.0%), and Material Moving (1 | 1.5%).
Production, Transportation and Moving Occupations by Sex
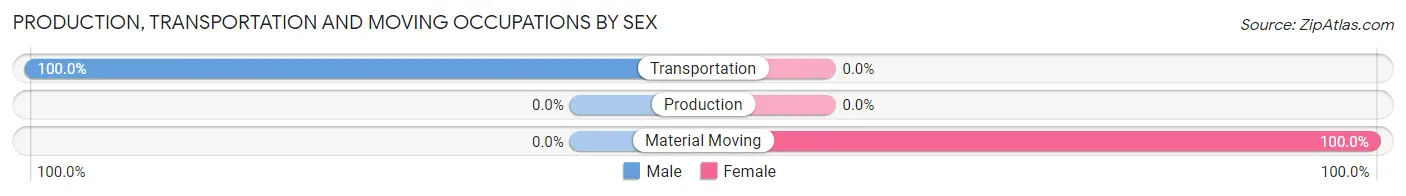
| Occupation | Male | Female |
| Production | 0 (0.0%) | 0 (0.0%) |
| Transportation | 2 (100.0%) | 0 (0.0%) |
| Material Moving | 0 (0.0%) | 1 (100.0%) |
| Total (Category) | 2 (66.7%) | 1 (33.3%) |
| Total (Overall) | 25 (37.9%) | 41 (62.1%) |
Employment Industries by Sex in Fairfax
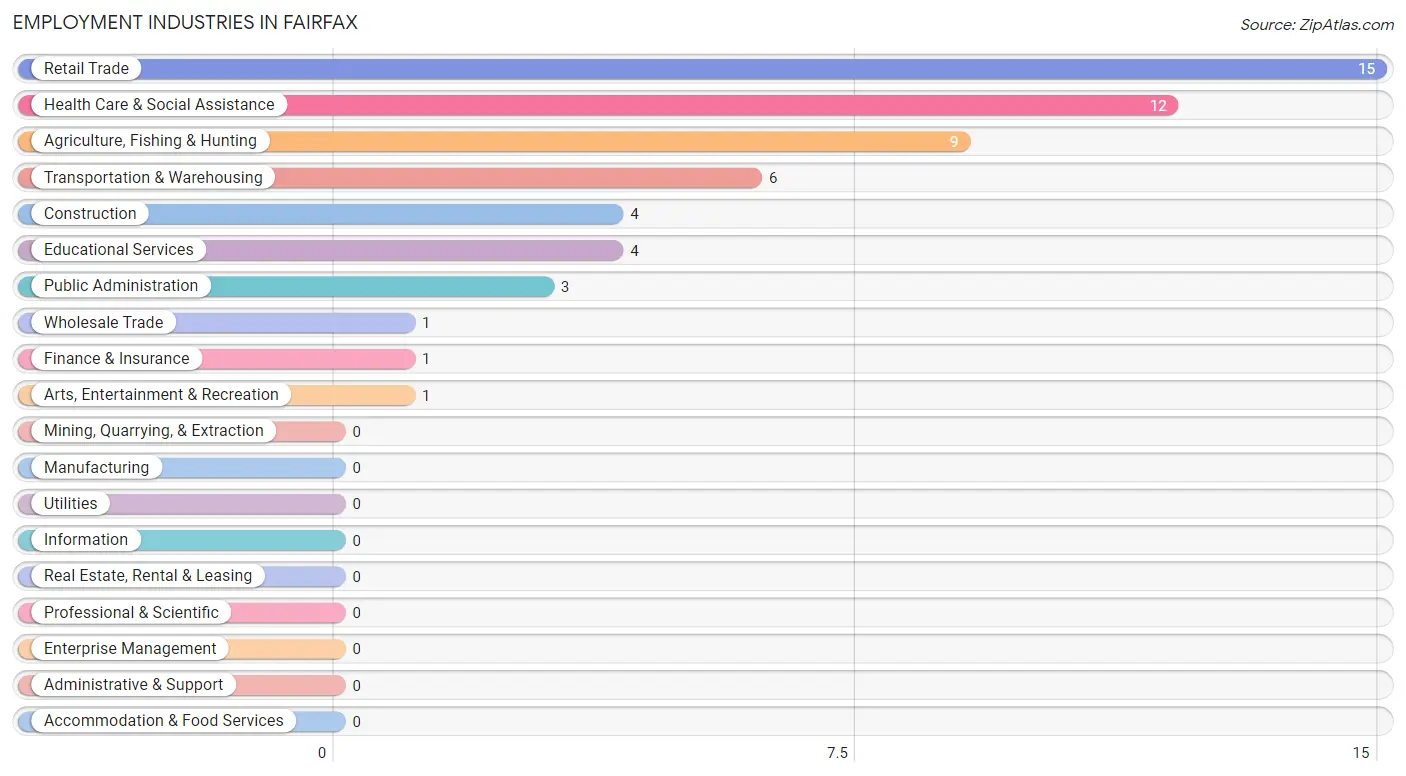
Employment Industries in Fairfax
The major employment industries in Fairfax include Retail Trade (15 | 22.7%), Health Care & Social Assistance (12 | 18.2%), Agriculture, Fishing & Hunting (9 | 13.6%), Transportation & Warehousing (6 | 9.1%), and Construction (4 | 6.1%).
Employment Industries by Sex in Fairfax
The Fairfax industries that see more men than women are Construction (100.0%), Wholesale Trade (100.0%), and Agriculture, Fishing & Hunting (77.8%), whereas the industries that tend to have a higher number of women are Finance & Insurance (100.0%), Educational Services (100.0%), and Health Care & Social Assistance (100.0%).
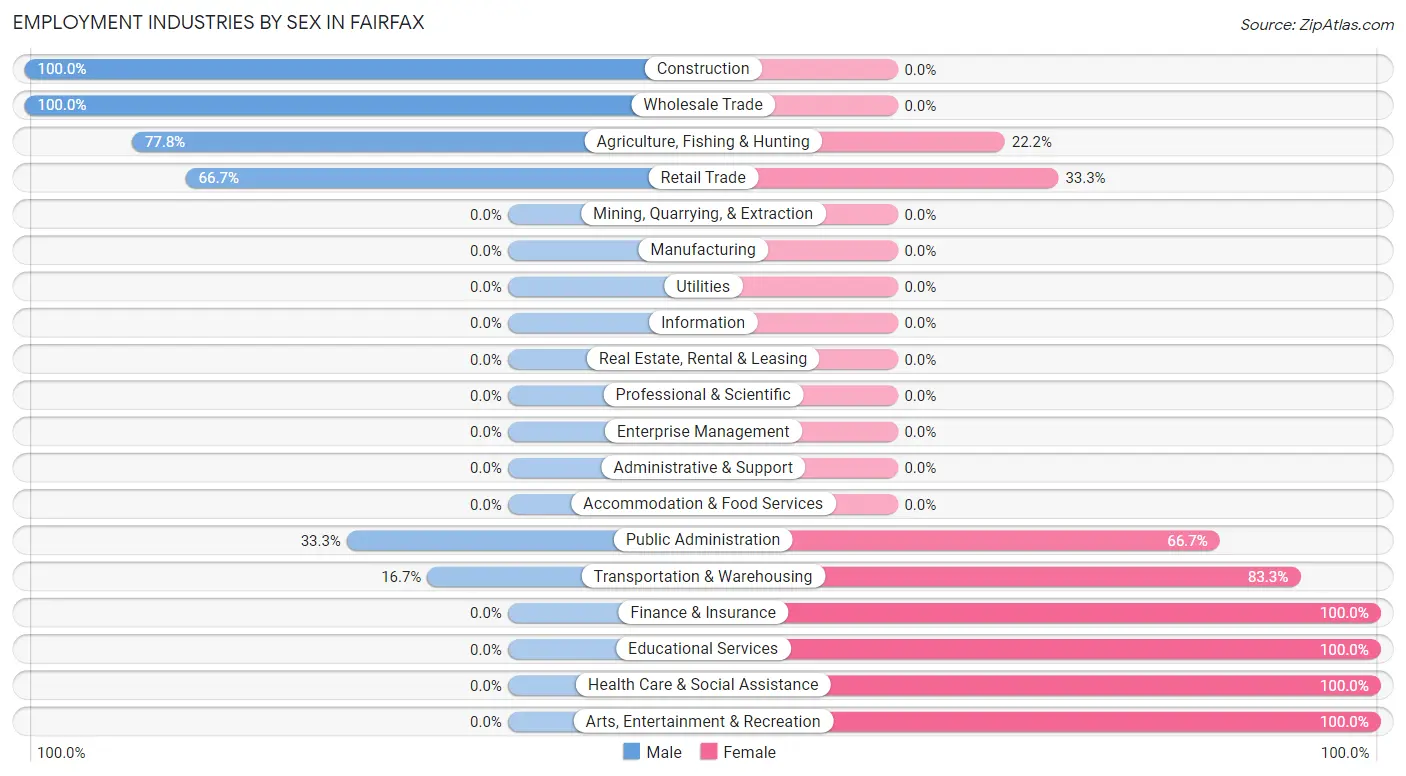
| Industry | Male | Female |
| Agriculture, Fishing & Hunting | 7 (77.8%) | 2 (22.2%) |
| Mining, Quarrying, & Extraction | 0 (0.0%) | 0 (0.0%) |
| Construction | 4 (100.0%) | 0 (0.0%) |
| Manufacturing | 0 (0.0%) | 0 (0.0%) |
| Wholesale Trade | 1 (100.0%) | 0 (0.0%) |
| Retail Trade | 10 (66.7%) | 5 (33.3%) |
| Transportation & Warehousing | 1 (16.7%) | 5 (83.3%) |
| Utilities | 0 (0.0%) | 0 (0.0%) |
| Information | 0 (0.0%) | 0 (0.0%) |
| Finance & Insurance | 0 (0.0%) | 1 (100.0%) |
| Real Estate, Rental & Leasing | 0 (0.0%) | 0 (0.0%) |
| Professional & Scientific | 0 (0.0%) | 0 (0.0%) |
| Enterprise Management | 0 (0.0%) | 0 (0.0%) |
| Administrative & Support | 0 (0.0%) | 0 (0.0%) |
| Educational Services | 0 (0.0%) | 4 (100.0%) |
| Health Care & Social Assistance | 0 (0.0%) | 12 (100.0%) |
| Arts, Entertainment & Recreation | 0 (0.0%) | 1 (100.0%) |
| Accommodation & Food Services | 0 (0.0%) | 0 (0.0%) |
| Public Administration | 1 (33.3%) | 2 (66.7%) |
| Total | 25 (37.9%) | 41 (62.1%) |
Education in Fairfax
School Enrollment in Fairfax
The most common levels of schooling among the 23 students in Fairfax are elementary school (11 | 47.8%), high school (8 | 34.8%), and middle school (2 | 8.7%).
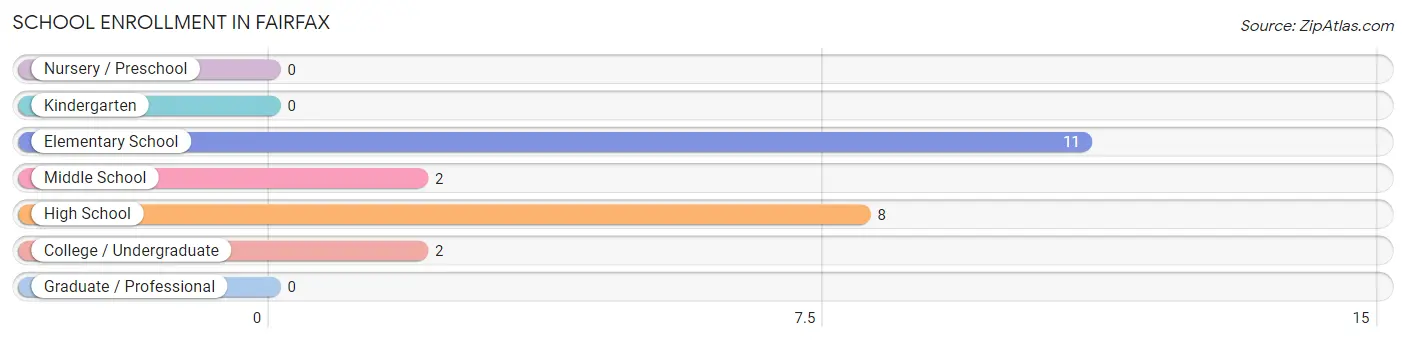
| School Level | # Students | % Students |
| Nursery / Preschool | 0 | 0.0% |
| Kindergarten | 0 | 0.0% |
| Elementary School | 11 | 47.8% |
| Middle School | 2 | 8.7% |
| High School | 8 | 34.8% |
| College / Undergraduate | 2 | 8.7% |
| Graduate / Professional | 0 | 0.0% |
| Total | 23 | 100.0% |
School Enrollment by Age by Funding Source in Fairfax
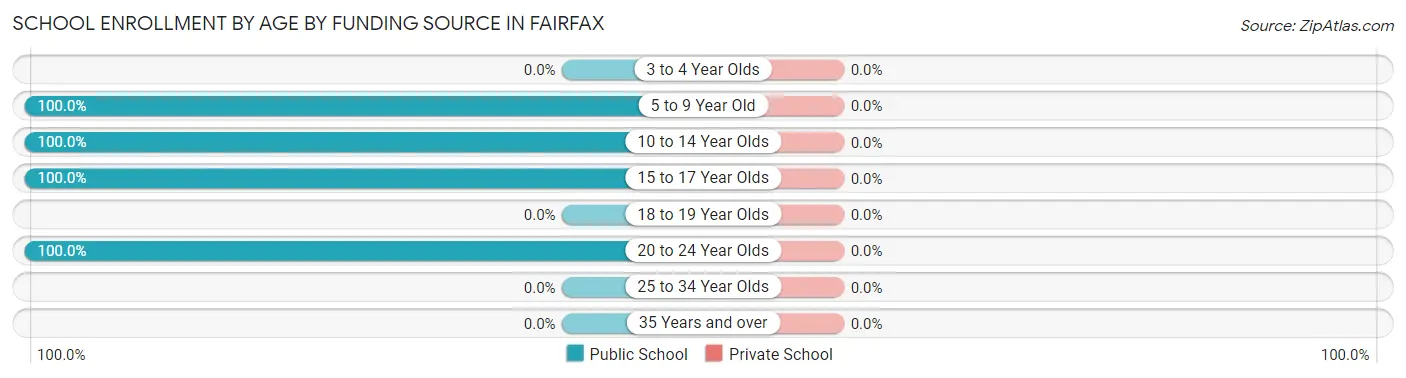
| Age Bracket | Public School | Private School |
| 3 to 4 Year Olds | 0 (0.0%) | 0 (0.0%) |
| 5 to 9 Year Old | 11 (100.0%) | 0 (0.0%) |
| 10 to 14 Year Olds | 2 (100.0%) | 0 (0.0%) |
| 15 to 17 Year Olds | 6 (100.0%) | 0 (0.0%) |
| 18 to 19 Year Olds | 0 (0.0%) | 0 (0.0%) |
| 20 to 24 Year Olds | 4 (100.0%) | 0 (0.0%) |
| 25 to 34 Year Olds | 0 (0.0%) | 0 (0.0%) |
| 35 Years and over | 0 (0.0%) | 0 (0.0%) |
| Total | 23 (100.0%) | 0 (0.0%) |
Educational Attainment by Field of Study in Fairfax
Education (7 | 53.8%), science & technology (4 | 30.8%), literature & languages (1 | 7.7%), and liberal arts & history (1 | 7.7%) are the most common fields of study among 13 individuals in Fairfax who have obtained a bachelor's degree or higher.
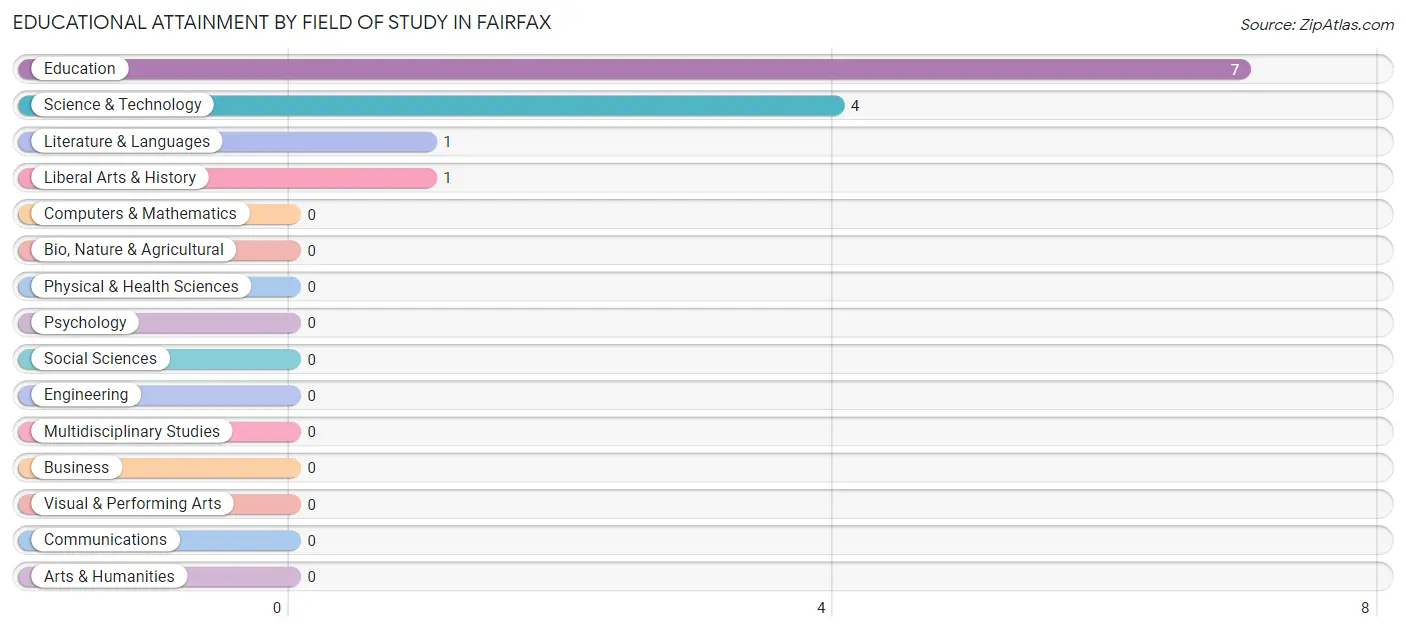
| Field of Study | # Graduates | % Graduates |
| Computers & Mathematics | 0 | 0.0% |
| Bio, Nature & Agricultural | 0 | 0.0% |
| Physical & Health Sciences | 0 | 0.0% |
| Psychology | 0 | 0.0% |
| Social Sciences | 0 | 0.0% |
| Engineering | 0 | 0.0% |
| Multidisciplinary Studies | 0 | 0.0% |
| Science & Technology | 4 | 30.8% |
| Business | 0 | 0.0% |
| Education | 7 | 53.8% |
| Literature & Languages | 1 | 7.7% |
| Liberal Arts & History | 1 | 7.7% |
| Visual & Performing Arts | 0 | 0.0% |
| Communications | 0 | 0.0% |
| Arts & Humanities | 0 | 0.0% |
| Total | 13 | 100.0% |
Transportation & Commute in Fairfax
Vehicle Availability by Sex in Fairfax
The most prevalent vehicle ownership categories in Fairfax are males with 3 vehicles (9, accounting for 36.0%) and females with 3 vehicles (12, making up 22.0%).
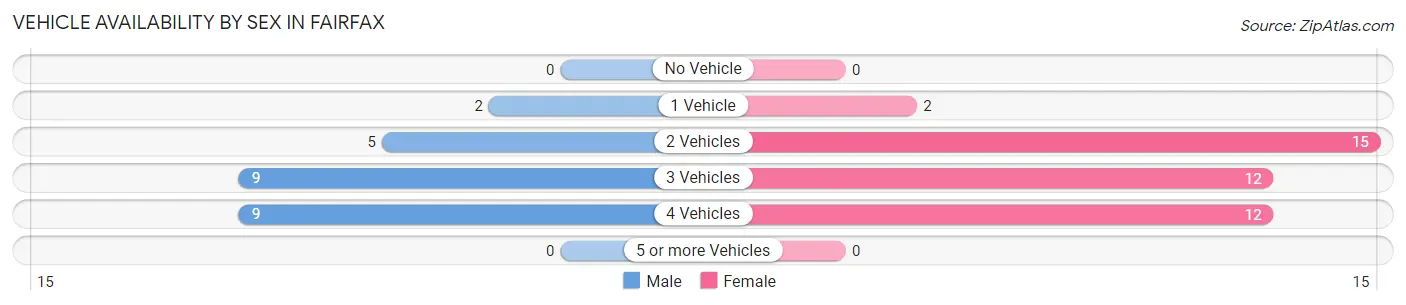
| Vehicles Available | Male | Female |
| No Vehicle | 0 (0.0%) | 0 (0.0%) |
| 1 Vehicle | 2 (8.0%) | 2 (4.9%) |
| 2 Vehicles | 5 (20.0%) | 15 (36.6%) |
| 3 Vehicles | 9 (36.0%) | 12 (29.3%) |
| 4 Vehicles | 9 (36.0%) | 12 (29.3%) |
| 5 or more Vehicles | 0 (0.0%) | 0 (0.0%) |
| Total | 25 (100.0%) | 41 (100.0%) |
Commute Time in Fairfax
The most frequently occuring commute durations in Fairfax are 5 to 9 minutes (23 commuters, 39.7%), 90 or more minutes (13 commuters, 22.4%), and 10 to 14 minutes (5 commuters, 8.6%).
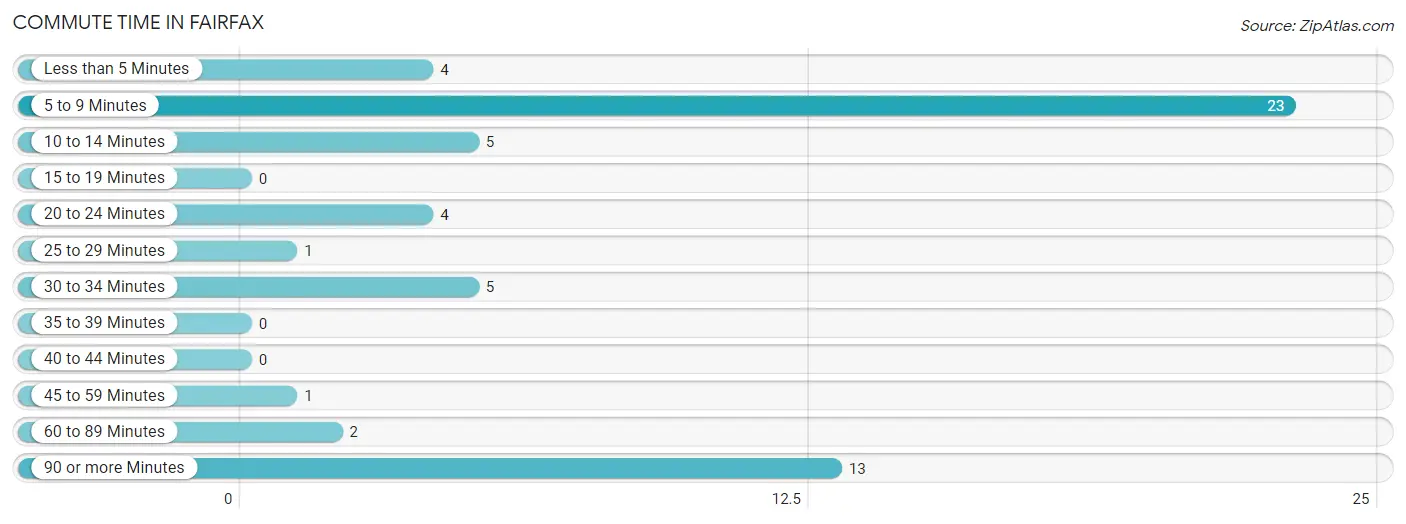
| Commute Time | # Commuters | % Commuters |
| Less than 5 Minutes | 4 | 6.9% |
| 5 to 9 Minutes | 23 | 39.7% |
| 10 to 14 Minutes | 5 | 8.6% |
| 15 to 19 Minutes | 0 | 0.0% |
| 20 to 24 Minutes | 4 | 6.9% |
| 25 to 29 Minutes | 1 | 1.7% |
| 30 to 34 Minutes | 5 | 8.6% |
| 35 to 39 Minutes | 0 | 0.0% |
| 40 to 44 Minutes | 0 | 0.0% |
| 45 to 59 Minutes | 1 | 1.7% |
| 60 to 89 Minutes | 2 | 3.5% |
| 90 or more Minutes | 13 | 22.4% |
Commute Time by Sex in Fairfax
The most common commute times in Fairfax are 5 to 9 minutes (13 commuters, 52.0%) for males and 5 to 9 minutes (10 commuters, 30.3%) for females.
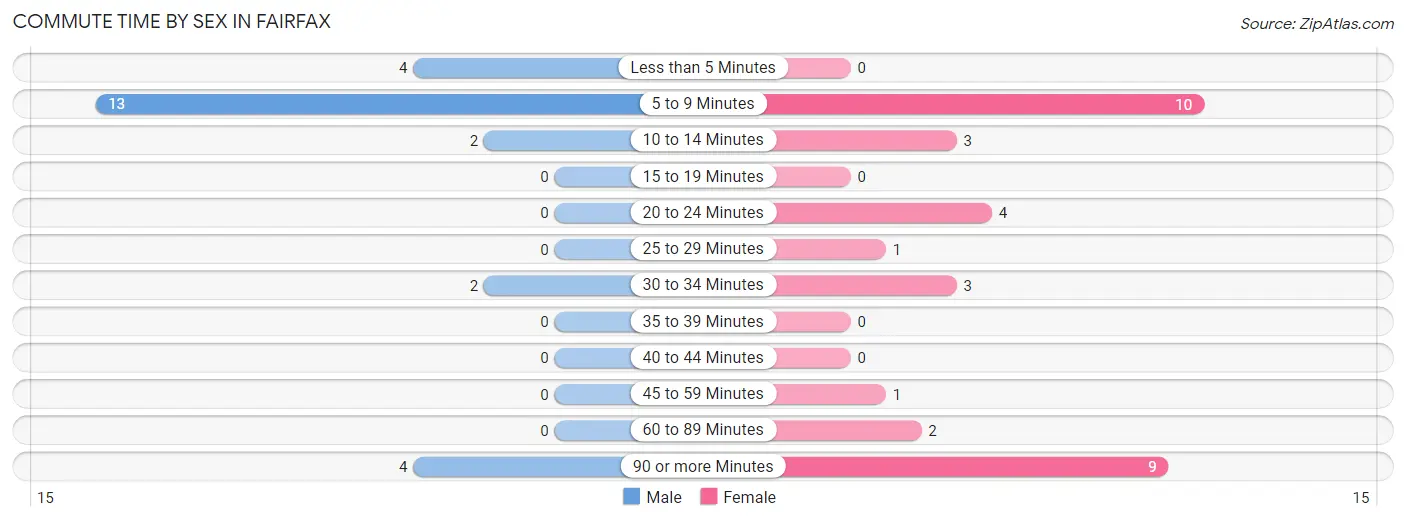
| Commute Time | Male | Female |
| Less than 5 Minutes | 4 (16.0%) | 0 (0.0%) |
| 5 to 9 Minutes | 13 (52.0%) | 10 (30.3%) |
| 10 to 14 Minutes | 2 (8.0%) | 3 (9.1%) |
| 15 to 19 Minutes | 0 (0.0%) | 0 (0.0%) |
| 20 to 24 Minutes | 0 (0.0%) | 4 (12.1%) |
| 25 to 29 Minutes | 0 (0.0%) | 1 (3.0%) |
| 30 to 34 Minutes | 2 (8.0%) | 3 (9.1%) |
| 35 to 39 Minutes | 0 (0.0%) | 0 (0.0%) |
| 40 to 44 Minutes | 0 (0.0%) | 0 (0.0%) |
| 45 to 59 Minutes | 0 (0.0%) | 1 (3.0%) |
| 60 to 89 Minutes | 0 (0.0%) | 2 (6.1%) |
| 90 or more Minutes | 4 (16.0%) | 9 (27.3%) |
Time of Departure to Work by Sex in Fairfax
The most frequent times of departure to work in Fairfax are 8:00 AM to 8:29 AM (7, 28.0%) for males and 8:00 AM to 8:29 AM (6, 18.2%) for females.
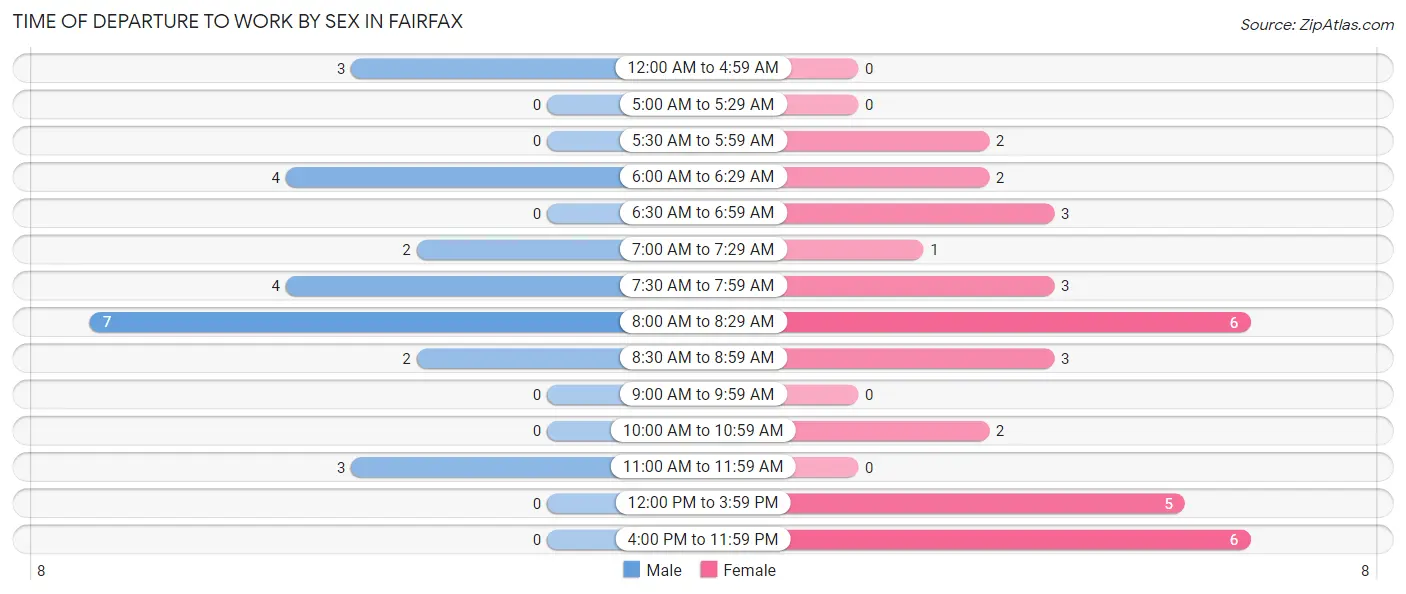
| Time of Departure | Male | Female |
| 12:00 AM to 4:59 AM | 3 (12.0%) | 0 (0.0%) |
| 5:00 AM to 5:29 AM | 0 (0.0%) | 0 (0.0%) |
| 5:30 AM to 5:59 AM | 0 (0.0%) | 2 (6.1%) |
| 6:00 AM to 6:29 AM | 4 (16.0%) | 2 (6.1%) |
| 6:30 AM to 6:59 AM | 0 (0.0%) | 3 (9.1%) |
| 7:00 AM to 7:29 AM | 2 (8.0%) | 1 (3.0%) |
| 7:30 AM to 7:59 AM | 4 (16.0%) | 3 (9.1%) |
| 8:00 AM to 8:29 AM | 7 (28.0%) | 6 (18.2%) |
| 8:30 AM to 8:59 AM | 2 (8.0%) | 3 (9.1%) |
| 9:00 AM to 9:59 AM | 0 (0.0%) | 0 (0.0%) |
| 10:00 AM to 10:59 AM | 0 (0.0%) | 2 (6.1%) |
| 11:00 AM to 11:59 AM | 3 (12.0%) | 0 (0.0%) |
| 12:00 PM to 3:59 PM | 0 (0.0%) | 5 (15.1%) |
| 4:00 PM to 11:59 PM | 0 (0.0%) | 6 (18.2%) |
| Total | 25 (100.0%) | 33 (100.0%) |
Housing Occupancy in Fairfax
Occupancy by Ownership in Fairfax
Of the total 68 dwellings in Fairfax, owner-occupied units account for 62 (91.2%), while renter-occupied units make up 6 (8.8%).
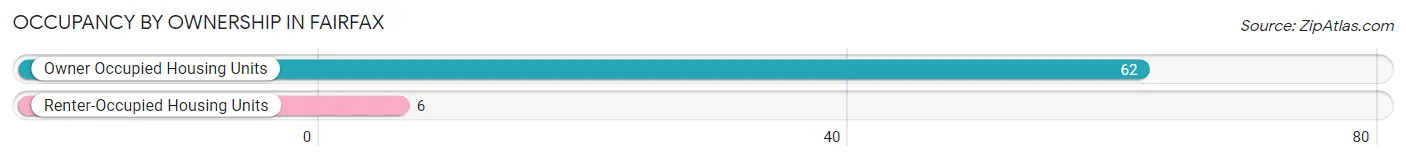
| Occupancy | # Housing Units | % Housing Units |
| Owner Occupied Housing Units | 62 | 91.2% |
| Renter-Occupied Housing Units | 6 | 8.8% |
| Total Occupied Housing Units | 68 | 100.0% |
Occupancy by Household Size in Fairfax
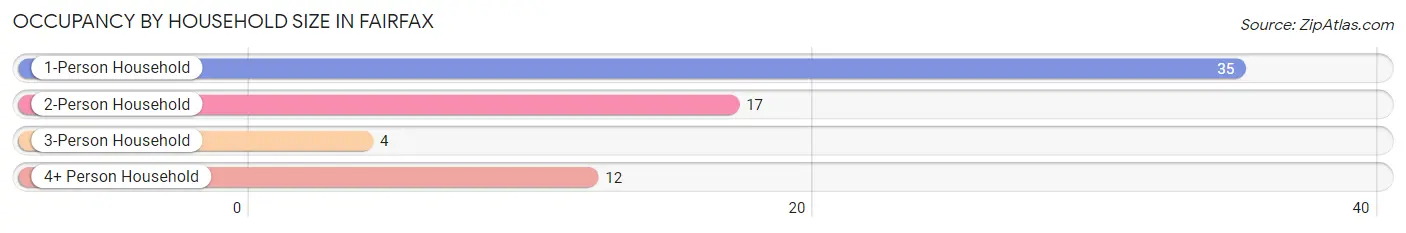
| Household Size | # Housing Units | % Housing Units |
| 1-Person Household | 35 | 51.5% |
| 2-Person Household | 17 | 25.0% |
| 3-Person Household | 4 | 5.9% |
| 4+ Person Household | 12 | 17.6% |
| Total Housing Units | 68 | 100.0% |
Occupancy by Ownership by Household Size in Fairfax
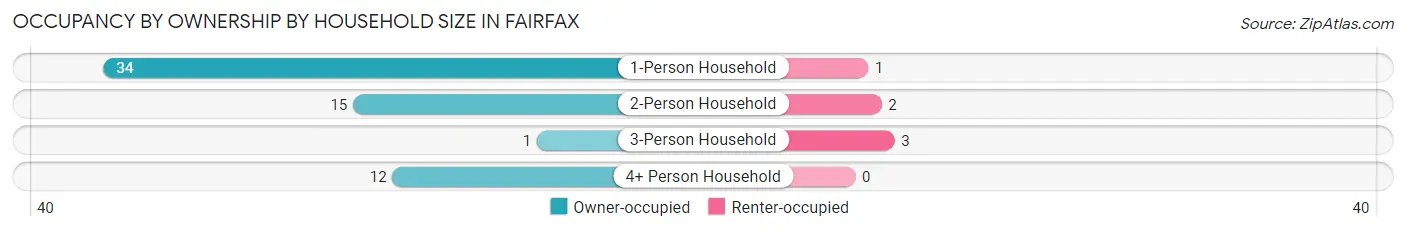
| Household Size | Owner-occupied | Renter-occupied |
| 1-Person Household | 34 (97.1%) | 1 (2.9%) |
| 2-Person Household | 15 (88.2%) | 2 (11.8%) |
| 3-Person Household | 1 (25.0%) | 3 (75.0%) |
| 4+ Person Household | 12 (100.0%) | 0 (0.0%) |
| Total Housing Units | 62 (91.2%) | 6 (8.8%) |
Occupancy by Educational Attainment in Fairfax
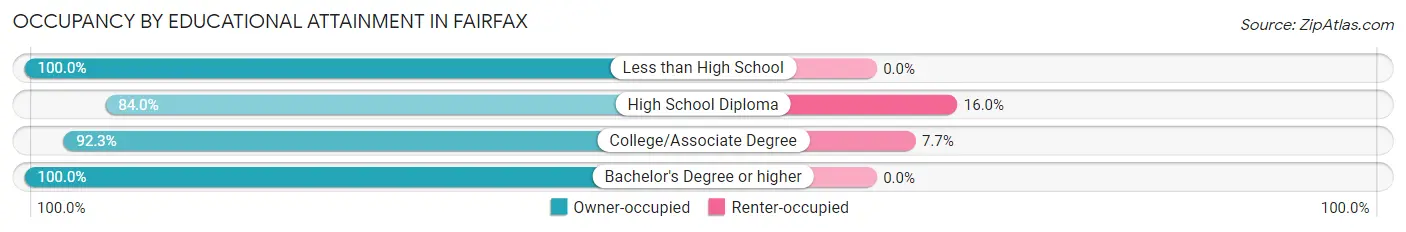
| Household Size | Owner-occupied | Renter-occupied |
| Less than High School | 9 (100.0%) | 0 (0.0%) |
| High School Diploma | 21 (84.0%) | 4 (16.0%) |
| College/Associate Degree | 24 (92.3%) | 2 (7.7%) |
| Bachelor's Degree or higher | 8 (100.0%) | 0 (0.0%) |
Occupancy by Age of Householder in Fairfax
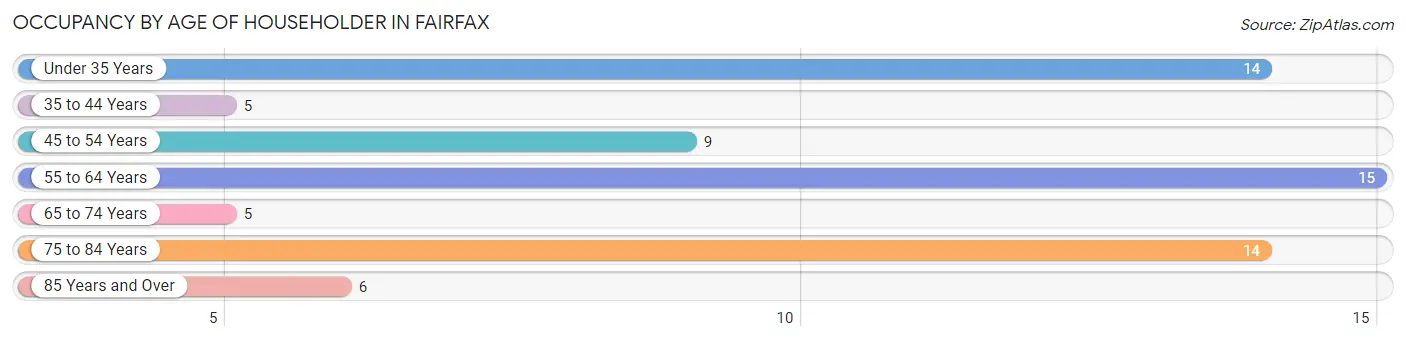
| Age Bracket | # Households | % Households |
| Under 35 Years | 14 | 20.6% |
| 35 to 44 Years | 5 | 7.3% |
| 45 to 54 Years | 9 | 13.2% |
| 55 to 64 Years | 15 | 22.1% |
| 65 to 74 Years | 5 | 7.3% |
| 75 to 84 Years | 14 | 20.6% |
| 85 Years and Over | 6 | 8.8% |
| Total | 68 | 100.0% |
Housing Finances in Fairfax
Median Income by Occupancy in Fairfax
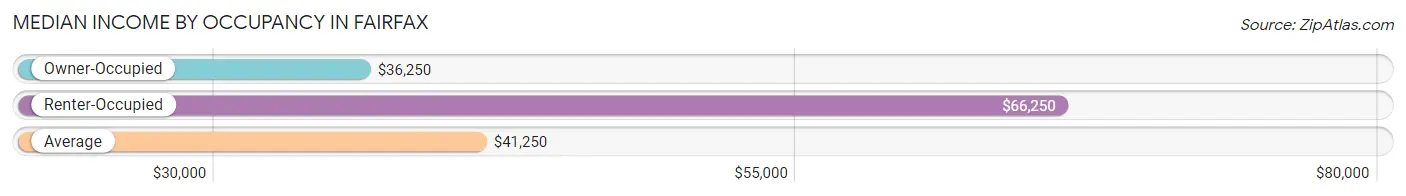
| Occupancy Type | # Households | Median Income |
| Owner-Occupied | 62 (91.2%) | $36,250 |
| Renter-Occupied | 6 (8.8%) | $66,250 |
| Average | 68 (100.0%) | $41,250 |
Occupancy by Householder Income Bracket in Fairfax
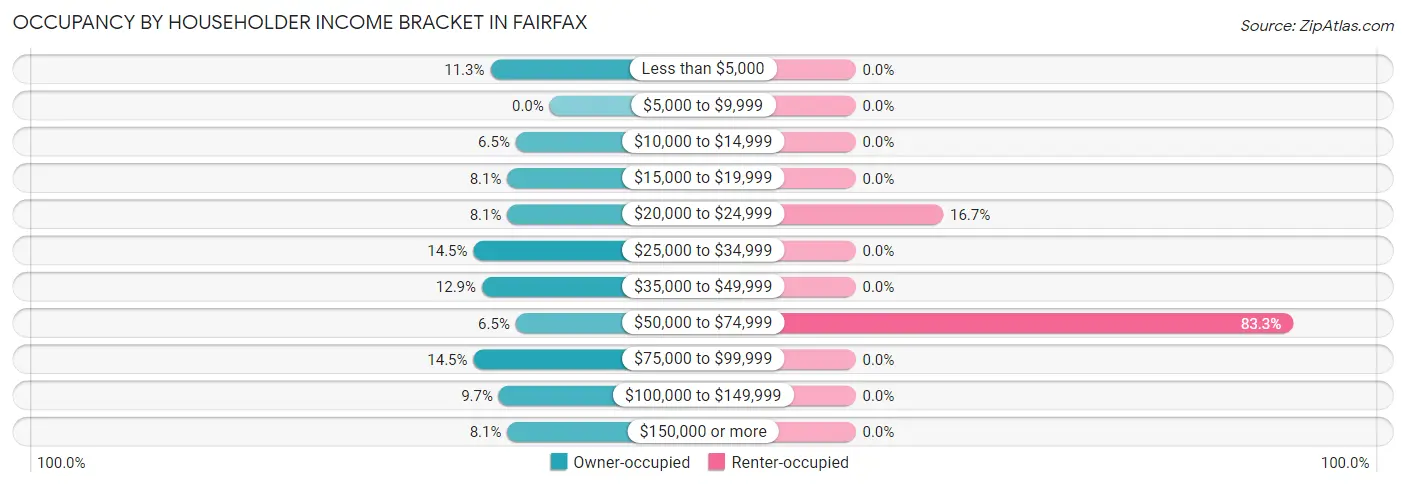
| Income Bracket | Owner-occupied | Renter-occupied |
| Less than $5,000 | 7 (11.3%) | 0 (0.0%) |
| $5,000 to $9,999 | 0 (0.0%) | 0 (0.0%) |
| $10,000 to $14,999 | 4 (6.5%) | 0 (0.0%) |
| $15,000 to $19,999 | 5 (8.1%) | 0 (0.0%) |
| $20,000 to $24,999 | 5 (8.1%) | 1 (16.7%) |
| $25,000 to $34,999 | 9 (14.5%) | 0 (0.0%) |
| $35,000 to $49,999 | 8 (12.9%) | 0 (0.0%) |
| $50,000 to $74,999 | 4 (6.5%) | 5 (83.3%) |
| $75,000 to $99,999 | 9 (14.5%) | 0 (0.0%) |
| $100,000 to $149,999 | 6 (9.7%) | 0 (0.0%) |
| $150,000 or more | 5 (8.1%) | 0 (0.0%) |
| Total | 62 (100.0%) | 6 (100.0%) |
Monthly Housing Cost Tiers in Fairfax
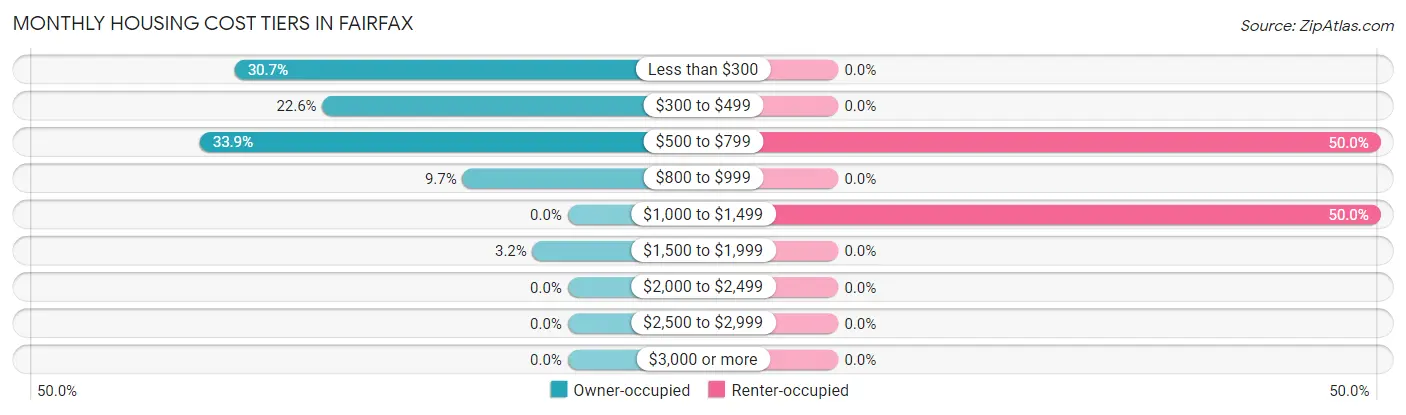
| Monthly Cost | Owner-occupied | Renter-occupied |
| Less than $300 | 19 (30.6%) | 0 (0.0%) |
| $300 to $499 | 14 (22.6%) | 0 (0.0%) |
| $500 to $799 | 21 (33.9%) | 3 (50.0%) |
| $800 to $999 | 6 (9.7%) | 0 (0.0%) |
| $1,000 to $1,499 | 0 (0.0%) | 3 (50.0%) |
| $1,500 to $1,999 | 2 (3.2%) | 0 (0.0%) |
| $2,000 to $2,499 | 0 (0.0%) | 0 (0.0%) |
| $2,500 to $2,999 | 0 (0.0%) | 0 (0.0%) |
| $3,000 or more | 0 (0.0%) | 0 (0.0%) |
| Total | 62 (100.0%) | 6 (100.0%) |
Physical Housing Characteristics in Fairfax
Housing Structures in Fairfax
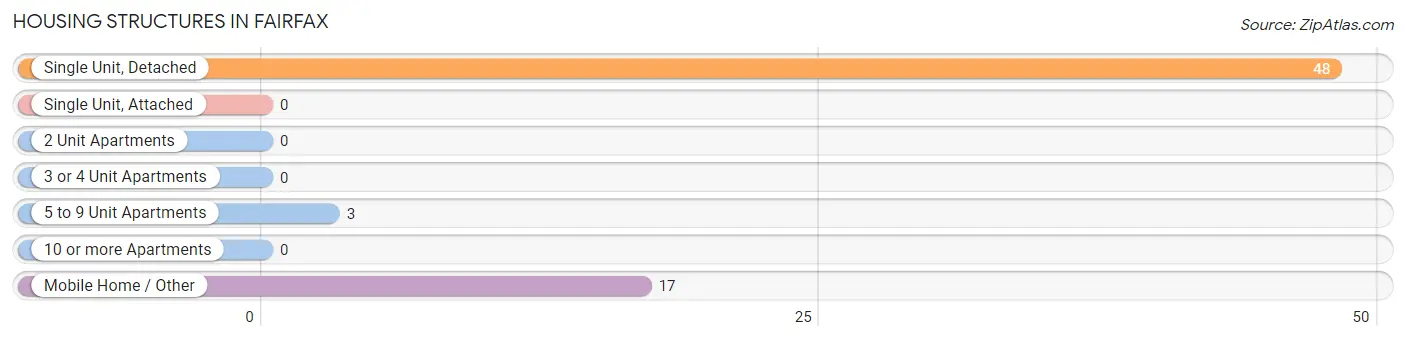
| Structure Type | # Housing Units | % Housing Units |
| Single Unit, Detached | 48 | 70.6% |
| Single Unit, Attached | 0 | 0.0% |
| 2 Unit Apartments | 0 | 0.0% |
| 3 or 4 Unit Apartments | 0 | 0.0% |
| 5 to 9 Unit Apartments | 3 | 4.4% |
| 10 or more Apartments | 0 | 0.0% |
| Mobile Home / Other | 17 | 25.0% |
| Total | 68 | 100.0% |
Housing Structures by Occupancy in Fairfax
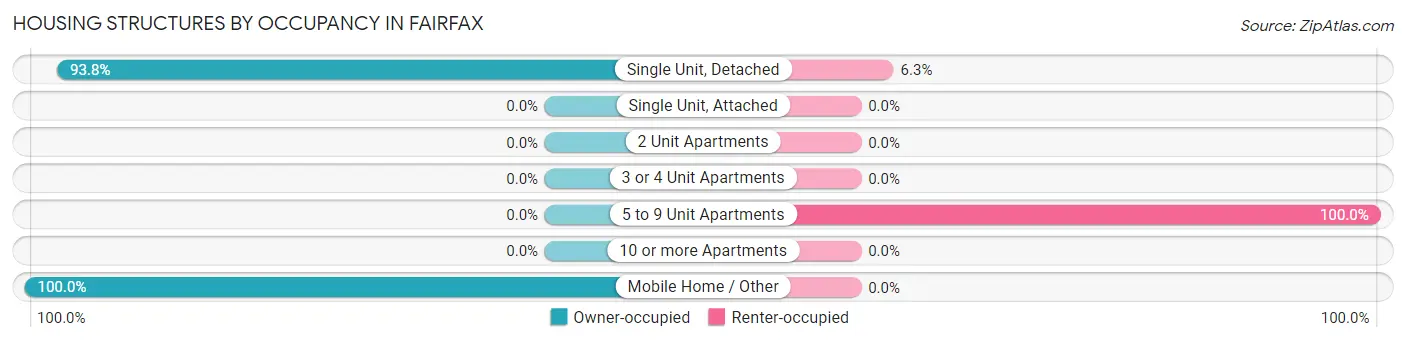
| Structure Type | Owner-occupied | Renter-occupied |
| Single Unit, Detached | 45 (93.8%) | 3 (6.2%) |
| Single Unit, Attached | 0 (0.0%) | 0 (0.0%) |
| 2 Unit Apartments | 0 (0.0%) | 0 (0.0%) |
| 3 or 4 Unit Apartments | 0 (0.0%) | 0 (0.0%) |
| 5 to 9 Unit Apartments | 0 (0.0%) | 3 (100.0%) |
| 10 or more Apartments | 0 (0.0%) | 0 (0.0%) |
| Mobile Home / Other | 17 (100.0%) | 0 (0.0%) |
| Total | 62 (91.2%) | 6 (8.8%) |
Housing Structures by Number of Rooms in Fairfax
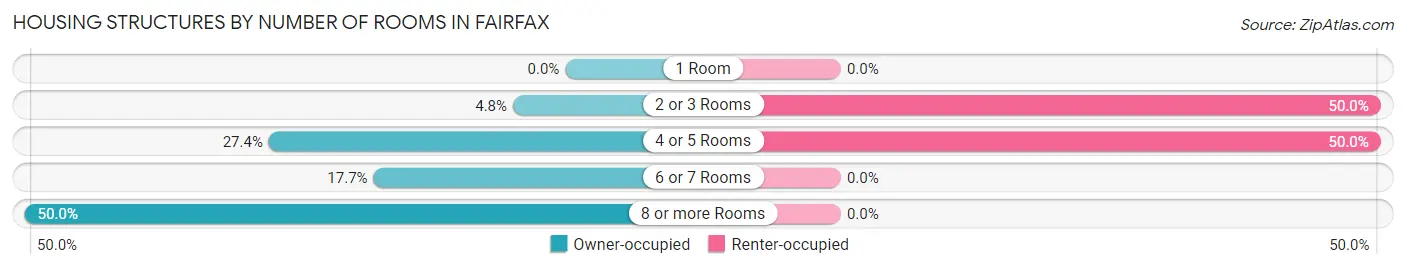
| Number of Rooms | Owner-occupied | Renter-occupied |
| 1 Room | 0 (0.0%) | 0 (0.0%) |
| 2 or 3 Rooms | 3 (4.8%) | 3 (50.0%) |
| 4 or 5 Rooms | 17 (27.4%) | 3 (50.0%) |
| 6 or 7 Rooms | 11 (17.7%) | 0 (0.0%) |
| 8 or more Rooms | 31 (50.0%) | 0 (0.0%) |
| Total | 62 (100.0%) | 6 (100.0%) |
Housing Structure by Heating Type in Fairfax
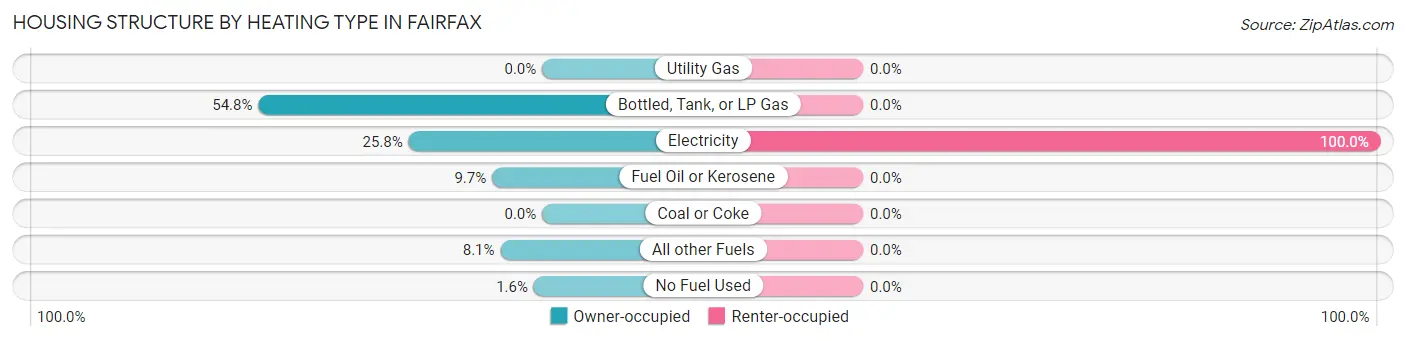
| Heating Type | Owner-occupied | Renter-occupied |
| Utility Gas | 0 (0.0%) | 0 (0.0%) |
| Bottled, Tank, or LP Gas | 34 (54.8%) | 0 (0.0%) |
| Electricity | 16 (25.8%) | 6 (100.0%) |
| Fuel Oil or Kerosene | 6 (9.7%) | 0 (0.0%) |
| Coal or Coke | 0 (0.0%) | 0 (0.0%) |
| All other Fuels | 5 (8.1%) | 0 (0.0%) |
| No Fuel Used | 1 (1.6%) | 0 (0.0%) |
| Total | 62 (100.0%) | 6 (100.0%) |
Household Vehicle Usage in Fairfax
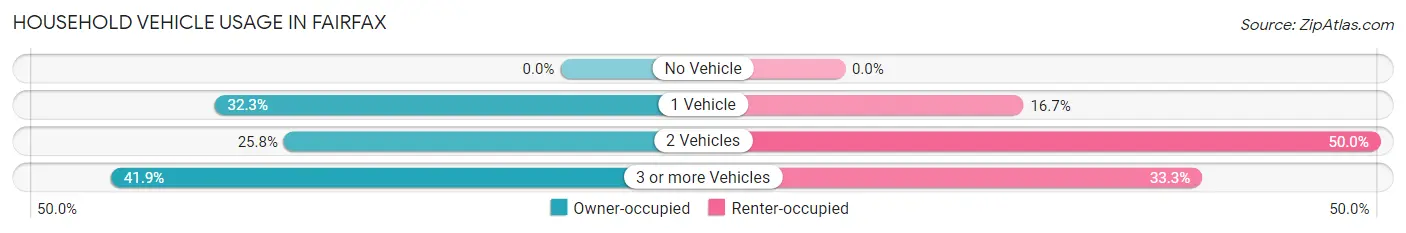
| Vehicles per Household | Owner-occupied | Renter-occupied |
| No Vehicle | 0 (0.0%) | 0 (0.0%) |
| 1 Vehicle | 20 (32.3%) | 1 (16.7%) |
| 2 Vehicles | 16 (25.8%) | 3 (50.0%) |
| 3 or more Vehicles | 26 (41.9%) | 2 (33.3%) |
| Total | 62 (100.0%) | 6 (100.0%) |
Real Estate & Mortgages in Fairfax
Real Estate and Mortgage Overview in Fairfax
| Characteristic | Without Mortgage | With Mortgage |
| Housing Units | 44 | 18 |
| Median Property Value | $43,300 | $60,000 |
| Median Household Income | $40,000 | $4 |
| Monthly Housing Costs | $350 | $0 |
| Real Estate Taxes | $921 | $0 |
Property Value by Mortgage Status in Fairfax
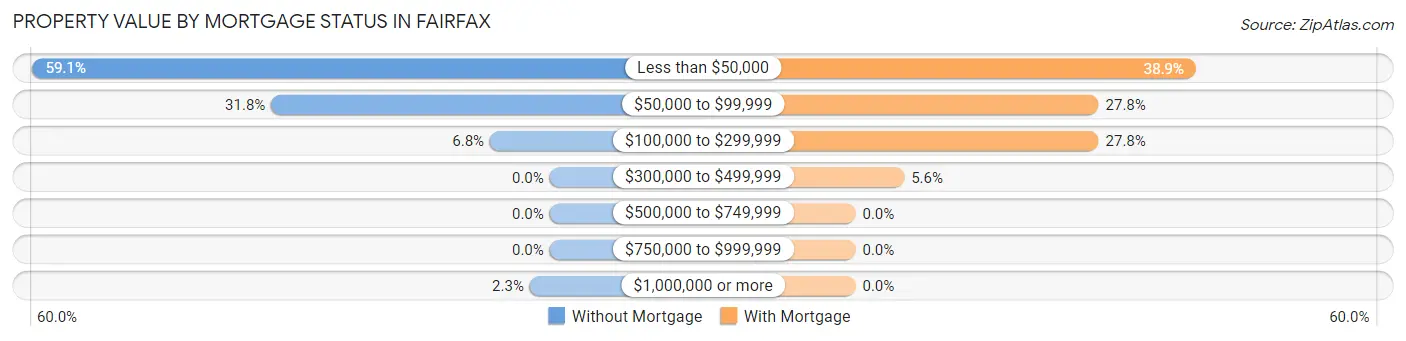
| Property Value | Without Mortgage | With Mortgage |
| Less than $50,000 | 26 (59.1%) | 7 (38.9%) |
| $50,000 to $99,999 | 14 (31.8%) | 5 (27.8%) |
| $100,000 to $299,999 | 3 (6.8%) | 5 (27.8%) |
| $300,000 to $499,999 | 0 (0.0%) | 1 (5.6%) |
| $500,000 to $749,999 | 0 (0.0%) | 0 (0.0%) |
| $750,000 to $999,999 | 0 (0.0%) | 0 (0.0%) |
| $1,000,000 or more | 1 (2.3%) | 0 (0.0%) |
| Total | 44 (100.0%) | 18 (100.0%) |
Household Income by Mortgage Status in Fairfax
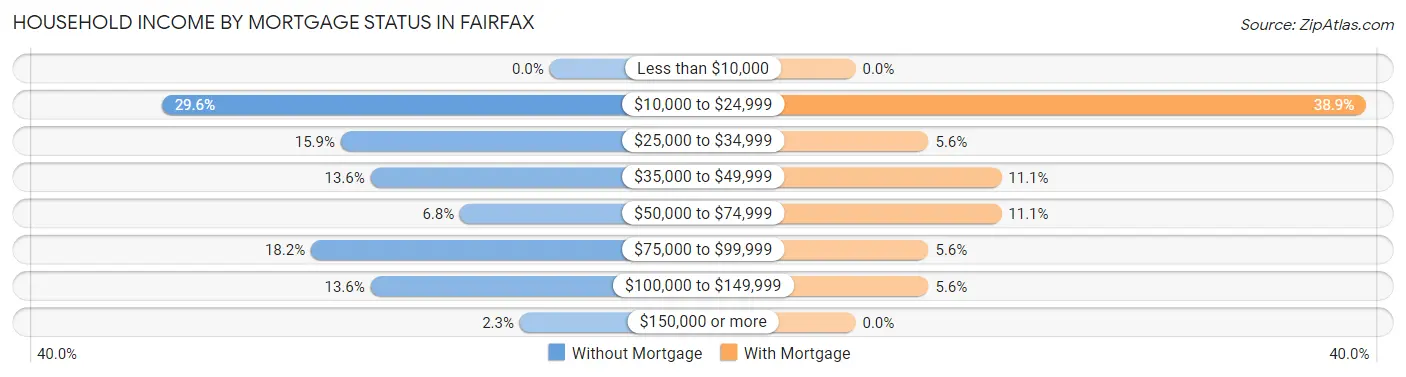
| Household Income | Without Mortgage | With Mortgage |
| Less than $10,000 | 0 (0.0%) | 0 (0.0%) |
| $10,000 to $24,999 | 13 (29.5%) | 7 (38.9%) |
| $25,000 to $34,999 | 7 (15.9%) | 1 (5.6%) |
| $35,000 to $49,999 | 6 (13.6%) | 2 (11.1%) |
| $50,000 to $74,999 | 3 (6.8%) | 2 (11.1%) |
| $75,000 to $99,999 | 8 (18.2%) | 1 (5.6%) |
| $100,000 to $149,999 | 6 (13.6%) | 1 (5.6%) |
| $150,000 or more | 1 (2.3%) | 0 (0.0%) |
| Total | 44 (100.0%) | 18 (100.0%) |
Property Value to Household Income Ratio in Fairfax
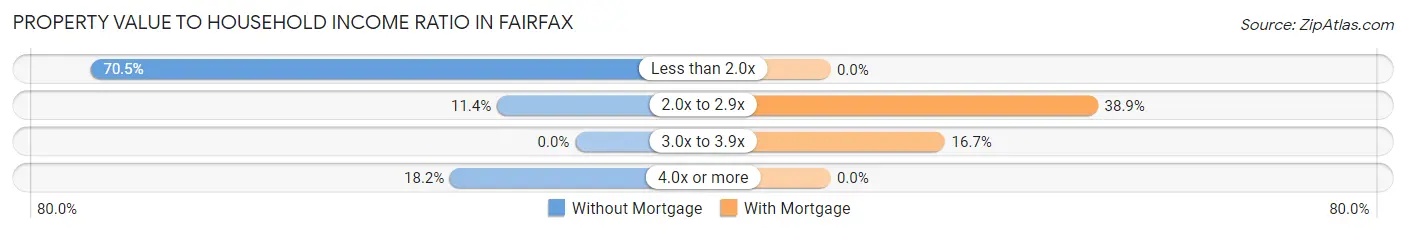
| Value-to-Income Ratio | Without Mortgage | With Mortgage |
| Less than 2.0x | 31 (70.5%) | 0 (0.0%) |
| 2.0x to 2.9x | 5 (11.4%) | 7 (38.9%) |
| 3.0x to 3.9x | 0 (0.0%) | 3 (16.7%) |
| 4.0x or more | 8 (18.2%) | 0 (0.0%) |
| Total | 44 (100.0%) | 18 (100.0%) |
Real Estate Taxes by Mortgage Status in Fairfax
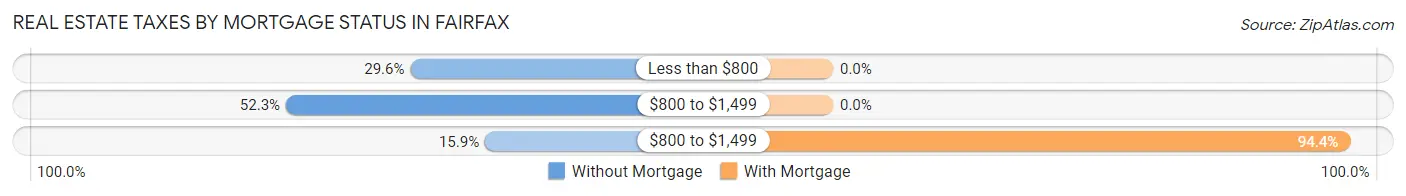
| Property Taxes | Without Mortgage | With Mortgage |
| Less than $800 | 13 (29.5%) | 0 (0.0%) |
| $800 to $1,499 | 23 (52.3%) | 0 (0.0%) |
| $800 to $1,499 | 7 (15.9%) | 17 (94.4%) |
| Total | 44 (100.0%) | 18 (100.0%) |
Health & Disability in Fairfax
Health Insurance Coverage by Age in Fairfax
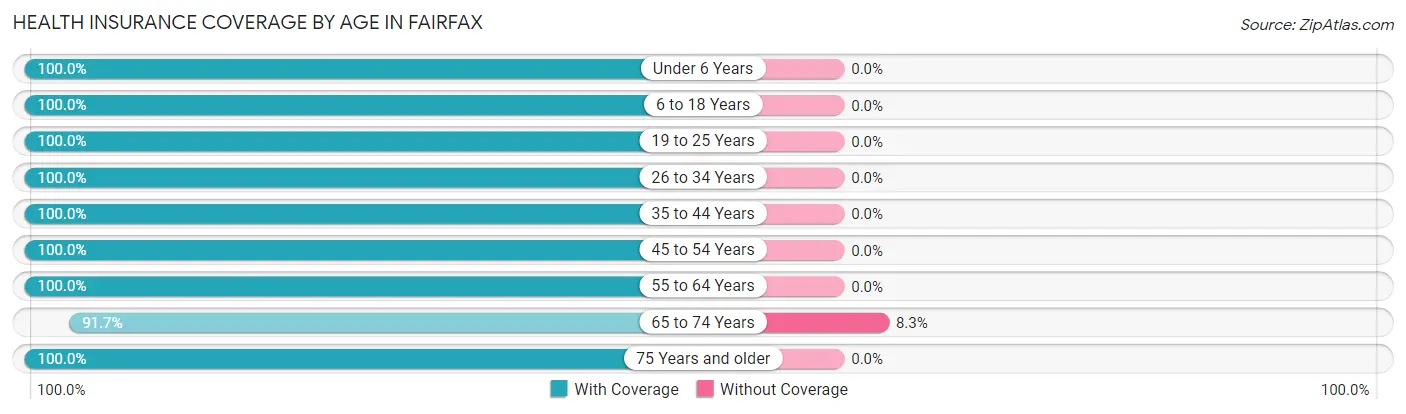
| Age Bracket | With Coverage | Without Coverage |
| Under 6 Years | 17 (100.0%) | 0 (0.0%) |
| 6 to 18 Years | 19 (100.0%) | 0 (0.0%) |
| 19 to 25 Years | 8 (100.0%) | 0 (0.0%) |
| 26 to 34 Years | 17 (100.0%) | 0 (0.0%) |
| 35 to 44 Years | 6 (100.0%) | 0 (0.0%) |
| 45 to 54 Years | 13 (100.0%) | 0 (0.0%) |
| 55 to 64 Years | 22 (100.0%) | 0 (0.0%) |
| 65 to 74 Years | 11 (91.7%) | 1 (8.3%) |
| 75 Years and older | 21 (100.0%) | 0 (0.0%) |
| Total | 134 (99.3%) | 1 (0.7%) |
Health Insurance Coverage by Citizenship Status in Fairfax
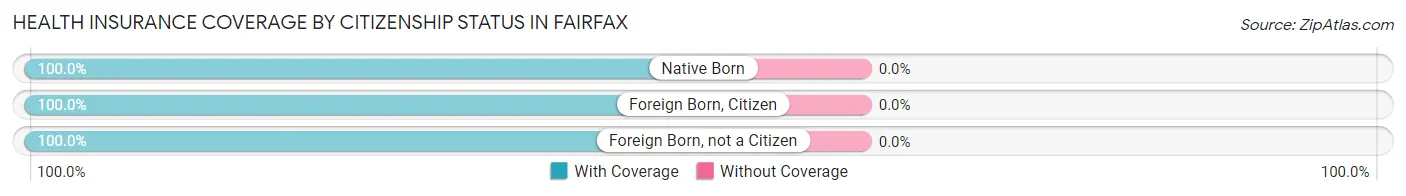
| Citizenship Status | With Coverage | Without Coverage |
| Native Born | 17 (100.0%) | 0 (0.0%) |
| Foreign Born, Citizen | 19 (100.0%) | 0 (0.0%) |
| Foreign Born, not a Citizen | 8 (100.0%) | 0 (0.0%) |
Health Insurance Coverage by Household Income in Fairfax
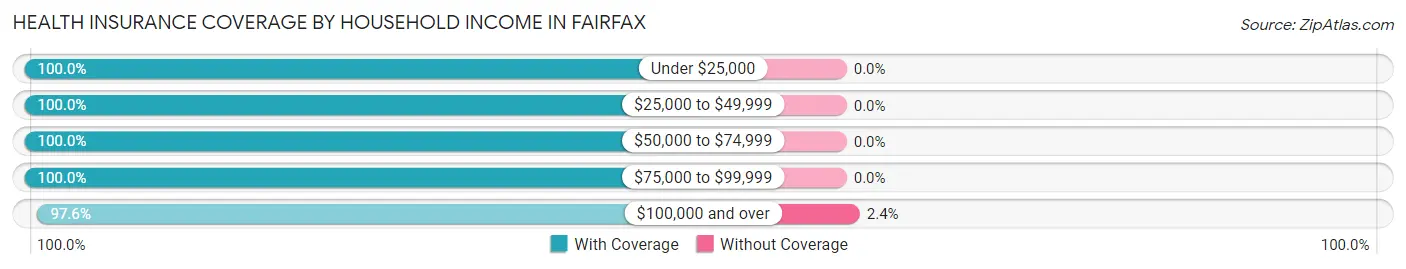
| Household Income | With Coverage | Without Coverage |
| Under $25,000 | 31 (100.0%) | 0 (0.0%) |
| $25,000 to $49,999 | 24 (100.0%) | 0 (0.0%) |
| $50,000 to $74,999 | 22 (100.0%) | 0 (0.0%) |
| $75,000 to $99,999 | 17 (100.0%) | 0 (0.0%) |
| $100,000 and over | 40 (97.6%) | 1 (2.4%) |
Public vs Private Health Insurance Coverage by Age in Fairfax
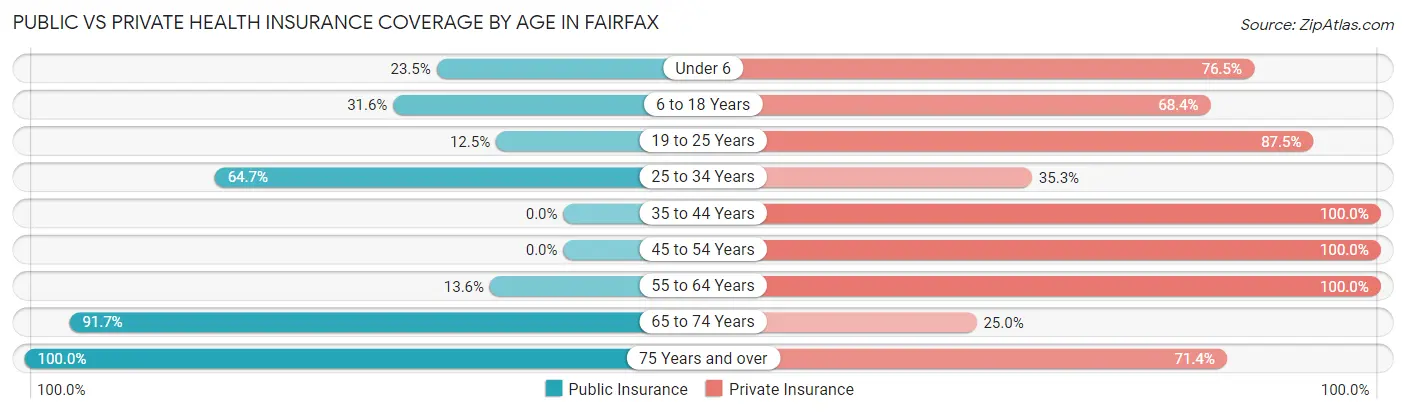
| Age Bracket | Public Insurance | Private Insurance |
| Under 6 | 4 (23.5%) | 13 (76.5%) |
| 6 to 18 Years | 6 (31.6%) | 13 (68.4%) |
| 19 to 25 Years | 1 (12.5%) | 7 (87.5%) |
| 25 to 34 Years | 11 (64.7%) | 6 (35.3%) |
| 35 to 44 Years | 0 (0.0%) | 6 (100.0%) |
| 45 to 54 Years | 0 (0.0%) | 13 (100.0%) |
| 55 to 64 Years | 3 (13.6%) | 22 (100.0%) |
| 65 to 74 Years | 11 (91.7%) | 3 (25.0%) |
| 75 Years and over | 21 (100.0%) | 15 (71.4%) |
| Total | 57 (42.2%) | 98 (72.6%) |
Disability Status by Sex by Age in Fairfax
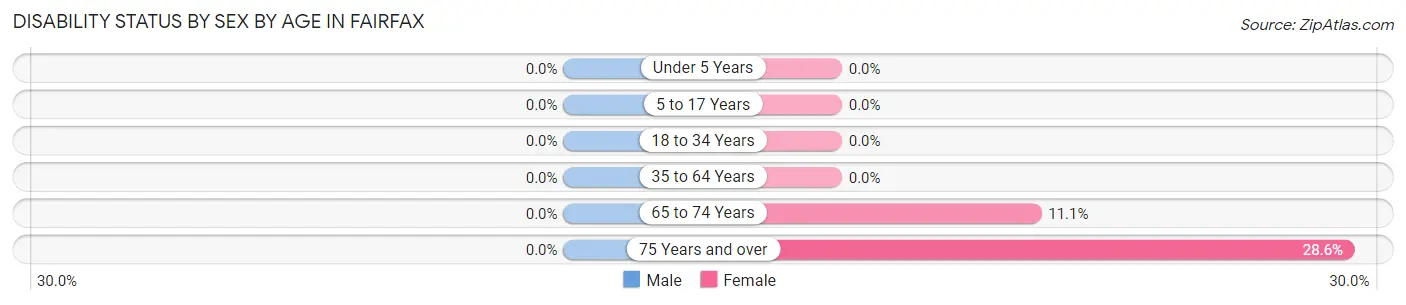
| Age Bracket | Male | Female |
| Under 5 Years | 0 (0.0%) | 0 (0.0%) |
| 5 to 17 Years | 0 (0.0%) | 0 (0.0%) |
| 18 to 34 Years | 0 (0.0%) | 0 (0.0%) |
| 35 to 64 Years | 0 (0.0%) | 0 (0.0%) |
| 65 to 74 Years | 0 (0.0%) | 1 (11.1%) |
| 75 Years and over | 0 (0.0%) | 4 (28.6%) |
Disability Class by Sex by Age in Fairfax
Disability Class: Hearing Difficulty
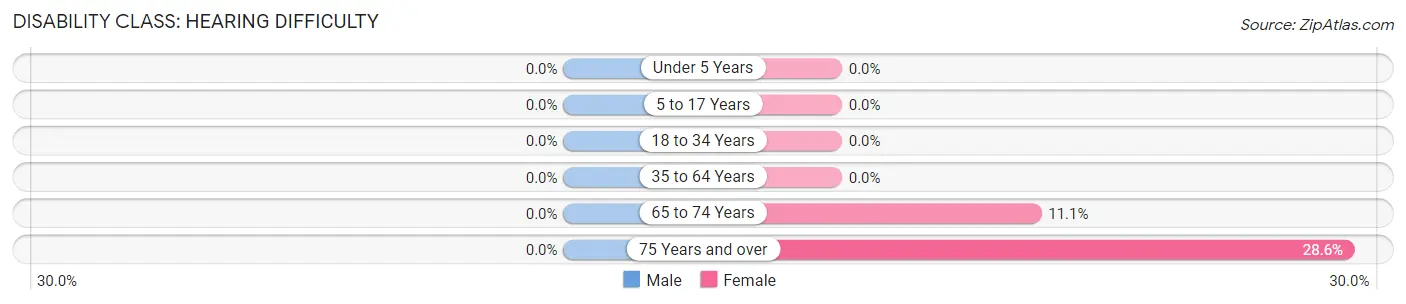
| Age Bracket | Male | Female |
| Under 5 Years | 0 (0.0%) | 0 (0.0%) |
| 5 to 17 Years | 0 (0.0%) | 0 (0.0%) |
| 18 to 34 Years | 0 (0.0%) | 0 (0.0%) |
| 35 to 64 Years | 0 (0.0%) | 0 (0.0%) |
| 65 to 74 Years | 0 (0.0%) | 1 (11.1%) |
| 75 Years and over | 0 (0.0%) | 4 (28.6%) |
Disability Class: Vision Difficulty
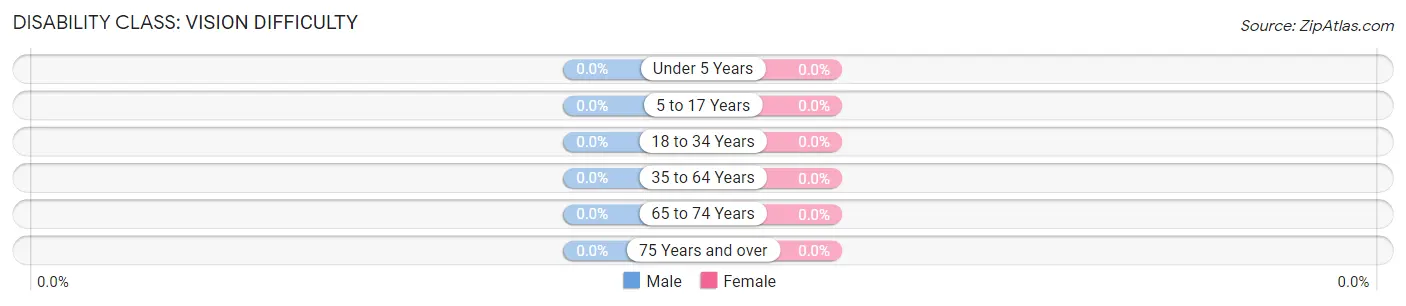
| Age Bracket | Male | Female |
| Under 5 Years | 0 (0.0%) | 0 (0.0%) |
| 5 to 17 Years | 0 (0.0%) | 0 (0.0%) |
| 18 to 34 Years | 0 (0.0%) | 0 (0.0%) |
| 35 to 64 Years | 0 (0.0%) | 0 (0.0%) |
| 65 to 74 Years | 0 (0.0%) | 0 (0.0%) |
| 75 Years and over | 0 (0.0%) | 0 (0.0%) |
Disability Class: Cognitive Difficulty
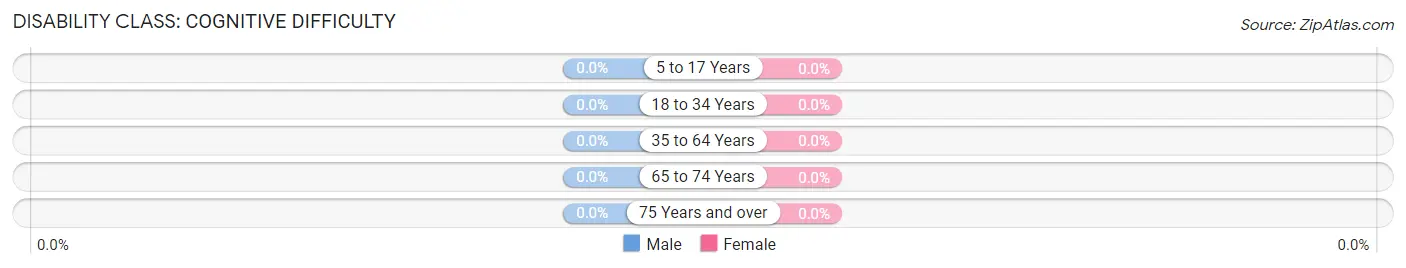
| Age Bracket | Male | Female |
| 5 to 17 Years | 0 (0.0%) | 0 (0.0%) |
| 18 to 34 Years | 0 (0.0%) | 0 (0.0%) |
| 35 to 64 Years | 0 (0.0%) | 0 (0.0%) |
| 65 to 74 Years | 0 (0.0%) | 0 (0.0%) |
| 75 Years and over | 0 (0.0%) | 0 (0.0%) |
Disability Class: Ambulatory Difficulty
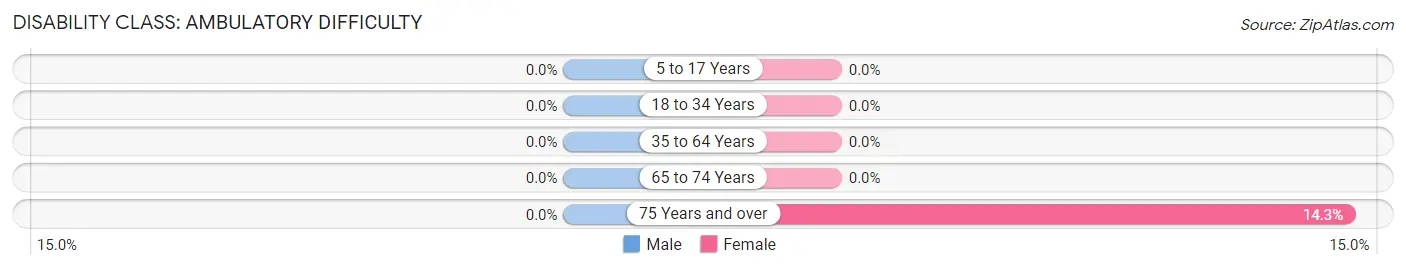
| Age Bracket | Male | Female |
| 5 to 17 Years | 0 (0.0%) | 0 (0.0%) |
| 18 to 34 Years | 0 (0.0%) | 0 (0.0%) |
| 35 to 64 Years | 0 (0.0%) | 0 (0.0%) |
| 65 to 74 Years | 0 (0.0%) | 0 (0.0%) |
| 75 Years and over | 0 (0.0%) | 2 (14.3%) |
Disability Class: Self-Care Difficulty
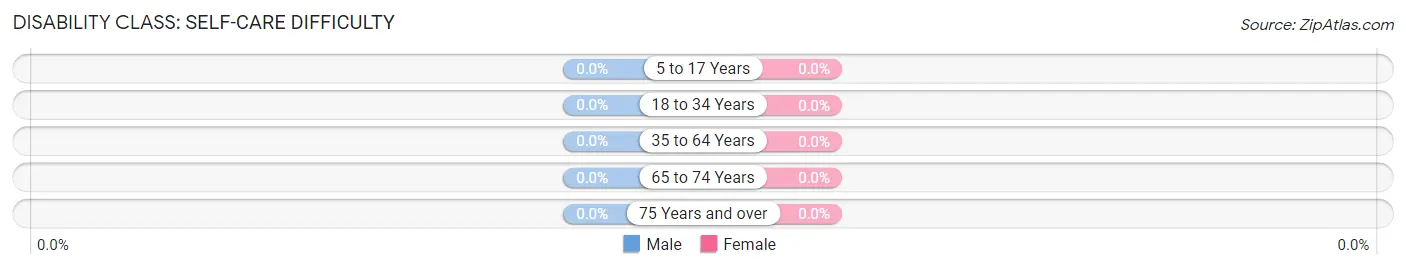
| Age Bracket | Male | Female |
| 5 to 17 Years | 0 (0.0%) | 0 (0.0%) |
| 18 to 34 Years | 0 (0.0%) | 0 (0.0%) |
| 35 to 64 Years | 0 (0.0%) | 0 (0.0%) |
| 65 to 74 Years | 0 (0.0%) | 0 (0.0%) |
| 75 Years and over | 0 (0.0%) | 0 (0.0%) |
Technology Access in Fairfax
Computing Device Access in Fairfax
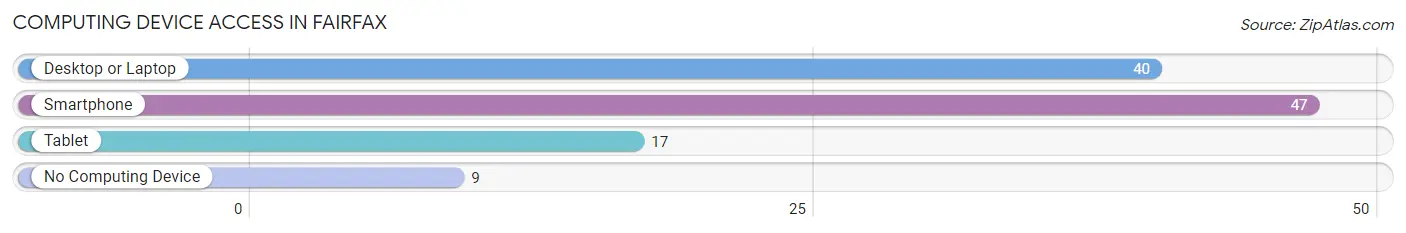
| Device Type | # Households | % Households |
| Desktop or Laptop | 40 | 58.8% |
| Smartphone | 47 | 69.1% |
| Tablet | 17 | 25.0% |
| No Computing Device | 9 | 13.2% |
| Total | 68 | 100.0% |
Internet Access in Fairfax
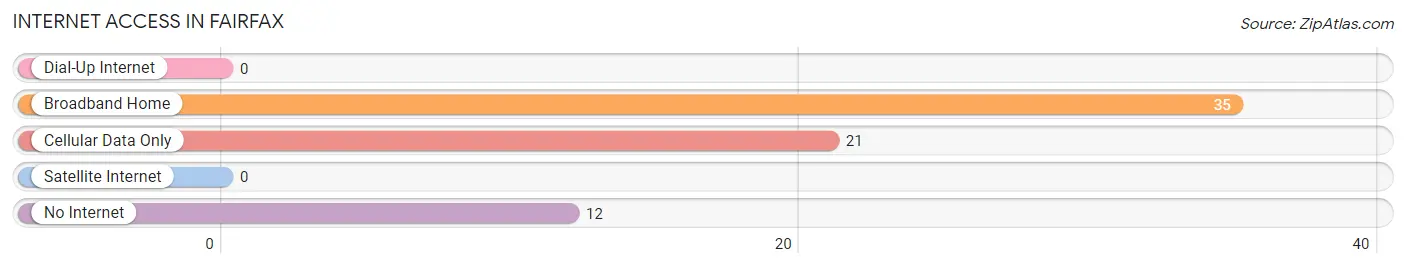
| Internet Type | # Households | % Households |
| Dial-Up Internet | 0 | 0.0% |
| Broadband Home | 35 | 51.5% |
| Cellular Data Only | 21 | 30.9% |
| Satellite Internet | 0 | 0.0% |
| No Internet | 12 | 17.6% |
| Total | 68 | 100.0% |
Fairfax Summary
Fairfax, South Dakota is a small town located in the southeastern corner of the state. It is situated in the rolling hills of the Missouri River Valley, and is surrounded by the scenic beauty of the Great Plains. The town has a population of just over 1,000 people, and is the county seat of Turner County.
History
Fairfax was founded in 1881 by a group of settlers from Iowa. The town was named after Fairfax, Iowa, the hometown of the settlers. The town was originally located on the banks of the Big Sioux River, but was moved to its current location in 1883 due to flooding.
The town quickly grew and prospered, and by the early 1900s, it had become a thriving agricultural center. The town was home to several businesses, including a bank, a hotel, a newspaper, and a variety of stores.
In the early 1900s, the town was also home to a large number of German immigrants. These immigrants brought with them their culture and traditions, which are still evident in the town today.
Geography
Fairfax is located in the southeastern corner of South Dakota, in the rolling hills of the Missouri River Valley. The town is situated at an elevation of 1,845 feet above sea level.
The town is surrounded by the scenic beauty of the Great Plains, and is located near the Big Sioux River. The town is also located near the Big Sioux Wildlife Refuge, which is home to a variety of wildlife, including deer, elk, and bison.
Economy
The economy of Fairfax is largely based on agriculture. The town is home to several large farms, which produce a variety of crops, including corn, soybeans, and wheat.
The town is also home to several businesses, including a bank, a hotel, a newspaper, and a variety of stores. The town is also home to a number of manufacturing companies, which produce a variety of products, including furniture, clothing, and electronics.
Demographics
As of the 2010 census, the population of Fairfax was 1,039. The town is predominantly white, with a small percentage of African Americans, Hispanics, and Native Americans. The median household income in Fairfax is $41,250, and the median home value is $90,000.
The town is served by the Turner County School District, which consists of two elementary schools, one middle school, and one high school. The town is also home to a number of churches, including the First Presbyterian Church, the First Baptist Church, and the United Methodist Church.
Conclusion
Fairfax, South Dakota is a small town located in the southeastern corner of the state. It is situated in the rolling hills of the Missouri River Valley, and is surrounded by the scenic beauty of the Great Plains. The town has a population of just over 1,000 people, and is the county seat of Turner County. The economy of Fairfax is largely based on agriculture, and the town is home to several businesses, including a bank, a hotel, a newspaper, and a variety of stores. The town is predominantly white, with a small percentage of African Americans, Hispanics, and Native Americans. The town is served by the Turner County School District, and is home to a number of churches.
Common Questions
What is Per Capita Income in Fairfax?
Per Capita income in Fairfax is $27,925.
What is the Median Family Income in Fairfax?
Median Family Income in Fairfax is $68,333.
What is the Median Household income in Fairfax?
Median Household Income in Fairfax is $41,250.
What is Income or Wage Gap in Fairfax?
Income or Wage Gap in Fairfax is 7.5%.
Women in Fairfax earn 92.5 cents for every dollar earned by a man.
What is Inequality or Gini Index in Fairfax?
Inequality or Gini Index in Fairfax is 0.45.
What is the Total Population of Fairfax?
Total Population of Fairfax is 135.
What is the Total Male Population of Fairfax?
Total Male Population of Fairfax is 50.
What is the Total Female Population of Fairfax?
Total Female Population of Fairfax is 85.
What is the Ratio of Males per 100 Females in Fairfax?
There are 58.82 Males per 100 Females in Fairfax.
What is the Ratio of Females per 100 Males in Fairfax?
There are 170.00 Females per 100 Males in Fairfax.
What is the Median Population Age in Fairfax?
Median Population Age in Fairfax is 45.3 Years.
What is the Average Family Size in Fairfax
Average Family Size in Fairfax is 3.1 People.
What is the Average Household Size in Fairfax
Average Household Size in Fairfax is 2.0 People.
How Large is the Labor Force in Fairfax?
There are 66 People in the Labor Forcein in Fairfax.
What is the Percentage of People in the Labor Force in Fairfax?
66.7% of People are in the Labor Force in Fairfax.