Dewey County, SD Map & Demographics
Dewey County Map
Dewey County Overview
$20,657
PER CAPITA INCOME
$58,346
AVG FAMILY INCOME
$55,077
AVG HOUSEHOLD INCOME
9.1%
WAGE / INCOME GAP [ % ]
90.9¢/ $1
WAGE / INCOME GAP [ $ ]
$14,022
FAMILY INCOME DEFICIT
0.43
INEQUALITY / GINI INDEX
5,275
TOTAL POPULATION
2,648
MALE POPULATION
2,627
FEMALE POPULATION
100.80
MALES / 100 FEMALES
99.21
FEMALES / 100 MALES
27.1
MEDIAN AGE
3.8
AVG FAMILY SIZE
3.1
AVG HOUSEHOLD SIZE
2,314
LABOR FORCE [ PEOPLE ]
67.0%
PERCENT IN LABOR FORCE
14.6%
UNEMPLOYMENT RATE
Dewey County Area Codes
Income in Dewey County
Income Overview in Dewey County
Per Capita Income in Dewey County is $20,657, while median incomes of families and households are $58,346 and $55,077 respectively.
| Characteristic | Number | Measure |
| Per Capita Income | 5,275 | $20,657 |
| Median Family Income | 1,170 | $58,346 |
| Mean Family Income | 1,170 | $70,738 |
| Median Household Income | 1,675 | $55,077 |
| Mean Household Income | 1,675 | $66,150 |
| Income Deficit | 1,170 | $14,022 |
| Wage / Income Gap (%) | 5,275 | 9.07% |
| Wage / Income Gap ($) | 5,275 | 90.93¢ per $1 |
| Gini / Inequality Index | 5,275 | 0.43 |
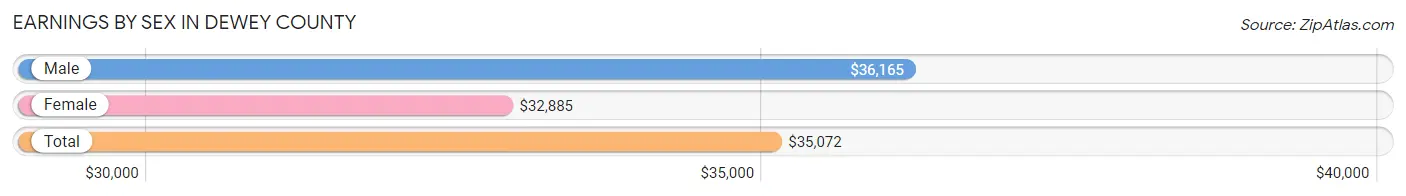
Earnings by Sex in Dewey County
Average Earnings in Dewey County are $35,072, $36,165 for men and $32,885 for women, a difference of 9.1%.
| Sex | Number | Average Earnings |
| Male | 1,050 (48.6%) | $36,165 |
| Female | 1,112 (51.4%) | $32,885 |
| Total | 2,162 (100.0%) | $35,072 |
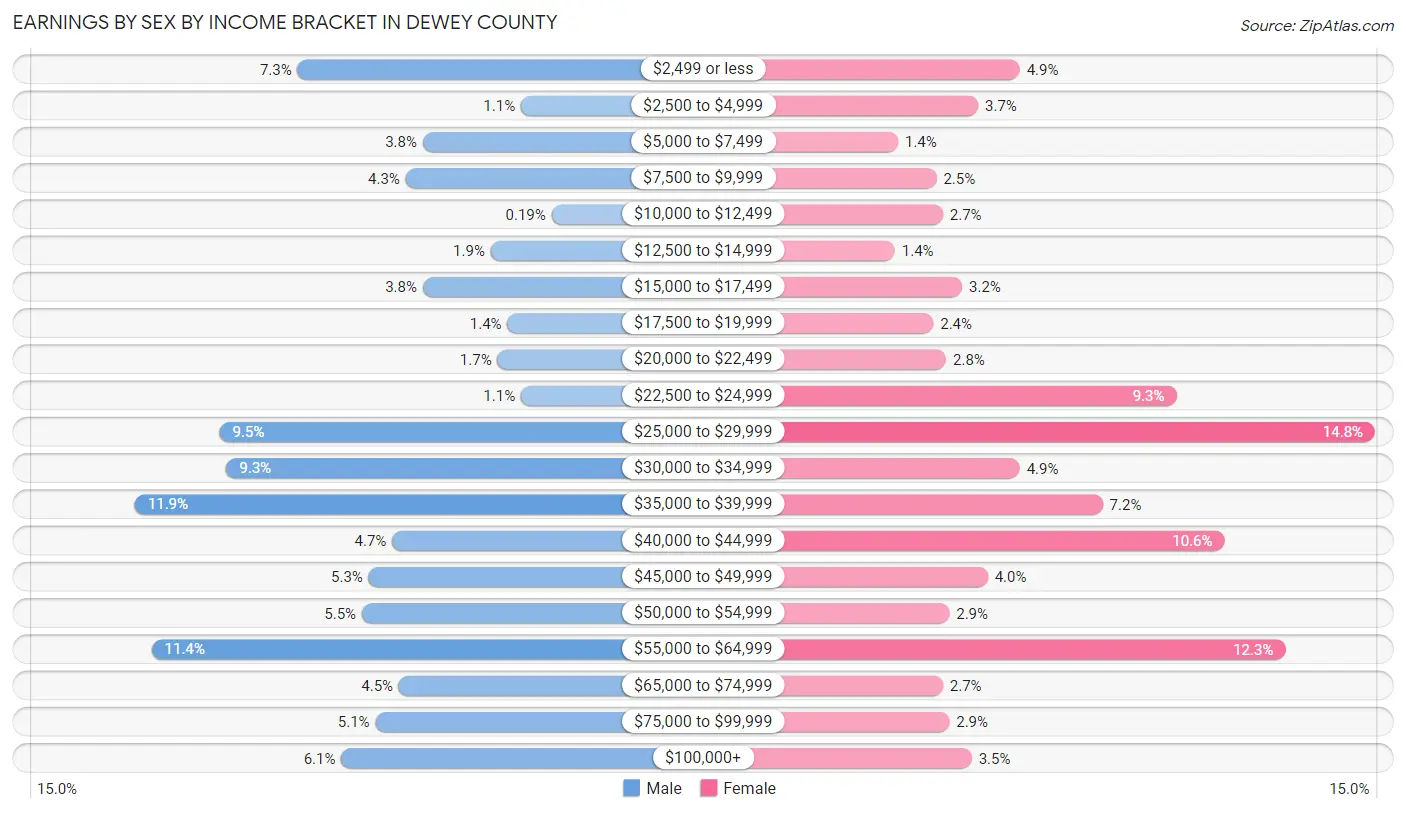
Earnings by Sex by Income Bracket in Dewey County
The most common earnings brackets in Dewey County are $35,000 to $39,999 for men (125 | 11.9%) and $25,000 to $29,999 for women (165 | 14.8%).
| Income | Male | Female |
| $2,499 or less | 77 (7.3%) | 54 (4.9%) |
| $2,500 to $4,999 | 11 (1.1%) | 41 (3.7%) |
| $5,000 to $7,499 | 40 (3.8%) | 16 (1.4%) |
| $7,500 to $9,999 | 45 (4.3%) | 28 (2.5%) |
| $10,000 to $12,499 | 2 (0.2%) | 30 (2.7%) |
| $12,500 to $14,999 | 20 (1.9%) | 15 (1.3%) |
| $15,000 to $17,499 | 40 (3.8%) | 36 (3.2%) |
| $17,500 to $19,999 | 15 (1.4%) | 27 (2.4%) |
| $20,000 to $22,499 | 18 (1.7%) | 31 (2.8%) |
| $22,500 to $24,999 | 11 (1.1%) | 103 (9.3%) |
| $25,000 to $29,999 | 100 (9.5%) | 165 (14.8%) |
| $30,000 to $34,999 | 98 (9.3%) | 54 (4.9%) |
| $35,000 to $39,999 | 125 (11.9%) | 80 (7.2%) |
| $40,000 to $44,999 | 49 (4.7%) | 118 (10.6%) |
| $45,000 to $49,999 | 56 (5.3%) | 44 (4.0%) |
| $50,000 to $54,999 | 58 (5.5%) | 32 (2.9%) |
| $55,000 to $64,999 | 120 (11.4%) | 137 (12.3%) |
| $65,000 to $74,999 | 47 (4.5%) | 30 (2.7%) |
| $75,000 to $99,999 | 54 (5.1%) | 32 (2.9%) |
| $100,000+ | 64 (6.1%) | 39 (3.5%) |
| Total | 1,050 (100.0%) | 1,112 (100.0%) |
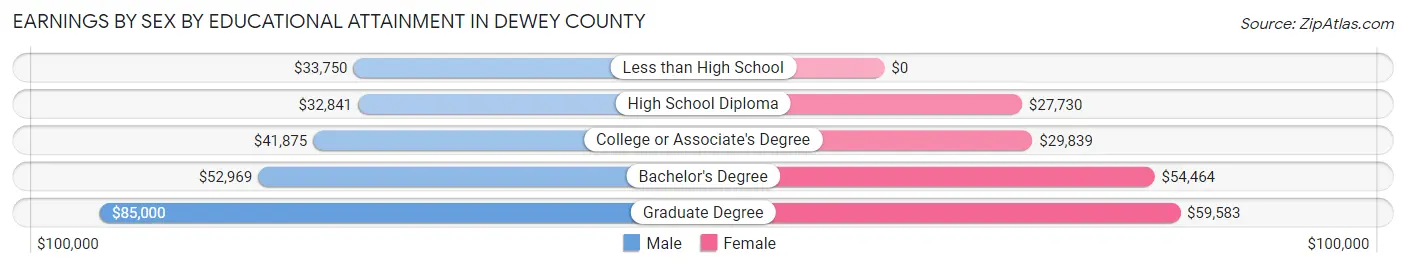
Earnings by Sex by Educational Attainment in Dewey County
Average earnings in Dewey County are $36,621 for men and $34,279 for women, a difference of 6.4%. Men with an educational attainment of graduate degree enjoy the highest average annual earnings of $85,000, while those with high school diploma education earn the least with $32,841. Women with an educational attainment of graduate degree earn the most with the average annual earnings of $59,583, while those with high school diploma education have the smallest earnings of $27,730.
| Educational Attainment | Male Income | Female Income |
| Less than High School | $33,750 | $0 |
| High School Diploma | $32,841 | $27,730 |
| College or Associate's Degree | $41,875 | $29,839 |
| Bachelor's Degree | $52,969 | $54,464 |
| Graduate Degree | $85,000 | $59,583 |
| Total | $36,621 | $34,279 |
Family Income in Dewey County
Family Income Brackets in Dewey County
According to the Dewey County family income data, there are 287 families falling into the $50,000 to $74,999 income range, which is the most common income bracket and makes up 24.5% of all families. Conversely, the $200,000+ income bracket is the least frequent group with only 43 families (3.7%) belonging to this category.
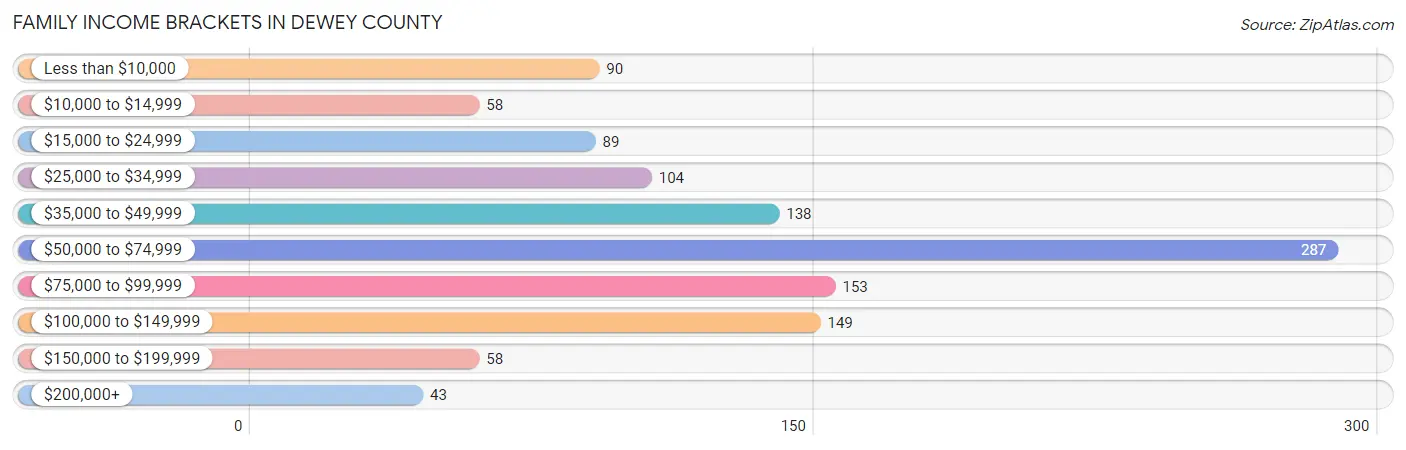
| Income Bracket | # Families | % Families |
| Less than $10,000 | 90 | 7.7% |
| $10,000 to $14,999 | 58 | 5.0% |
| $15,000 to $24,999 | 89 | 7.6% |
| $25,000 to $34,999 | 104 | 8.9% |
| $35,000 to $49,999 | 138 | 11.8% |
| $50,000 to $74,999 | 287 | 24.5% |
| $75,000 to $99,999 | 153 | 13.1% |
| $100,000 to $149,999 | 149 | 12.7% |
| $150,000 to $199,999 | 58 | 5.0% |
| $200,000+ | 43 | 3.7% |
Family Income by Famaliy Size in Dewey County
6-person families (59 | 5.0%) account for the highest median family income in Dewey County with $72,344 per family, while 2-person families (412 | 35.2%) have the highest median income of $30,882 per family member.
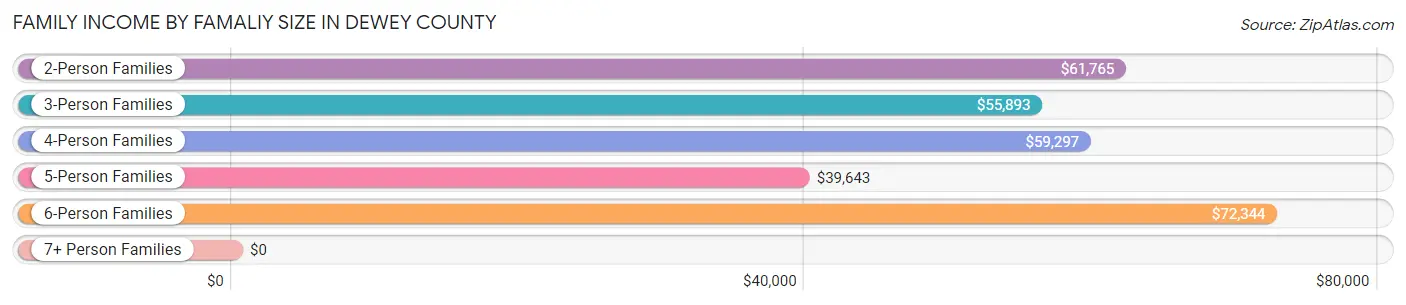
| Income Bracket | # Families | Median Income |
| 2-Person Families | 412 (35.2%) | $61,765 |
| 3-Person Families | 231 (19.7%) | $55,893 |
| 4-Person Families | 197 (16.8%) | $59,297 |
| 5-Person Families | 166 (14.2%) | $39,643 |
| 6-Person Families | 59 (5.0%) | $72,344 |
| 7+ Person Families | 105 (9.0%) | $0 |
| Total | 1,170 (100.0%) | $58,346 |
Family Income by Number of Earners in Dewey County
The median family income in Dewey County is $58,346, with families comprising 3+ earners (89) having the highest median family income of $113,594, while families with no earners (200) have the lowest median family income of $16,250, accounting for 7.6% and 17.1% of families, respectively.
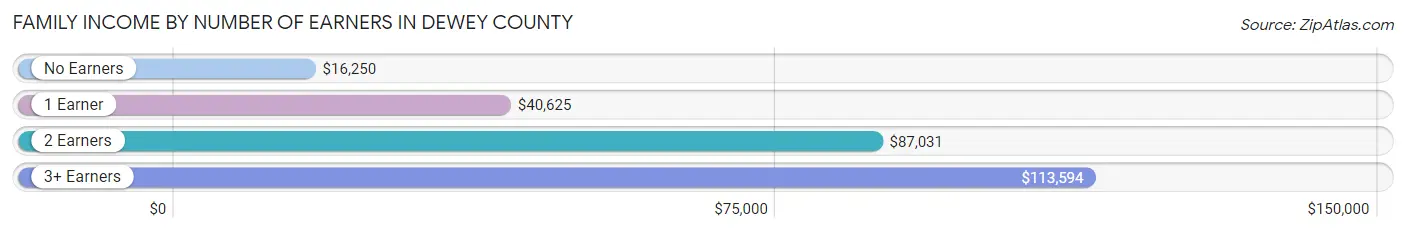
| Number of Earners | # Families | Median Income |
| No Earners | 200 (17.1%) | $16,250 |
| 1 Earner | 400 (34.2%) | $40,625 |
| 2 Earners | 481 (41.1%) | $87,031 |
| 3+ Earners | 89 (7.6%) | $113,594 |
| Total | 1,170 (100.0%) | $58,346 |
Household Income in Dewey County
Household Income Brackets in Dewey County
With 392 households falling in the category, the $50,000 to $74,999 income range is the most frequent in Dewey County, accounting for 23.4% of all households. In contrast, only 44 households (2.6%) fall into the $200,000+ income bracket, making it the least populous group.
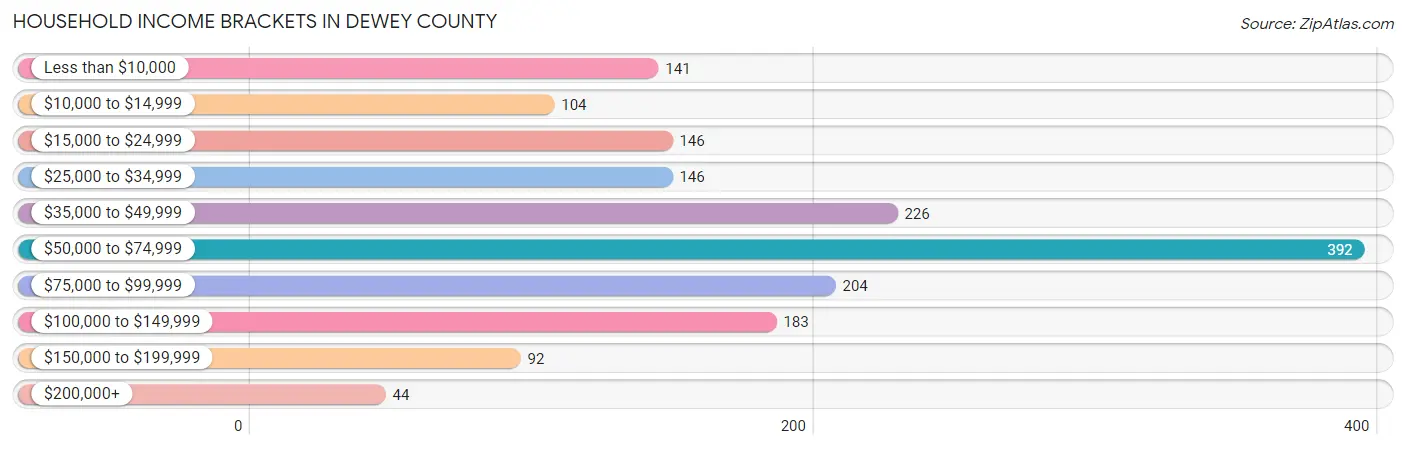
| Income Bracket | # Households | % Households |
| Less than $10,000 | 141 | 8.4% |
| $10,000 to $14,999 | 104 | 6.2% |
| $15,000 to $24,999 | 146 | 8.7% |
| $25,000 to $34,999 | 146 | 8.7% |
| $35,000 to $49,999 | 226 | 13.5% |
| $50,000 to $74,999 | 392 | 23.4% |
| $75,000 to $99,999 | 204 | 12.2% |
| $100,000 to $149,999 | 183 | 10.9% |
| $150,000 to $199,999 | 92 | 5.5% |
| $200,000+ | 44 | 2.6% |
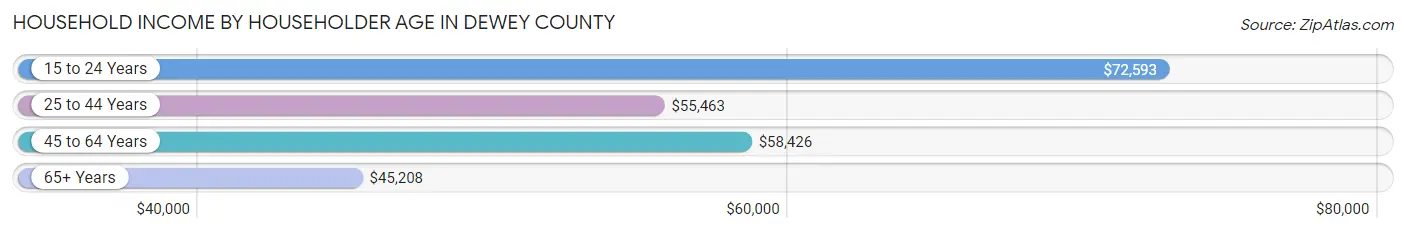
Household Income by Householder Age in Dewey County
The median household income in Dewey County is $55,077, with the highest median household income of $72,593 found in the 15 to 24 years age bracket for the primary householder. A total of 62 households (3.7%) fall into this category. Meanwhile, the 65+ years age bracket for the primary householder has the lowest median household income of $45,208, with 357 households (21.3%) in this group.
| Income Bracket | # Households | Median Income |
| 15 to 24 Years | 62 (3.7%) | $72,593 |
| 25 to 44 Years | 610 (36.4%) | $55,463 |
| 45 to 64 Years | 646 (38.6%) | $58,426 |
| 65+ Years | 357 (21.3%) | $45,208 |
| Total | 1,675 (100.0%) | $55,077 |
Poverty in Dewey County
Income Below Poverty by Sex and Age in Dewey County
With 32.3% poverty level for males and 29.5% for females among the residents of Dewey County, 5 year old males and 5 year old females are the most vulnerable to poverty, with 59 males (69.4%) and 8 females (50.0%) in their respective age groups living below the poverty level.
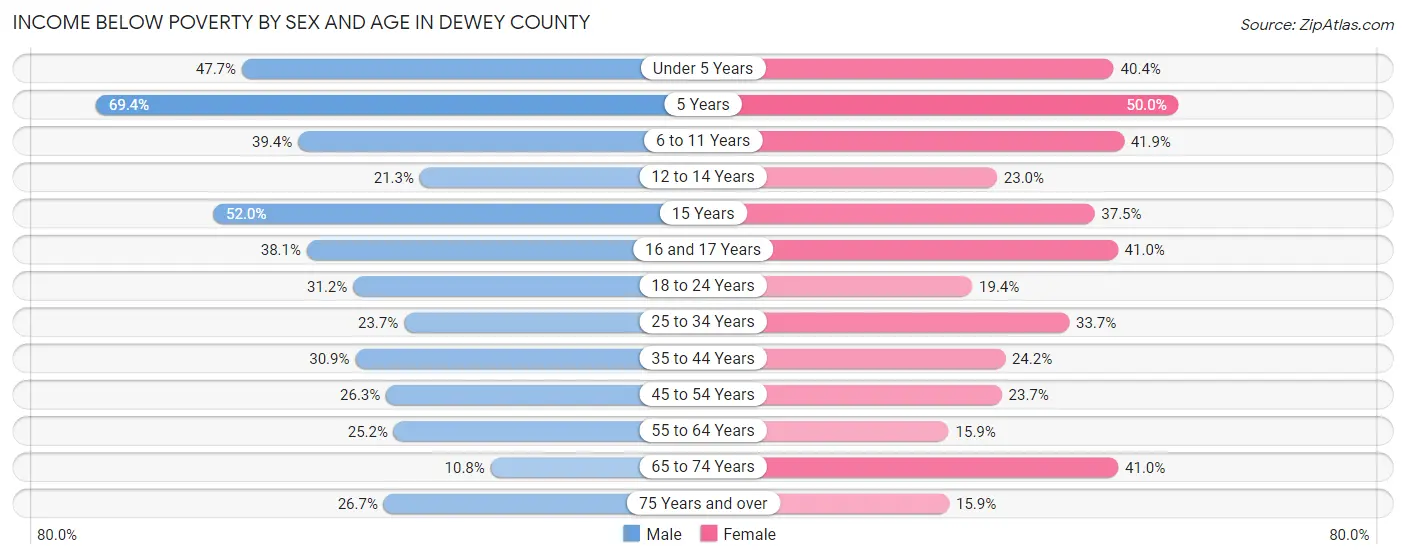
| Age Bracket | Male | Female |
| Under 5 Years | 148 (47.7%) | 109 (40.4%) |
| 5 Years | 59 (69.4%) | 8 (50.0%) |
| 6 to 11 Years | 145 (39.4%) | 144 (41.9%) |
| 12 to 14 Years | 29 (21.3%) | 38 (23.0%) |
| 15 Years | 26 (52.0%) | 21 (37.5%) |
| 16 and 17 Years | 32 (38.1%) | 34 (41.0%) |
| 18 to 24 Years | 74 (31.2%) | 48 (19.4%) |
| 25 to 34 Years | 66 (23.7%) | 111 (33.7%) |
| 35 to 44 Years | 97 (30.9%) | 71 (24.2%) |
| 45 to 54 Years | 60 (26.3%) | 56 (23.7%) |
| 55 to 64 Years | 70 (25.2%) | 46 (15.9%) |
| 65 to 74 Years | 19 (10.8%) | 64 (41.0%) |
| 75 Years and over | 16 (26.7%) | 18 (15.9%) |
| Total | 841 (32.3%) | 768 (29.5%) |
Income Above Poverty by Sex and Age in Dewey County
According to the poverty statistics in Dewey County, males aged 65 to 74 years and females aged 55 to 64 years are the age groups that are most secure financially, with 89.2% of males and 84.1% of females in these age groups living above the poverty line.
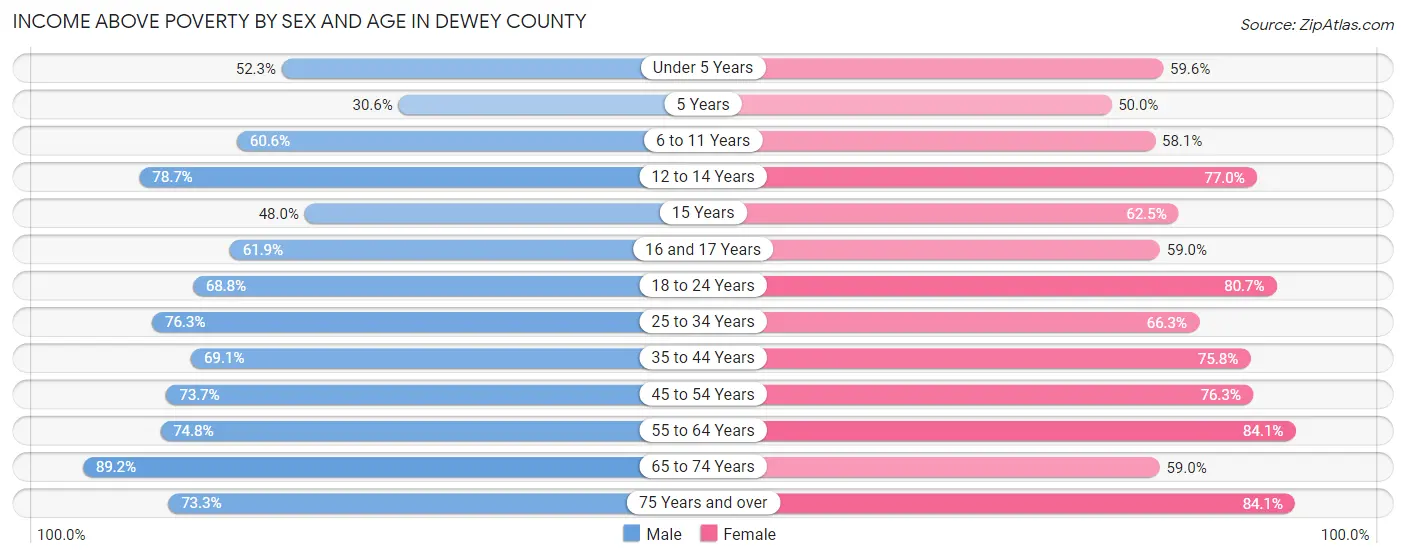
| Age Bracket | Male | Female |
| Under 5 Years | 162 (52.3%) | 161 (59.6%) |
| 5 Years | 26 (30.6%) | 8 (50.0%) |
| 6 to 11 Years | 223 (60.6%) | 200 (58.1%) |
| 12 to 14 Years | 107 (78.7%) | 127 (77.0%) |
| 15 Years | 24 (48.0%) | 35 (62.5%) |
| 16 and 17 Years | 52 (61.9%) | 49 (59.0%) |
| 18 to 24 Years | 163 (68.8%) | 200 (80.6%) |
| 25 to 34 Years | 213 (76.3%) | 218 (66.3%) |
| 35 to 44 Years | 217 (69.1%) | 222 (75.8%) |
| 45 to 54 Years | 168 (73.7%) | 180 (76.3%) |
| 55 to 64 Years | 208 (74.8%) | 244 (84.1%) |
| 65 to 74 Years | 157 (89.2%) | 92 (59.0%) |
| 75 Years and over | 44 (73.3%) | 95 (84.1%) |
| Total | 1,764 (67.7%) | 1,831 (70.5%) |
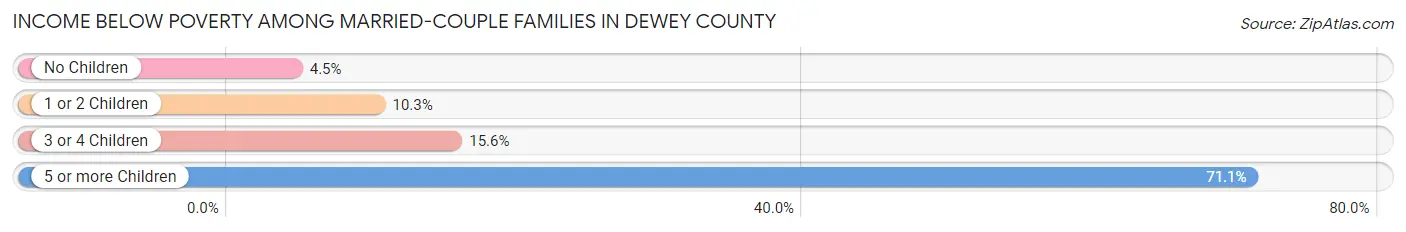
Income Below Poverty Among Married-Couple Families in Dewey County
The poverty statistics for married-couple families in Dewey County show that 12.9% or 77 of the total 595 families live below the poverty line. Families with 5 or more children have the highest poverty rate of 71.1%, comprising of 27 families. On the other hand, families with no children have the lowest poverty rate of 4.5%, which includes 11 families.
| Children | Above Poverty | Below Poverty |
| No Children | 233 (95.5%) | 11 (4.5%) |
| 1 or 2 Children | 166 (89.7%) | 19 (10.3%) |
| 3 or 4 Children | 108 (84.4%) | 20 (15.6%) |
| 5 or more Children | 11 (28.9%) | 27 (71.1%) |
| Total | 518 (87.1%) | 77 (12.9%) |
Income Below Poverty Among Single-Parent Households in Dewey County
According to the poverty data in Dewey County, 27.5% or 55 single-father households and 43.7% or 164 single-mother households are living below the poverty line. Among single-father households, those with 3 or 4 children have the highest poverty rate, with 8 households (34.8%) experiencing poverty. Likewise, among single-mother households, those with 5 or more children have the highest poverty rate, with 31 households (100.0%) falling below the poverty line.
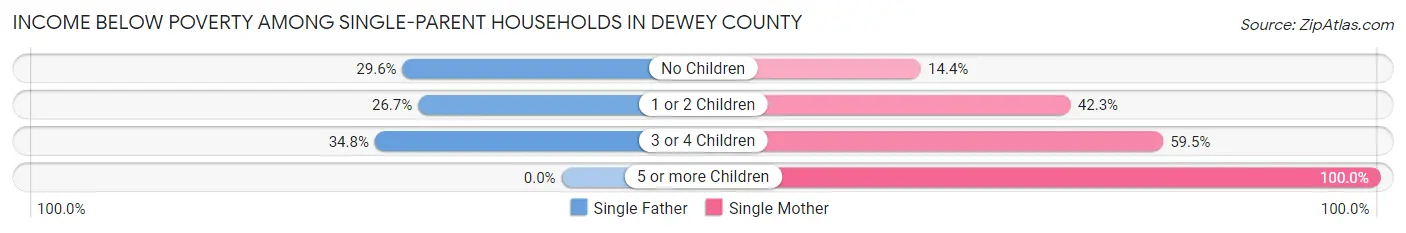
| Children | Single Father | Single Mother |
| No Children | 16 (29.6%) | 14 (14.4%) |
| 1 or 2 Children | 31 (26.7%) | 69 (42.3%) |
| 3 or 4 Children | 8 (34.8%) | 50 (59.5%) |
| 5 or more Children | 0 (0.0%) | 31 (100.0%) |
| Total | 55 (27.5%) | 164 (43.7%) |
Income Below Poverty Among Married-Couple vs Single-Parent Households in Dewey County
The poverty data for Dewey County shows that 77 of the married-couple family households (12.9%) and 219 of the single-parent households (38.1%) are living below the poverty level. Within the married-couple family households, those with 5 or more children have the highest poverty rate, with 27 households (71.1%) falling below the poverty line. Among the single-parent households, those with 5 or more children have the highest poverty rate, with 31 household (81.6%) living below poverty.
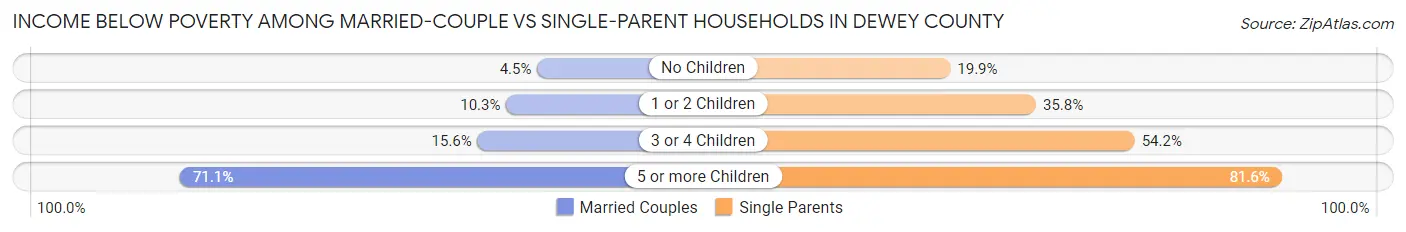
| Children | Married-Couple Families | Single-Parent Households |
| No Children | 11 (4.5%) | 30 (19.9%) |
| 1 or 2 Children | 19 (10.3%) | 100 (35.8%) |
| 3 or 4 Children | 20 (15.6%) | 58 (54.2%) |
| 5 or more Children | 27 (71.1%) | 31 (81.6%) |
| Total | 77 (12.9%) | 219 (38.1%) |
Race in Dewey County
The most populous races in Dewey County are Native / Alaskan (4,083 | 77.4%), White / Caucasian (985 | 18.7%), and Two or more Races (152 | 2.9%).
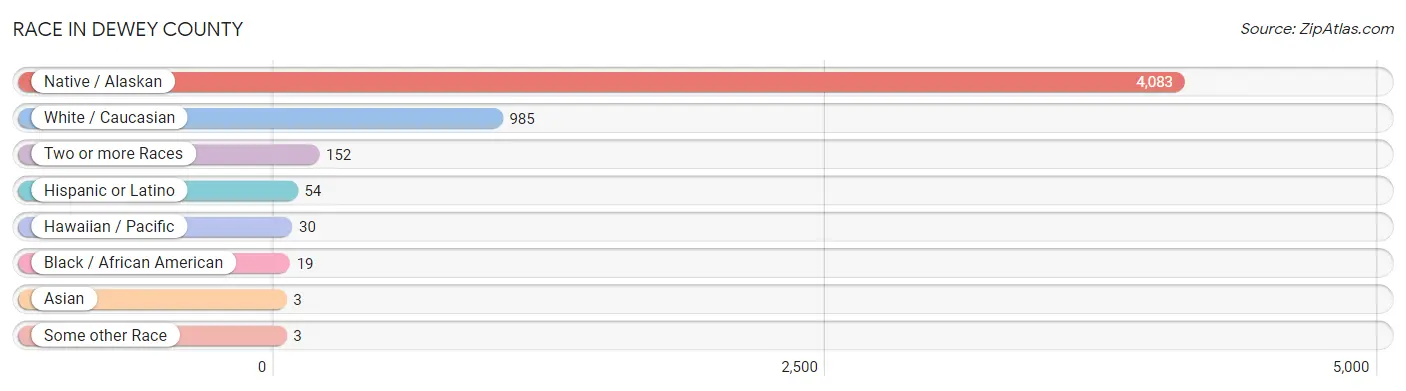
| Race | # Population | % Population |
| Asian | 3 | 0.1% |
| Black / African American | 19 | 0.4% |
| Hawaiian / Pacific | 30 | 0.6% |
| Hispanic or Latino | 54 | 1.0% |
| Native / Alaskan | 4,083 | 77.4% |
| White / Caucasian | 985 | 18.7% |
| Two or more Races | 152 | 2.9% |
| Some other Race | 3 | 0.1% |
| Total | 5,275 | 100.0% |
Ancestry in Dewey County
The most populous ancestries reported in Dewey County are Sioux (3,914 | 74.2%), German (582 | 11.0%), American (204 | 3.9%), Irish (156 | 3.0%), and Norwegian (115 | 2.2%), together accounting for 94.2% of all Dewey County residents.
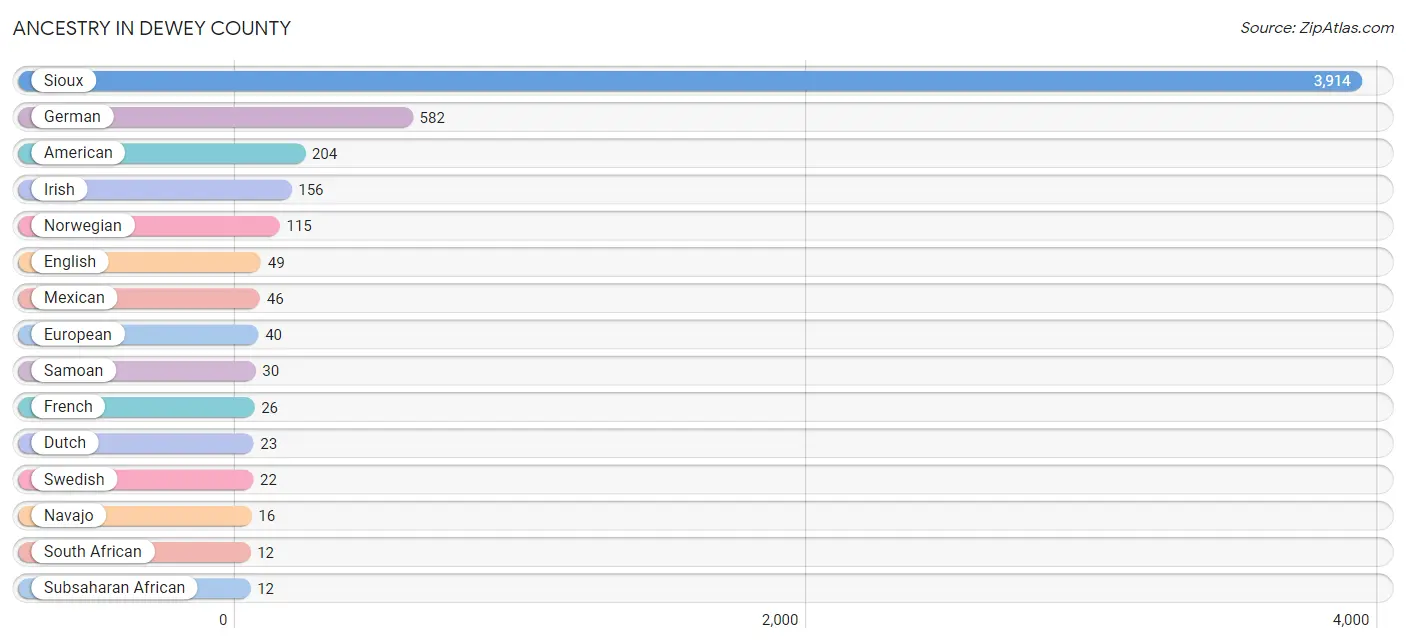
| Ancestry | # Population | % Population |
| American | 204 | 3.9% |
| Austrian | 1 | 0.0% |
| Cheyenne | 5 | 0.1% |
| Chippewa | 7 | 0.1% |
| Czech | 9 | 0.2% |
| Danish | 5 | 0.1% |
| Dutch | 23 | 0.4% |
| English | 49 | 0.9% |
| European | 40 | 0.8% |
| Filipino | 3 | 0.1% |
| French | 26 | 0.5% |
| German | 582 | 11.0% |
| Hopi | 4 | 0.1% |
| Hungarian | 4 | 0.1% |
| Icelander | 4 | 0.1% |
| Irish | 156 | 3.0% |
| Italian | 4 | 0.1% |
| Mexican | 46 | 0.9% |
| Mexican American Indian | 2 | 0.0% |
| Navajo | 16 | 0.3% |
| Norwegian | 115 | 2.2% |
| Polish | 8 | 0.2% |
| Pueblo | 5 | 0.1% |
| Puerto Rican | 8 | 0.2% |
| Russian | 10 | 0.2% |
| Samoan | 30 | 0.6% |
| Scandinavian | 6 | 0.1% |
| Scotch-Irish | 3 | 0.1% |
| Sioux | 3,914 | 74.2% |
| South African | 12 | 0.2% |
| Subsaharan African | 12 | 0.2% |
| Swedish | 22 | 0.4% | View All 32 Rows |
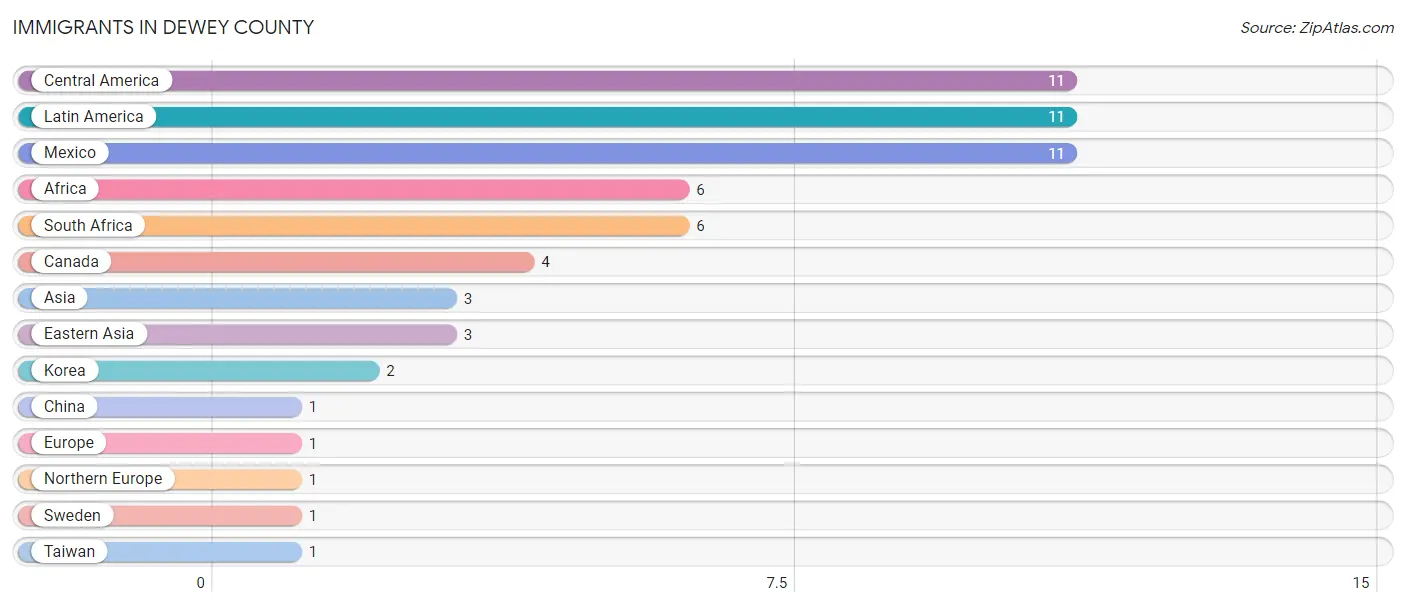
Immigrants in Dewey County
The most numerous immigrant groups reported in Dewey County came from Central America (11 | 0.2%), Latin America (11 | 0.2%), Mexico (11 | 0.2%), Africa (6 | 0.1%), and South Africa (6 | 0.1%), together accounting for 0.9% of all Dewey County residents.
| Immigration Origin | # Population | % Population |
| Africa | 6 | 0.1% |
| Asia | 3 | 0.1% |
| Canada | 4 | 0.1% |
| Central America | 11 | 0.2% |
| China | 1 | 0.0% |
| Eastern Asia | 3 | 0.1% |
| Europe | 1 | 0.0% |
| Korea | 2 | 0.0% |
| Latin America | 11 | 0.2% |
| Mexico | 11 | 0.2% |
| Northern Europe | 1 | 0.0% |
| South Africa | 6 | 0.1% |
| Sweden | 1 | 0.0% |
| Taiwan | 1 | 0.0% | View All 14 Rows |
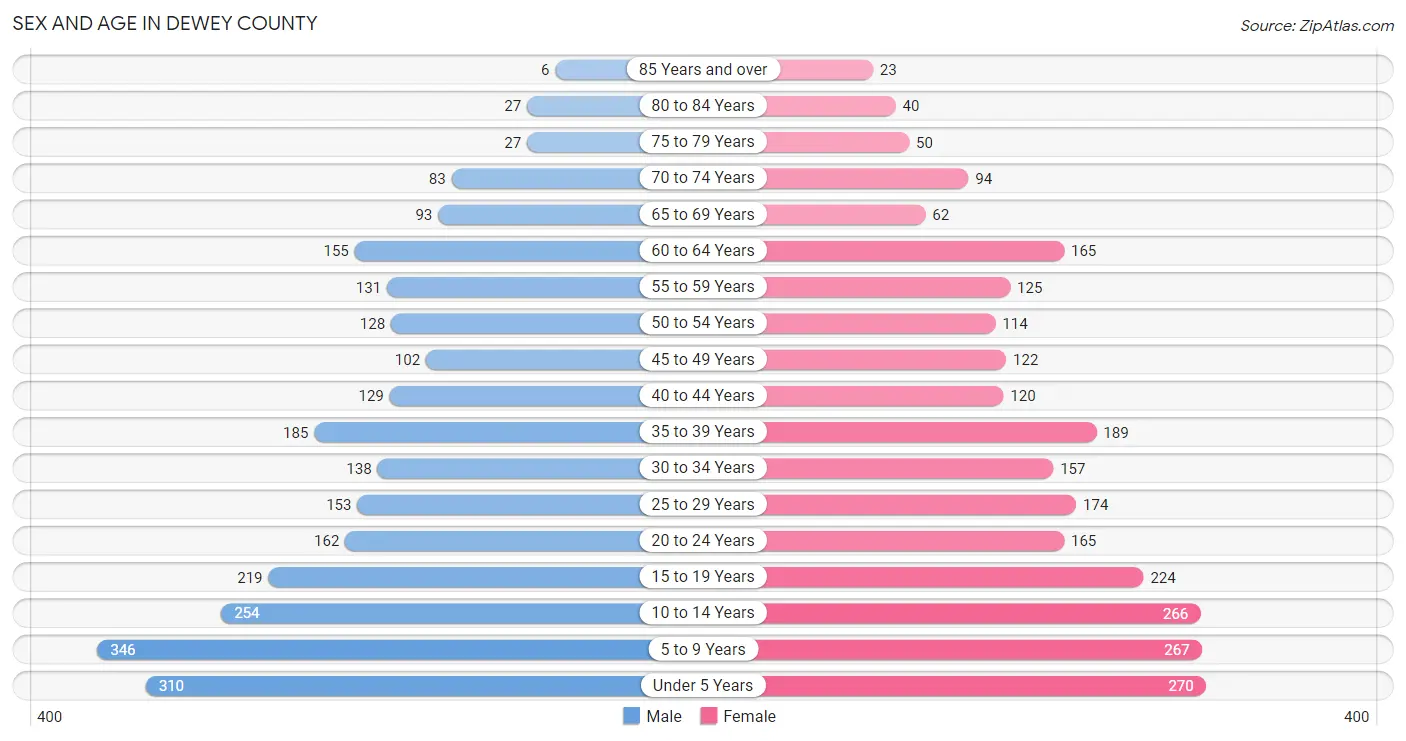
Sex and Age in Dewey County
Sex and Age in Dewey County
The most populous age groups in Dewey County are 5 to 9 Years (346 | 13.1%) for men and Under 5 Years (270 | 10.3%) for women.
| Age Bracket | Male | Female |
| Under 5 Years | 310 (11.7%) | 270 (10.3%) |
| 5 to 9 Years | 346 (13.1%) | 267 (10.2%) |
| 10 to 14 Years | 254 (9.6%) | 266 (10.1%) |
| 15 to 19 Years | 219 (8.3%) | 224 (8.5%) |
| 20 to 24 Years | 162 (6.1%) | 165 (6.3%) |
| 25 to 29 Years | 153 (5.8%) | 174 (6.6%) |
| 30 to 34 Years | 138 (5.2%) | 157 (6.0%) |
| 35 to 39 Years | 185 (7.0%) | 189 (7.2%) |
| 40 to 44 Years | 129 (4.9%) | 120 (4.6%) |
| 45 to 49 Years | 102 (3.8%) | 122 (4.6%) |
| 50 to 54 Years | 128 (4.8%) | 114 (4.3%) |
| 55 to 59 Years | 131 (5.0%) | 125 (4.8%) |
| 60 to 64 Years | 155 (5.9%) | 165 (6.3%) |
| 65 to 69 Years | 93 (3.5%) | 62 (2.4%) |
| 70 to 74 Years | 83 (3.1%) | 94 (3.6%) |
| 75 to 79 Years | 27 (1.0%) | 50 (1.9%) |
| 80 to 84 Years | 27 (1.0%) | 40 (1.5%) |
| 85 Years and over | 6 (0.2%) | 23 (0.9%) |
| Total | 2,648 (100.0%) | 2,627 (100.0%) |
Families and Households in Dewey County
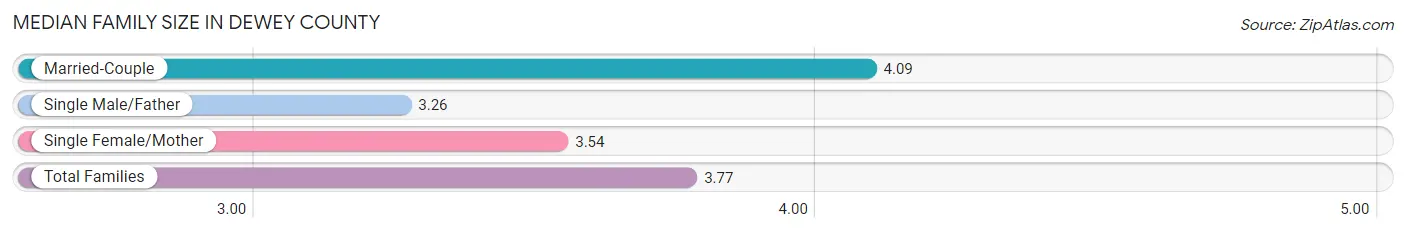
Median Family Size in Dewey County
The median family size in Dewey County is 3.77 persons per family, with married-couple families (595 | 50.8%) accounting for the largest median family size of 4.09 persons per family. On the other hand, single male/father families (200 | 17.1%) represent the smallest median family size with 3.26 persons per family.
| Family Type | # Families | Family Size |
| Married-Couple | 595 (50.8%) | 4.09 |
| Single Male/Father | 200 (17.1%) | 3.26 |
| Single Female/Mother | 375 (32.1%) | 3.54 |
| Total Families | 1,170 (100.0%) | 3.77 |
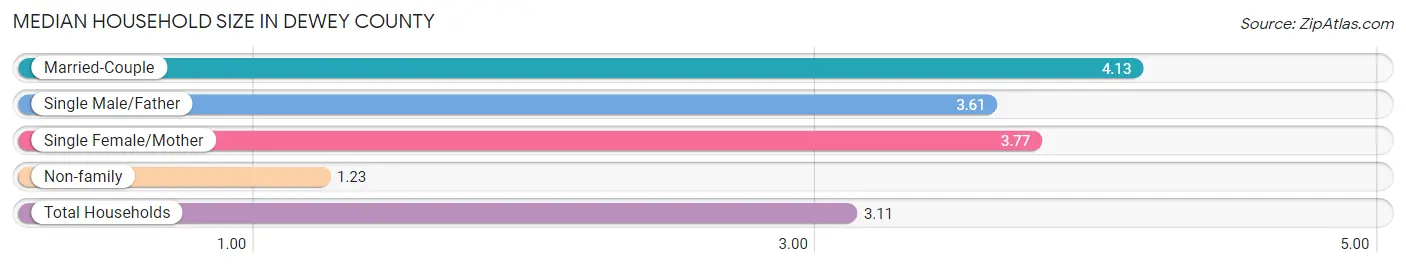
Median Household Size in Dewey County
The median household size in Dewey County is 3.11 persons per household, with married-couple households (595 | 35.5%) accounting for the largest median household size of 4.13 persons per household. non-family households (505 | 30.1%) represent the smallest median household size with 1.23 persons per household.
| Household Type | # Households | Household Size |
| Married-Couple | 595 (35.5%) | 4.13 |
| Single Male/Father | 200 (11.9%) | 3.61 |
| Single Female/Mother | 375 (22.4%) | 3.77 |
| Non-family | 505 (30.1%) | 1.23 |
| Total Households | 1,675 (100.0%) | 3.11 |
Household Size by Marriage Status in Dewey County
Out of a total of 1,675 households in Dewey County, 1,170 (69.9%) are family households, while 505 (30.1%) are nonfamily households. The most numerous type of family households are 2-person households, comprising 373, and the most common type of nonfamily households are 1-person households, comprising 402.
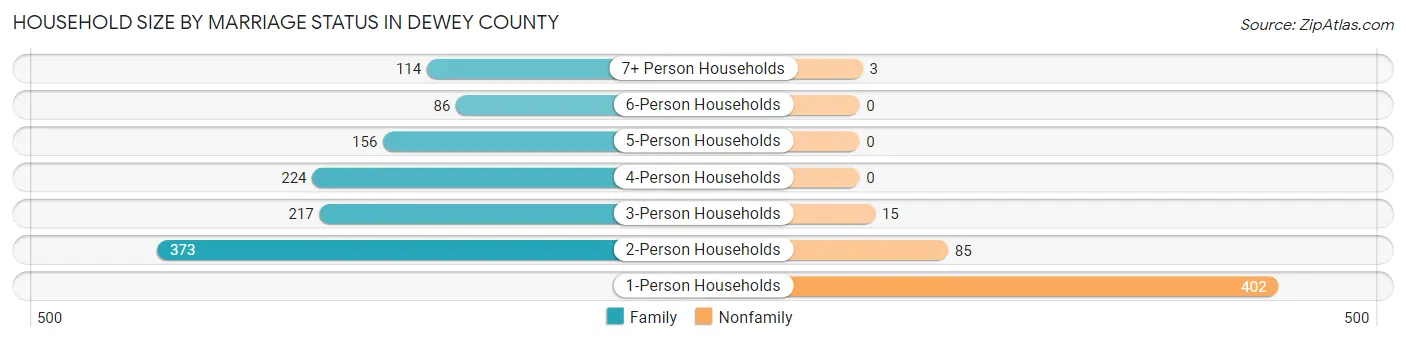
| Household Size | Family Households | Nonfamily Households |
| 1-Person Households | - | 402 (24.0%) |
| 2-Person Households | 373 (22.3%) | 85 (5.1%) |
| 3-Person Households | 217 (13.0%) | 15 (0.9%) |
| 4-Person Households | 224 (13.4%) | 0 (0.0%) |
| 5-Person Households | 156 (9.3%) | 0 (0.0%) |
| 6-Person Households | 86 (5.1%) | 0 (0.0%) |
| 7+ Person Households | 114 (6.8%) | 3 (0.2%) |
| Total | 1,170 (69.9%) | 505 (30.1%) |
Female Fertility in Dewey County
Fertility by Age in Dewey County
Average fertility rate in Dewey County is 78.0 births per 1,000 women. Women in the age bracket of 20 to 34 years have the highest fertility rate with 153.0 births per 1,000 women. Women in the age bracket of 20 to 34 years acount for 83.5% of all women with births.
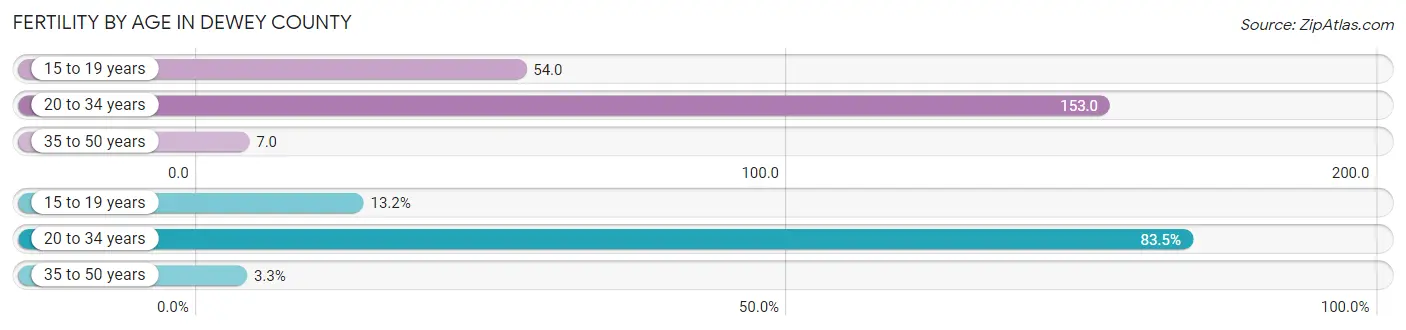
| Age Bracket | Women with Births | Births / 1,000 Women |
| 15 to 19 years | 12 (13.2%) | 54.0 |
| 20 to 34 years | 76 (83.5%) | 153.0 |
| 35 to 50 years | 3 (3.3%) | 7.0 |
| Total | 91 (100.0%) | 78.0 |
Fertility by Age by Marriage Status in Dewey County
56.0% of women with births (91) in Dewey County are married. The highest percentage of unmarried women with births falls into 15 to 19 years age bracket with 100.0% of them unmarried at the time of birth, while the lowest percentage of unmarried women with births belong to 35 to 50 years age bracket with 0.0% of them unmarried.
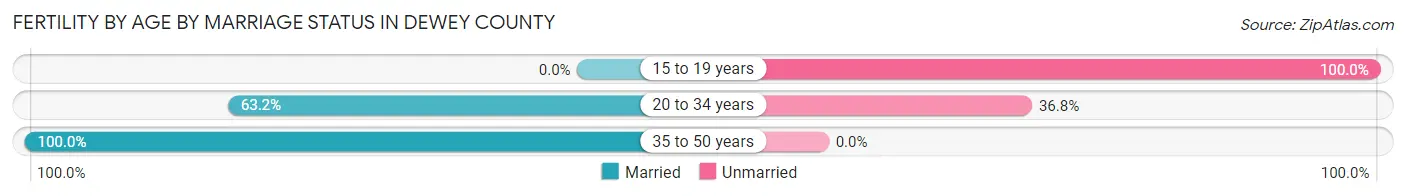
| Age Bracket | Married | Unmarried |
| 15 to 19 years | 0 (0.0%) | 12 (100.0%) |
| 20 to 34 years | 48 (63.2%) | 28 (36.8%) |
| 35 to 50 years | 3 (100.0%) | 0 (0.0%) |
| Total | 51 (56.0%) | 40 (44.0%) |
Fertility by Education in Dewey County
Average fertility rate in Dewey County is 78.0 births per 1,000 women. Women with the education attainment of high school diploma have the highest fertility rate of 136.0 births per 1,000 women, while women with the education attainment of college or associate's degree have the lowest fertility at 25.0 births per 1,000 women. Women with the education attainment of high school diploma represent 56.0% of all women with births.
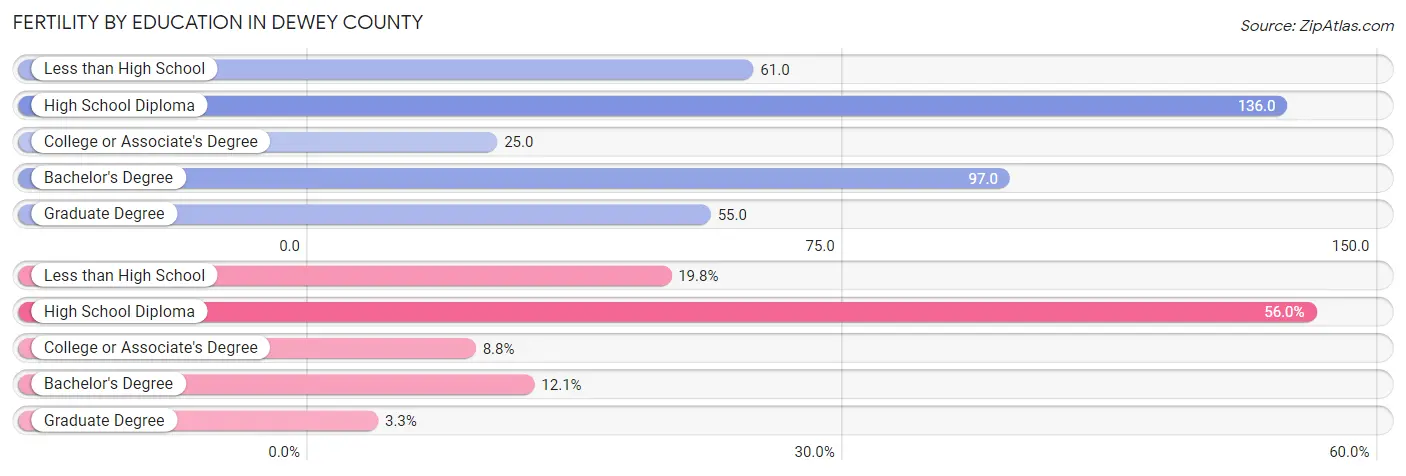
| Educational Attainment | Women with Births | Births / 1,000 Women |
| Less than High School | 18 (19.8%) | 61.0 |
| High School Diploma | 51 (56.0%) | 136.0 |
| College or Associate's Degree | 8 (8.8%) | 25.0 |
| Bachelor's Degree | 11 (12.1%) | 97.0 |
| Graduate Degree | 3 (3.3%) | 55.0 |
| Total | 91 (100.0%) | 78.0 |
Fertility by Education by Marriage Status in Dewey County
44.0% of women with births in Dewey County are unmarried. Women with the educational attainment of bachelor's degree are most likely to be married with 100.0% of them married at childbirth, while women with the educational attainment of college or associate's degree are least likely to be married with 62.5% of them unmarried at childbirth.
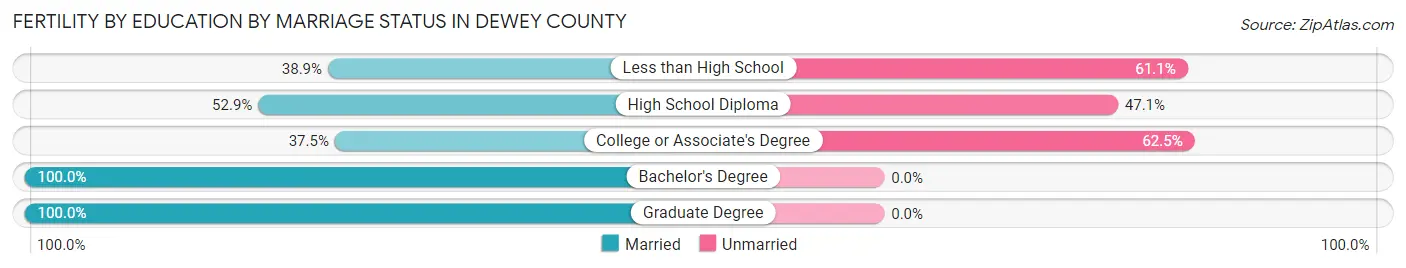
| Educational Attainment | Married | Unmarried |
| Less than High School | 7 (38.9%) | 11 (61.1%) |
| High School Diploma | 27 (52.9%) | 24 (47.1%) |
| College or Associate's Degree | 3 (37.5%) | 5 (62.5%) |
| Bachelor's Degree | 11 (100.0%) | 0 (0.0%) |
| Graduate Degree | 3 (100.0%) | 0 (0.0%) |
| Total | 51 (56.0%) | 40 (44.0%) |
Employment Characteristics in Dewey County
Employment by Class of Employer in Dewey County
Among the 1,927 employed individuals in Dewey County, local government employees (877 | 45.5%), private company employees (404 | 21.0%), and self-employed (not incorporated) (241 | 12.5%) make up the most common classes of employment.
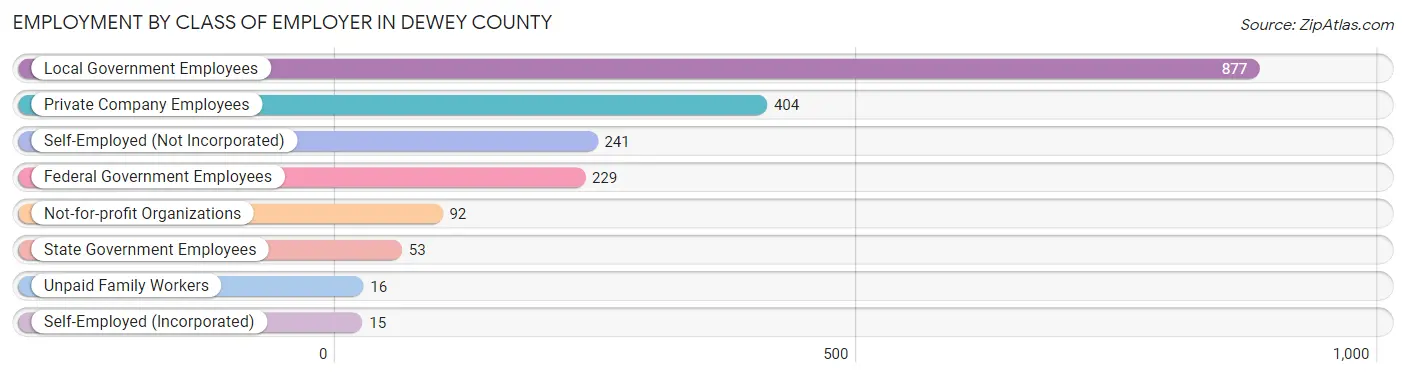
| Employer Class | # Employees | % Employees |
| Private Company Employees | 404 | 21.0% |
| Self-Employed (Incorporated) | 15 | 0.8% |
| Self-Employed (Not Incorporated) | 241 | 12.5% |
| Not-for-profit Organizations | 92 | 4.8% |
| Local Government Employees | 877 | 45.5% |
| State Government Employees | 53 | 2.8% |
| Federal Government Employees | 229 | 11.9% |
| Unpaid Family Workers | 16 | 0.8% |
| Total | 1,927 | 100.0% |
Employment Status by Age in Dewey County
According to the labor force statistics for Dewey County, out of the total population over 16 years of age (3,454), 67.0% or 2,314 individuals are in the labor force, with 14.6% or 338 of them unemployed. The age group with the highest labor force participation rate is 30 to 34 years, with 92.9% or 274 individuals in the labor force. Within the labor force, the 20 to 24 years age range has the highest percentage of unemployed individuals, with 37.7% or 92 of them being unemployed.
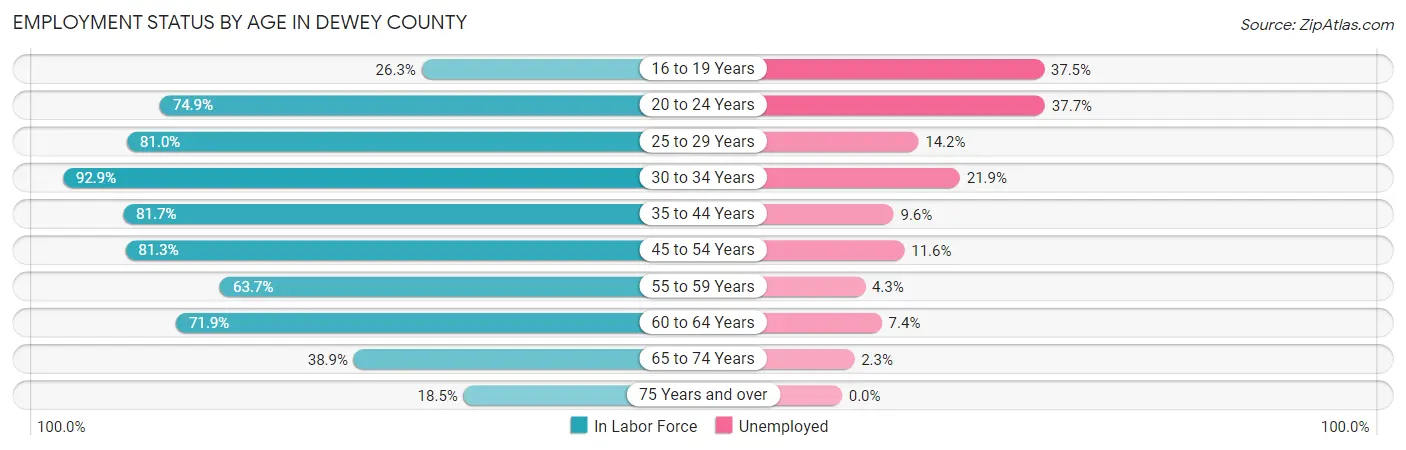
| Age Bracket | In Labor Force | Unemployed |
| 16 to 19 Years | 88 (26.3%) | 33 (37.5%) |
| 20 to 24 Years | 245 (74.9%) | 92 (37.7%) |
| 25 to 29 Years | 265 (81.0%) | 38 (14.2%) |
| 30 to 34 Years | 274 (92.9%) | 60 (21.9%) |
| 35 to 44 Years | 509 (81.7%) | 49 (9.6%) |
| 45 to 54 Years | 379 (81.3%) | 44 (11.6%) |
| 55 to 59 Years | 163 (63.7%) | 7 (4.3%) |
| 60 to 64 Years | 230 (71.9%) | 17 (7.4%) |
| 65 to 74 Years | 129 (38.9%) | 3 (2.3%) |
| 75 Years and over | 32 (18.5%) | 0 (0.0%) |
| Total | 2,314 (67.0%) | 338 (14.6%) |
Employment Status by Educational Attainment in Dewey County
According to labor force statistics for Dewey County, 79.6% of individuals (1,820) out of the total population between 25 and 64 years of age (2,287) are in the labor force, with 11.8% or 215 of them being unemployed. The group with the highest labor force participation rate are those with the educational attainment of bachelor's degree or higher, with 92.8% or 349 individuals in the labor force. Within the labor force, individuals with less than high school education have the highest percentage of unemployment, with 39.4% or 84 of them being unemployed.
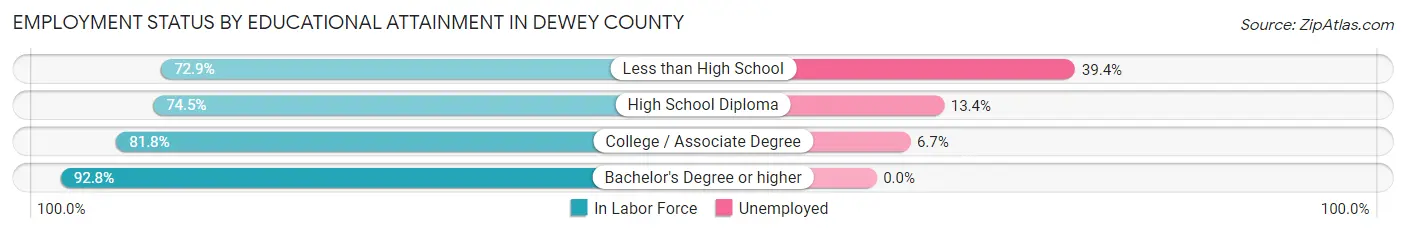
| Educational Attainment | In Labor Force | Unemployed |
| Less than High School | 213 (72.9%) | 115 (39.4%) |
| High School Diploma | 679 (74.5%) | 122 (13.4%) |
| College / Associate Degree | 579 (81.8%) | 47 (6.7%) |
| Bachelor's Degree or higher | 349 (92.8%) | 0 (0.0%) |
| Total | 1,820 (79.6%) | 270 (11.8%) |
Employment Occupations by Sex in Dewey County
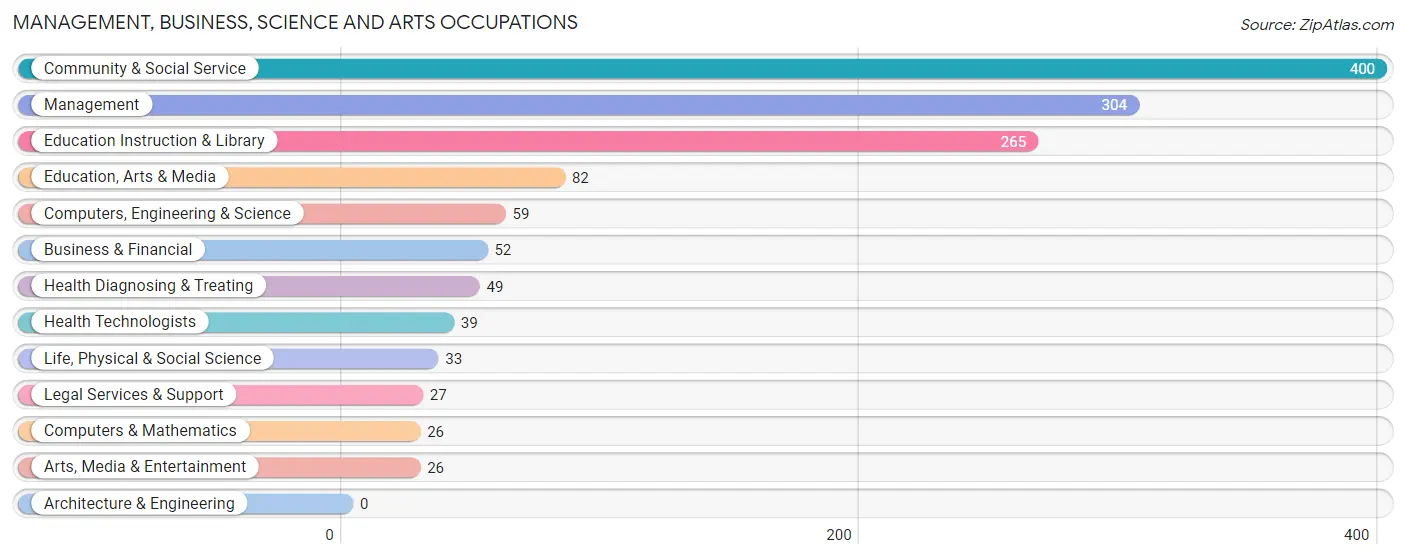
Management, Business, Science and Arts Occupations
The most common Management, Business, Science and Arts occupations in Dewey County are Community & Social Service (400 | 20.5%), Management (304 | 15.6%), Education Instruction & Library (265 | 13.6%), Education, Arts & Media (82 | 4.2%), and Computers, Engineering & Science (59 | 3.0%).
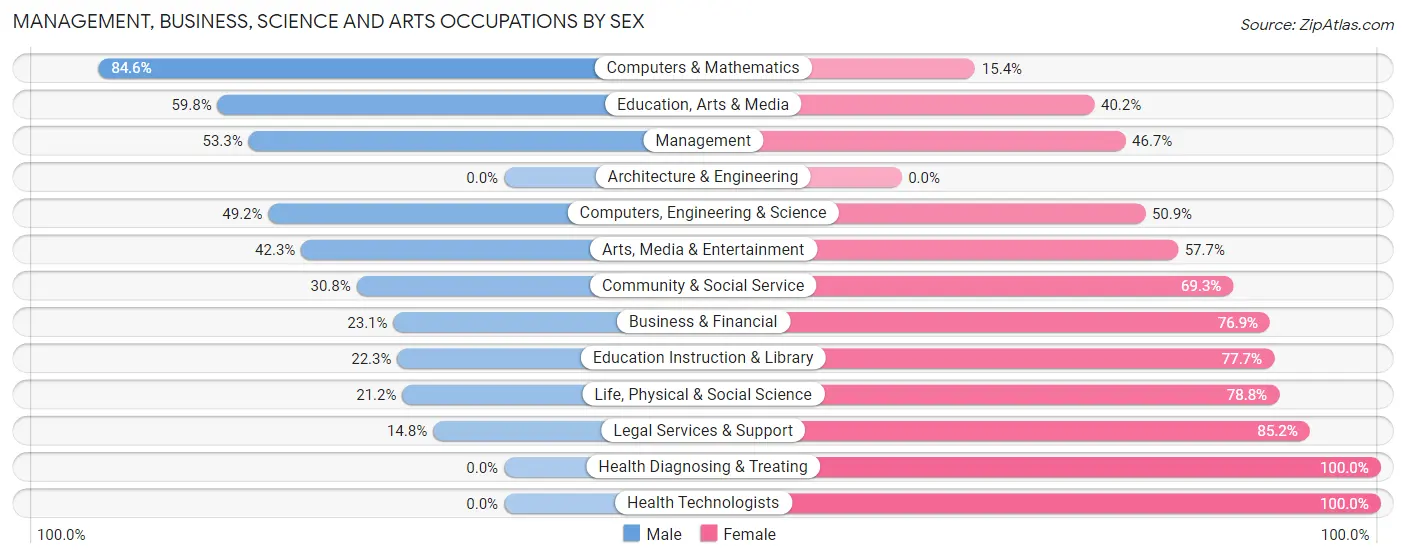
Management, Business, Science and Arts Occupations by Sex
Within the Management, Business, Science and Arts occupations in Dewey County, the most male-oriented occupations are Computers & Mathematics (84.6%), Education, Arts & Media (59.8%), and Management (53.3%), while the most female-oriented occupations are Health Diagnosing & Treating (100.0%), Health Technologists (100.0%), and Legal Services & Support (85.2%).
| Occupation | Male | Female |
| Management | 162 (53.3%) | 142 (46.7%) |
| Business & Financial | 12 (23.1%) | 40 (76.9%) |
| Computers, Engineering & Science | 29 (49.1%) | 30 (50.8%) |
| Computers & Mathematics | 22 (84.6%) | 4 (15.4%) |
| Architecture & Engineering | 0 (0.0%) | 0 (0.0%) |
| Life, Physical & Social Science | 7 (21.2%) | 26 (78.8%) |
| Community & Social Service | 123 (30.7%) | 277 (69.3%) |
| Education, Arts & Media | 49 (59.8%) | 33 (40.2%) |
| Legal Services & Support | 4 (14.8%) | 23 (85.2%) |
| Education Instruction & Library | 59 (22.3%) | 206 (77.7%) |
| Arts, Media & Entertainment | 11 (42.3%) | 15 (57.7%) |
| Health Diagnosing & Treating | 0 (0.0%) | 49 (100.0%) |
| Health Technologists | 0 (0.0%) | 39 (100.0%) |
| Total (Category) | 326 (37.7%) | 538 (62.3%) |
| Total (Overall) | 951 (48.7%) | 1,002 (51.3%) |
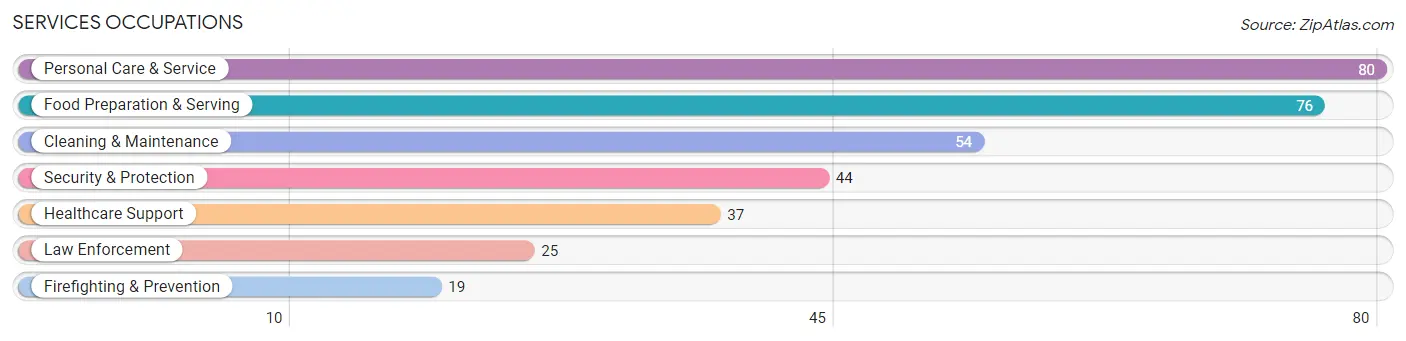
Services Occupations
The most common Services occupations in Dewey County are Personal Care & Service (80 | 4.1%), Food Preparation & Serving (76 | 3.9%), Cleaning & Maintenance (54 | 2.8%), Security & Protection (44 | 2.2%), and Healthcare Support (37 | 1.9%).
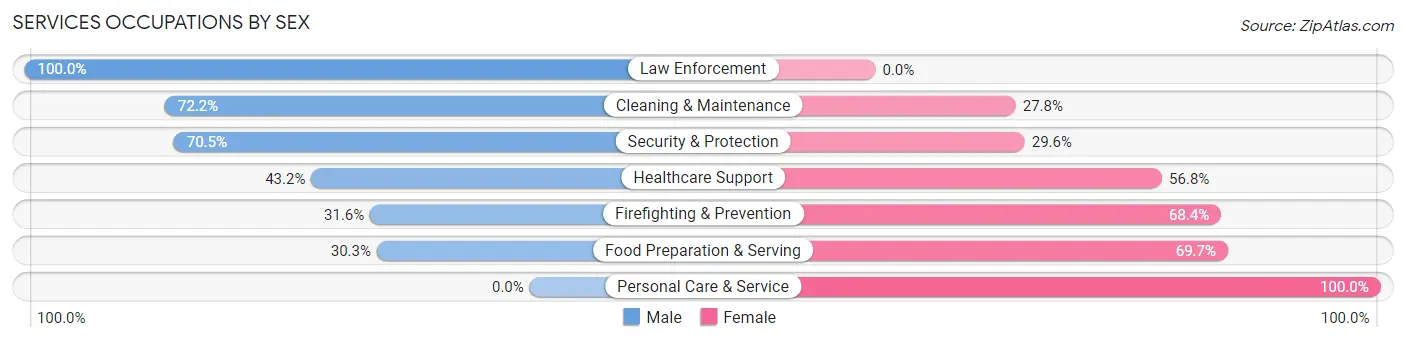
Services Occupations by Sex
Within the Services occupations in Dewey County, the most male-oriented occupations are Law Enforcement (100.0%), Cleaning & Maintenance (72.2%), and Security & Protection (70.5%), while the most female-oriented occupations are Personal Care & Service (100.0%), Food Preparation & Serving (69.7%), and Firefighting & Prevention (68.4%).
| Occupation | Male | Female |
| Healthcare Support | 16 (43.2%) | 21 (56.8%) |
| Security & Protection | 31 (70.5%) | 13 (29.5%) |
| Firefighting & Prevention | 6 (31.6%) | 13 (68.4%) |
| Law Enforcement | 25 (100.0%) | 0 (0.0%) |
| Food Preparation & Serving | 23 (30.3%) | 53 (69.7%) |
| Cleaning & Maintenance | 39 (72.2%) | 15 (27.8%) |
| Personal Care & Service | 0 (0.0%) | 80 (100.0%) |
| Total (Category) | 109 (37.5%) | 182 (62.5%) |
| Total (Overall) | 951 (48.7%) | 1,002 (51.3%) |
Sales and Office Occupations
The most common Sales and Office occupations in Dewey County are Office & Administration (233 | 11.9%), and Sales & Related (98 | 5.0%).
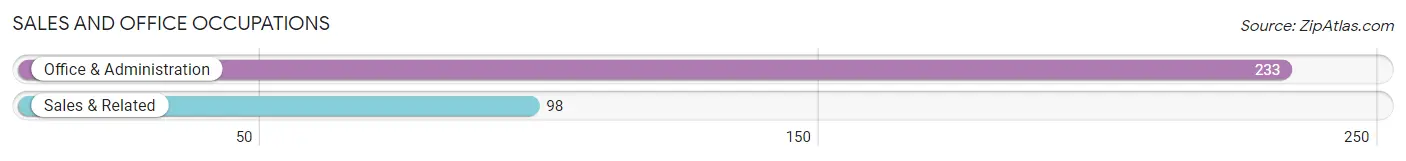
Sales and Office Occupations by Sex

| Occupation | Male | Female |
| Sales & Related | 42 (42.9%) | 56 (57.1%) |
| Office & Administration | 39 (16.7%) | 194 (83.3%) |
| Total (Category) | 81 (24.5%) | 250 (75.5%) |
| Total (Overall) | 951 (48.7%) | 1,002 (51.3%) |
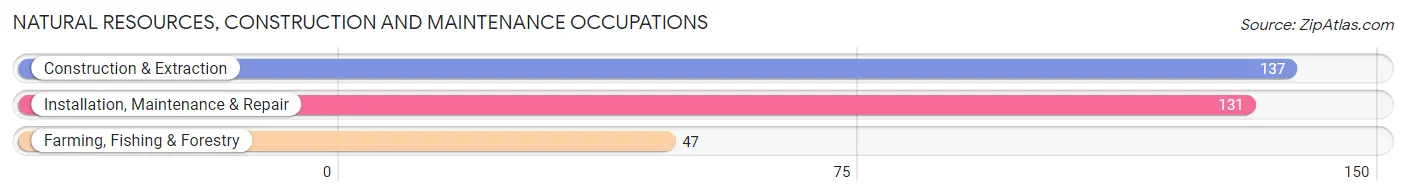
Natural Resources, Construction and Maintenance Occupations
The most common Natural Resources, Construction and Maintenance occupations in Dewey County are Construction & Extraction (137 | 7.0%), Installation, Maintenance & Repair (131 | 6.7%), and Farming, Fishing & Forestry (47 | 2.4%).
Natural Resources, Construction and Maintenance Occupations by Sex
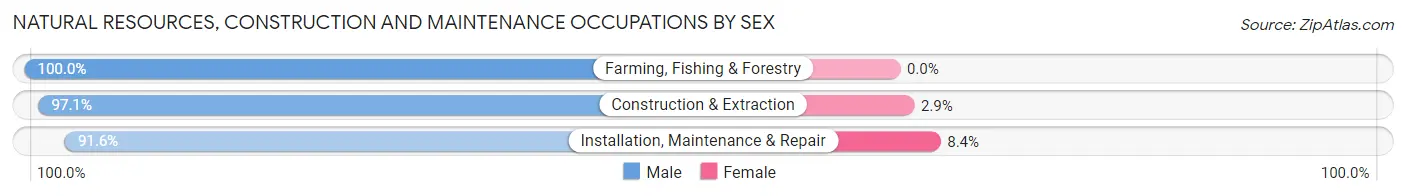
| Occupation | Male | Female |
| Farming, Fishing & Forestry | 47 (100.0%) | 0 (0.0%) |
| Construction & Extraction | 133 (97.1%) | 4 (2.9%) |
| Installation, Maintenance & Repair | 120 (91.6%) | 11 (8.4%) |
| Total (Category) | 300 (95.2%) | 15 (4.8%) |
| Total (Overall) | 951 (48.7%) | 1,002 (51.3%) |
Production, Transportation and Moving Occupations
The most common Production, Transportation and Moving occupations in Dewey County are Transportation (97 | 5.0%), Production (36 | 1.8%), and Material Moving (19 | 1.0%).
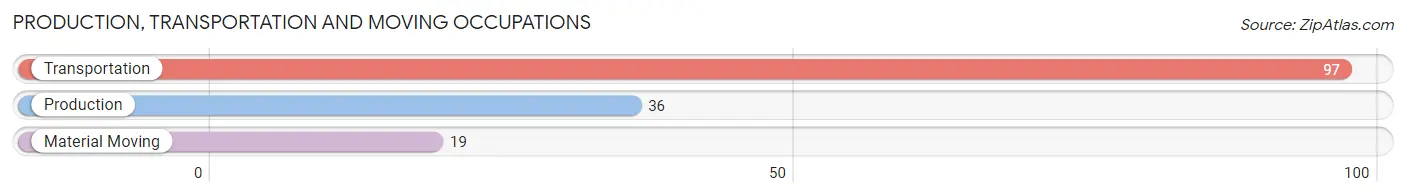
Production, Transportation and Moving Occupations by Sex
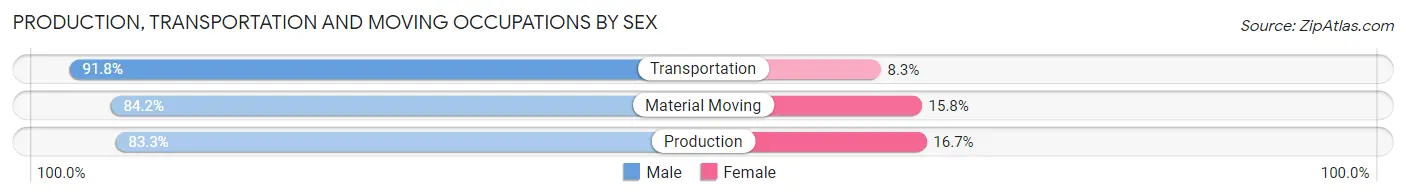
| Occupation | Male | Female |
| Production | 30 (83.3%) | 6 (16.7%) |
| Transportation | 89 (91.7%) | 8 (8.3%) |
| Material Moving | 16 (84.2%) | 3 (15.8%) |
| Total (Category) | 135 (88.8%) | 17 (11.2%) |
| Total (Overall) | 951 (48.7%) | 1,002 (51.3%) |
Employment Industries by Sex in Dewey County
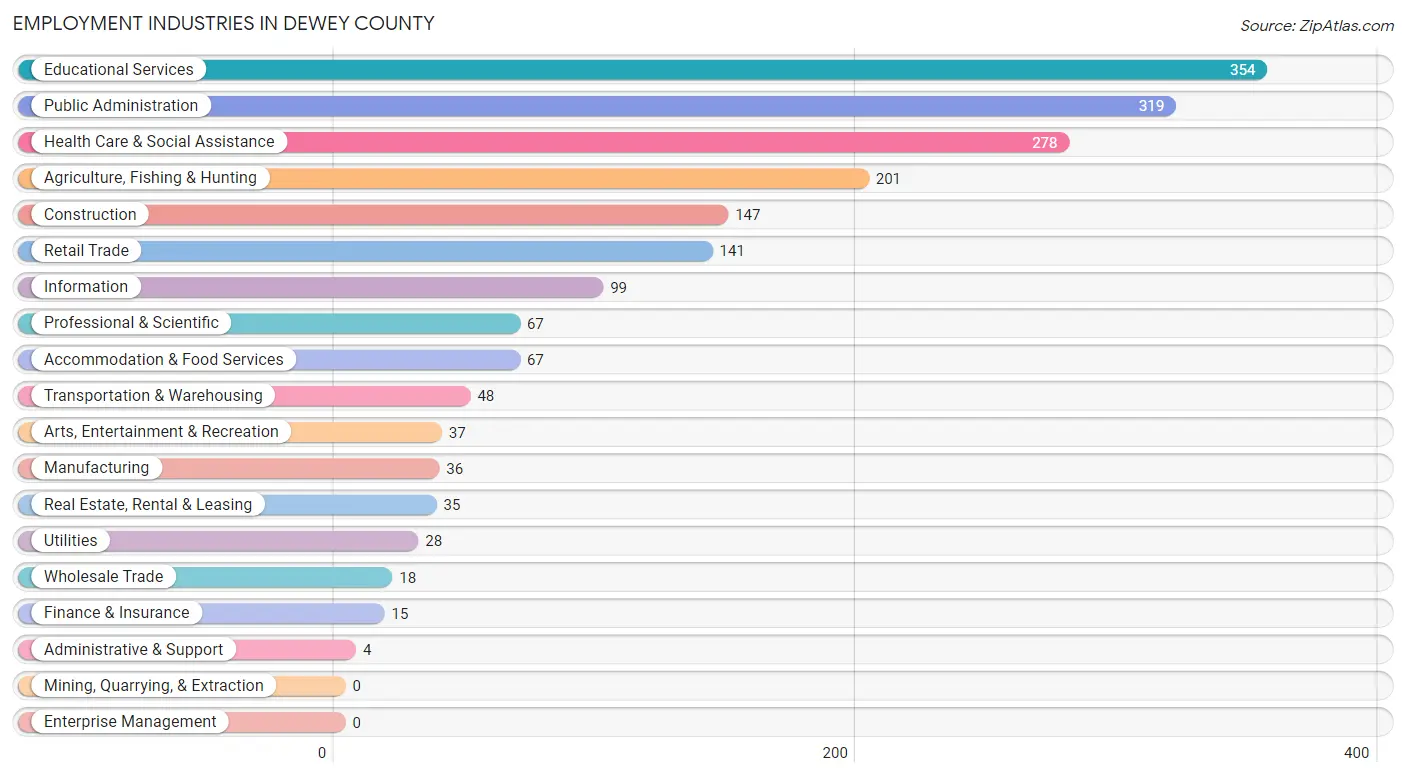
Employment Industries in Dewey County
The major employment industries in Dewey County include Educational Services (354 | 18.1%), Public Administration (319 | 16.3%), Health Care & Social Assistance (278 | 14.2%), Agriculture, Fishing & Hunting (201 | 10.3%), and Construction (147 | 7.5%).
Employment Industries by Sex in Dewey County
The Dewey County industries that see more men than women are Wholesale Trade (100.0%), Administrative & Support (100.0%), and Transportation & Warehousing (97.9%), whereas the industries that tend to have a higher number of women are Professional & Scientific (94.0%), Health Care & Social Assistance (77.0%), and Educational Services (74.3%).
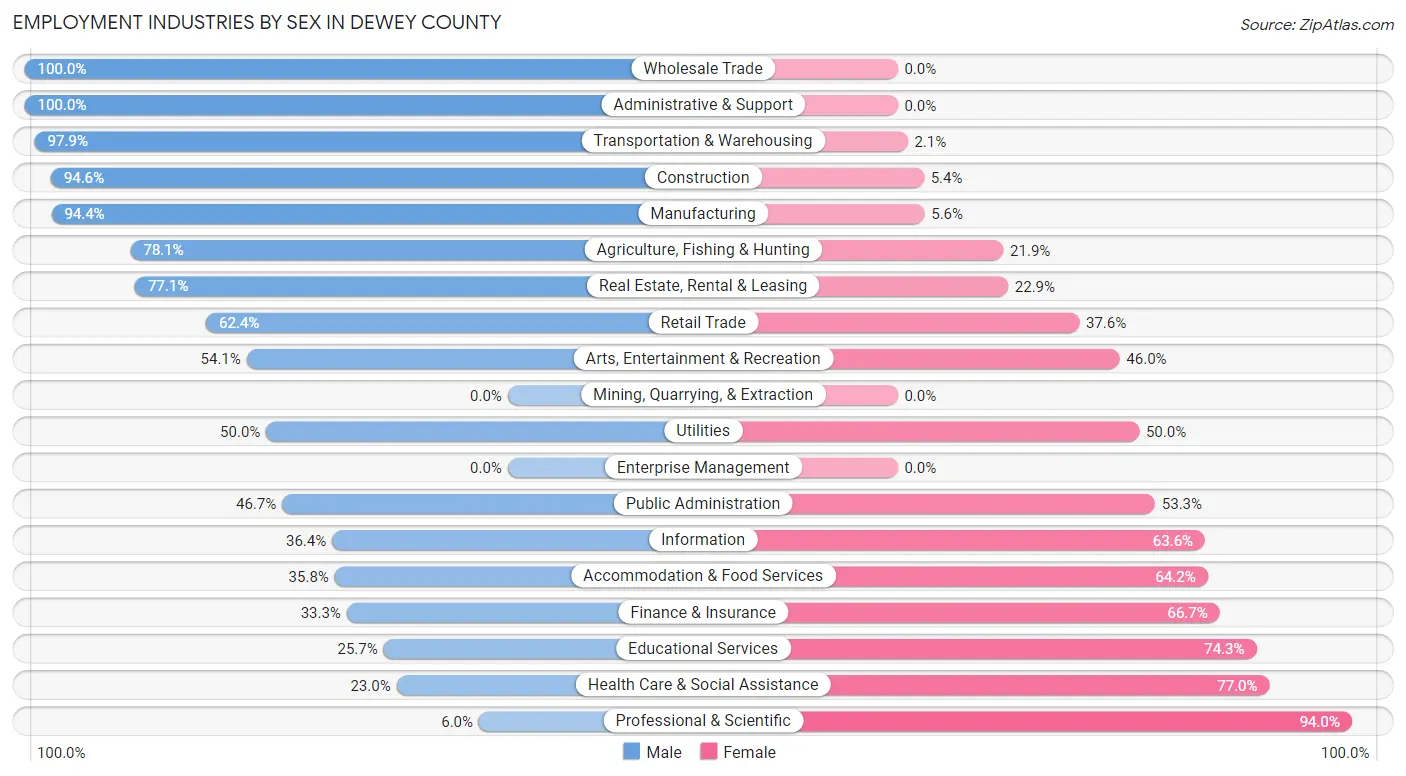
| Industry | Male | Female |
| Agriculture, Fishing & Hunting | 157 (78.1%) | 44 (21.9%) |
| Mining, Quarrying, & Extraction | 0 (0.0%) | 0 (0.0%) |
| Construction | 139 (94.6%) | 8 (5.4%) |
| Manufacturing | 34 (94.4%) | 2 (5.6%) |
| Wholesale Trade | 18 (100.0%) | 0 (0.0%) |
| Retail Trade | 88 (62.4%) | 53 (37.6%) |
| Transportation & Warehousing | 47 (97.9%) | 1 (2.1%) |
| Utilities | 14 (50.0%) | 14 (50.0%) |
| Information | 36 (36.4%) | 63 (63.6%) |
| Finance & Insurance | 5 (33.3%) | 10 (66.7%) |
| Real Estate, Rental & Leasing | 27 (77.1%) | 8 (22.9%) |
| Professional & Scientific | 4 (6.0%) | 63 (94.0%) |
| Enterprise Management | 0 (0.0%) | 0 (0.0%) |
| Administrative & Support | 4 (100.0%) | 0 (0.0%) |
| Educational Services | 91 (25.7%) | 263 (74.3%) |
| Health Care & Social Assistance | 64 (23.0%) | 214 (77.0%) |
| Arts, Entertainment & Recreation | 20 (54.0%) | 17 (46.0%) |
| Accommodation & Food Services | 24 (35.8%) | 43 (64.2%) |
| Public Administration | 149 (46.7%) | 170 (53.3%) |
| Total | 951 (48.7%) | 1,002 (51.3%) |
Education in Dewey County
School Enrollment in Dewey County
The most common levels of schooling among the 1,677 students in Dewey County are elementary school (509 | 30.3%), high school (404 | 24.1%), and middle school (382 | 22.8%).
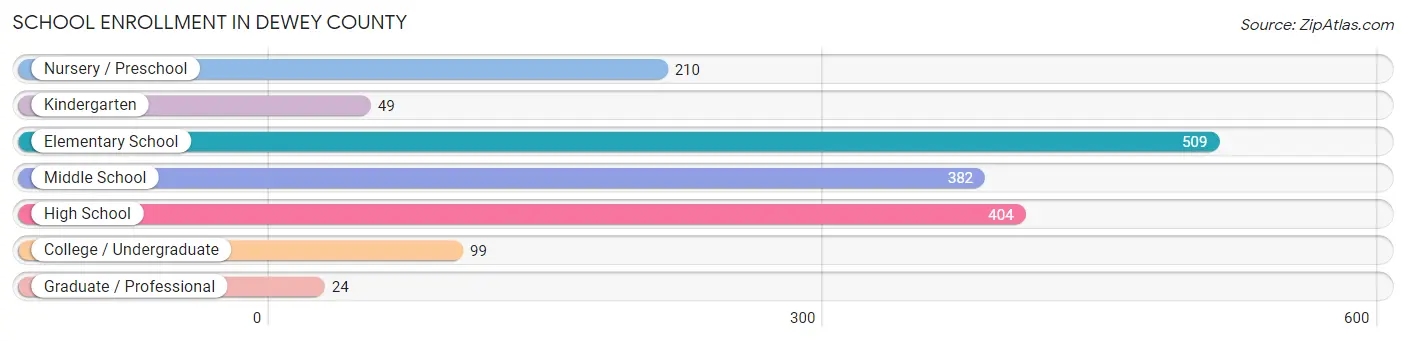
| School Level | # Students | % Students |
| Nursery / Preschool | 210 | 12.5% |
| Kindergarten | 49 | 2.9% |
| Elementary School | 509 | 30.3% |
| Middle School | 382 | 22.8% |
| High School | 404 | 24.1% |
| College / Undergraduate | 99 | 5.9% |
| Graduate / Professional | 24 | 1.4% |
| Total | 1,677 | 100.0% |
School Enrollment by Age by Funding Source in Dewey County
Out of a total of 1,677 students who are enrolled in schools in Dewey County, 49 (2.9%) attend a private institution, while the remaining 1,628 (97.1%) are enrolled in public schools. The age group of 35 years and over has the highest likelihood of being enrolled in private schools, with 21 (47.7% in the age bracket) enrolled. Conversely, the age group of 3 to 4 year olds has the lowest likelihood of being enrolled in a private school, with 165 (100.0% in the age bracket) attending a public institution.
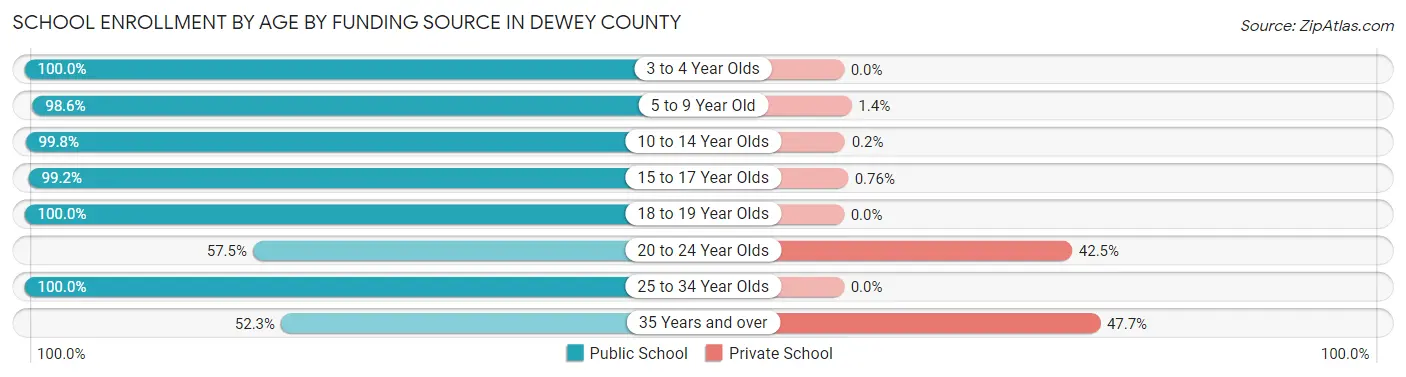
| Age Bracket | Public School | Private School |
| 3 to 4 Year Olds | 165 (100.0%) | 0 (0.0%) |
| 5 to 9 Year Old | 548 (98.6%) | 8 (1.4%) |
| 10 to 14 Year Olds | 491 (99.8%) | 1 (0.2%) |
| 15 to 17 Year Olds | 260 (99.2%) | 2 (0.8%) |
| 18 to 19 Year Olds | 95 (100.0%) | 0 (0.0%) |
| 20 to 24 Year Olds | 23 (57.5%) | 17 (42.5%) |
| 25 to 34 Year Olds | 23 (100.0%) | 0 (0.0%) |
| 35 Years and over | 23 (52.3%) | 21 (47.7%) |
| Total | 1,628 (97.1%) | 49 (2.9%) |
Educational Attainment by Field of Study in Dewey County
Education (245 | 43.9%), social sciences (68 | 12.2%), business (60 | 10.7%), arts & humanities (45 | 8.1%), and science & technology (39 | 7.0%) are the most common fields of study among 558 individuals in Dewey County who have obtained a bachelor's degree or higher.
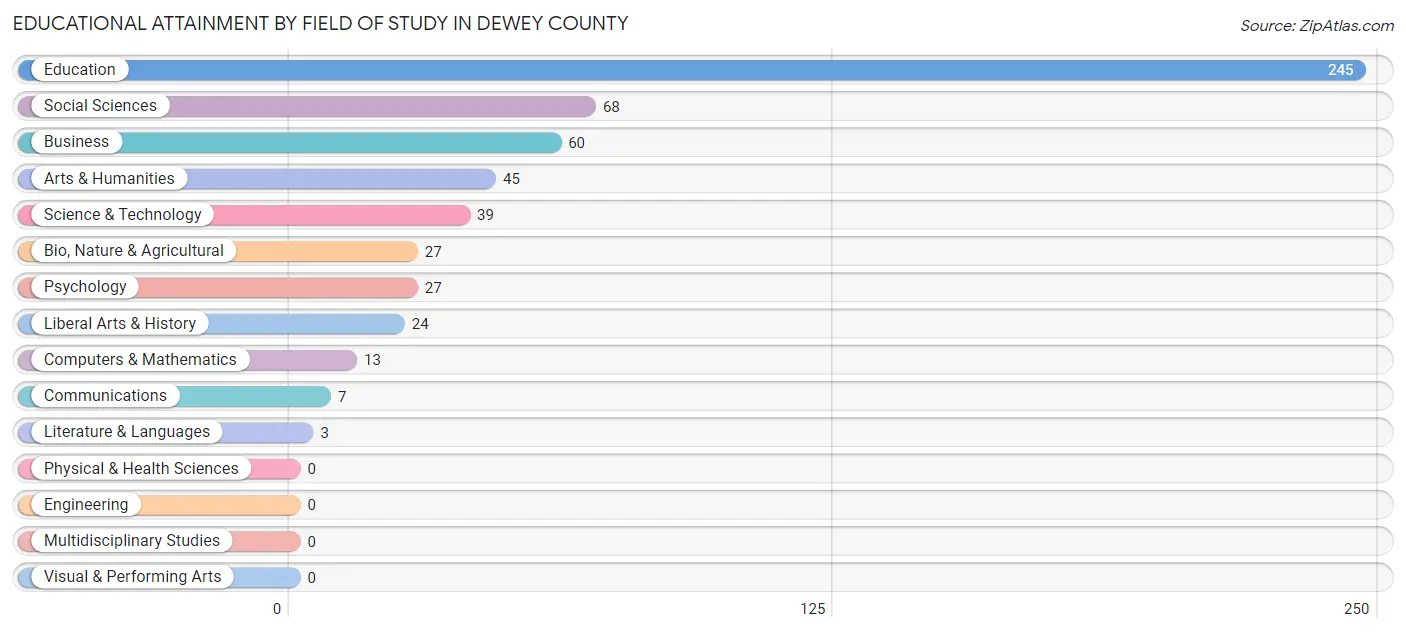
| Field of Study | # Graduates | % Graduates |
| Computers & Mathematics | 13 | 2.3% |
| Bio, Nature & Agricultural | 27 | 4.8% |
| Physical & Health Sciences | 0 | 0.0% |
| Psychology | 27 | 4.8% |
| Social Sciences | 68 | 12.2% |
| Engineering | 0 | 0.0% |
| Multidisciplinary Studies | 0 | 0.0% |
| Science & Technology | 39 | 7.0% |
| Business | 60 | 10.7% |
| Education | 245 | 43.9% |
| Literature & Languages | 3 | 0.5% |
| Liberal Arts & History | 24 | 4.3% |
| Visual & Performing Arts | 0 | 0.0% |
| Communications | 7 | 1.3% |
| Arts & Humanities | 45 | 8.1% |
| Total | 558 | 100.0% |
Transportation & Commute in Dewey County
Vehicle Availability by Sex in Dewey County
The most prevalent vehicle ownership categories in Dewey County are males with 2 vehicles (275, accounting for 30.0%) and females with 2 vehicles (278, making up 27.4%).
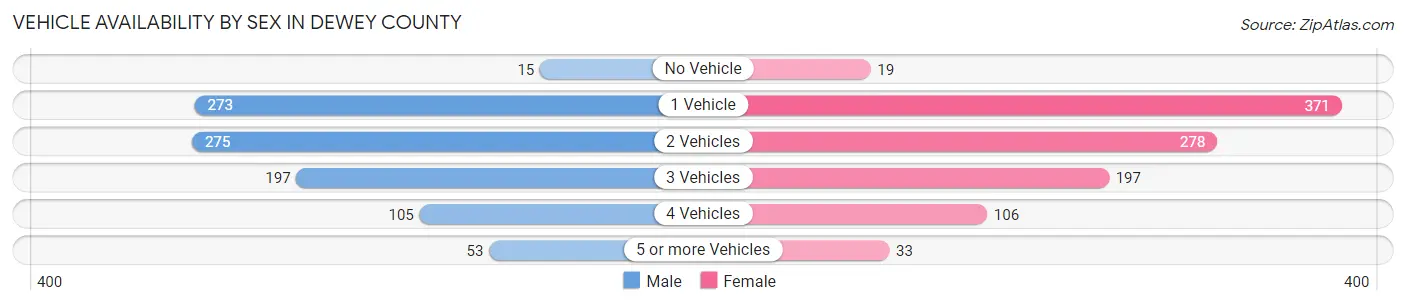
| Vehicles Available | Male | Female |
| No Vehicle | 15 (1.6%) | 19 (1.9%) |
| 1 Vehicle | 273 (29.7%) | 371 (36.9%) |
| 2 Vehicles | 275 (30.0%) | 278 (27.7%) |
| 3 Vehicles | 197 (21.5%) | 197 (19.6%) |
| 4 Vehicles | 105 (11.4%) | 106 (10.6%) |
| 5 or more Vehicles | 53 (5.8%) | 33 (3.3%) |
| Total | 918 (100.0%) | 1,004 (100.0%) |
Commute Time in Dewey County
The most frequently occuring commute durations in Dewey County are 10 to 14 minutes (803 commuters, 47.1%), 5 to 9 minutes (181 commuters, 10.6%), and 20 to 24 minutes (156 commuters, 9.1%).
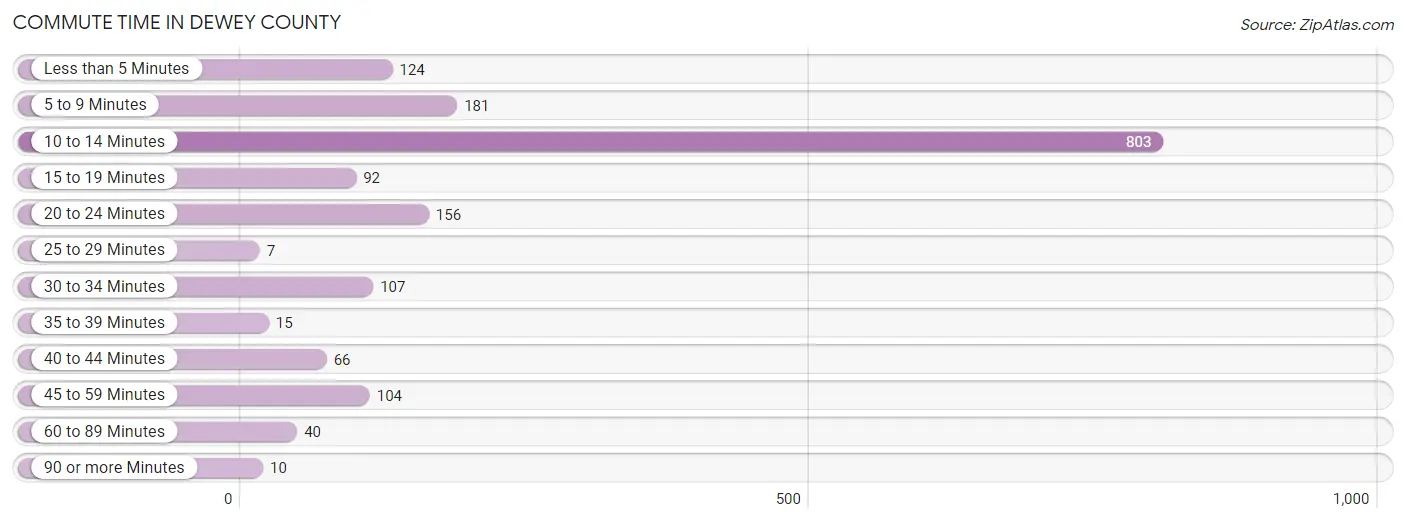
| Commute Time | # Commuters | % Commuters |
| Less than 5 Minutes | 124 | 7.3% |
| 5 to 9 Minutes | 181 | 10.6% |
| 10 to 14 Minutes | 803 | 47.1% |
| 15 to 19 Minutes | 92 | 5.4% |
| 20 to 24 Minutes | 156 | 9.1% |
| 25 to 29 Minutes | 7 | 0.4% |
| 30 to 34 Minutes | 107 | 6.3% |
| 35 to 39 Minutes | 15 | 0.9% |
| 40 to 44 Minutes | 66 | 3.9% |
| 45 to 59 Minutes | 104 | 6.1% |
| 60 to 89 Minutes | 40 | 2.4% |
| 90 or more Minutes | 10 | 0.6% |
Commute Time by Sex in Dewey County
The most common commute times in Dewey County are 10 to 14 minutes (356 commuters, 45.1%) for males and 10 to 14 minutes (447 commuters, 48.8%) for females.
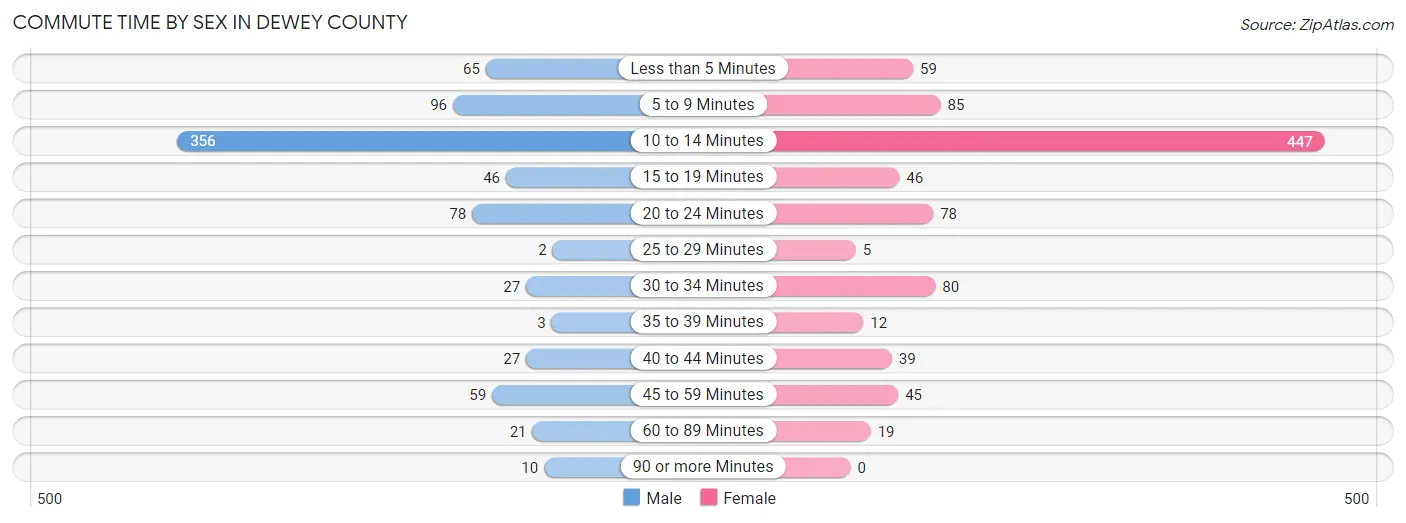
| Commute Time | Male | Female |
| Less than 5 Minutes | 65 (8.2%) | 59 (6.5%) |
| 5 to 9 Minutes | 96 (12.1%) | 85 (9.3%) |
| 10 to 14 Minutes | 356 (45.1%) | 447 (48.8%) |
| 15 to 19 Minutes | 46 (5.8%) | 46 (5.0%) |
| 20 to 24 Minutes | 78 (9.9%) | 78 (8.5%) |
| 25 to 29 Minutes | 2 (0.3%) | 5 (0.5%) |
| 30 to 34 Minutes | 27 (3.4%) | 80 (8.7%) |
| 35 to 39 Minutes | 3 (0.4%) | 12 (1.3%) |
| 40 to 44 Minutes | 27 (3.4%) | 39 (4.3%) |
| 45 to 59 Minutes | 59 (7.5%) | 45 (4.9%) |
| 60 to 89 Minutes | 21 (2.7%) | 19 (2.1%) |
| 90 or more Minutes | 10 (1.3%) | 0 (0.0%) |
Time of Departure to Work by Sex in Dewey County
The most frequent times of departure to work in Dewey County are 7:30 AM to 7:59 AM (296, 37.5%) for males and 7:30 AM to 7:59 AM (462, 50.5%) for females.
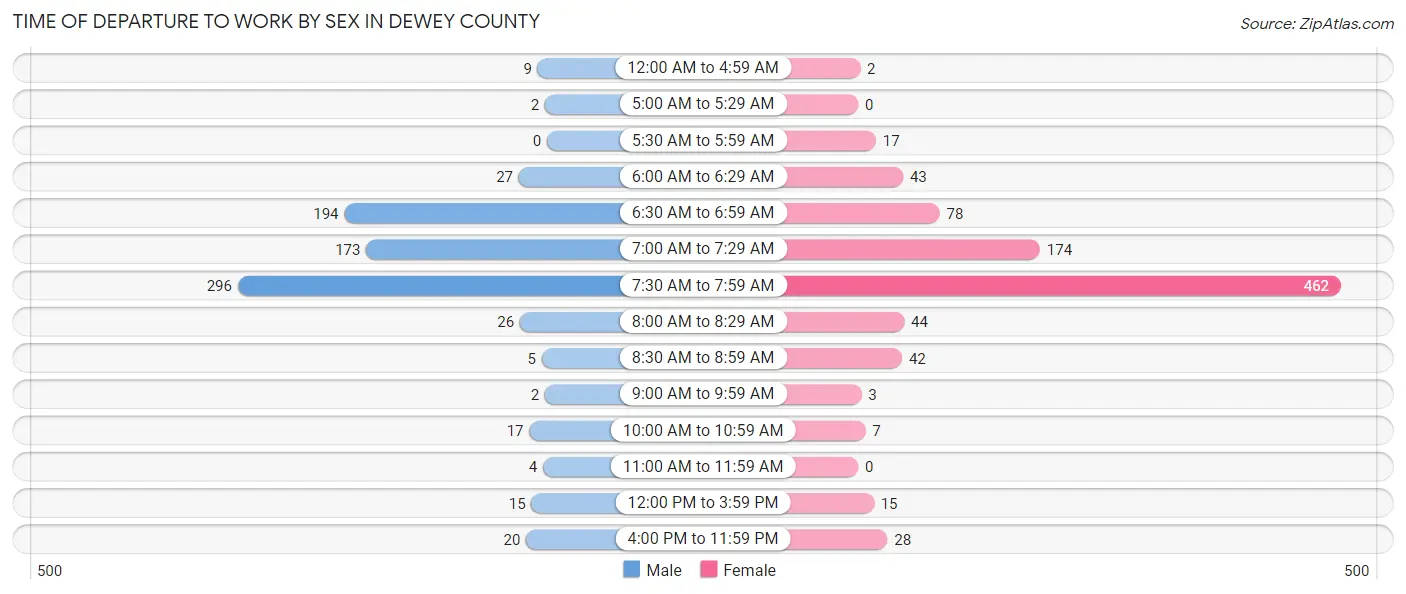
| Time of Departure | Male | Female |
| 12:00 AM to 4:59 AM | 9 (1.1%) | 2 (0.2%) |
| 5:00 AM to 5:29 AM | 2 (0.3%) | 0 (0.0%) |
| 5:30 AM to 5:59 AM | 0 (0.0%) | 17 (1.9%) |
| 6:00 AM to 6:29 AM | 27 (3.4%) | 43 (4.7%) |
| 6:30 AM to 6:59 AM | 194 (24.6%) | 78 (8.5%) |
| 7:00 AM to 7:29 AM | 173 (21.9%) | 174 (19.0%) |
| 7:30 AM to 7:59 AM | 296 (37.5%) | 462 (50.5%) |
| 8:00 AM to 8:29 AM | 26 (3.3%) | 44 (4.8%) |
| 8:30 AM to 8:59 AM | 5 (0.6%) | 42 (4.6%) |
| 9:00 AM to 9:59 AM | 2 (0.3%) | 3 (0.3%) |
| 10:00 AM to 10:59 AM | 17 (2.1%) | 7 (0.8%) |
| 11:00 AM to 11:59 AM | 4 (0.5%) | 0 (0.0%) |
| 12:00 PM to 3:59 PM | 15 (1.9%) | 15 (1.6%) |
| 4:00 PM to 11:59 PM | 20 (2.5%) | 28 (3.1%) |
| Total | 790 (100.0%) | 915 (100.0%) |
Housing Occupancy in Dewey County
Occupancy by Ownership in Dewey County
Of the total 1,675 dwellings in Dewey County, owner-occupied units account for 1,016 (60.7%), while renter-occupied units make up 659 (39.3%).
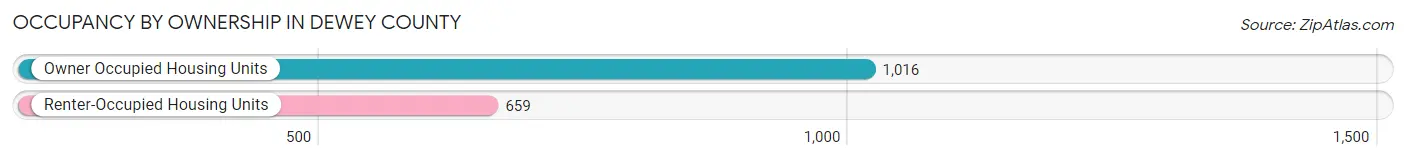
| Occupancy | # Housing Units | % Housing Units |
| Owner Occupied Housing Units | 1,016 | 60.7% |
| Renter-Occupied Housing Units | 659 | 39.3% |
| Total Occupied Housing Units | 1,675 | 100.0% |
Occupancy by Household Size in Dewey County
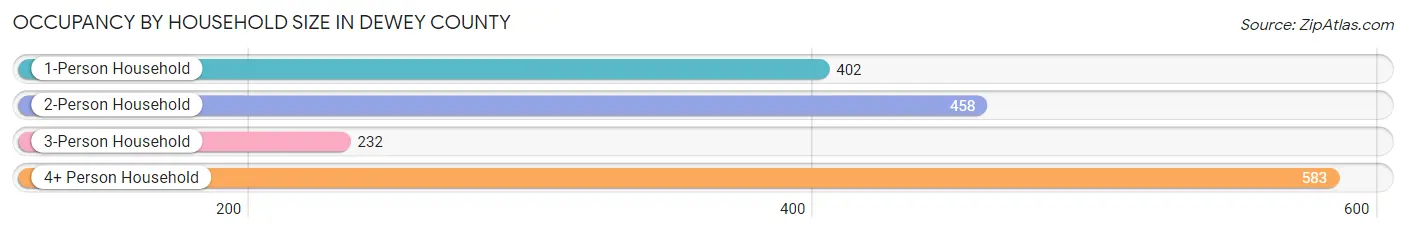
| Household Size | # Housing Units | % Housing Units |
| 1-Person Household | 402 | 24.0% |
| 2-Person Household | 458 | 27.3% |
| 3-Person Household | 232 | 13.9% |
| 4+ Person Household | 583 | 34.8% |
| Total Housing Units | 1,675 | 100.0% |
Occupancy by Ownership by Household Size in Dewey County
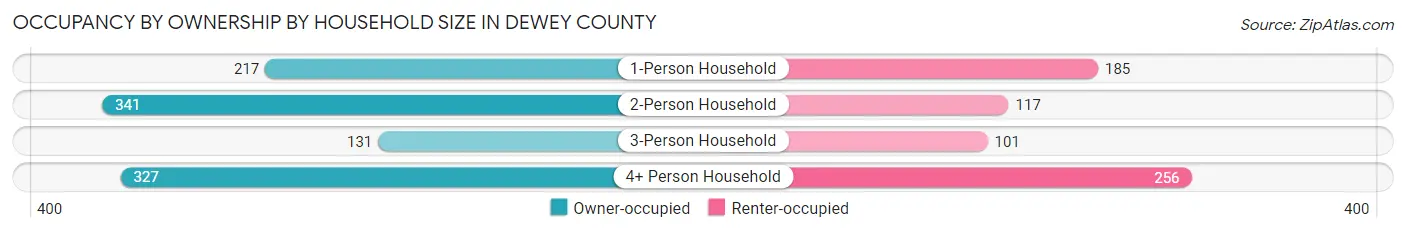
| Household Size | Owner-occupied | Renter-occupied |
| 1-Person Household | 217 (54.0%) | 185 (46.0%) |
| 2-Person Household | 341 (74.5%) | 117 (25.6%) |
| 3-Person Household | 131 (56.5%) | 101 (43.5%) |
| 4+ Person Household | 327 (56.1%) | 256 (43.9%) |
| Total Housing Units | 1,016 (60.7%) | 659 (39.3%) |
Occupancy by Educational Attainment in Dewey County
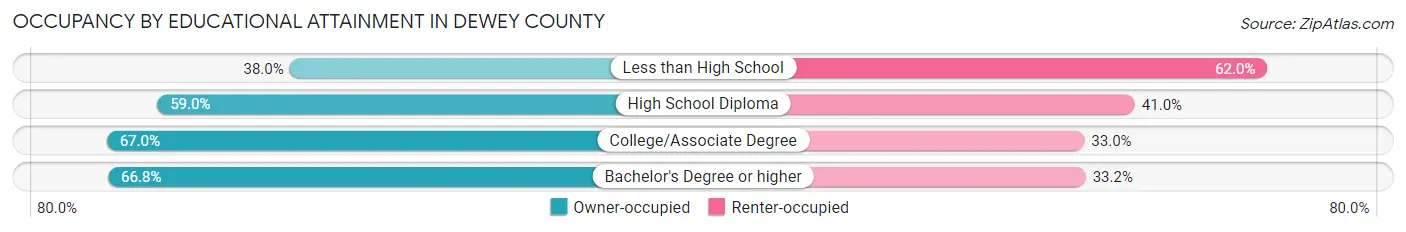
| Household Size | Owner-occupied | Renter-occupied |
| Less than High School | 79 (38.0%) | 129 (62.0%) |
| High School Diploma | 329 (59.0%) | 229 (41.0%) |
| College/Associate Degree | 369 (67.0%) | 182 (33.0%) |
| Bachelor's Degree or higher | 239 (66.8%) | 119 (33.2%) |
Occupancy by Age of Householder in Dewey County
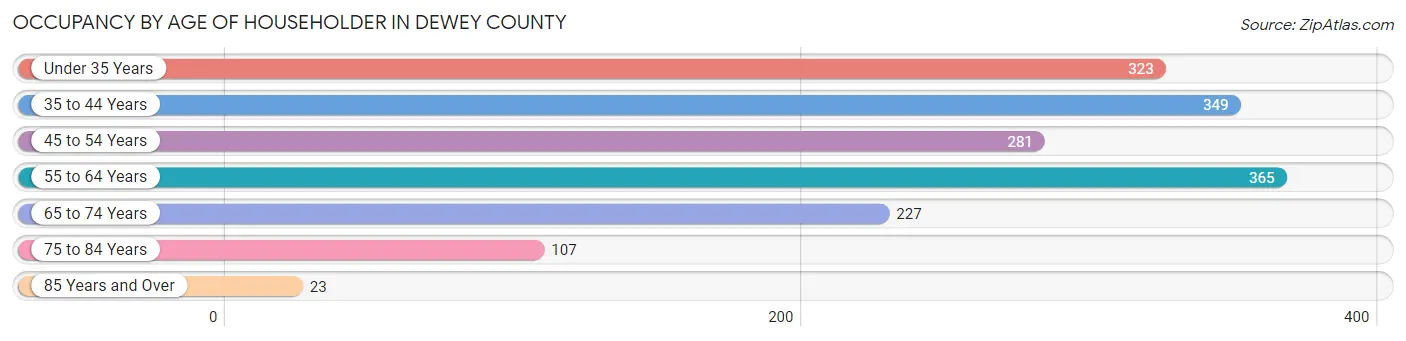
| Age Bracket | # Households | % Households |
| Under 35 Years | 323 | 19.3% |
| 35 to 44 Years | 349 | 20.8% |
| 45 to 54 Years | 281 | 16.8% |
| 55 to 64 Years | 365 | 21.8% |
| 65 to 74 Years | 227 | 13.6% |
| 75 to 84 Years | 107 | 6.4% |
| 85 Years and Over | 23 | 1.4% |
| Total | 1,675 | 100.0% |
Housing Finances in Dewey County
Median Income by Occupancy in Dewey County
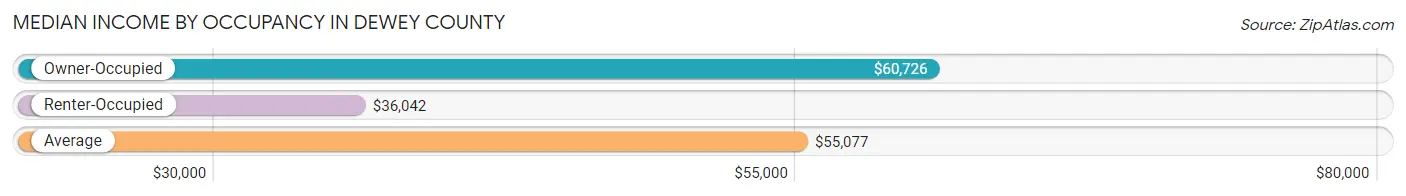
| Occupancy Type | # Households | Median Income |
| Owner-Occupied | 1,016 (60.7%) | $60,726 |
| Renter-Occupied | 659 (39.3%) | $36,042 |
| Average | 1,675 (100.0%) | $55,077 |
Occupancy by Householder Income Bracket in Dewey County
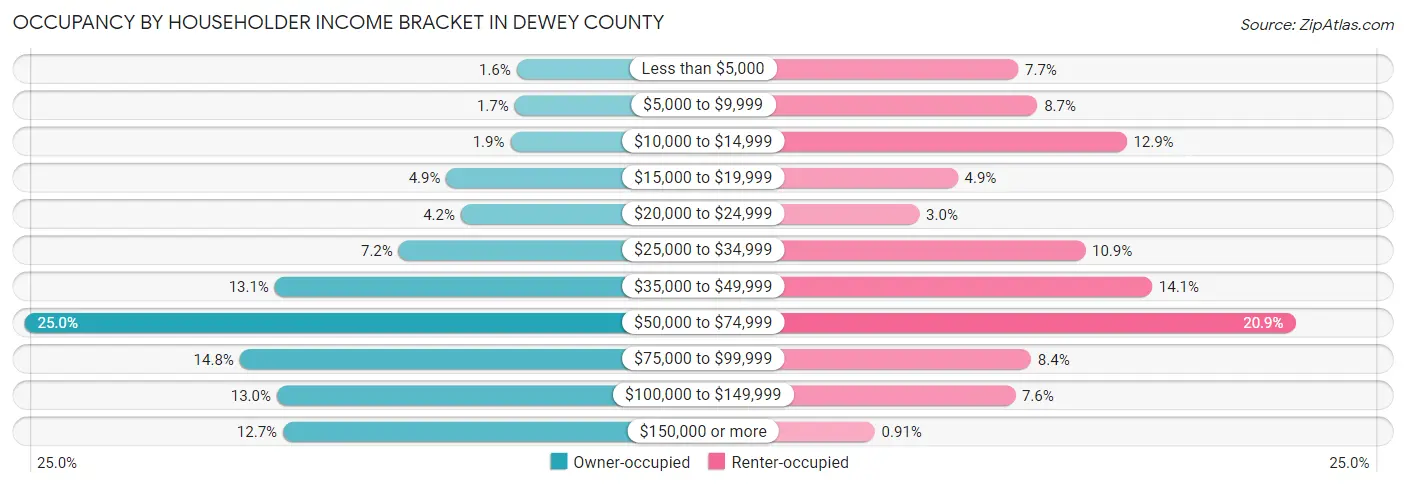
| Income Bracket | Owner-occupied | Renter-occupied |
| Less than $5,000 | 16 (1.6%) | 51 (7.7%) |
| $5,000 to $9,999 | 17 (1.7%) | 57 (8.6%) |
| $10,000 to $14,999 | 19 (1.9%) | 85 (12.9%) |
| $15,000 to $19,999 | 50 (4.9%) | 32 (4.9%) |
| $20,000 to $24,999 | 43 (4.2%) | 20 (3.0%) |
| $25,000 to $34,999 | 73 (7.2%) | 72 (10.9%) |
| $35,000 to $49,999 | 133 (13.1%) | 93 (14.1%) |
| $50,000 to $74,999 | 254 (25.0%) | 138 (20.9%) |
| $75,000 to $99,999 | 150 (14.8%) | 55 (8.4%) |
| $100,000 to $149,999 | 132 (13.0%) | 50 (7.6%) |
| $150,000 or more | 129 (12.7%) | 6 (0.9%) |
| Total | 1,016 (100.0%) | 659 (100.0%) |
Monthly Housing Cost Tiers in Dewey County
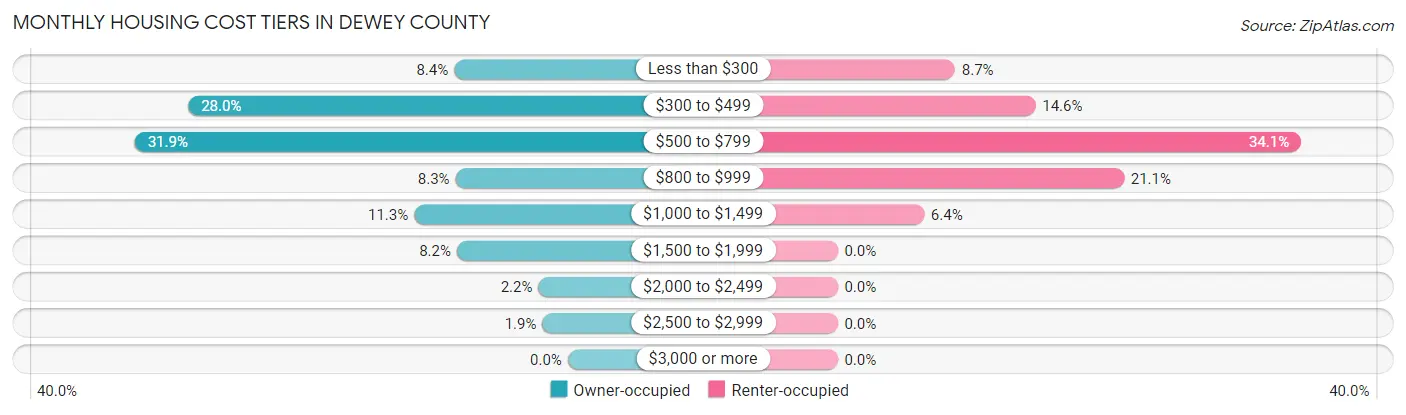
| Monthly Cost | Owner-occupied | Renter-occupied |
| Less than $300 | 85 (8.4%) | 57 (8.6%) |
| $300 to $499 | 284 (28.0%) | 96 (14.6%) |
| $500 to $799 | 324 (31.9%) | 225 (34.1%) |
| $800 to $999 | 84 (8.3%) | 139 (21.1%) |
| $1,000 to $1,499 | 115 (11.3%) | 42 (6.4%) |
| $1,500 to $1,999 | 83 (8.2%) | 0 (0.0%) |
| $2,000 to $2,499 | 22 (2.2%) | 0 (0.0%) |
| $2,500 to $2,999 | 19 (1.9%) | 0 (0.0%) |
| $3,000 or more | 0 (0.0%) | 0 (0.0%) |
| Total | 1,016 (100.0%) | 659 (100.0%) |
Physical Housing Characteristics in Dewey County
Housing Structures in Dewey County
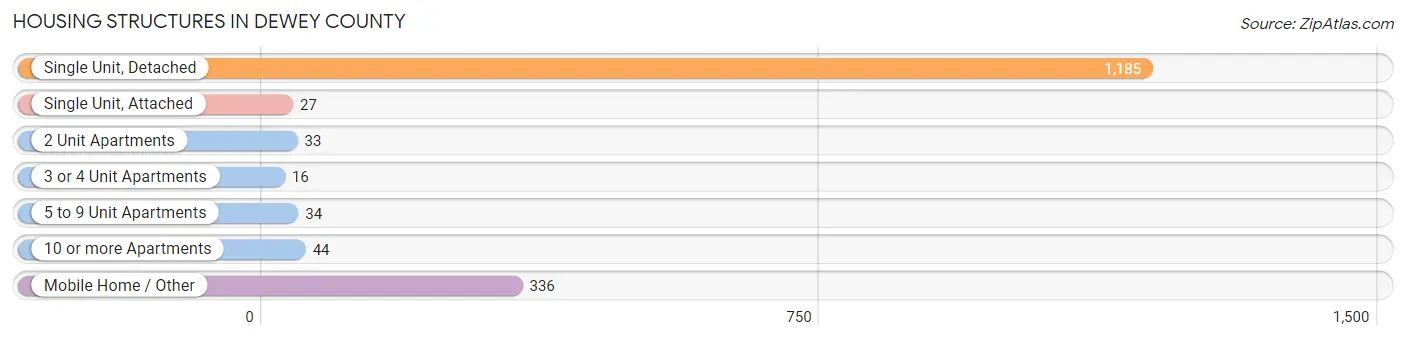
| Structure Type | # Housing Units | % Housing Units |
| Single Unit, Detached | 1,185 | 70.8% |
| Single Unit, Attached | 27 | 1.6% |
| 2 Unit Apartments | 33 | 2.0% |
| 3 or 4 Unit Apartments | 16 | 1.0% |
| 5 to 9 Unit Apartments | 34 | 2.0% |
| 10 or more Apartments | 44 | 2.6% |
| Mobile Home / Other | 336 | 20.1% |
| Total | 1,675 | 100.0% |
Housing Structures by Occupancy in Dewey County
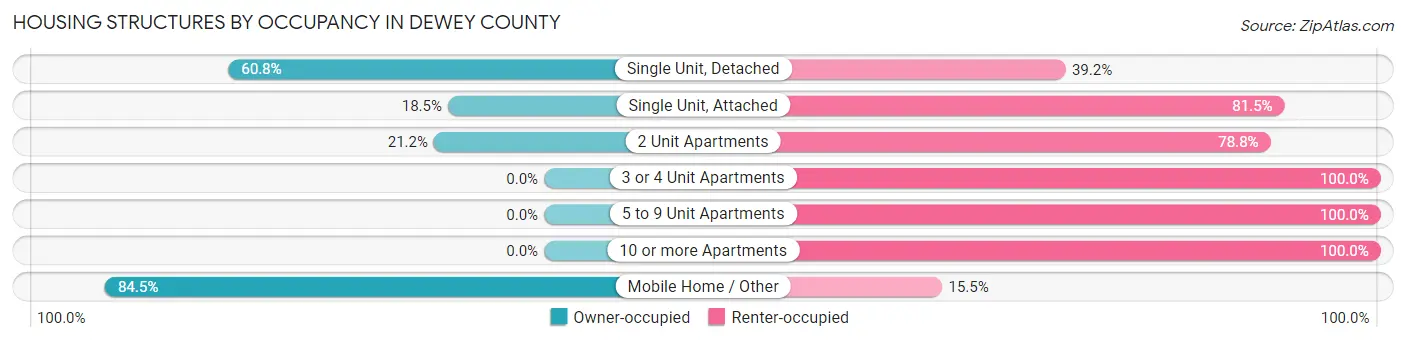
| Structure Type | Owner-occupied | Renter-occupied |
| Single Unit, Detached | 720 (60.8%) | 465 (39.2%) |
| Single Unit, Attached | 5 (18.5%) | 22 (81.5%) |
| 2 Unit Apartments | 7 (21.2%) | 26 (78.8%) |
| 3 or 4 Unit Apartments | 0 (0.0%) | 16 (100.0%) |
| 5 to 9 Unit Apartments | 0 (0.0%) | 34 (100.0%) |
| 10 or more Apartments | 0 (0.0%) | 44 (100.0%) |
| Mobile Home / Other | 284 (84.5%) | 52 (15.5%) |
| Total | 1,016 (60.7%) | 659 (39.3%) |
Housing Structures by Number of Rooms in Dewey County
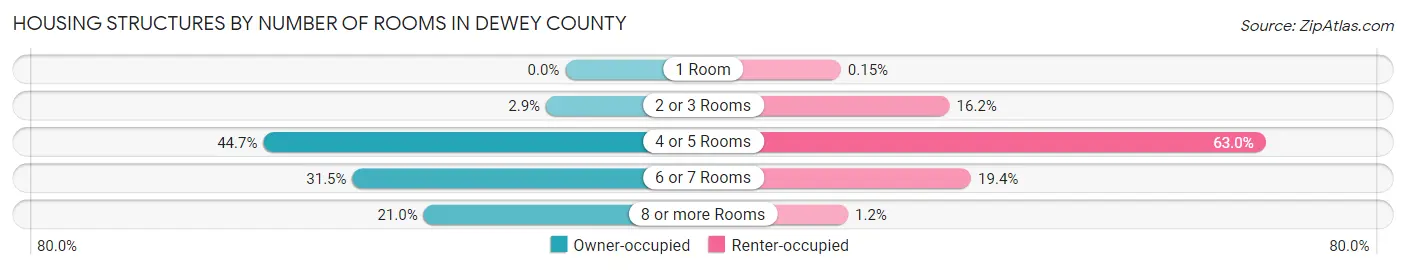
| Number of Rooms | Owner-occupied | Renter-occupied |
| 1 Room | 0 (0.0%) | 1 (0.2%) |
| 2 or 3 Rooms | 29 (2.9%) | 107 (16.2%) |
| 4 or 5 Rooms | 454 (44.7%) | 415 (63.0%) |
| 6 or 7 Rooms | 320 (31.5%) | 128 (19.4%) |
| 8 or more Rooms | 213 (21.0%) | 8 (1.2%) |
| Total | 1,016 (100.0%) | 659 (100.0%) |
Housing Structure by Heating Type in Dewey County
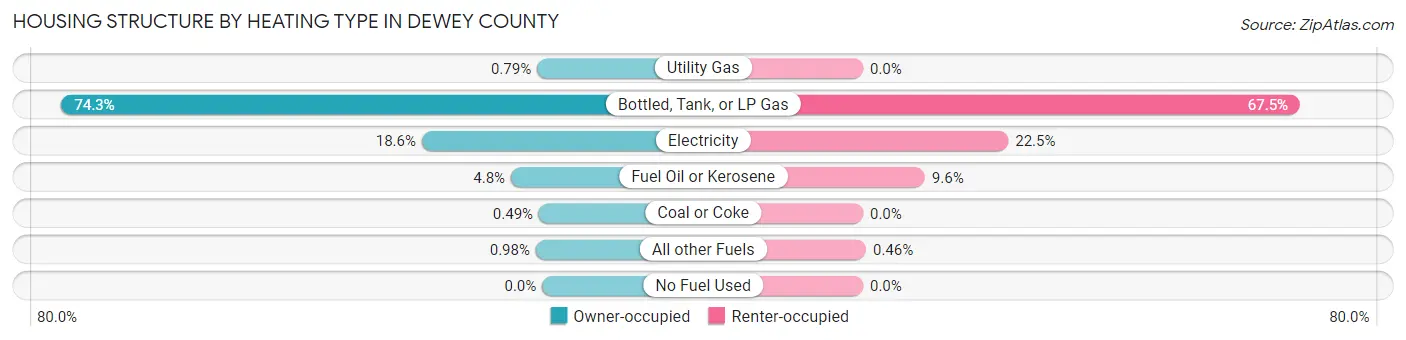
| Heating Type | Owner-occupied | Renter-occupied |
| Utility Gas | 8 (0.8%) | 0 (0.0%) |
| Bottled, Tank, or LP Gas | 755 (74.3%) | 445 (67.5%) |
| Electricity | 189 (18.6%) | 148 (22.5%) |
| Fuel Oil or Kerosene | 49 (4.8%) | 63 (9.6%) |
| Coal or Coke | 5 (0.5%) | 0 (0.0%) |
| All other Fuels | 10 (1.0%) | 3 (0.5%) |
| No Fuel Used | 0 (0.0%) | 0 (0.0%) |
| Total | 1,016 (100.0%) | 659 (100.0%) |
Household Vehicle Usage in Dewey County
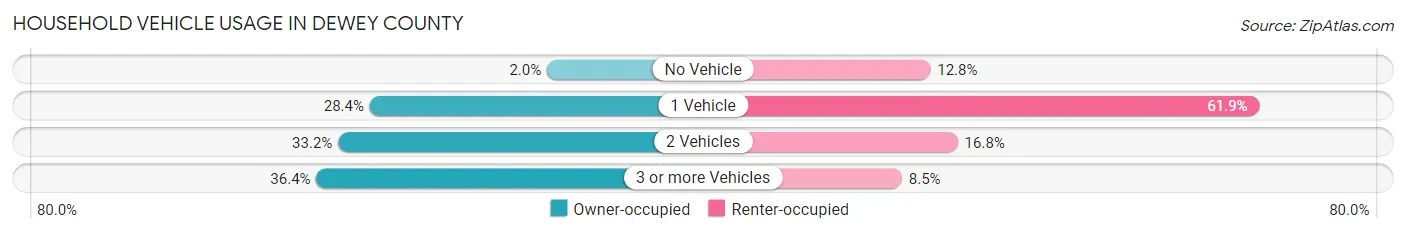
| Vehicles per Household | Owner-occupied | Renter-occupied |
| No Vehicle | 20 (2.0%) | 84 (12.8%) |
| 1 Vehicle | 289 (28.4%) | 408 (61.9%) |
| 2 Vehicles | 337 (33.2%) | 111 (16.8%) |
| 3 or more Vehicles | 370 (36.4%) | 56 (8.5%) |
| Total | 1,016 (100.0%) | 659 (100.0%) |
Real Estate & Mortgages in Dewey County
Real Estate and Mortgage Overview in Dewey County
| Characteristic | Without Mortgage | With Mortgage |
| Housing Units | 659 | 357 |
| Median Property Value | $57,400 | $104,600 |
| Median Household Income | $58,125 | $67 |
| Monthly Housing Costs | $477 | $0 |
| Real Estate Taxes | $815 | $134 |
Property Value by Mortgage Status in Dewey County
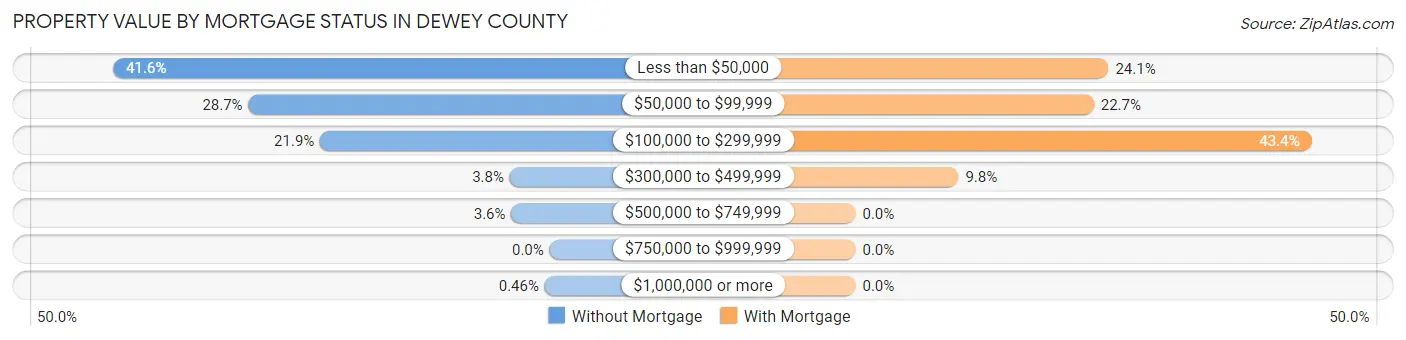
| Property Value | Without Mortgage | With Mortgage |
| Less than $50,000 | 274 (41.6%) | 86 (24.1%) |
| $50,000 to $99,999 | 189 (28.7%) | 81 (22.7%) |
| $100,000 to $299,999 | 144 (21.8%) | 155 (43.4%) |
| $300,000 to $499,999 | 25 (3.8%) | 35 (9.8%) |
| $500,000 to $749,999 | 24 (3.6%) | 0 (0.0%) |
| $750,000 to $999,999 | 0 (0.0%) | 0 (0.0%) |
| $1,000,000 or more | 3 (0.5%) | 0 (0.0%) |
| Total | 659 (100.0%) | 357 (100.0%) |
Household Income by Mortgage Status in Dewey County
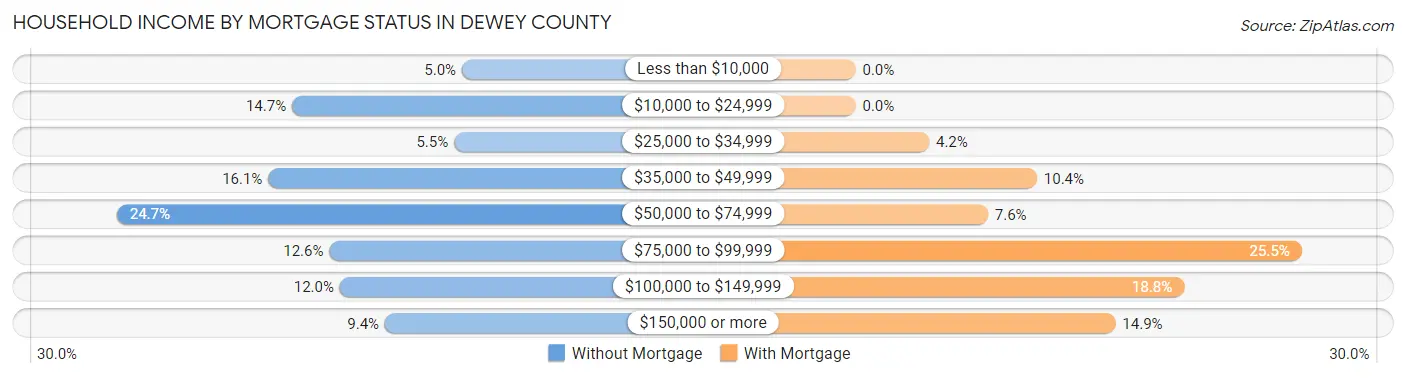
| Household Income | Without Mortgage | With Mortgage |
| Less than $10,000 | 33 (5.0%) | 0 (0.0%) |
| $10,000 to $24,999 | 97 (14.7%) | 0 (0.0%) |
| $25,000 to $34,999 | 36 (5.5%) | 15 (4.2%) |
| $35,000 to $49,999 | 106 (16.1%) | 37 (10.4%) |
| $50,000 to $74,999 | 163 (24.7%) | 27 (7.6%) |
| $75,000 to $99,999 | 83 (12.6%) | 91 (25.5%) |
| $100,000 to $149,999 | 79 (12.0%) | 67 (18.8%) |
| $150,000 or more | 62 (9.4%) | 53 (14.8%) |
| Total | 659 (100.0%) | 357 (100.0%) |
Property Value to Household Income Ratio in Dewey County
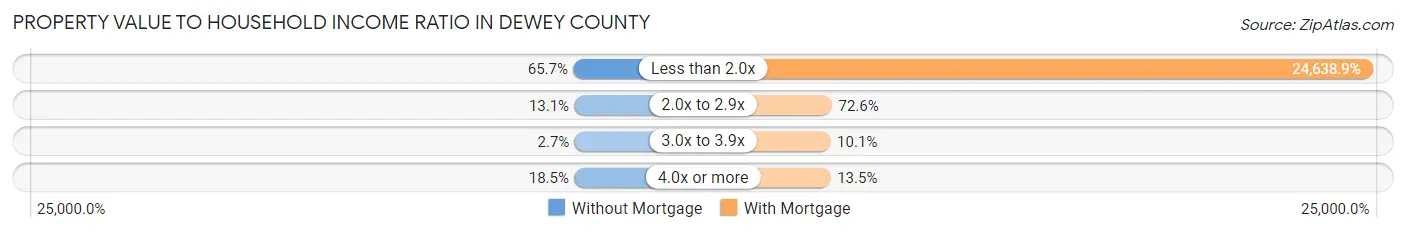
| Value-to-Income Ratio | Without Mortgage | With Mortgage |
| Less than 2.0x | 433 (65.7%) | 87,961 (24,638.9%) |
| 2.0x to 2.9x | 86 (13.1%) | 259 (72.6%) |
| 3.0x to 3.9x | 18 (2.7%) | 36 (10.1%) |
| 4.0x or more | 122 (18.5%) | 48 (13.5%) |
| Total | 659 (100.0%) | 357 (100.0%) |
Real Estate Taxes by Mortgage Status in Dewey County
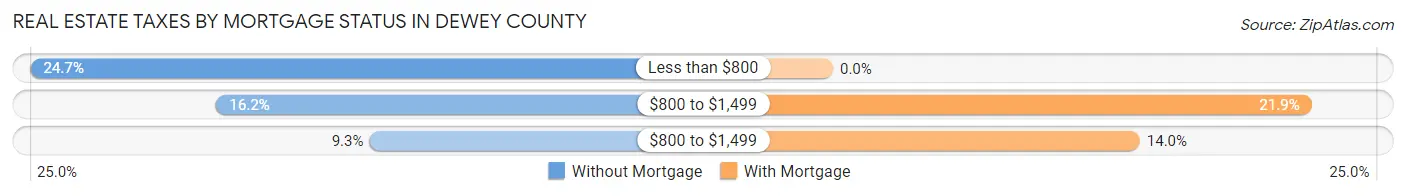
| Property Taxes | Without Mortgage | With Mortgage |
| Less than $800 | 163 (24.7%) | 0 (0.0%) |
| $800 to $1,499 | 107 (16.2%) | 78 (21.8%) |
| $800 to $1,499 | 61 (9.3%) | 50 (14.0%) |
| Total | 659 (100.0%) | 357 (100.0%) |
Health & Disability in Dewey County
Health Insurance Coverage by Age in Dewey County
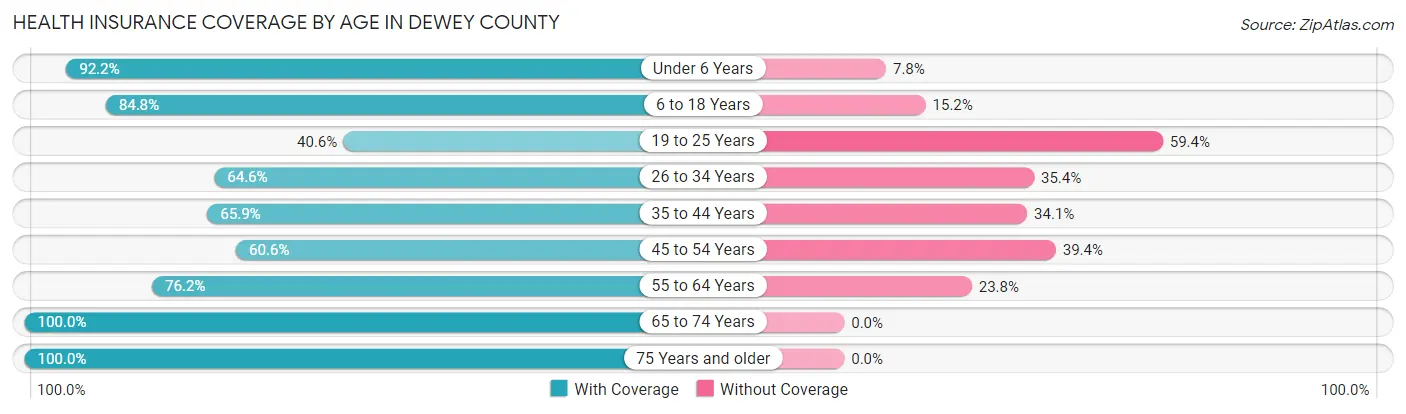
| Age Bracket | With Coverage | Without Coverage |
| Under 6 Years | 628 (92.2%) | 53 (7.8%) |
| 6 to 18 Years | 1,203 (84.8%) | 215 (15.2%) |
| 19 to 25 Years | 162 (40.6%) | 237 (59.4%) |
| 26 to 34 Years | 356 (64.6%) | 195 (35.4%) |
| 35 to 44 Years | 400 (65.9%) | 207 (34.1%) |
| 45 to 54 Years | 281 (60.6%) | 183 (39.4%) |
| 55 to 64 Years | 433 (76.2%) | 135 (23.8%) |
| 65 to 74 Years | 332 (100.0%) | 0 (0.0%) |
| 75 Years and older | 173 (100.0%) | 0 (0.0%) |
| Total | 3,968 (76.4%) | 1,225 (23.6%) |
Health Insurance Coverage by Citizenship Status in Dewey County
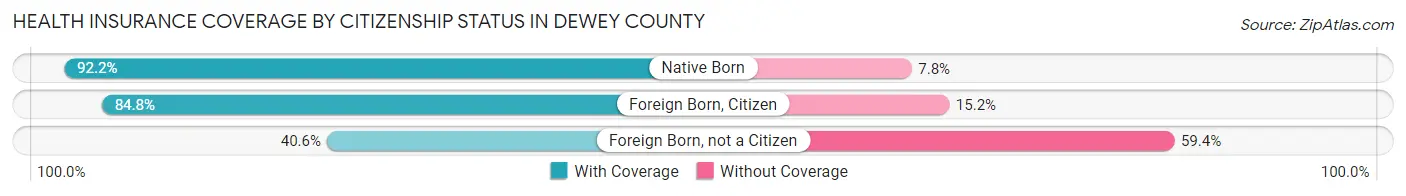
| Citizenship Status | With Coverage | Without Coverage |
| Native Born | 628 (92.2%) | 53 (7.8%) |
| Foreign Born, Citizen | 1,203 (84.8%) | 215 (15.2%) |
| Foreign Born, not a Citizen | 162 (40.6%) | 237 (59.4%) |
Health Insurance Coverage by Household Income in Dewey County
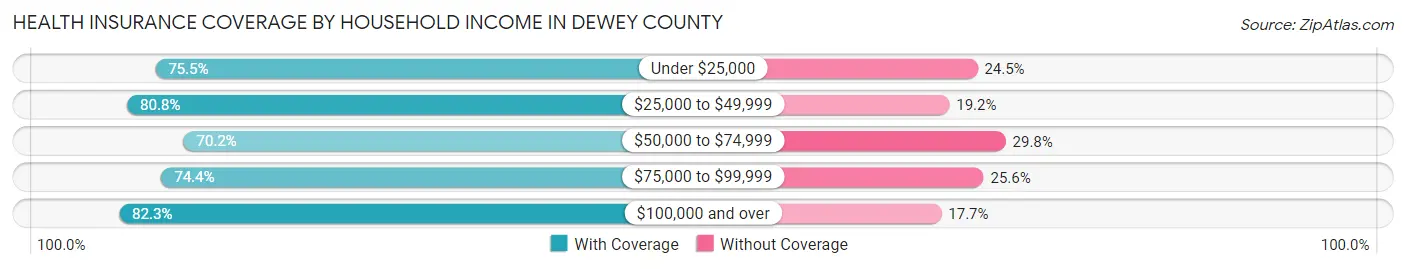
| Household Income | With Coverage | Without Coverage |
| Under $25,000 | 830 (75.5%) | 269 (24.5%) |
| $25,000 to $49,999 | 795 (80.8%) | 189 (19.2%) |
| $50,000 to $74,999 | 956 (70.2%) | 405 (29.8%) |
| $75,000 to $99,999 | 482 (74.4%) | 166 (25.6%) |
| $100,000 and over | 901 (82.3%) | 194 (17.7%) |
Public vs Private Health Insurance Coverage by Age in Dewey County
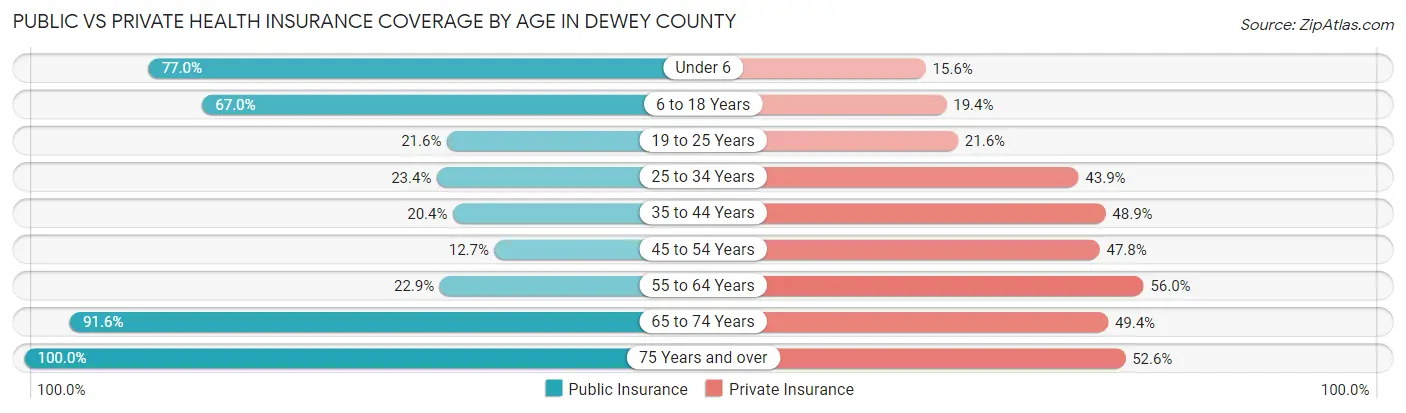
| Age Bracket | Public Insurance | Private Insurance |
| Under 6 | 524 (76.9%) | 106 (15.6%) |
| 6 to 18 Years | 950 (67.0%) | 275 (19.4%) |
| 19 to 25 Years | 86 (21.5%) | 86 (21.5%) |
| 25 to 34 Years | 129 (23.4%) | 242 (43.9%) |
| 35 to 44 Years | 124 (20.4%) | 297 (48.9%) |
| 45 to 54 Years | 59 (12.7%) | 222 (47.8%) |
| 55 to 64 Years | 130 (22.9%) | 318 (56.0%) |
| 65 to 74 Years | 304 (91.6%) | 164 (49.4%) |
| 75 Years and over | 173 (100.0%) | 91 (52.6%) |
| Total | 2,479 (47.7%) | 1,801 (34.7%) |
Disability Status by Sex by Age in Dewey County
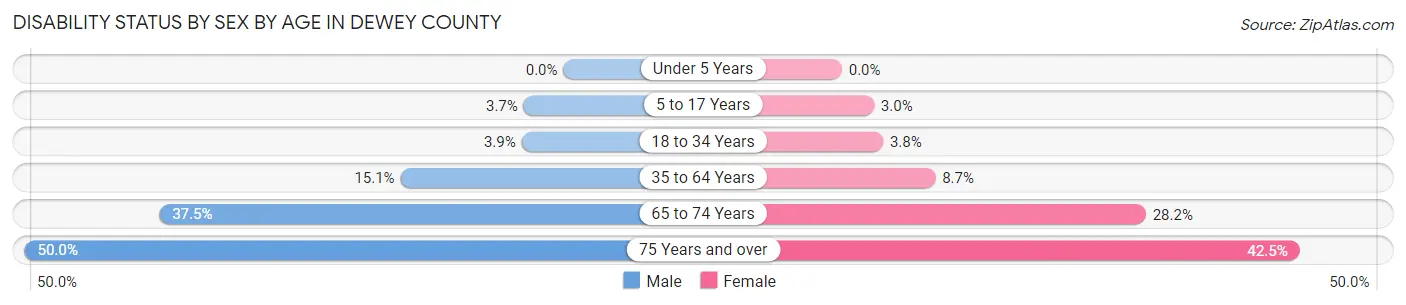
| Age Bracket | Male | Female |
| Under 5 Years | 0 (0.0%) | 0 (0.0%) |
| 5 to 17 Years | 27 (3.7%) | 20 (3.0%) |
| 18 to 34 Years | 20 (3.9%) | 21 (3.8%) |
| 35 to 64 Years | 124 (15.1%) | 71 (8.7%) |
| 65 to 74 Years | 66 (37.5%) | 44 (28.2%) |
| 75 Years and over | 30 (50.0%) | 48 (42.5%) |
Disability Class by Sex by Age in Dewey County
Disability Class: Hearing Difficulty
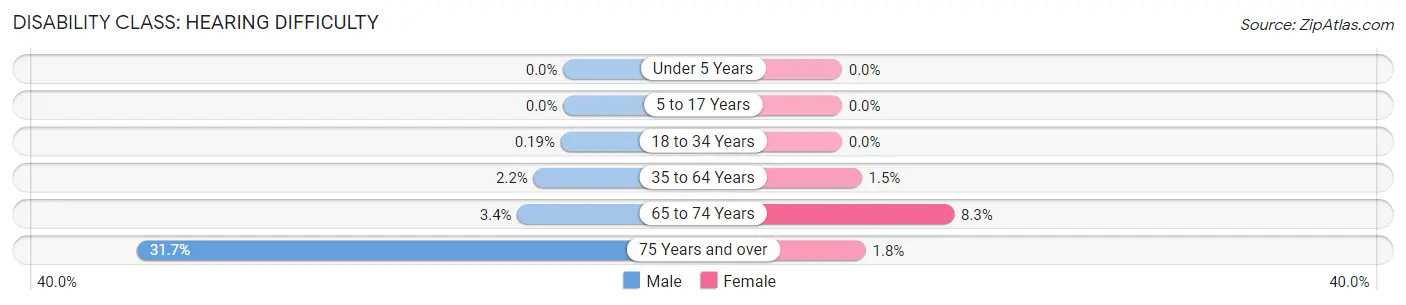
| Age Bracket | Male | Female |
| Under 5 Years | 0 (0.0%) | 0 (0.0%) |
| 5 to 17 Years | 0 (0.0%) | 0 (0.0%) |
| 18 to 34 Years | 1 (0.2%) | 0 (0.0%) |
| 35 to 64 Years | 18 (2.2%) | 12 (1.5%) |
| 65 to 74 Years | 6 (3.4%) | 13 (8.3%) |
| 75 Years and over | 19 (31.7%) | 2 (1.8%) |
Disability Class: Vision Difficulty
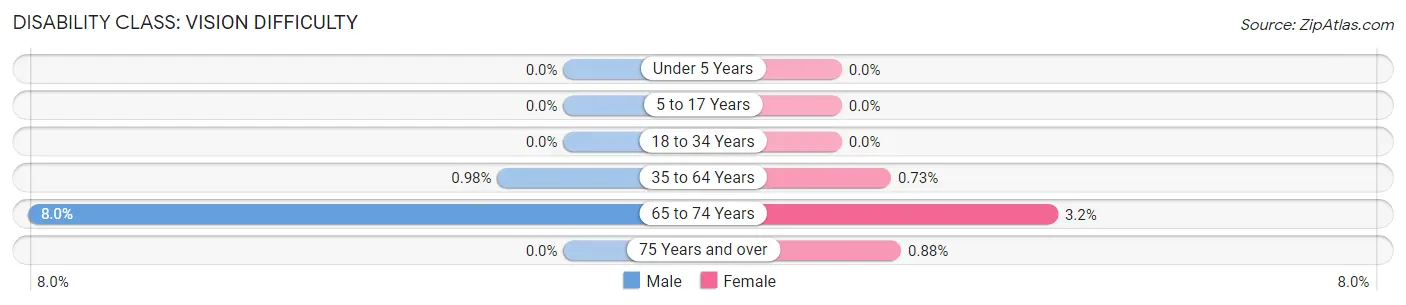
| Age Bracket | Male | Female |
| Under 5 Years | 0 (0.0%) | 0 (0.0%) |
| 5 to 17 Years | 0 (0.0%) | 0 (0.0%) |
| 18 to 34 Years | 0 (0.0%) | 0 (0.0%) |
| 35 to 64 Years | 8 (1.0%) | 6 (0.7%) |
| 65 to 74 Years | 14 (8.0%) | 5 (3.2%) |
| 75 Years and over | 0 (0.0%) | 1 (0.9%) |
Disability Class: Cognitive Difficulty
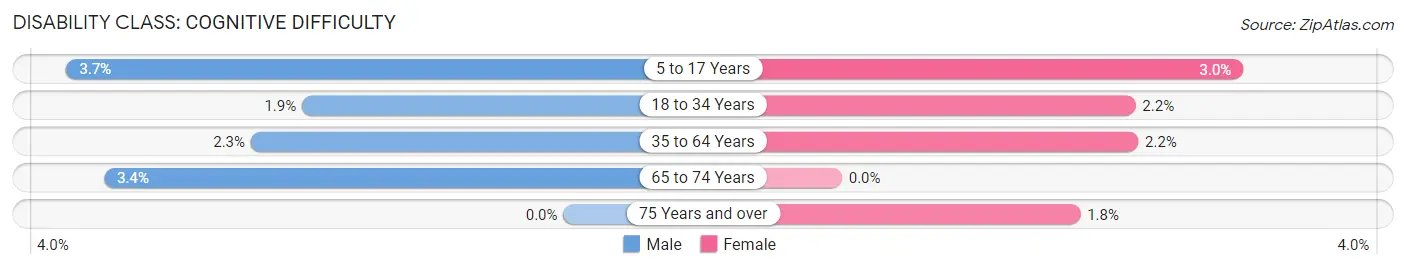
| Age Bracket | Male | Female |
| 5 to 17 Years | 27 (3.7%) | 20 (3.0%) |
| 18 to 34 Years | 10 (1.9%) | 12 (2.2%) |
| 35 to 64 Years | 19 (2.3%) | 18 (2.2%) |
| 65 to 74 Years | 6 (3.4%) | 0 (0.0%) |
| 75 Years and over | 0 (0.0%) | 2 (1.8%) |
Disability Class: Ambulatory Difficulty
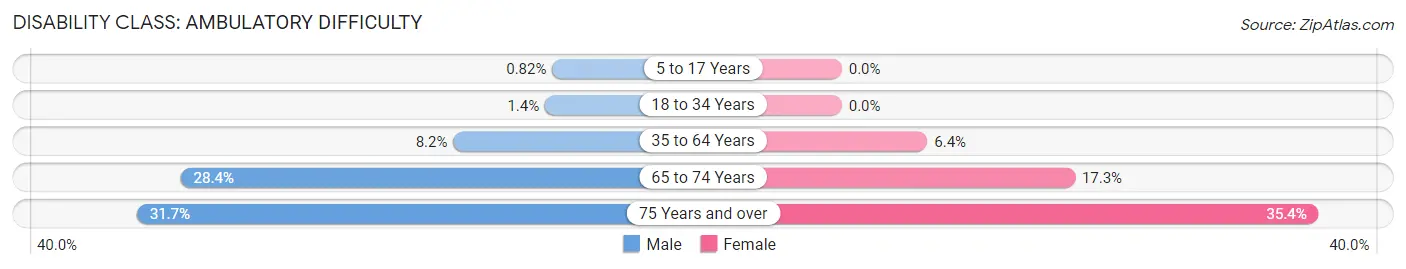
| Age Bracket | Male | Female |
| 5 to 17 Years | 6 (0.8%) | 0 (0.0%) |
| 18 to 34 Years | 7 (1.4%) | 0 (0.0%) |
| 35 to 64 Years | 67 (8.2%) | 52 (6.4%) |
| 65 to 74 Years | 50 (28.4%) | 27 (17.3%) |
| 75 Years and over | 19 (31.7%) | 40 (35.4%) |
Disability Class: Self-Care Difficulty
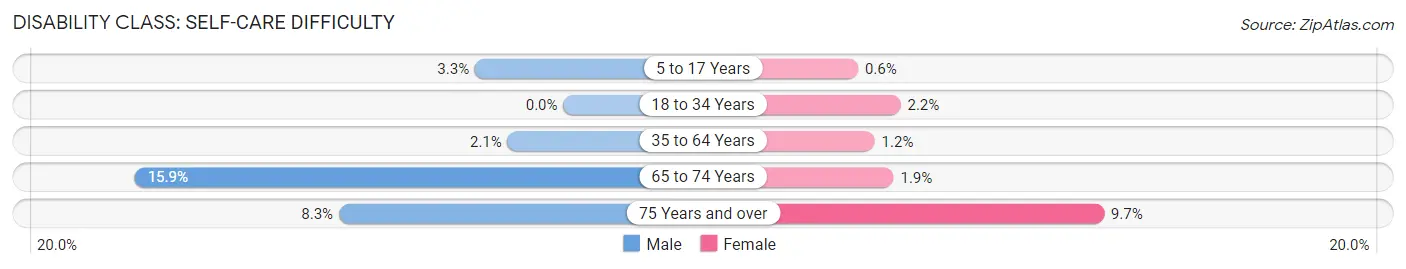
| Age Bracket | Male | Female |
| 5 to 17 Years | 24 (3.3%) | 4 (0.6%) |
| 18 to 34 Years | 0 (0.0%) | 12 (2.2%) |
| 35 to 64 Years | 17 (2.1%) | 10 (1.2%) |
| 65 to 74 Years | 28 (15.9%) | 3 (1.9%) |
| 75 Years and over | 5 (8.3%) | 11 (9.7%) |
Technology Access in Dewey County
Computing Device Access in Dewey County
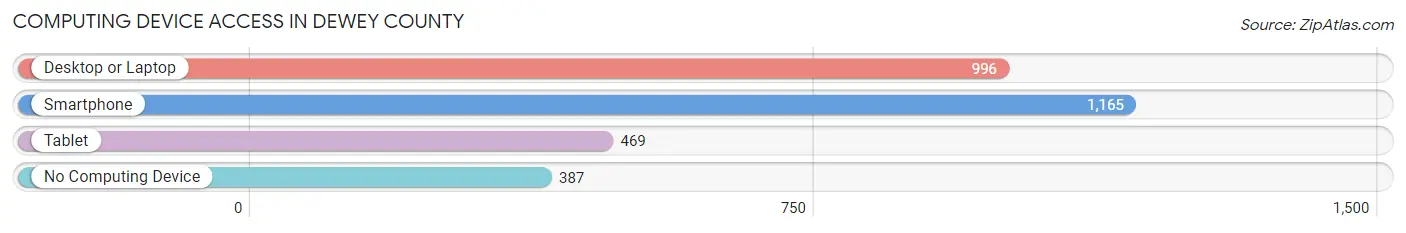
| Device Type | # Households | % Households |
| Desktop or Laptop | 996 | 59.5% |
| Smartphone | 1,165 | 69.6% |
| Tablet | 469 | 28.0% |
| No Computing Device | 387 | 23.1% |
| Total | 1,675 | 100.0% |
Internet Access in Dewey County
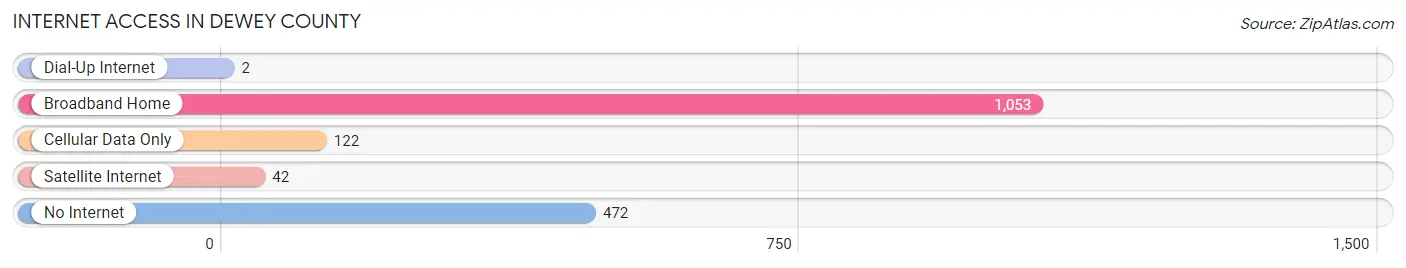
| Internet Type | # Households | % Households |
| Dial-Up Internet | 2 | 0.1% |
| Broadband Home | 1,053 | 62.9% |
| Cellular Data Only | 122 | 7.3% |
| Satellite Internet | 42 | 2.5% |
| No Internet | 472 | 28.2% |
| Total | 1,675 | 100.0% |
Dewey County Summary
Dewey County is located in the western part of South Dakota, and is bordered by Ziebach County to the north, Corson County to the east, Meade County to the south, and Harding County to the west. The county seat is Timber Lake, and the county was named after Admiral George Dewey. The county has a total area of 1,845 square miles, and a population of 2,890 as of the 2010 census.
History
Dewey County was established in 1909, and was named after Admiral George Dewey. The county was created from parts of Ziebach, Meade, and Harding counties. The county was originally populated by Native American tribes, including the Lakota, Cheyenne, and Arapaho. The first settlers in the area were ranchers, who began to move into the area in the late 1800s.
Geography
Dewey County is located in the western part of South Dakota, and is bordered by Ziebach County to the north, Corson County to the east, Meade County to the south, and Harding County to the west. The county has a total area of 1,845 square miles, and is mostly covered by prairie grasslands. The county is home to several lakes, including Lake Oahe, Lake Sharpe, and Lake Francis Case. The county also contains several rivers, including the Cheyenne River, the Grand River, and the Moreau River.
Economy
The economy of Dewey County is largely based on agriculture, with the majority of the county’s population employed in farming and ranching. The county is also home to several oil and gas fields, which provide additional employment opportunities. The county is also home to several small businesses, including restaurants, retail stores, and service providers.
Demographics
As of the 2010 census, the population of Dewey County was 2,890. The racial makeup of the county was 94.3% White, 0.2% African American, 3.2% Native American, 0.2% Asian, 0.1% Pacific Islander, 0.3% from other races, and 1.9% from two or more races. The median household income in the county was $35,938, and the median family income was $41,250. The per capita income in the county was $17,845.
Conclusion
Dewey County is located in the western part of South Dakota, and is bordered by Ziebach County to the north, Corson County to the east, Meade County to the south, and Harding County to the west. The county was established in 1909, and was named after Admiral George Dewey. The county has a total area of 1,845 square miles, and a population of 2,890 as of the 2010 census. The economy of Dewey County is largely based on agriculture, with the majority of the county’s population employed in farming and ranching. The racial makeup of the county was 94.3% White, 0.2% African American, 3.2% Native American, 0.2% Asian, 0.1% Pacific Islander, 0.3% from other races, and 1.9% from two or more races. The median household income in the county was $35,938, and the median family income was $41,250. The per capita income in the county was $17,845.
Common Questions
What is Per Capita Income in Dewey County?
Per Capita income in Dewey County is $20,657.
What is the Median Family Income in Dewey County?
Median Family Income in Dewey County is $58,346.
What is the Median Household income in Dewey County?
Median Household Income in Dewey County is $55,077.
What is Income or Wage Gap in Dewey County?
Income or Wage Gap in Dewey County is 9.1%.
Women in Dewey County earn 90.9 cents for every dollar earned by a man.
What is Family Income Deficit in Dewey County?
Family Income Deficit in Dewey County is $14,022.
Families that are below poverty line in Dewey County earn $14,022 less on average than the poverty threshold level.
What is Inequality or Gini Index in Dewey County?
Inequality or Gini Index in Dewey County is 0.43.
What is the Total Population of Dewey County?
Total Population of Dewey County is 5,275.
What is the Total Male Population of Dewey County?
Total Male Population of Dewey County is 2,648.
What is the Total Female Population of Dewey County?
Total Female Population of Dewey County is 2,627.
What is the Ratio of Males per 100 Females in Dewey County?
There are 100.80 Males per 100 Females in Dewey County.
What is the Ratio of Females per 100 Males in Dewey County?
There are 99.21 Females per 100 Males in Dewey County.
What is the Median Population Age in Dewey County?
Median Population Age in Dewey County is 27.1 Years.
What is the Average Family Size in Dewey County
Average Family Size in Dewey County is 3.8 People.
What is the Average Household Size in Dewey County
Average Household Size in Dewey County is 3.1 People.
How Large is the Labor Force in Dewey County?
There are 2,314 People in the Labor Forcein in Dewey County.
What is the Percentage of People in the Labor Force in Dewey County?
67.0% of People are in the Labor Force in Dewey County.
What is the Unemployment Rate in Dewey County?
Unemployment Rate in Dewey County is 14.6%.