Bison, SD Map & Demographics
Bison Map
Bison Overview
$36,948
PER CAPITA INCOME
$78,750
AVG FAMILY INCOME
$66,786
AVG HOUSEHOLD INCOME
45.2%
WAGE / INCOME GAP [ % ]
54.8¢/ $1
WAGE / INCOME GAP [ $ ]
0.34
INEQUALITY / GINI INDEX
417
TOTAL POPULATION
213
MALE POPULATION
204
FEMALE POPULATION
104.41
MALES / 100 FEMALES
95.77
FEMALES / 100 MALES
46.9
MEDIAN AGE
2.4
AVG FAMILY SIZE
2.1
AVG HOUSEHOLD SIZE
223
LABOR FORCE [ PEOPLE ]
66.4%
PERCENT IN LABOR FORCE
Bison Zip Codes
Bison Area Codes
Income in Bison
Income Overview in Bison
Per Capita Income in Bison is $36,948, while median incomes of families and households are $78,750 and $66,786 respectively.
| Characteristic | Number | Measure |
| Per Capita Income | 417 | $36,948 |
| Median Family Income | 152 | $78,750 |
| Mean Family Income | 152 | $87,361 |
| Median Household Income | 200 | $66,786 |
| Mean Household Income | 200 | $77,797 |
| Income Deficit | 152 | $0 |
| Wage / Income Gap (%) | 417 | 45.18% |
| Wage / Income Gap ($) | 417 | 54.82¢ per $1 |
| Gini / Inequality Index | 417 | 0.34 |
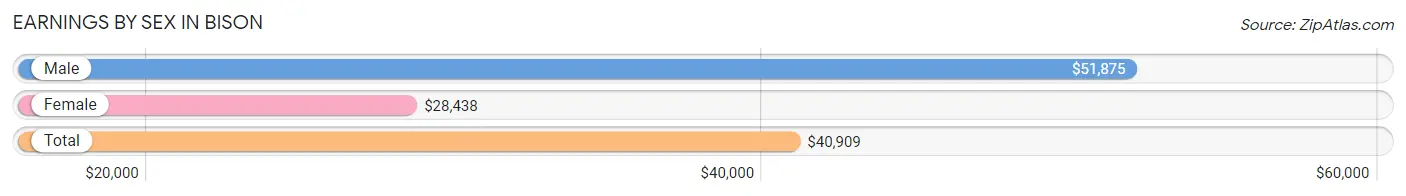
Earnings by Sex in Bison
Average Earnings in Bison are $40,909, $51,875 for men and $28,438 for women, a difference of 45.2%.
| Sex | Number | Average Earnings |
| Male | 118 (49.6%) | $51,875 |
| Female | 120 (50.4%) | $28,438 |
| Total | 238 (100.0%) | $40,909 |
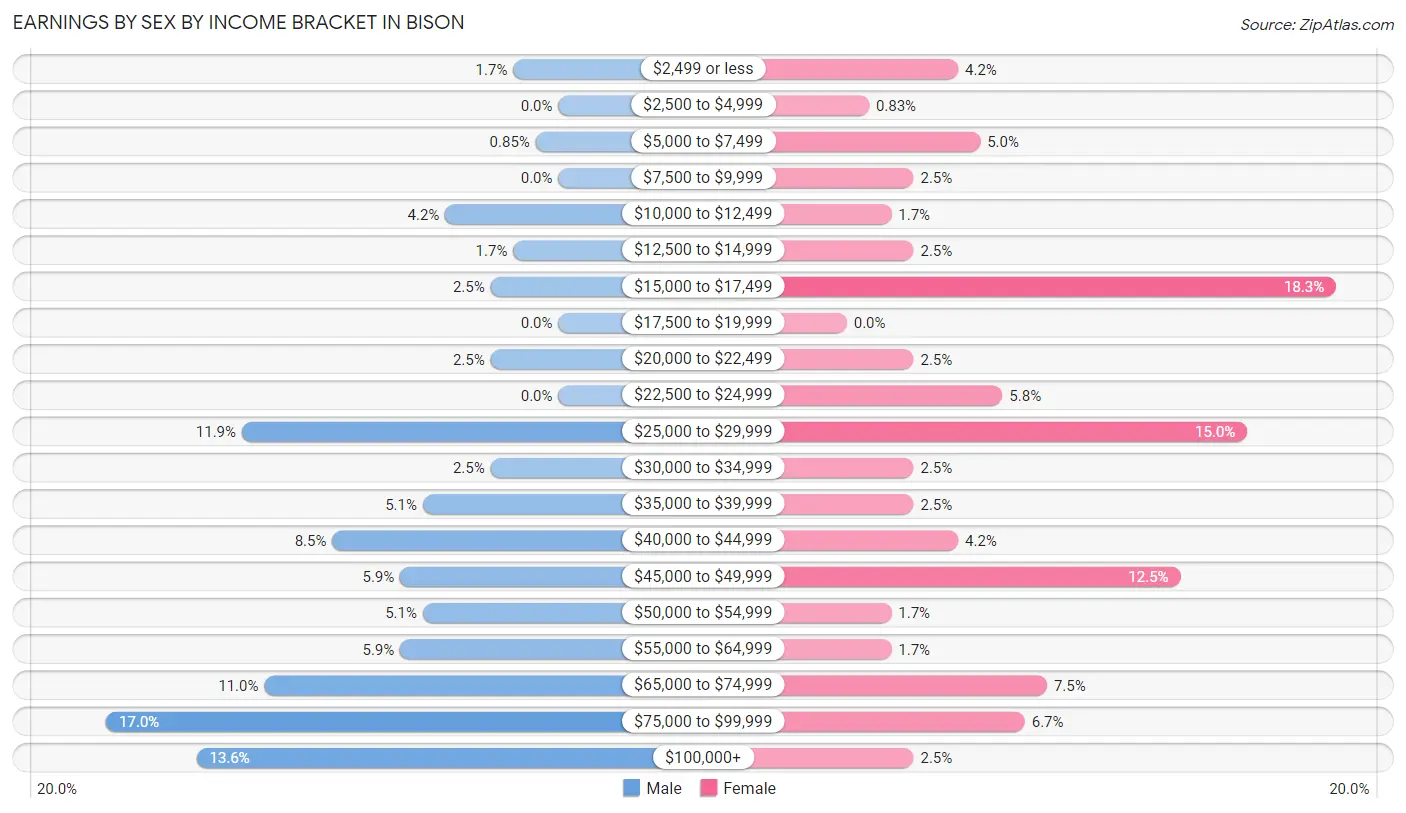
Earnings by Sex by Income Bracket in Bison
The most common earnings brackets in Bison are $75,000 to $99,999 for men (20 | 17.0%) and $15,000 to $17,499 for women (22 | 18.3%).
| Income | Male | Female |
| $2,499 or less | 2 (1.7%) | 5 (4.2%) |
| $2,500 to $4,999 | 0 (0.0%) | 1 (0.8%) |
| $5,000 to $7,499 | 1 (0.9%) | 6 (5.0%) |
| $7,500 to $9,999 | 0 (0.0%) | 3 (2.5%) |
| $10,000 to $12,499 | 5 (4.2%) | 2 (1.7%) |
| $12,500 to $14,999 | 2 (1.7%) | 3 (2.5%) |
| $15,000 to $17,499 | 3 (2.5%) | 22 (18.3%) |
| $17,500 to $19,999 | 0 (0.0%) | 0 (0.0%) |
| $20,000 to $22,499 | 3 (2.5%) | 3 (2.5%) |
| $22,500 to $24,999 | 0 (0.0%) | 7 (5.8%) |
| $25,000 to $29,999 | 14 (11.9%) | 18 (15.0%) |
| $30,000 to $34,999 | 3 (2.5%) | 3 (2.5%) |
| $35,000 to $39,999 | 6 (5.1%) | 3 (2.5%) |
| $40,000 to $44,999 | 10 (8.5%) | 5 (4.2%) |
| $45,000 to $49,999 | 7 (5.9%) | 15 (12.5%) |
| $50,000 to $54,999 | 6 (5.1%) | 2 (1.7%) |
| $55,000 to $64,999 | 7 (5.9%) | 2 (1.7%) |
| $65,000 to $74,999 | 13 (11.0%) | 9 (7.5%) |
| $75,000 to $99,999 | 20 (17.0%) | 8 (6.7%) |
| $100,000+ | 16 (13.6%) | 3 (2.5%) |
| Total | 118 (100.0%) | 120 (100.0%) |
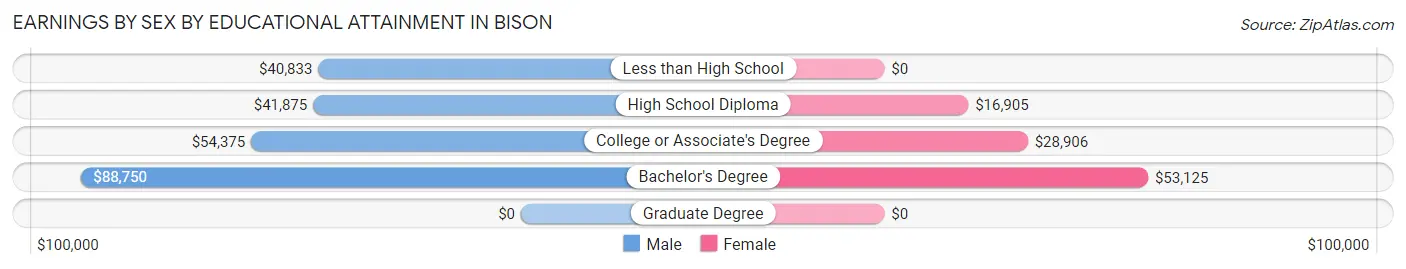
Earnings by Sex by Educational Attainment in Bison
Average earnings in Bison are $53,125 for men and $28,594 for women, a difference of 46.2%. Men with an educational attainment of bachelor's degree enjoy the highest average annual earnings of $88,750, while those with less than high school education earn the least with $40,833. Women with an educational attainment of bachelor's degree earn the most with the average annual earnings of $53,125, while those with high school diploma education have the smallest earnings of $16,905.
| Educational Attainment | Male Income | Female Income |
| Less than High School | $40,833 | $0 |
| High School Diploma | $41,875 | $16,905 |
| College or Associate's Degree | $54,375 | $28,906 |
| Bachelor's Degree | $88,750 | $53,125 |
| Graduate Degree | - | - |
| Total | $53,125 | $28,594 |
Family Income in Bison
Family Income Brackets in Bison
According to the Bison family income data, there are 45 families falling into the $35,000 to $49,999 income range, which is the most common income bracket and makes up 29.6% of all families.
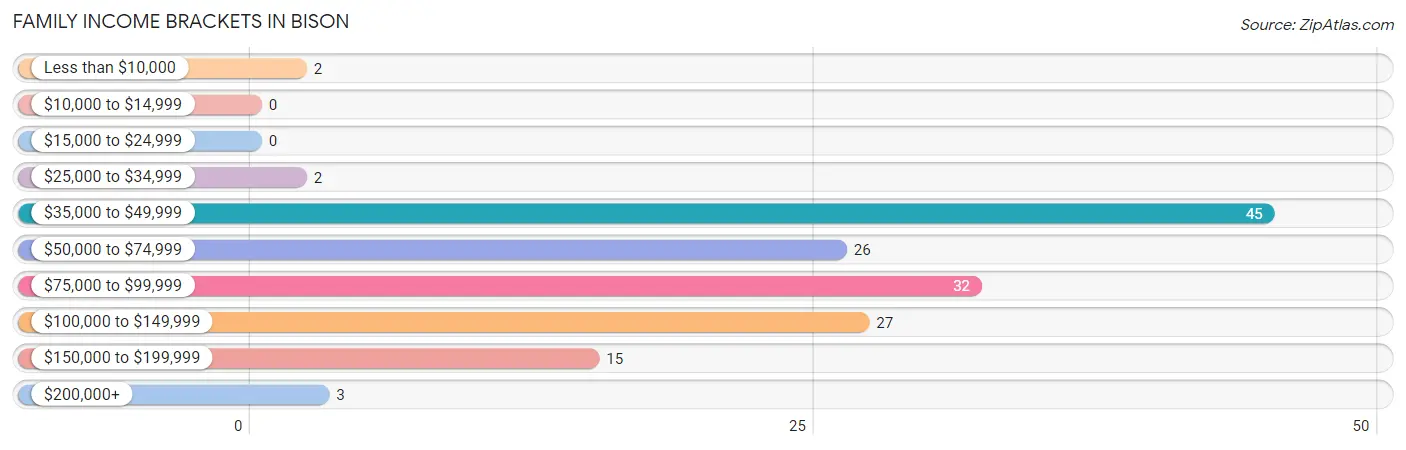
| Income Bracket | # Families | % Families |
| Less than $10,000 | 2 | 1.3% |
| $10,000 to $14,999 | 0 | 0.0% |
| $15,000 to $24,999 | 0 | 0.0% |
| $25,000 to $34,999 | 2 | 1.3% |
| $35,000 to $49,999 | 45 | 29.6% |
| $50,000 to $74,999 | 26 | 17.1% |
| $75,000 to $99,999 | 32 | 21.1% |
| $100,000 to $149,999 | 27 | 17.8% |
| $150,000 to $199,999 | 15 | 9.9% |
| $200,000+ | 3 | 2.0% |
Family Income by Famaliy Size in Bison
5-person families (8 | 5.3%) account for the highest median family income in Bison with $113,750 per family, while 2-person families (118 | 77.6%) have the highest median income of $35,228 per family member.
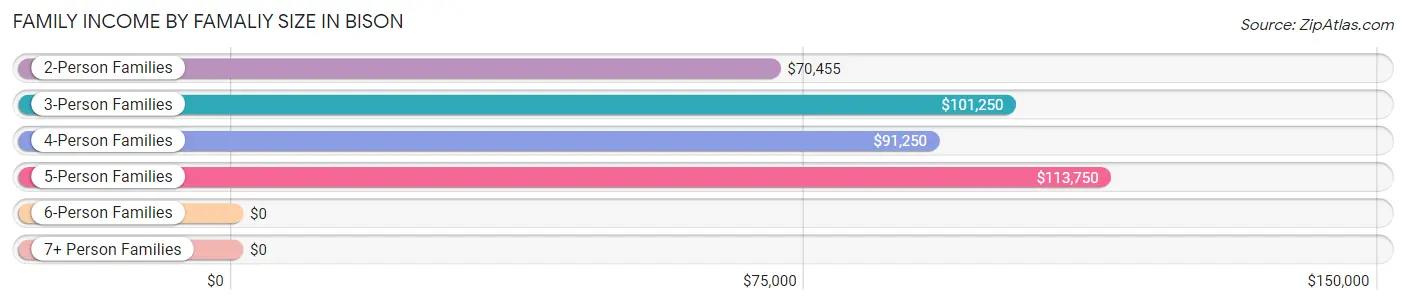
| Income Bracket | # Families | Median Income |
| 2-Person Families | 118 (77.6%) | $70,455 |
| 3-Person Families | 18 (11.8%) | $101,250 |
| 4-Person Families | 7 (4.6%) | $91,250 |
| 5-Person Families | 8 (5.3%) | $113,750 |
| 6-Person Families | 1 (0.7%) | $0 |
| 7+ Person Families | 0 (0.0%) | $0 |
| Total | 152 (100.0%) | $78,750 |
Family Income by Number of Earners in Bison
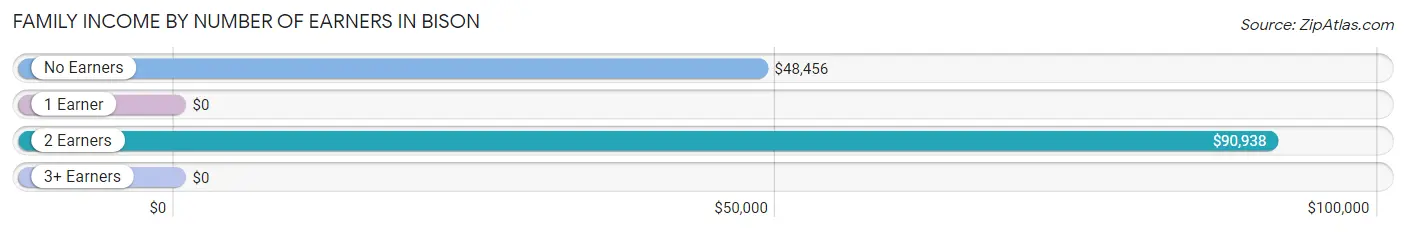
| Number of Earners | # Families | Median Income |
| No Earners | 33 (21.7%) | $48,456 |
| 1 Earner | 39 (25.7%) | $0 |
| 2 Earners | 73 (48.0%) | $90,938 |
| 3+ Earners | 7 (4.6%) | $0 |
| Total | 152 (100.0%) | $78,750 |
Household Income in Bison
Household Income Brackets in Bison
With 46 households falling in the category, the $35,000 to $49,999 income range is the most frequent in Bison, accounting for 23.0% of all households. In contrast, only 4 households (2.0%) fall into the $10,000 to $14,999 income bracket, making it the least populous group.
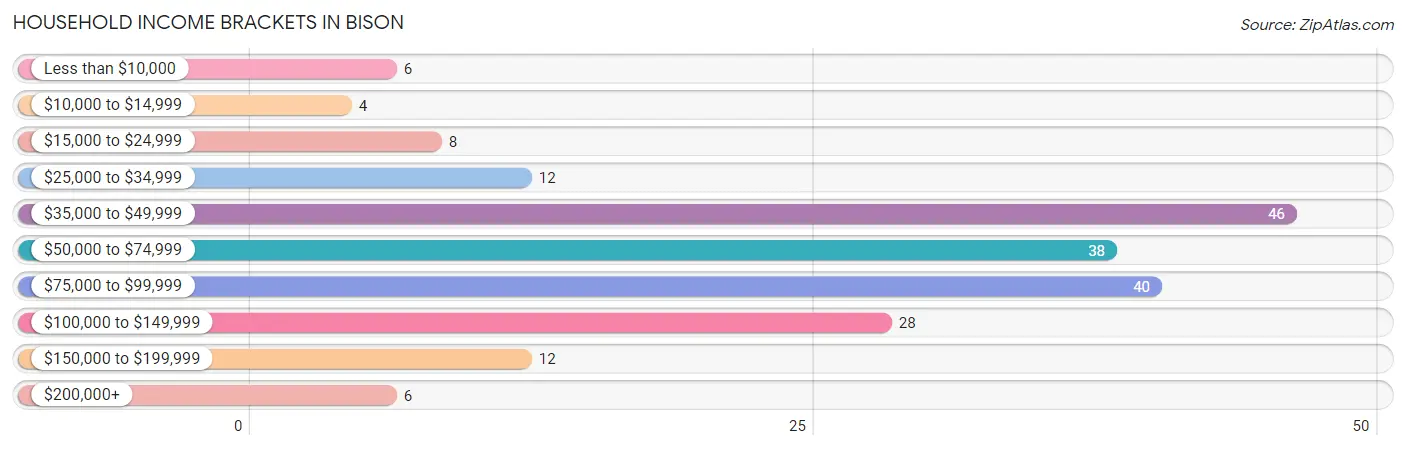
| Income Bracket | # Households | % Households |
| Less than $10,000 | 6 | 3.0% |
| $10,000 to $14,999 | 4 | 2.0% |
| $15,000 to $24,999 | 8 | 4.0% |
| $25,000 to $34,999 | 12 | 6.0% |
| $35,000 to $49,999 | 46 | 23.0% |
| $50,000 to $74,999 | 38 | 19.0% |
| $75,000 to $99,999 | 40 | 20.0% |
| $100,000 to $149,999 | 28 | 14.0% |
| $150,000 to $199,999 | 12 | 6.0% |
| $200,000+ | 6 | 3.0% |
Household Income by Householder Age in Bison
The median household income in Bison is $66,786, with the highest median household income of $82,500 found in the 25 to 44 years age bracket for the primary householder. A total of 34 households (17.0%) fall into this category.
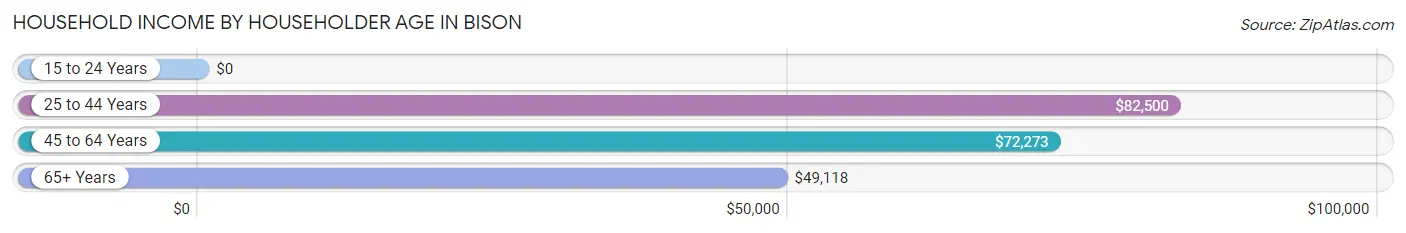
| Income Bracket | # Households | Median Income |
| 15 to 24 Years | 0 (0.0%) | $0 |
| 25 to 44 Years | 34 (17.0%) | $82,500 |
| 45 to 64 Years | 96 (48.0%) | $72,273 |
| 65+ Years | 70 (35.0%) | $49,118 |
| Total | 200 (100.0%) | $66,786 |
Poverty in Bison
Income Below Poverty by Sex and Age in Bison
With 3.8% poverty level for males and 2.9% for females among the residents of Bison, 6 to 11 year old males and 75 year old and over females are the most vulnerable to poverty, with 2 males (28.6%) and 3 females (10.7%) in their respective age groups living below the poverty level.
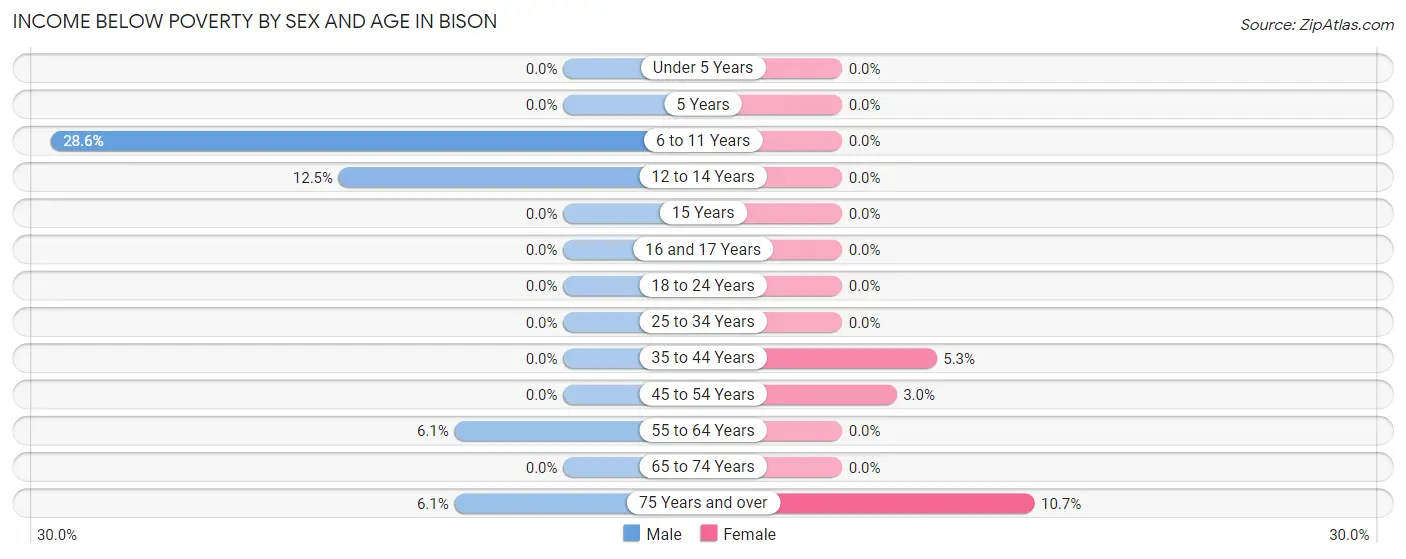
| Age Bracket | Male | Female |
| Under 5 Years | 0 (0.0%) | 0 (0.0%) |
| 5 Years | 0 (0.0%) | 0 (0.0%) |
| 6 to 11 Years | 2 (28.6%) | 0 (0.0%) |
| 12 to 14 Years | 2 (12.5%) | 0 (0.0%) |
| 15 Years | 0 (0.0%) | 0 (0.0%) |
| 16 and 17 Years | 0 (0.0%) | 0 (0.0%) |
| 18 to 24 Years | 0 (0.0%) | 0 (0.0%) |
| 25 to 34 Years | 0 (0.0%) | 0 (0.0%) |
| 35 to 44 Years | 0 (0.0%) | 1 (5.3%) |
| 45 to 54 Years | 0 (0.0%) | 2 (3.0%) |
| 55 to 64 Years | 2 (6.1%) | 0 (0.0%) |
| 65 to 74 Years | 0 (0.0%) | 0 (0.0%) |
| 75 Years and over | 2 (6.1%) | 3 (10.7%) |
| Total | 8 (3.8%) | 6 (2.9%) |
Income Above Poverty by Sex and Age in Bison
According to the poverty statistics in Bison, males aged under 5 years and females aged under 5 years are the age groups that are most secure financially, with 100.0% of males and 100.0% of females in these age groups living above the poverty line.
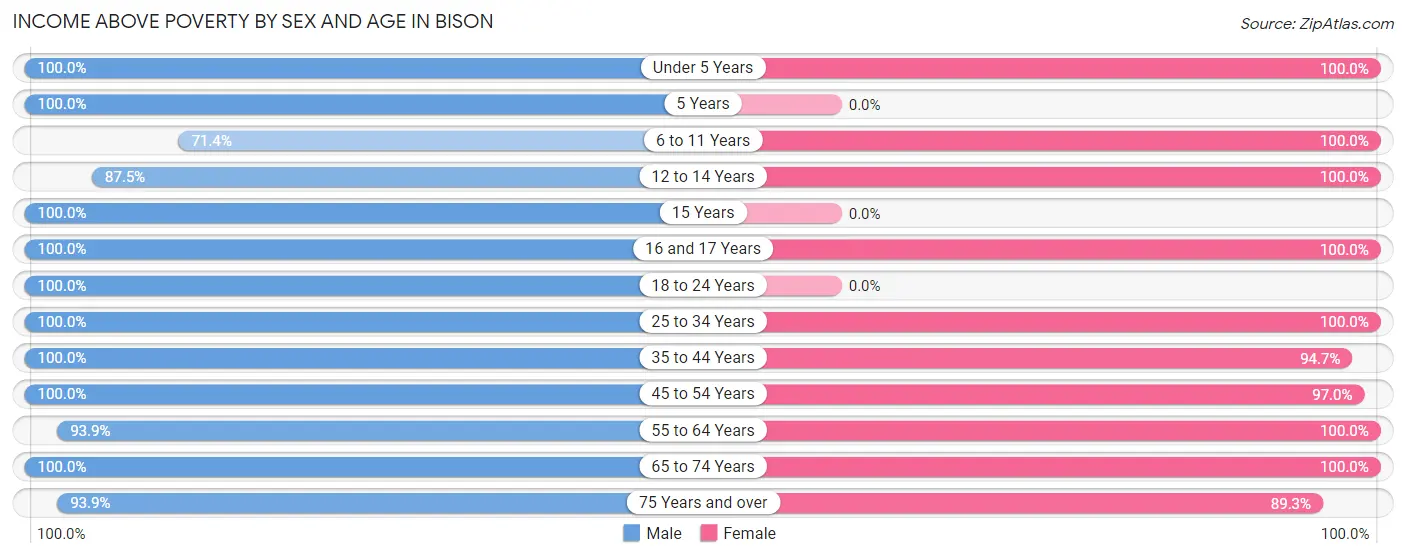
| Age Bracket | Male | Female |
| Under 5 Years | 22 (100.0%) | 7 (100.0%) |
| 5 Years | 4 (100.0%) | 0 (0.0%) |
| 6 to 11 Years | 5 (71.4%) | 17 (100.0%) |
| 12 to 14 Years | 14 (87.5%) | 4 (100.0%) |
| 15 Years | 4 (100.0%) | 0 (0.0%) |
| 16 and 17 Years | 1 (100.0%) | 9 (100.0%) |
| 18 to 24 Years | 2 (100.0%) | 0 (0.0%) |
| 25 to 34 Years | 13 (100.0%) | 7 (100.0%) |
| 35 to 44 Years | 36 (100.0%) | 18 (94.7%) |
| 45 to 54 Years | 18 (100.0%) | 64 (97.0%) |
| 55 to 64 Years | 31 (93.9%) | 23 (100.0%) |
| 65 to 74 Years | 24 (100.0%) | 24 (100.0%) |
| 75 Years and over | 31 (93.9%) | 25 (89.3%) |
| Total | 205 (96.2%) | 198 (97.1%) |
Income Below Poverty Among Married-Couple Families in Bison
The poverty statistics for married-couple families in Bison show that 0.8% or 1 of the total 123 families live below the poverty line. Families with no children have the highest poverty rate of 1.0%, comprising of 1 families. On the other hand, families with 1 or 2 children have the lowest poverty rate of 0.0%, which includes 0 families.
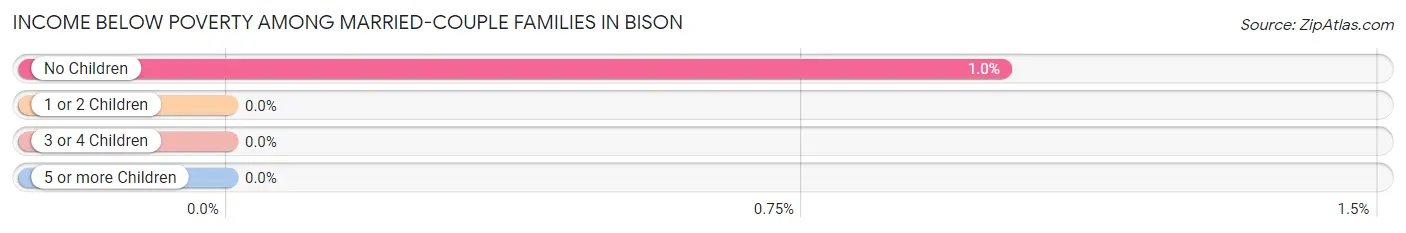
| Children | Above Poverty | Below Poverty |
| No Children | 98 (99.0%) | 1 (1.0%) |
| 1 or 2 Children | 15 (100.0%) | 0 (0.0%) |
| 3 or 4 Children | 9 (100.0%) | 0 (0.0%) |
| 5 or more Children | 0 (0.0%) | 0 (0.0%) |
| Total | 122 (99.2%) | 1 (0.8%) |
Income Below Poverty Among Single-Parent Households in Bison
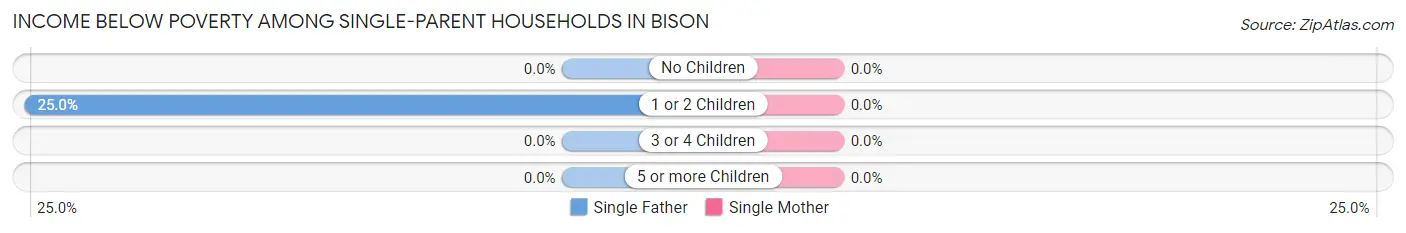
| Children | Single Father | Single Mother |
| No Children | 0 (0.0%) | 0 (0.0%) |
| 1 or 2 Children | 1 (25.0%) | 0 (0.0%) |
| 3 or 4 Children | 0 (0.0%) | 0 (0.0%) |
| 5 or more Children | 0 (0.0%) | 0 (0.0%) |
| Total | 1 (25.0%) | 0 (0.0%) |
Income Below Poverty Among Married-Couple vs Single-Parent Households in Bison
The poverty data for Bison shows that 1 of the married-couple family households (0.8%) and 1 of the single-parent households (3.5%) are living below the poverty level. Within the married-couple family households, those with no children have the highest poverty rate, with 1 households (1.0%) falling below the poverty line. Among the single-parent households, those with 1 or 2 children have the highest poverty rate, with 1 household (3.5%) living below poverty.
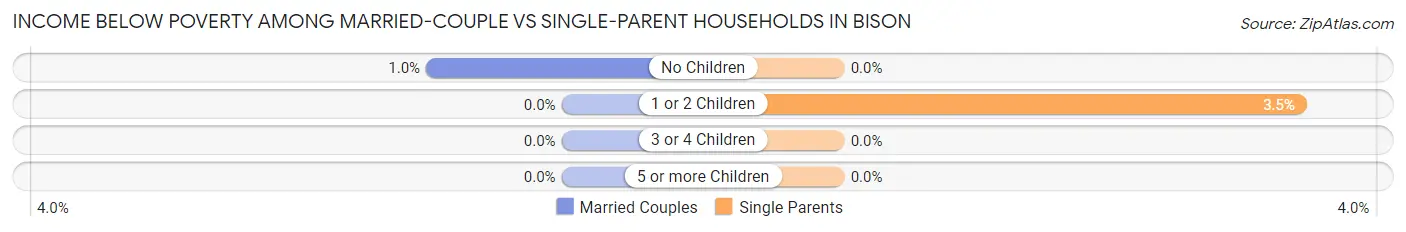
| Children | Married-Couple Families | Single-Parent Households |
| No Children | 1 (1.0%) | 0 (0.0%) |
| 1 or 2 Children | 0 (0.0%) | 1 (3.5%) |
| 3 or 4 Children | 0 (0.0%) | 0 (0.0%) |
| 5 or more Children | 0 (0.0%) | 0 (0.0%) |
| Total | 1 (0.8%) | 1 (3.5%) |
Race in Bison
The most populous races in Bison are White / Caucasian (401 | 96.2%), Two or more Races (12 | 2.9%), and Some other Race (4 | 1.0%).
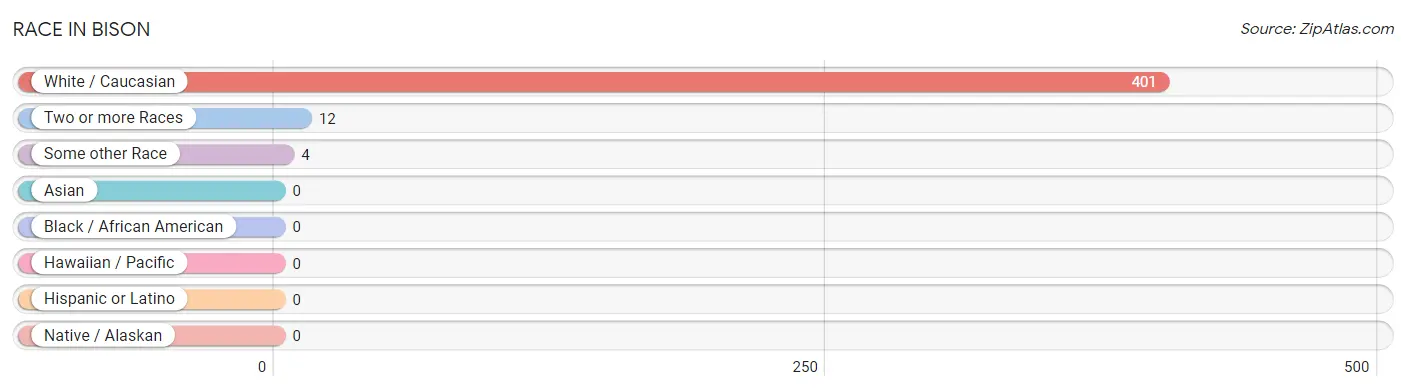
| Race | # Population | % Population |
| Asian | 0 | 0.0% |
| Black / African American | 0 | 0.0% |
| Hawaiian / Pacific | 0 | 0.0% |
| Hispanic or Latino | 0 | 0.0% |
| Native / Alaskan | 0 | 0.0% |
| White / Caucasian | 401 | 96.2% |
| Two or more Races | 12 | 2.9% |
| Some other Race | 4 | 1.0% |
| Total | 417 | 100.0% |
Ancestry in Bison
The most populous ancestries reported in Bison are German (127 | 30.5%), Norwegian (85 | 20.4%), American (79 | 18.9%), English (45 | 10.8%), and Irish (38 | 9.1%), together accounting for 89.7% of all Bison residents.
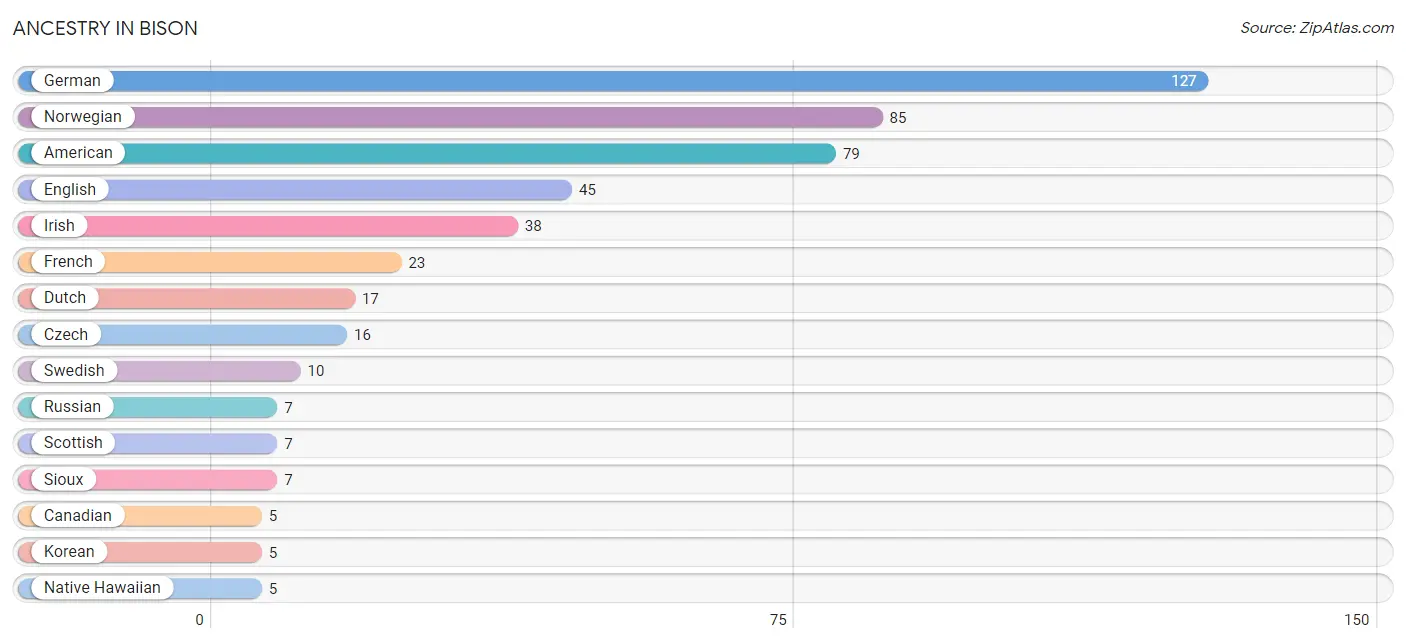
| Ancestry | # Population | % Population |
| American | 79 | 18.9% |
| British | 4 | 1.0% |
| Canadian | 5 | 1.2% |
| Czech | 16 | 3.8% |
| Dutch | 17 | 4.1% |
| English | 45 | 10.8% |
| French | 23 | 5.5% |
| German | 127 | 30.5% |
| Greek | 1 | 0.2% |
| Irish | 38 | 9.1% |
| Korean | 5 | 1.2% |
| Native Hawaiian | 5 | 1.2% |
| Norwegian | 85 | 20.4% |
| Polish | 1 | 0.2% |
| Russian | 7 | 1.7% |
| Scottish | 7 | 1.7% |
| Sioux | 7 | 1.7% |
| Swedish | 10 | 2.4% | View All 18 Rows |
Immigrants in Bison

| Immigration Origin | # Population | % Population | View All 0 Rows |
Sex and Age in Bison
Sex and Age in Bison
The most populous age groups in Bison are Under 5 Years (22 | 10.3%) for men and 45 to 49 Years (43 | 21.1%) for women.
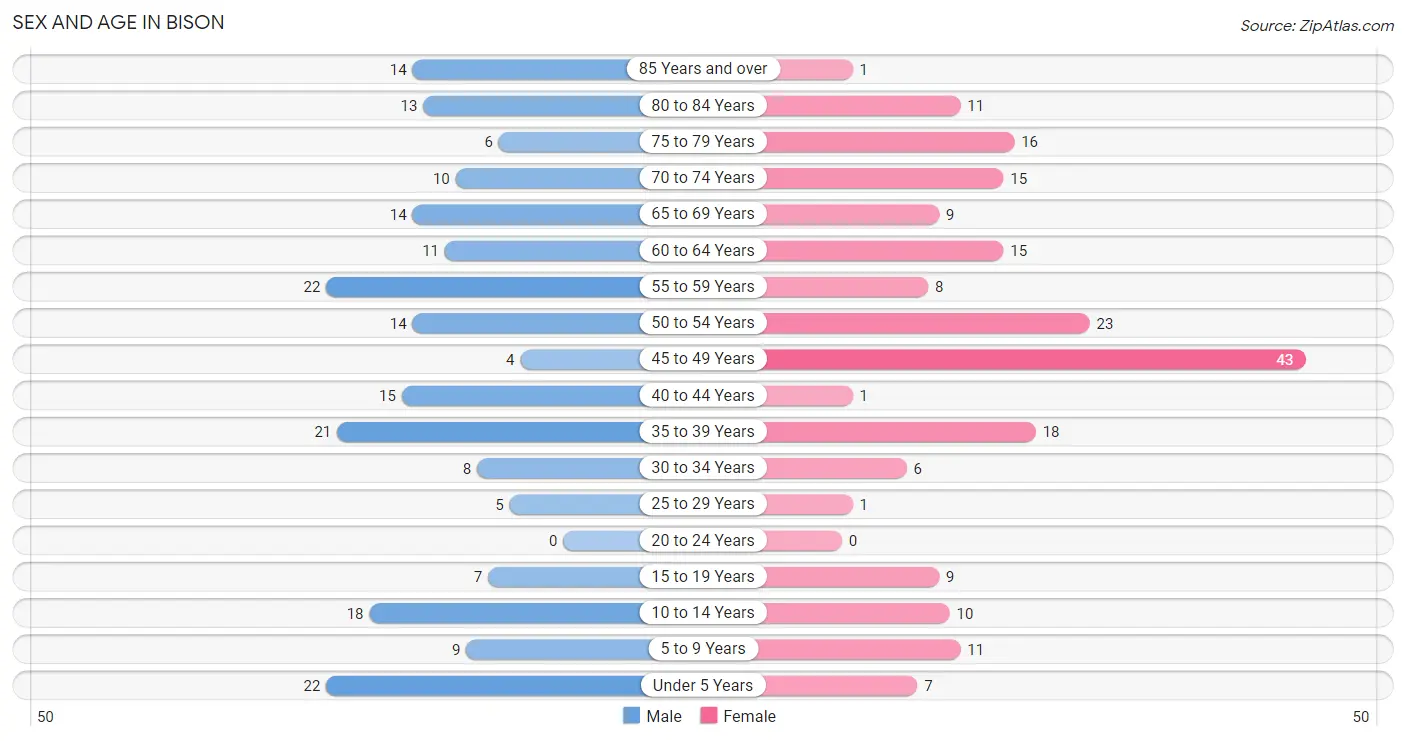
| Age Bracket | Male | Female |
| Under 5 Years | 22 (10.3%) | 7 (3.4%) |
| 5 to 9 Years | 9 (4.2%) | 11 (5.4%) |
| 10 to 14 Years | 18 (8.5%) | 10 (4.9%) |
| 15 to 19 Years | 7 (3.3%) | 9 (4.4%) |
| 20 to 24 Years | 0 (0.0%) | 0 (0.0%) |
| 25 to 29 Years | 5 (2.4%) | 1 (0.5%) |
| 30 to 34 Years | 8 (3.8%) | 6 (2.9%) |
| 35 to 39 Years | 21 (9.9%) | 18 (8.8%) |
| 40 to 44 Years | 15 (7.0%) | 1 (0.5%) |
| 45 to 49 Years | 4 (1.9%) | 43 (21.1%) |
| 50 to 54 Years | 14 (6.6%) | 23 (11.3%) |
| 55 to 59 Years | 22 (10.3%) | 8 (3.9%) |
| 60 to 64 Years | 11 (5.2%) | 15 (7.3%) |
| 65 to 69 Years | 14 (6.6%) | 9 (4.4%) |
| 70 to 74 Years | 10 (4.7%) | 15 (7.3%) |
| 75 to 79 Years | 6 (2.8%) | 16 (7.8%) |
| 80 to 84 Years | 13 (6.1%) | 11 (5.4%) |
| 85 Years and over | 14 (6.6%) | 1 (0.5%) |
| Total | 213 (100.0%) | 204 (100.0%) |
Families and Households in Bison
Median Family Size in Bison
The median family size in Bison is 2.38 persons per family, with single male/father families (4 | 2.6%) accounting for the largest median family size of 4.5 persons per family. On the other hand, single female/mother families (25 | 16.5%) represent the smallest median family size with 1.76 persons per family.
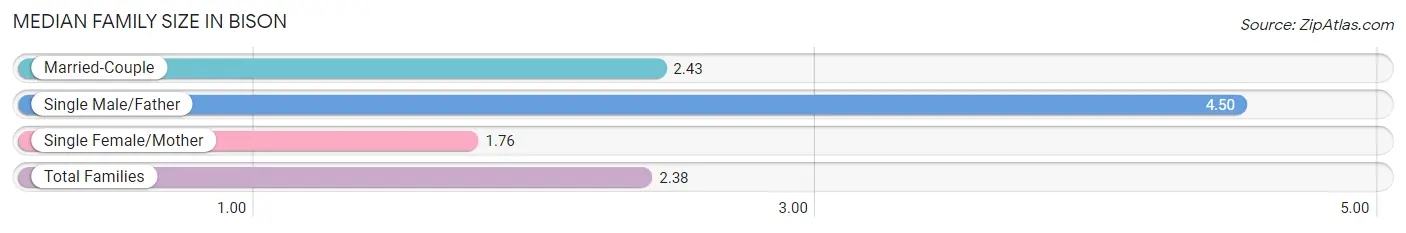
| Family Type | # Families | Family Size |
| Married-Couple | 123 (80.9%) | 2.43 |
| Single Male/Father | 4 (2.6%) | 4.50 |
| Single Female/Mother | 25 (16.5%) | 1.76 |
| Total Families | 152 (100.0%) | 2.38 |
Median Household Size in Bison
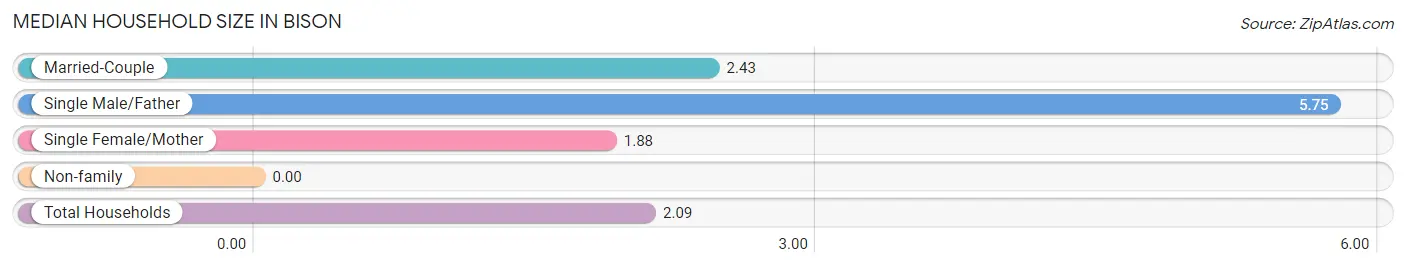
| Household Type | # Households | Household Size |
| Married-Couple | 123 (61.5%) | 2.43 |
| Single Male/Father | 4 (2.0%) | 5.75 |
| Single Female/Mother | 25 (12.5%) | 1.88 |
| Non-family | 48 (24.0%) | - |
| Total Households | 200 (100.0%) | 2.09 |
Household Size by Marriage Status in Bison
Out of a total of 200 households in Bison, 152 (76.0%) are family households, while 48 (24.0%) are nonfamily households. The most numerous type of family households are 2-person households, comprising 118, and the most common type of nonfamily households are 1-person households, comprising 48.
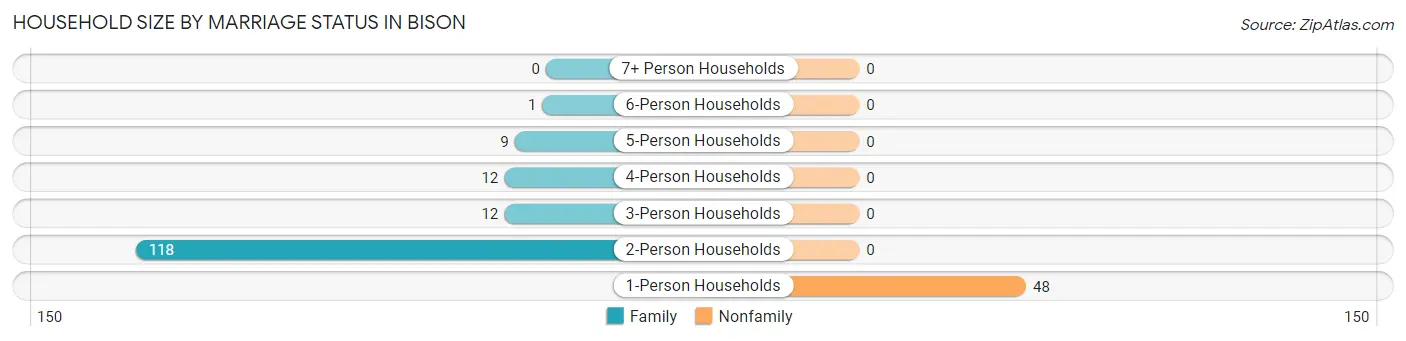
| Household Size | Family Households | Nonfamily Households |
| 1-Person Households | - | 48 (24.0%) |
| 2-Person Households | 118 (59.0%) | 0 (0.0%) |
| 3-Person Households | 12 (6.0%) | 0 (0.0%) |
| 4-Person Households | 12 (6.0%) | 0 (0.0%) |
| 5-Person Households | 9 (4.5%) | 0 (0.0%) |
| 6-Person Households | 1 (0.5%) | 0 (0.0%) |
| 7+ Person Households | 0 (0.0%) | 0 (0.0%) |
| Total | 152 (76.0%) | 48 (24.0%) |
Female Fertility in Bison
Fertility by Age in Bison
Average fertility rate in Bison is 83.0 births per 1,000 women. Women in the age bracket of 20 to 34 years have the highest fertility rate with 714.0 births per 1,000 women. Women in the age bracket of 20 to 34 years acount for 71.4% of all women with births.
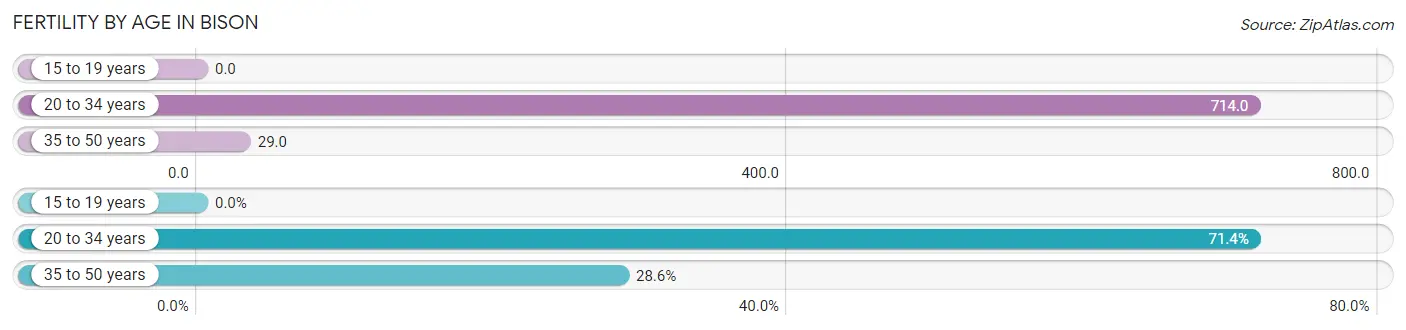
| Age Bracket | Women with Births | Births / 1,000 Women |
| 15 to 19 years | 0 (0.0%) | 0.0 |
| 20 to 34 years | 5 (71.4%) | 714.0 |
| 35 to 50 years | 2 (28.6%) | 29.0 |
| Total | 7 (100.0%) | 83.0 |
Fertility by Age by Marriage Status in Bison
85.7% of women with births (7) in Bison are married. The highest percentage of unmarried women with births falls into 20 to 34 years age bracket with 20.0% of them unmarried at the time of birth, while the lowest percentage of unmarried women with births belong to 35 to 50 years age bracket with 0.0% of them unmarried.
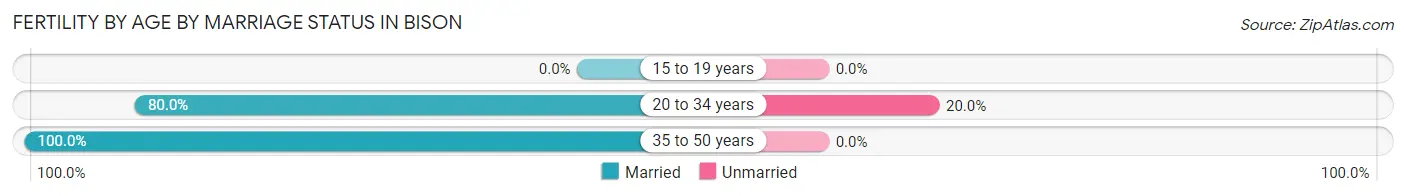
| Age Bracket | Married | Unmarried |
| 15 to 19 years | 0 (0.0%) | 0 (0.0%) |
| 20 to 34 years | 4 (80.0%) | 1 (20.0%) |
| 35 to 50 years | 2 (100.0%) | 0 (0.0%) |
| Total | 6 (85.7%) | 1 (14.3%) |
Fertility by Education in Bison
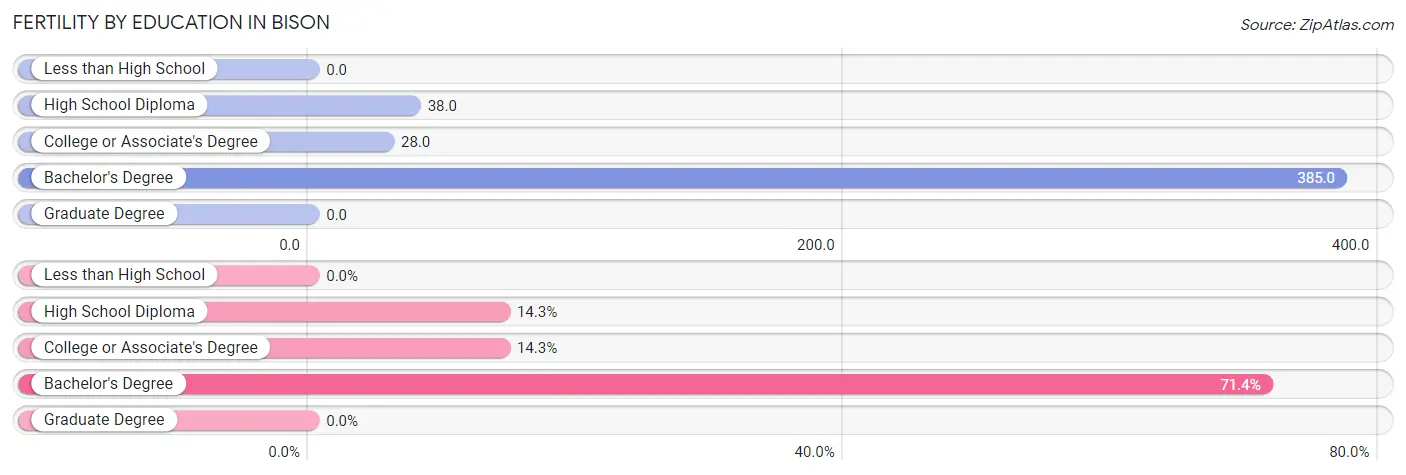
| Educational Attainment | Women with Births | Births / 1,000 Women |
| Less than High School | 0 (0.0%) | 0.0 |
| High School Diploma | 1 (14.3%) | 38.0 |
| College or Associate's Degree | 1 (14.3%) | 28.0 |
| Bachelor's Degree | 5 (71.4%) | 385.0 |
| Graduate Degree | 0 (0.0%) | 0.0 |
| Total | 7 (100.0%) | 83.0 |
Fertility by Education by Marriage Status in Bison
14.3% of women with births in Bison are unmarried. Women with the educational attainment of high school diploma are most likely to be married with 100.0% of them married at childbirth, while women with the educational attainment of bachelor's degree are least likely to be married with 20.0% of them unmarried at childbirth.
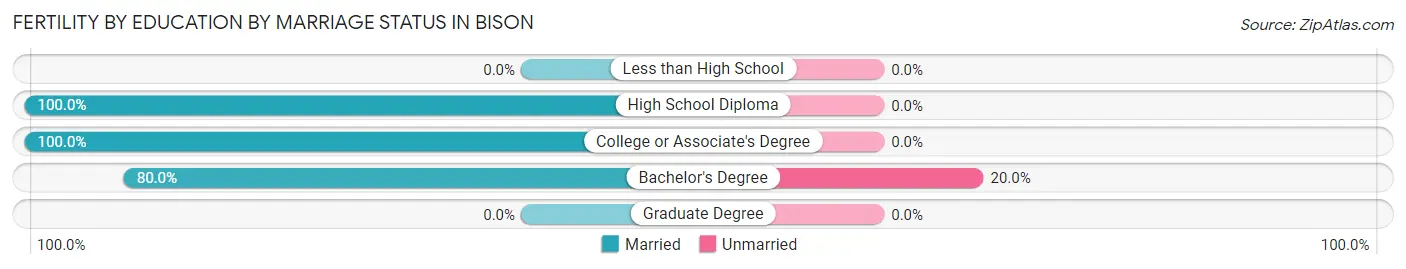
| Educational Attainment | Married | Unmarried |
| Less than High School | 0 (0.0%) | 0 (0.0%) |
| High School Diploma | 1 (100.0%) | 0 (0.0%) |
| College or Associate's Degree | 1 (100.0%) | 0 (0.0%) |
| Bachelor's Degree | 4 (80.0%) | 1 (20.0%) |
| Graduate Degree | 0 (0.0%) | 0 (0.0%) |
| Total | 6 (85.7%) | 1 (14.3%) |
Employment Characteristics in Bison
Employment by Class of Employer in Bison
Among the 223 employed individuals in Bison, private company employees (79 | 35.4%), self-employed (not incorporated) (55 | 24.7%), and local government employees (52 | 23.3%) make up the most common classes of employment.
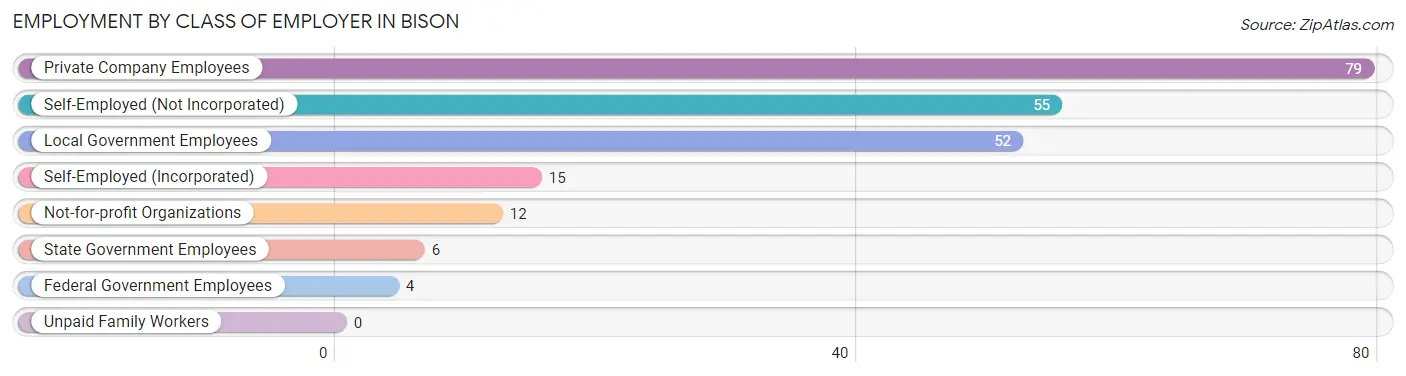
| Employer Class | # Employees | % Employees |
| Private Company Employees | 79 | 35.4% |
| Self-Employed (Incorporated) | 15 | 6.7% |
| Self-Employed (Not Incorporated) | 55 | 24.7% |
| Not-for-profit Organizations | 12 | 5.4% |
| Local Government Employees | 52 | 23.3% |
| State Government Employees | 6 | 2.7% |
| Federal Government Employees | 4 | 1.8% |
| Unpaid Family Workers | 0 | 0.0% |
| Total | 223 | 100.0% |
Employment Status by Age in Bison
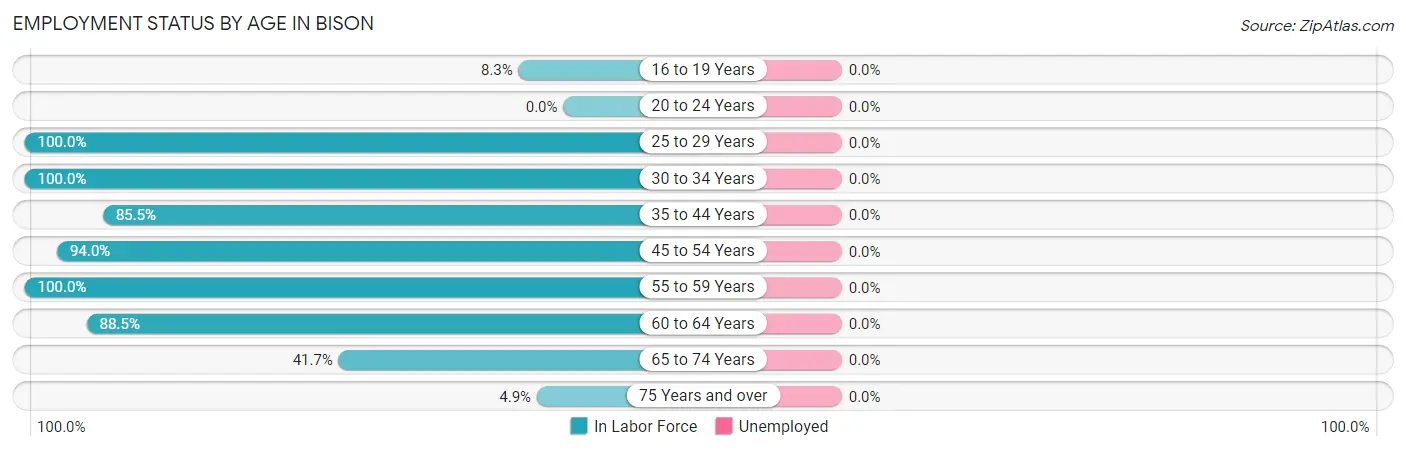
| Age Bracket | In Labor Force | Unemployed |
| 16 to 19 Years | 1 (8.3%) | 0 (0.0%) |
| 20 to 24 Years | 0 (0.0%) | 0 (0.0%) |
| 25 to 29 Years | 6 (100.0%) | 0 (0.0%) |
| 30 to 34 Years | 14 (100.0%) | 0 (0.0%) |
| 35 to 44 Years | 47 (85.5%) | 0 (0.0%) |
| 45 to 54 Years | 79 (94.0%) | 0 (0.0%) |
| 55 to 59 Years | 30 (100.0%) | 0 (0.0%) |
| 60 to 64 Years | 23 (88.5%) | 0 (0.0%) |
| 65 to 74 Years | 20 (41.7%) | 0 (0.0%) |
| 75 Years and over | 3 (4.9%) | 0 (0.0%) |
| Total | 223 (66.4%) | 0 (0.0%) |
Employment Status by Educational Attainment in Bison
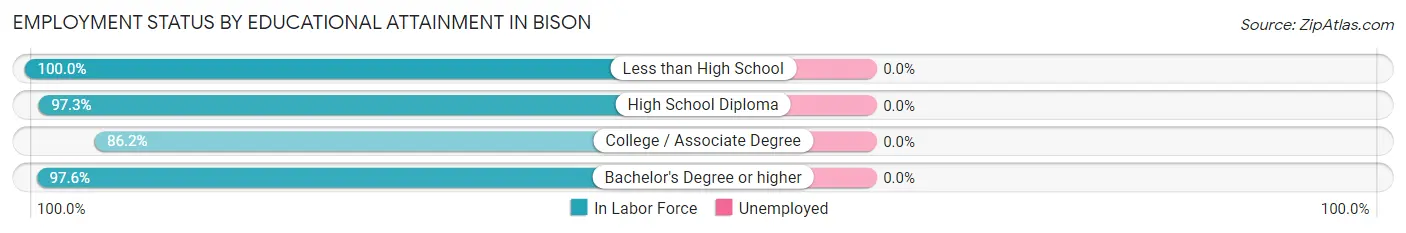
| Educational Attainment | In Labor Force | Unemployed |
| Less than High School | 4 (100.0%) | 0 (0.0%) |
| High School Diploma | 73 (97.3%) | 0 (0.0%) |
| College / Associate Degree | 81 (86.2%) | 0 (0.0%) |
| Bachelor's Degree or higher | 41 (97.6%) | 0 (0.0%) |
| Total | 199 (92.6%) | 0 (0.0%) |
Employment Occupations by Sex in Bison
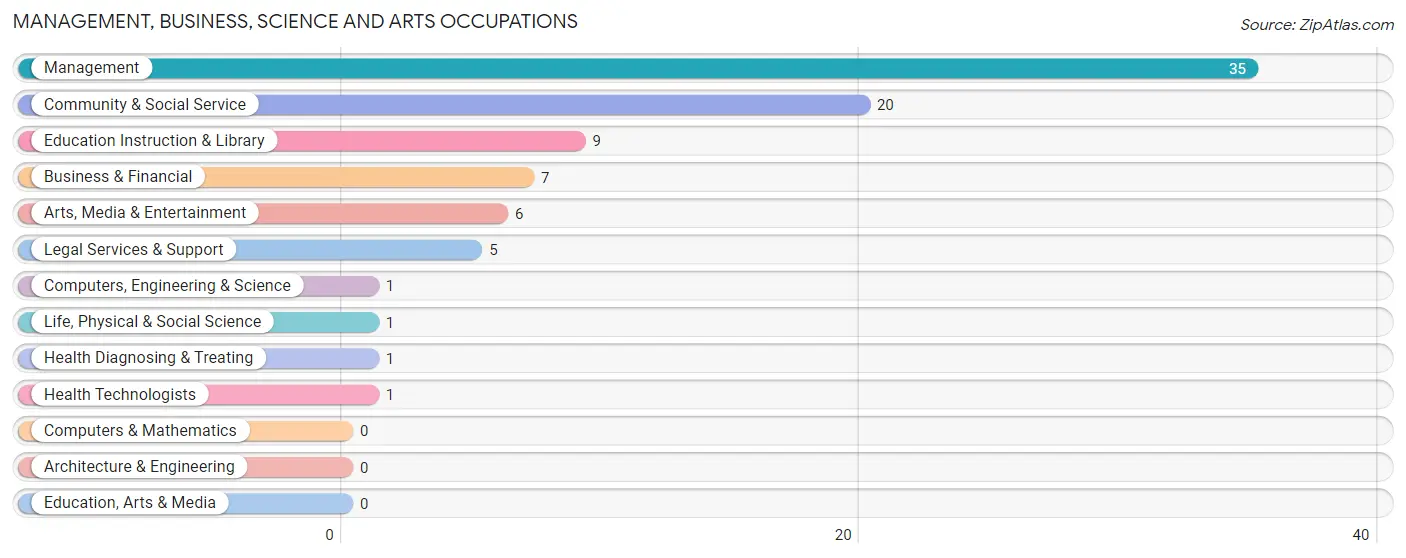
Management, Business, Science and Arts Occupations
The most common Management, Business, Science and Arts occupations in Bison are Management (35 | 15.7%), Community & Social Service (20 | 9.0%), Education Instruction & Library (9 | 4.0%), Business & Financial (7 | 3.1%), and Arts, Media & Entertainment (6 | 2.7%).
Management, Business, Science and Arts Occupations by Sex
Within the Management, Business, Science and Arts occupations in Bison, the most male-oriented occupations are Management (65.7%), Business & Financial (57.1%), and Arts, Media & Entertainment (50.0%), while the most female-oriented occupations are Computers, Engineering & Science (100.0%), Life, Physical & Social Science (100.0%), and Legal Services & Support (100.0%).
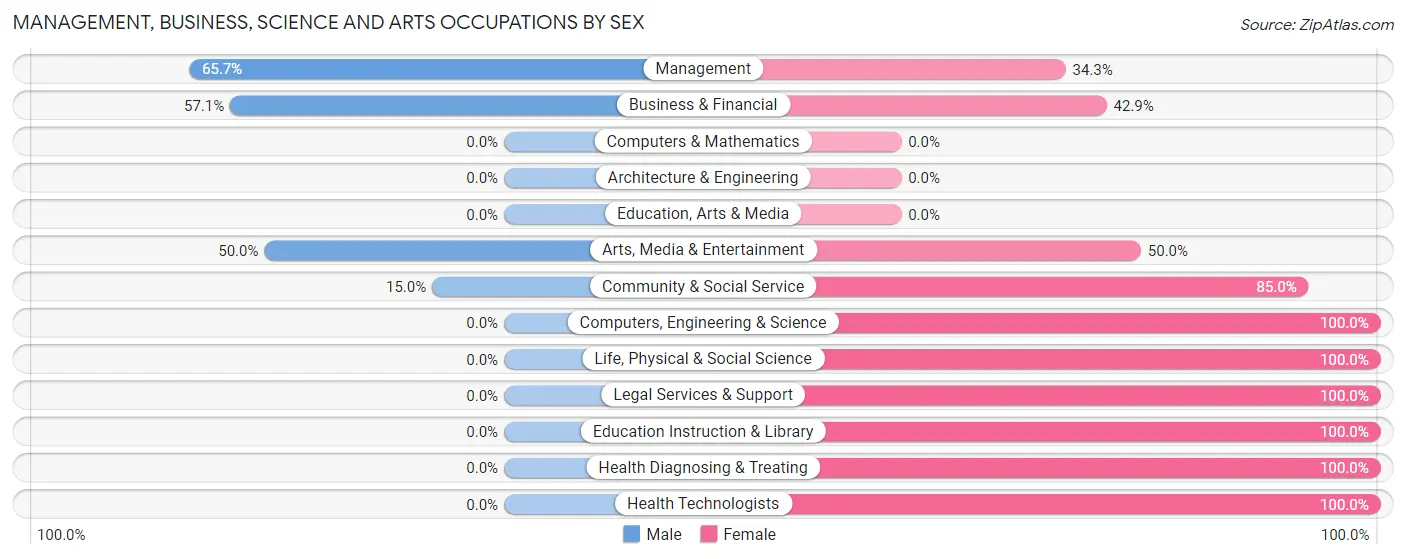
| Occupation | Male | Female |
| Management | 23 (65.7%) | 12 (34.3%) |
| Business & Financial | 4 (57.1%) | 3 (42.9%) |
| Computers, Engineering & Science | 0 (0.0%) | 1 (100.0%) |
| Computers & Mathematics | 0 (0.0%) | 0 (0.0%) |
| Architecture & Engineering | 0 (0.0%) | 0 (0.0%) |
| Life, Physical & Social Science | 0 (0.0%) | 1 (100.0%) |
| Community & Social Service | 3 (15.0%) | 17 (85.0%) |
| Education, Arts & Media | 0 (0.0%) | 0 (0.0%) |
| Legal Services & Support | 0 (0.0%) | 5 (100.0%) |
| Education Instruction & Library | 0 (0.0%) | 9 (100.0%) |
| Arts, Media & Entertainment | 3 (50.0%) | 3 (50.0%) |
| Health Diagnosing & Treating | 0 (0.0%) | 1 (100.0%) |
| Health Technologists | 0 (0.0%) | 1 (100.0%) |
| Total (Category) | 30 (46.9%) | 34 (53.1%) |
| Total (Overall) | 115 (51.6%) | 108 (48.4%) |
Services Occupations
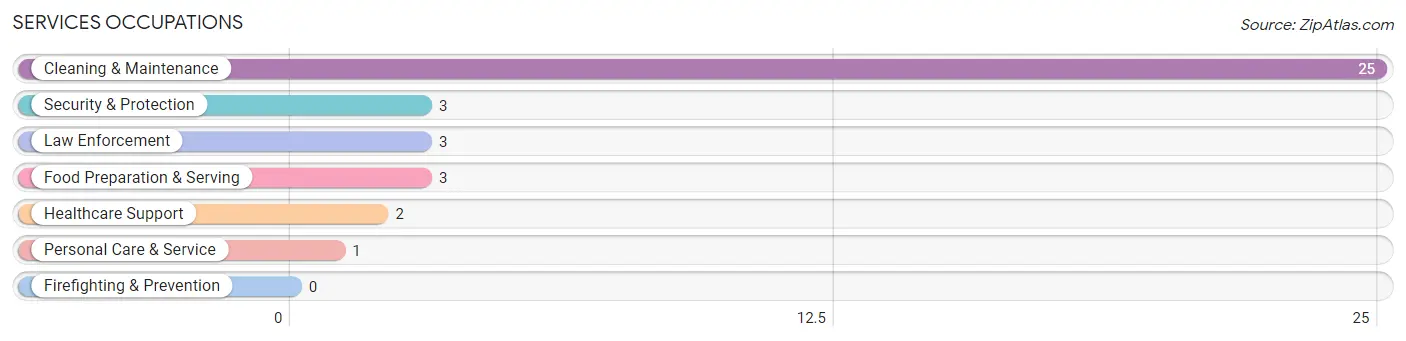
The most common Services occupations in Bison are Cleaning & Maintenance (25 | 11.2%), Security & Protection (3 | 1.3%), Law Enforcement (3 | 1.3%), Food Preparation & Serving (3 | 1.3%), and Healthcare Support (2 | 0.9%).
Services Occupations by Sex
Within the Services occupations in Bison, the most male-oriented occupations are Security & Protection (100.0%), Law Enforcement (100.0%), and Food Preparation & Serving (33.3%), while the most female-oriented occupations are Healthcare Support (100.0%), Cleaning & Maintenance (100.0%), and Personal Care & Service (100.0%).
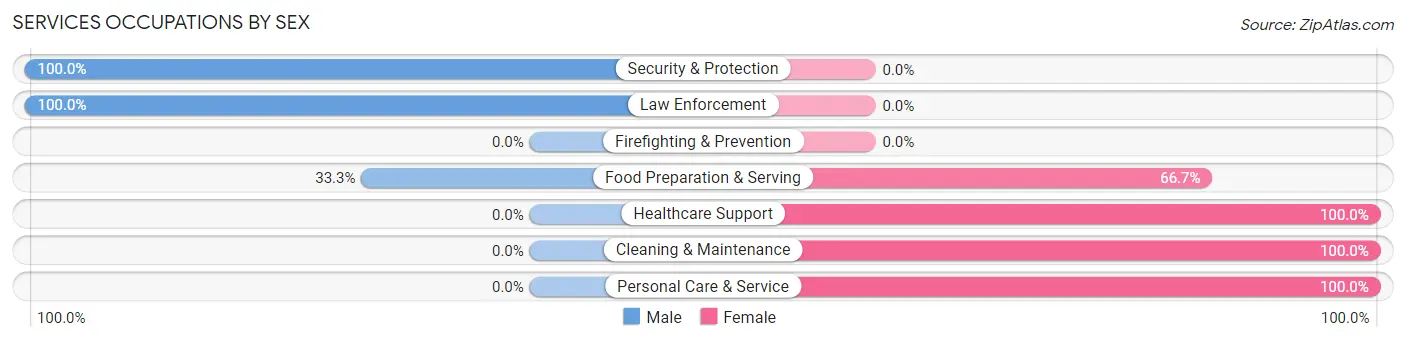
| Occupation | Male | Female |
| Healthcare Support | 0 (0.0%) | 2 (100.0%) |
| Security & Protection | 3 (100.0%) | 0 (0.0%) |
| Firefighting & Prevention | 0 (0.0%) | 0 (0.0%) |
| Law Enforcement | 3 (100.0%) | 0 (0.0%) |
| Food Preparation & Serving | 1 (33.3%) | 2 (66.7%) |
| Cleaning & Maintenance | 0 (0.0%) | 25 (100.0%) |
| Personal Care & Service | 0 (0.0%) | 1 (100.0%) |
| Total (Category) | 4 (11.8%) | 30 (88.2%) |
| Total (Overall) | 115 (51.6%) | 108 (48.4%) |
Sales and Office Occupations
The most common Sales and Office occupations in Bison are Office & Administration (37 | 16.6%), and Sales & Related (19 | 8.5%).

Sales and Office Occupations by Sex

| Occupation | Male | Female |
| Sales & Related | 16 (84.2%) | 3 (15.8%) |
| Office & Administration | 5 (13.5%) | 32 (86.5%) |
| Total (Category) | 21 (37.5%) | 35 (62.5%) |
| Total (Overall) | 115 (51.6%) | 108 (48.4%) |
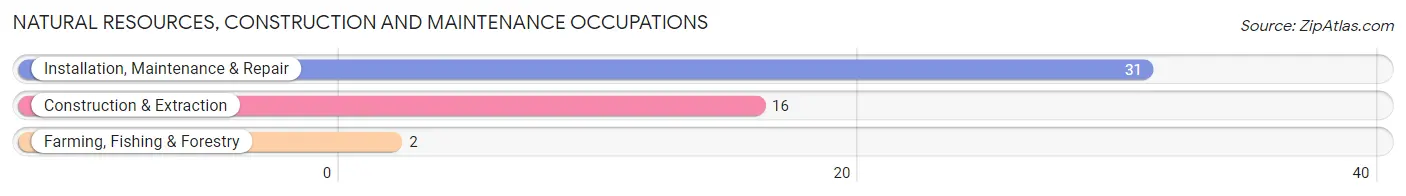
Natural Resources, Construction and Maintenance Occupations
The most common Natural Resources, Construction and Maintenance occupations in Bison are Installation, Maintenance & Repair (31 | 13.9%), Construction & Extraction (16 | 7.2%), and Farming, Fishing & Forestry (2 | 0.9%).
Natural Resources, Construction and Maintenance Occupations by Sex
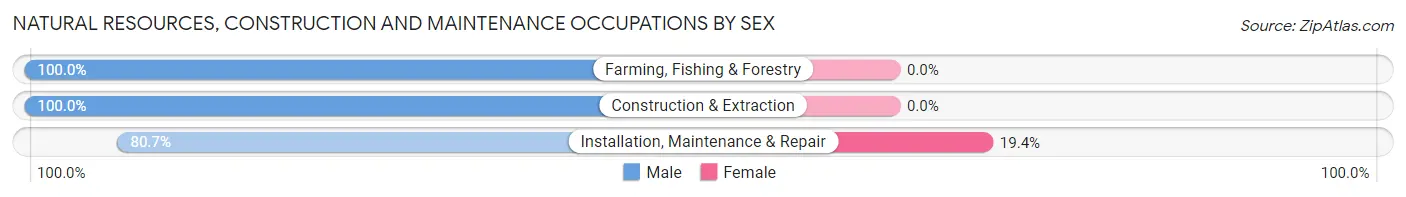
| Occupation | Male | Female |
| Farming, Fishing & Forestry | 2 (100.0%) | 0 (0.0%) |
| Construction & Extraction | 16 (100.0%) | 0 (0.0%) |
| Installation, Maintenance & Repair | 25 (80.6%) | 6 (19.4%) |
| Total (Category) | 43 (87.8%) | 6 (12.2%) |
| Total (Overall) | 115 (51.6%) | 108 (48.4%) |
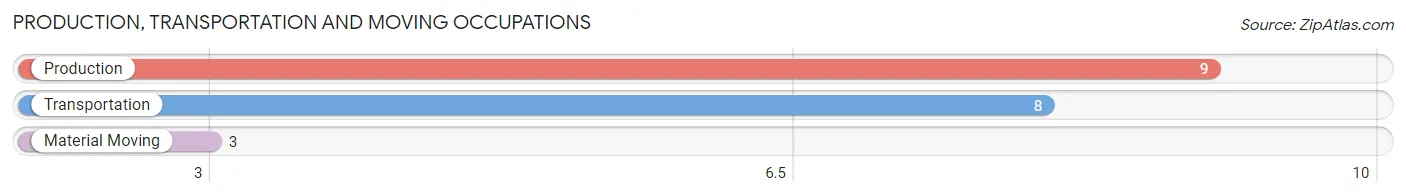
Production, Transportation and Moving Occupations
The most common Production, Transportation and Moving occupations in Bison are Production (9 | 4.0%), Transportation (8 | 3.6%), and Material Moving (3 | 1.3%).
Production, Transportation and Moving Occupations by Sex
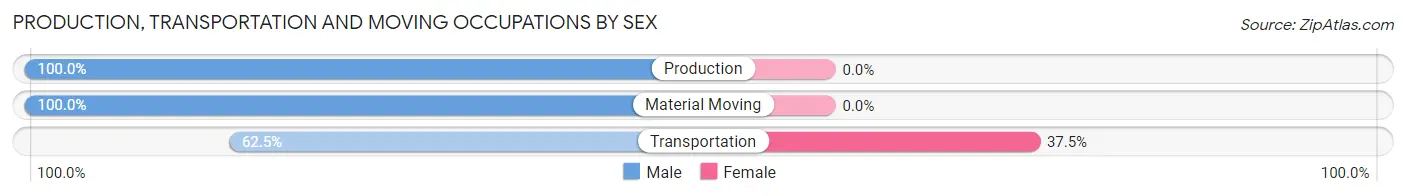
| Occupation | Male | Female |
| Production | 9 (100.0%) | 0 (0.0%) |
| Transportation | 5 (62.5%) | 3 (37.5%) |
| Material Moving | 3 (100.0%) | 0 (0.0%) |
| Total (Category) | 17 (85.0%) | 3 (15.0%) |
| Total (Overall) | 115 (51.6%) | 108 (48.4%) |
Employment Industries by Sex in Bison
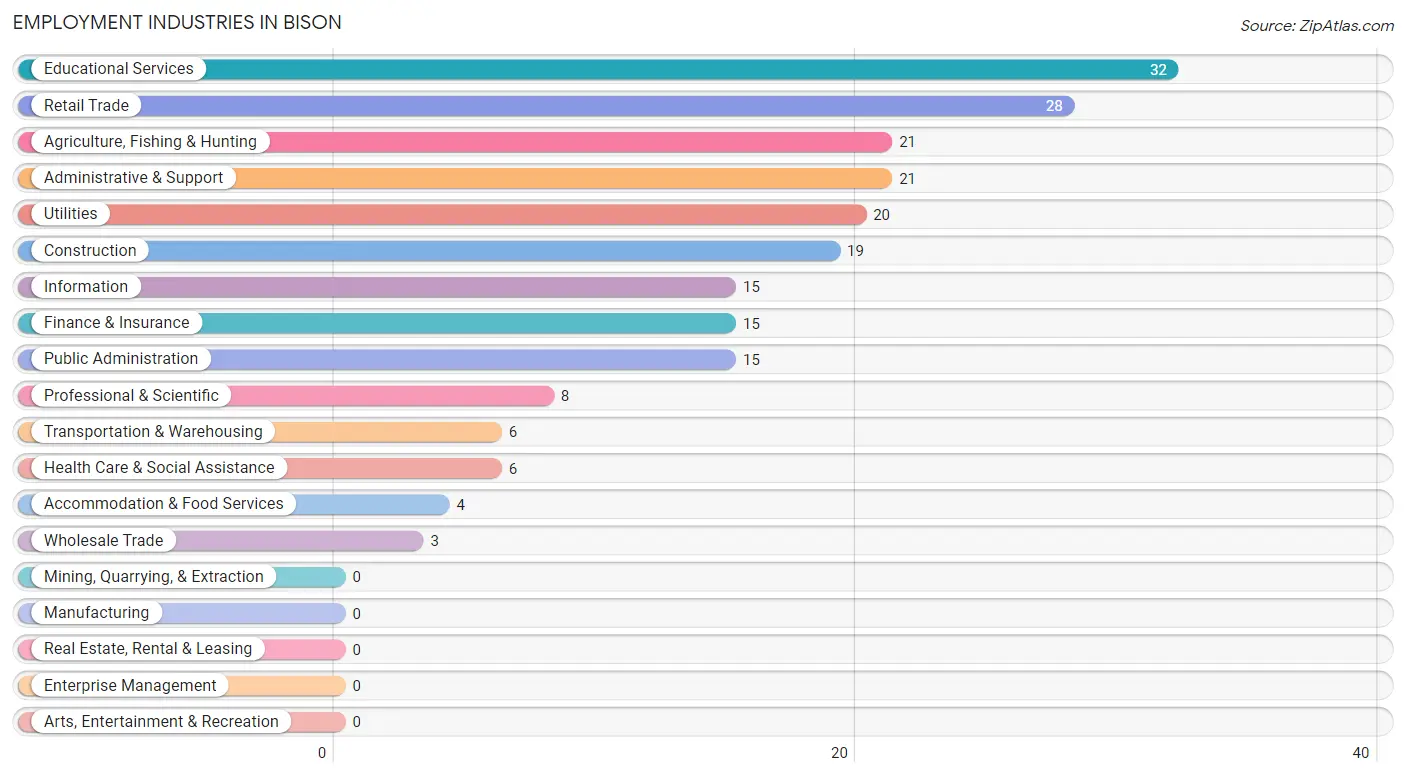
Employment Industries in Bison
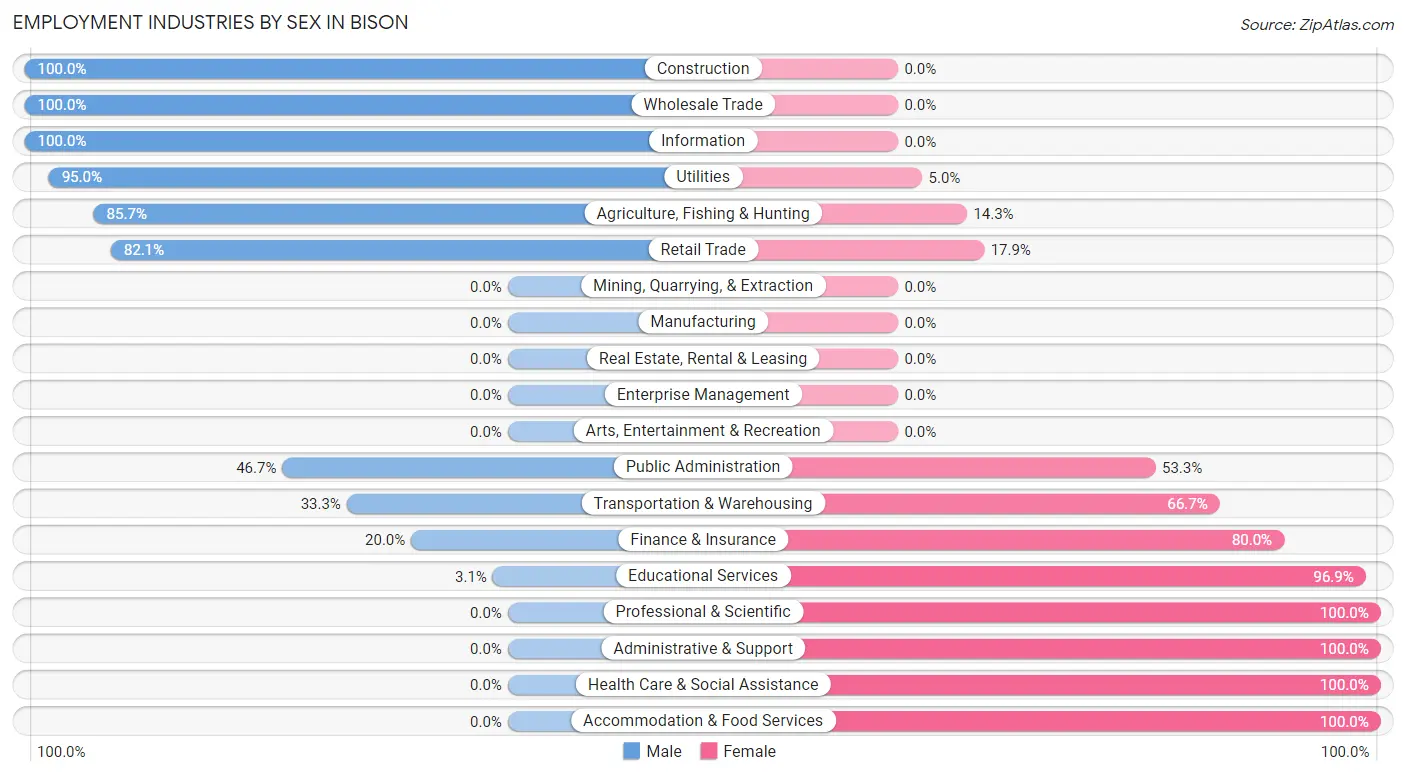
The major employment industries in Bison include Educational Services (32 | 14.3%), Retail Trade (28 | 12.6%), Agriculture, Fishing & Hunting (21 | 9.4%), Administrative & Support (21 | 9.4%), and Utilities (20 | 9.0%).
Employment Industries by Sex in Bison
The Bison industries that see more men than women are Construction (100.0%), Wholesale Trade (100.0%), and Information (100.0%), whereas the industries that tend to have a higher number of women are Professional & Scientific (100.0%), Administrative & Support (100.0%), and Health Care & Social Assistance (100.0%).
| Industry | Male | Female |
| Agriculture, Fishing & Hunting | 18 (85.7%) | 3 (14.3%) |
| Mining, Quarrying, & Extraction | 0 (0.0%) | 0 (0.0%) |
| Construction | 19 (100.0%) | 0 (0.0%) |
| Manufacturing | 0 (0.0%) | 0 (0.0%) |
| Wholesale Trade | 3 (100.0%) | 0 (0.0%) |
| Retail Trade | 23 (82.1%) | 5 (17.9%) |
| Transportation & Warehousing | 2 (33.3%) | 4 (66.7%) |
| Utilities | 19 (95.0%) | 1 (5.0%) |
| Information | 15 (100.0%) | 0 (0.0%) |
| Finance & Insurance | 3 (20.0%) | 12 (80.0%) |
| Real Estate, Rental & Leasing | 0 (0.0%) | 0 (0.0%) |
| Professional & Scientific | 0 (0.0%) | 8 (100.0%) |
| Enterprise Management | 0 (0.0%) | 0 (0.0%) |
| Administrative & Support | 0 (0.0%) | 21 (100.0%) |
| Educational Services | 1 (3.1%) | 31 (96.9%) |
| Health Care & Social Assistance | 0 (0.0%) | 6 (100.0%) |
| Arts, Entertainment & Recreation | 0 (0.0%) | 0 (0.0%) |
| Accommodation & Food Services | 0 (0.0%) | 4 (100.0%) |
| Public Administration | 7 (46.7%) | 8 (53.3%) |
| Total | 115 (51.6%) | 108 (48.4%) |
Education in Bison
School Enrollment in Bison
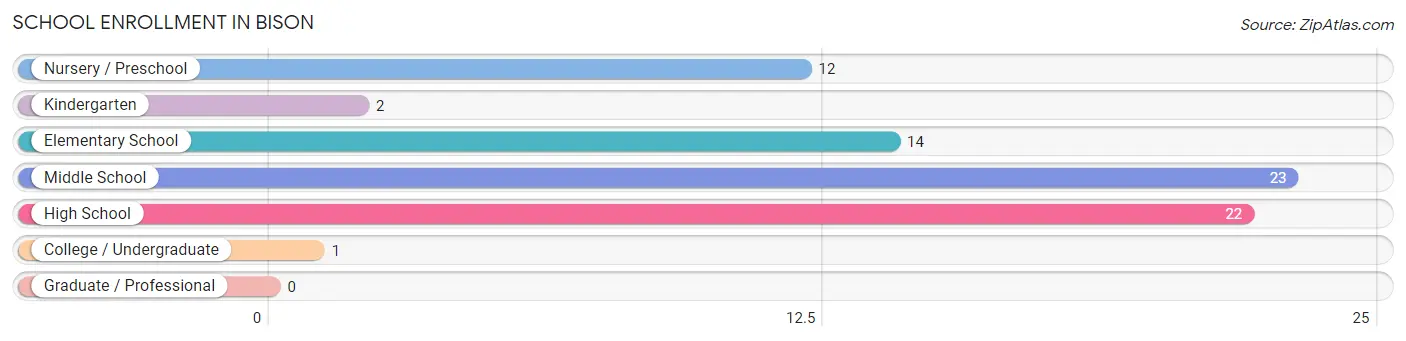
The most common levels of schooling among the 74 students in Bison are middle school (23 | 31.1%), high school (22 | 29.7%), and elementary school (14 | 18.9%).
| School Level | # Students | % Students |
| Nursery / Preschool | 12 | 16.2% |
| Kindergarten | 2 | 2.7% |
| Elementary School | 14 | 18.9% |
| Middle School | 23 | 31.1% |
| High School | 22 | 29.7% |
| College / Undergraduate | 1 | 1.3% |
| Graduate / Professional | 0 | 0.0% |
| Total | 74 | 100.0% |
School Enrollment by Age by Funding Source in Bison
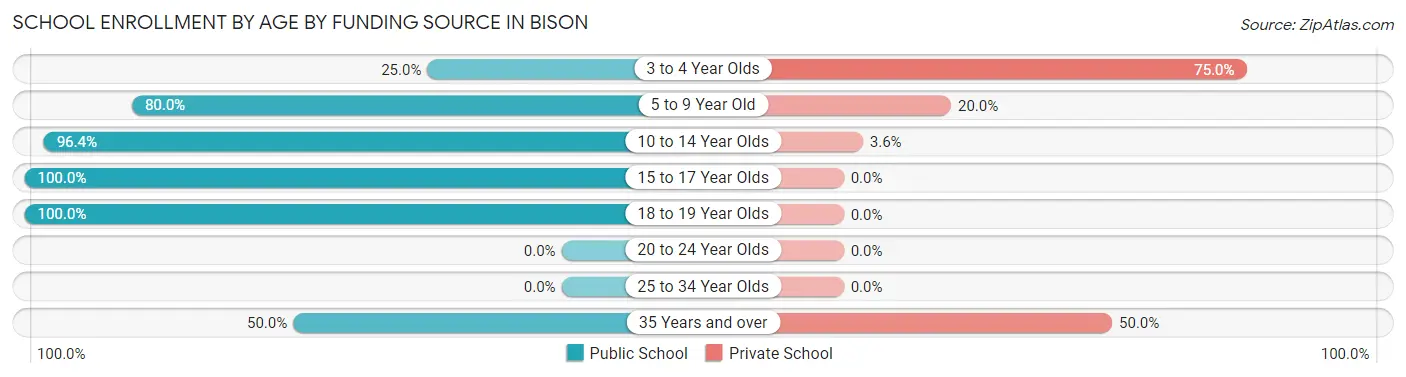
Out of a total of 74 students who are enrolled in schools in Bison, 12 (16.2%) attend a private institution, while the remaining 62 (83.8%) are enrolled in public schools. The age group of 3 to 4 year olds has the highest likelihood of being enrolled in private schools, with 6 (75.0% in the age bracket) enrolled. Conversely, the age group of 15 to 17 year olds has the lowest likelihood of being enrolled in a private school, with 14 (100.0% in the age bracket) attending a public institution.
| Age Bracket | Public School | Private School |
| 3 to 4 Year Olds | 2 (25.0%) | 6 (75.0%) |
| 5 to 9 Year Old | 16 (80.0%) | 4 (20.0%) |
| 10 to 14 Year Olds | 27 (96.4%) | 1 (3.6%) |
| 15 to 17 Year Olds | 14 (100.0%) | 0 (0.0%) |
| 18 to 19 Year Olds | 2 (100.0%) | 0 (0.0%) |
| 20 to 24 Year Olds | 0 (0.0%) | 0 (0.0%) |
| 25 to 34 Year Olds | 0 (0.0%) | 0 (0.0%) |
| 35 Years and over | 1 (50.0%) | 1 (50.0%) |
| Total | 62 (83.8%) | 12 (16.2%) |
Educational Attainment by Field of Study in Bison
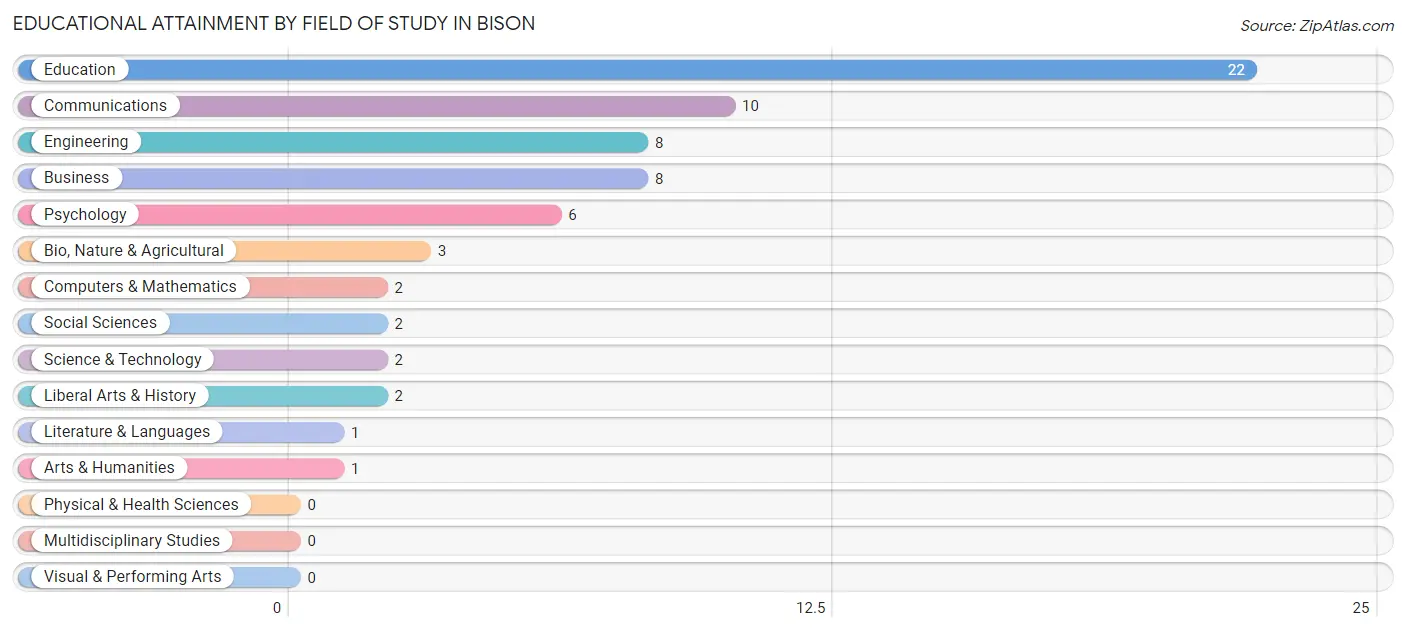
Education (22 | 32.8%), communications (10 | 14.9%), engineering (8 | 11.9%), business (8 | 11.9%), and psychology (6 | 9.0%) are the most common fields of study among 67 individuals in Bison who have obtained a bachelor's degree or higher.
| Field of Study | # Graduates | % Graduates |
| Computers & Mathematics | 2 | 3.0% |
| Bio, Nature & Agricultural | 3 | 4.5% |
| Physical & Health Sciences | 0 | 0.0% |
| Psychology | 6 | 9.0% |
| Social Sciences | 2 | 3.0% |
| Engineering | 8 | 11.9% |
| Multidisciplinary Studies | 0 | 0.0% |
| Science & Technology | 2 | 3.0% |
| Business | 8 | 11.9% |
| Education | 22 | 32.8% |
| Literature & Languages | 1 | 1.5% |
| Liberal Arts & History | 2 | 3.0% |
| Visual & Performing Arts | 0 | 0.0% |
| Communications | 10 | 14.9% |
| Arts & Humanities | 1 | 1.5% |
| Total | 67 | 100.0% |
Transportation & Commute in Bison
Vehicle Availability by Sex in Bison
The most prevalent vehicle ownership categories in Bison are males with 3 vehicles (51, accounting for 44.4%) and females with 3 vehicles (51, making up 47.2%).
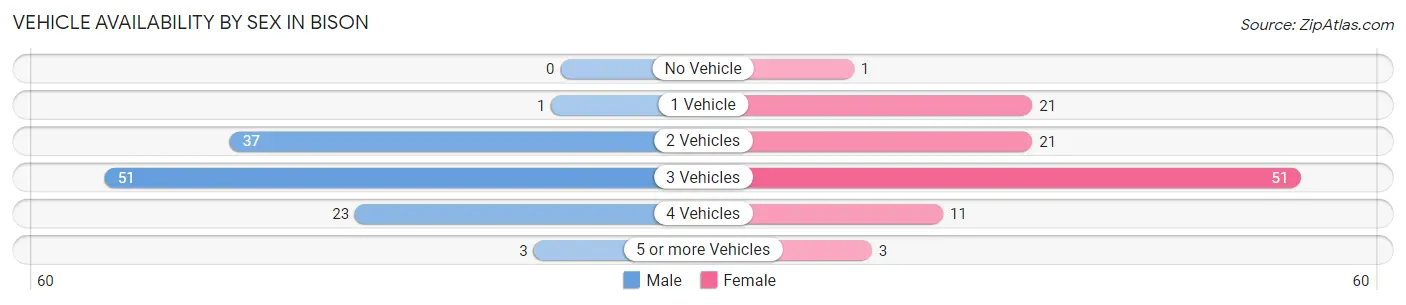
| Vehicles Available | Male | Female |
| No Vehicle | 0 (0.0%) | 1 (0.9%) |
| 1 Vehicle | 1 (0.9%) | 21 (19.4%) |
| 2 Vehicles | 37 (32.2%) | 21 (19.4%) |
| 3 Vehicles | 51 (44.4%) | 51 (47.2%) |
| 4 Vehicles | 23 (20.0%) | 11 (10.2%) |
| 5 or more Vehicles | 3 (2.6%) | 3 (2.8%) |
| Total | 115 (100.0%) | 108 (100.0%) |
Commute Time in Bison
The most frequently occuring commute durations in Bison are 5 to 9 minutes (74 commuters, 37.4%), less than 5 minutes (67 commuters, 33.8%), and 10 to 14 minutes (27 commuters, 13.6%).
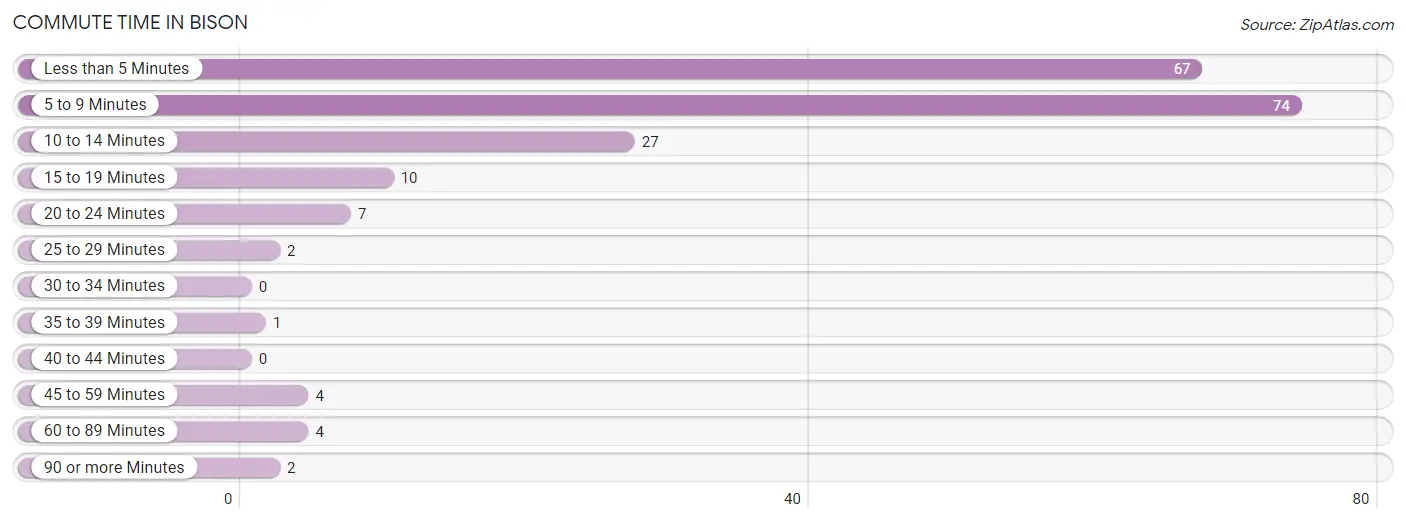
| Commute Time | # Commuters | % Commuters |
| Less than 5 Minutes | 67 | 33.8% |
| 5 to 9 Minutes | 74 | 37.4% |
| 10 to 14 Minutes | 27 | 13.6% |
| 15 to 19 Minutes | 10 | 5.1% |
| 20 to 24 Minutes | 7 | 3.5% |
| 25 to 29 Minutes | 2 | 1.0% |
| 30 to 34 Minutes | 0 | 0.0% |
| 35 to 39 Minutes | 1 | 0.5% |
| 40 to 44 Minutes | 0 | 0.0% |
| 45 to 59 Minutes | 4 | 2.0% |
| 60 to 89 Minutes | 4 | 2.0% |
| 90 or more Minutes | 2 | 1.0% |
Commute Time by Sex in Bison
The most common commute times in Bison are less than 5 minutes (38 commuters, 33.0%) for males and 5 to 9 minutes (42 commuters, 50.6%) for females.
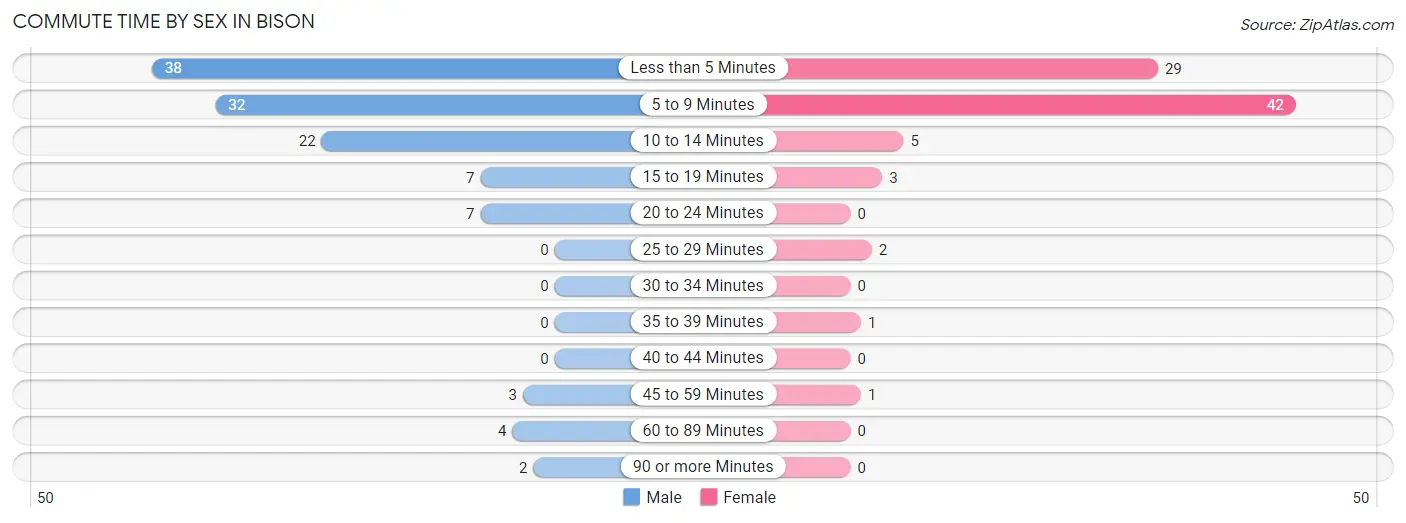
| Commute Time | Male | Female |
| Less than 5 Minutes | 38 (33.0%) | 29 (34.9%) |
| 5 to 9 Minutes | 32 (27.8%) | 42 (50.6%) |
| 10 to 14 Minutes | 22 (19.1%) | 5 (6.0%) |
| 15 to 19 Minutes | 7 (6.1%) | 3 (3.6%) |
| 20 to 24 Minutes | 7 (6.1%) | 0 (0.0%) |
| 25 to 29 Minutes | 0 (0.0%) | 2 (2.4%) |
| 30 to 34 Minutes | 0 (0.0%) | 0 (0.0%) |
| 35 to 39 Minutes | 0 (0.0%) | 1 (1.2%) |
| 40 to 44 Minutes | 0 (0.0%) | 0 (0.0%) |
| 45 to 59 Minutes | 3 (2.6%) | 1 (1.2%) |
| 60 to 89 Minutes | 4 (3.5%) | 0 (0.0%) |
| 90 or more Minutes | 2 (1.7%) | 0 (0.0%) |
Time of Departure to Work by Sex in Bison
The most frequent times of departure to work in Bison are 7:00 AM to 7:29 AM (33, 28.7%) for males and 7:30 AM to 7:59 AM (38, 45.8%) for females.
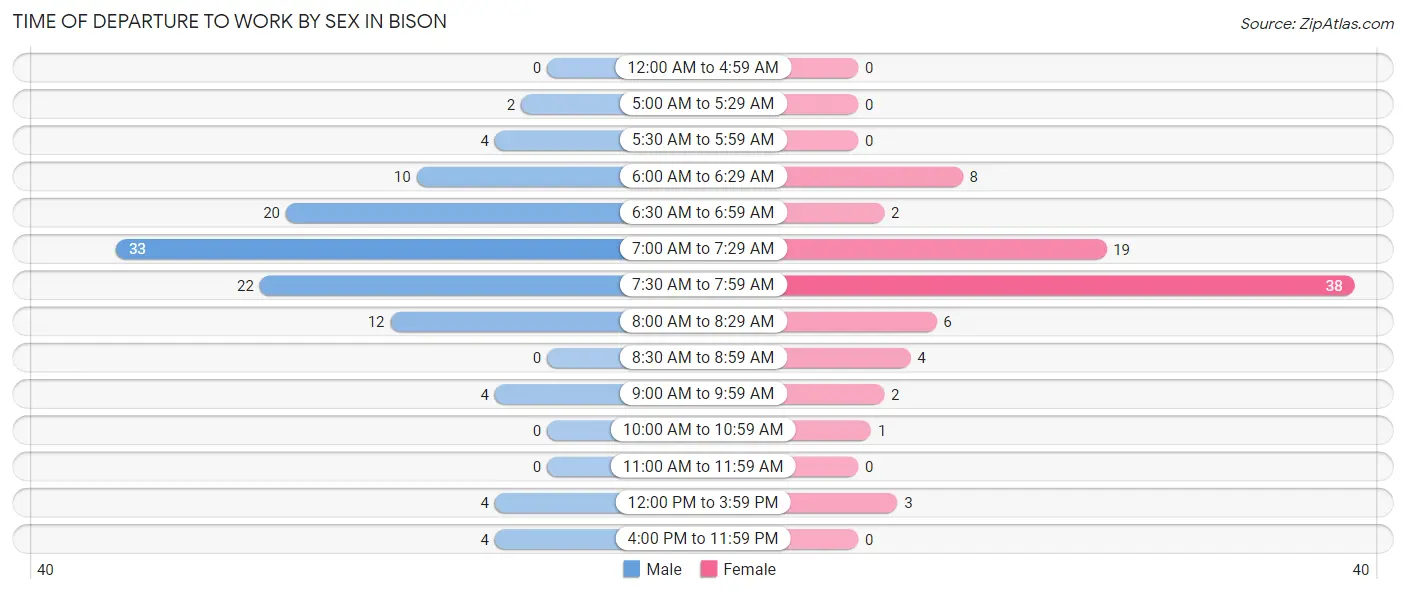
| Time of Departure | Male | Female |
| 12:00 AM to 4:59 AM | 0 (0.0%) | 0 (0.0%) |
| 5:00 AM to 5:29 AM | 2 (1.7%) | 0 (0.0%) |
| 5:30 AM to 5:59 AM | 4 (3.5%) | 0 (0.0%) |
| 6:00 AM to 6:29 AM | 10 (8.7%) | 8 (9.6%) |
| 6:30 AM to 6:59 AM | 20 (17.4%) | 2 (2.4%) |
| 7:00 AM to 7:29 AM | 33 (28.7%) | 19 (22.9%) |
| 7:30 AM to 7:59 AM | 22 (19.1%) | 38 (45.8%) |
| 8:00 AM to 8:29 AM | 12 (10.4%) | 6 (7.2%) |
| 8:30 AM to 8:59 AM | 0 (0.0%) | 4 (4.8%) |
| 9:00 AM to 9:59 AM | 4 (3.5%) | 2 (2.4%) |
| 10:00 AM to 10:59 AM | 0 (0.0%) | 1 (1.2%) |
| 11:00 AM to 11:59 AM | 0 (0.0%) | 0 (0.0%) |
| 12:00 PM to 3:59 PM | 4 (3.5%) | 3 (3.6%) |
| 4:00 PM to 11:59 PM | 4 (3.5%) | 0 (0.0%) |
| Total | 115 (100.0%) | 83 (100.0%) |
Housing Occupancy in Bison
Occupancy by Ownership in Bison
Of the total 200 dwellings in Bison, owner-occupied units account for 158 (79.0%), while renter-occupied units make up 42 (21.0%).
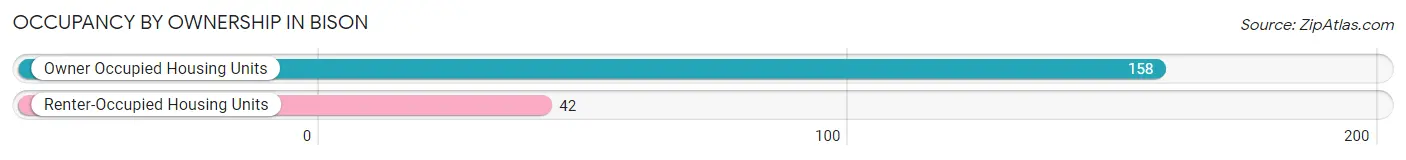
| Occupancy | # Housing Units | % Housing Units |
| Owner Occupied Housing Units | 158 | 79.0% |
| Renter-Occupied Housing Units | 42 | 21.0% |
| Total Occupied Housing Units | 200 | 100.0% |
Occupancy by Household Size in Bison
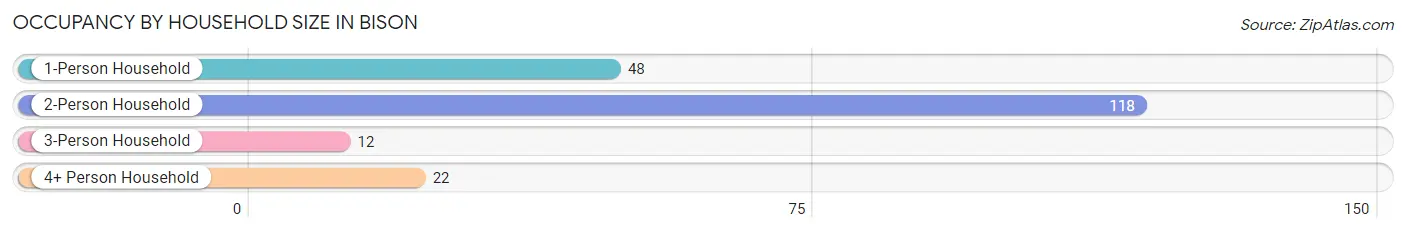
| Household Size | # Housing Units | % Housing Units |
| 1-Person Household | 48 | 24.0% |
| 2-Person Household | 118 | 59.0% |
| 3-Person Household | 12 | 6.0% |
| 4+ Person Household | 22 | 11.0% |
| Total Housing Units | 200 | 100.0% |
Occupancy by Ownership by Household Size in Bison
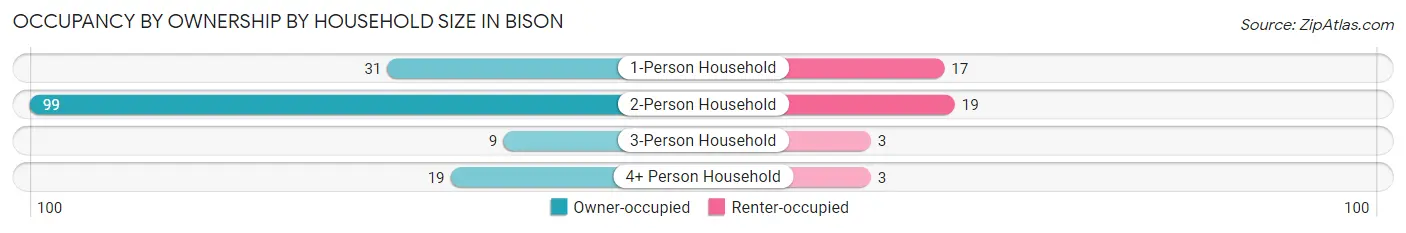
| Household Size | Owner-occupied | Renter-occupied |
| 1-Person Household | 31 (64.6%) | 17 (35.4%) |
| 2-Person Household | 99 (83.9%) | 19 (16.1%) |
| 3-Person Household | 9 (75.0%) | 3 (25.0%) |
| 4+ Person Household | 19 (86.4%) | 3 (13.6%) |
| Total Housing Units | 158 (79.0%) | 42 (21.0%) |
Occupancy by Educational Attainment in Bison
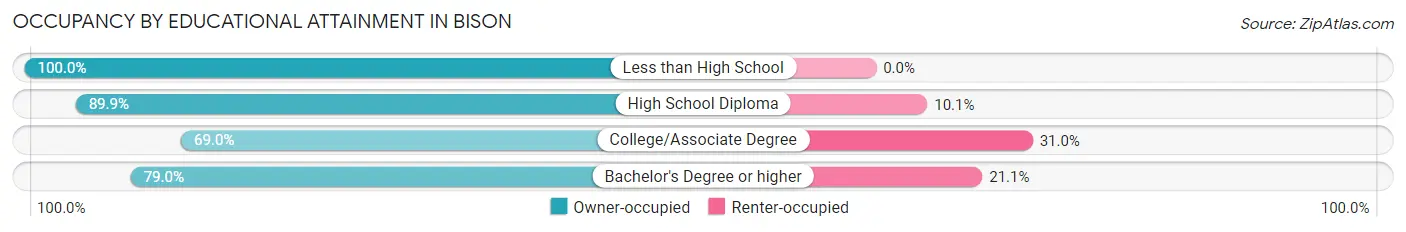
| Household Size | Owner-occupied | Renter-occupied |
| Less than High School | 6 (100.0%) | 0 (0.0%) |
| High School Diploma | 62 (89.9%) | 7 (10.1%) |
| College/Associate Degree | 60 (69.0%) | 27 (31.0%) |
| Bachelor's Degree or higher | 30 (78.9%) | 8 (21.0%) |
Occupancy by Age of Householder in Bison
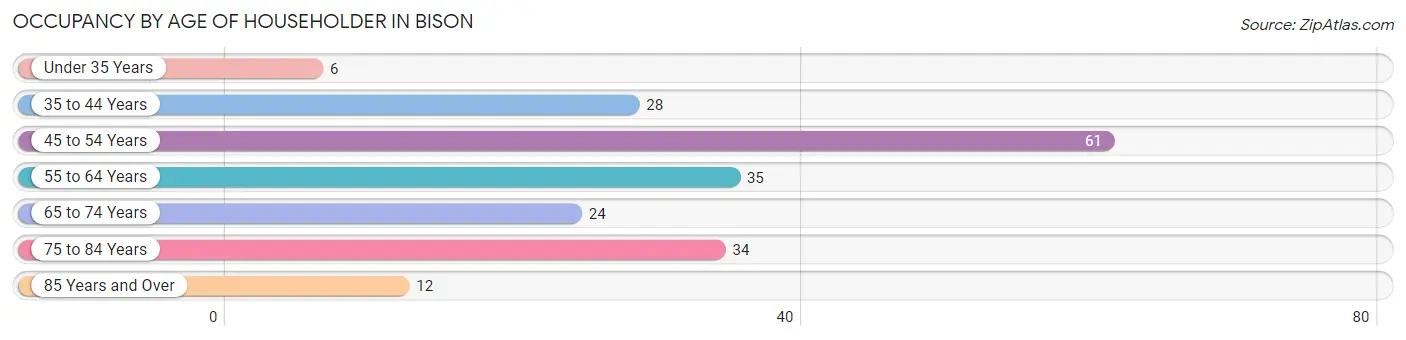
| Age Bracket | # Households | % Households |
| Under 35 Years | 6 | 3.0% |
| 35 to 44 Years | 28 | 14.0% |
| 45 to 54 Years | 61 | 30.5% |
| 55 to 64 Years | 35 | 17.5% |
| 65 to 74 Years | 24 | 12.0% |
| 75 to 84 Years | 34 | 17.0% |
| 85 Years and Over | 12 | 6.0% |
| Total | 200 | 100.0% |
Housing Finances in Bison
Median Income by Occupancy in Bison
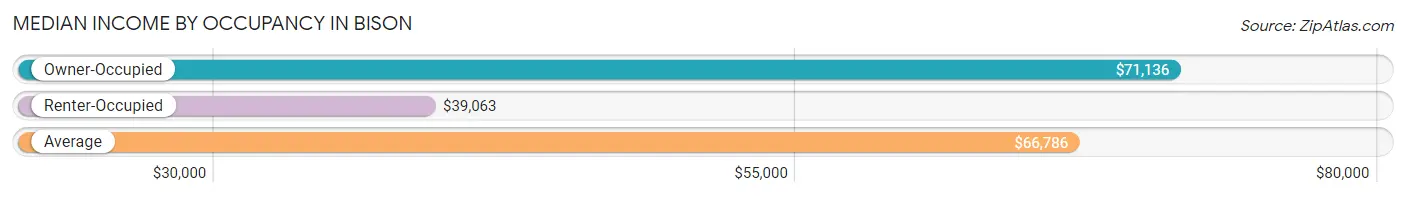
| Occupancy Type | # Households | Median Income |
| Owner-Occupied | 158 (79.0%) | $71,136 |
| Renter-Occupied | 42 (21.0%) | $39,063 |
| Average | 200 (100.0%) | $66,786 |
Occupancy by Householder Income Bracket in Bison
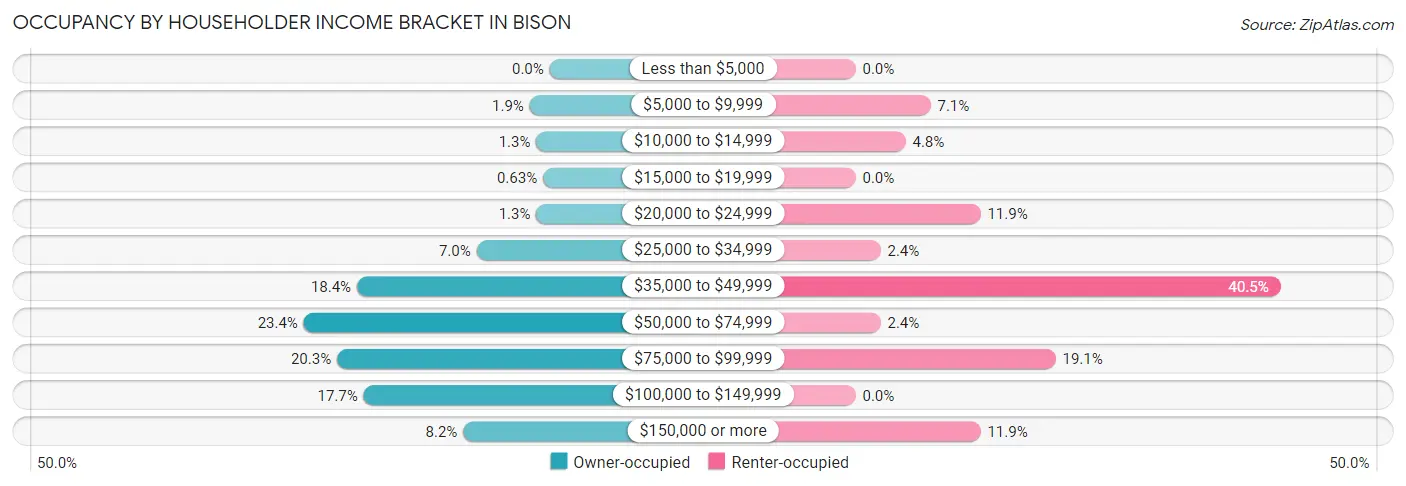
| Income Bracket | Owner-occupied | Renter-occupied |
| Less than $5,000 | 0 (0.0%) | 0 (0.0%) |
| $5,000 to $9,999 | 3 (1.9%) | 3 (7.1%) |
| $10,000 to $14,999 | 2 (1.3%) | 2 (4.8%) |
| $15,000 to $19,999 | 1 (0.6%) | 0 (0.0%) |
| $20,000 to $24,999 | 2 (1.3%) | 5 (11.9%) |
| $25,000 to $34,999 | 11 (7.0%) | 1 (2.4%) |
| $35,000 to $49,999 | 29 (18.3%) | 17 (40.5%) |
| $50,000 to $74,999 | 37 (23.4%) | 1 (2.4%) |
| $75,000 to $99,999 | 32 (20.3%) | 8 (19.1%) |
| $100,000 to $149,999 | 28 (17.7%) | 0 (0.0%) |
| $150,000 or more | 13 (8.2%) | 5 (11.9%) |
| Total | 158 (100.0%) | 42 (100.0%) |
Monthly Housing Cost Tiers in Bison
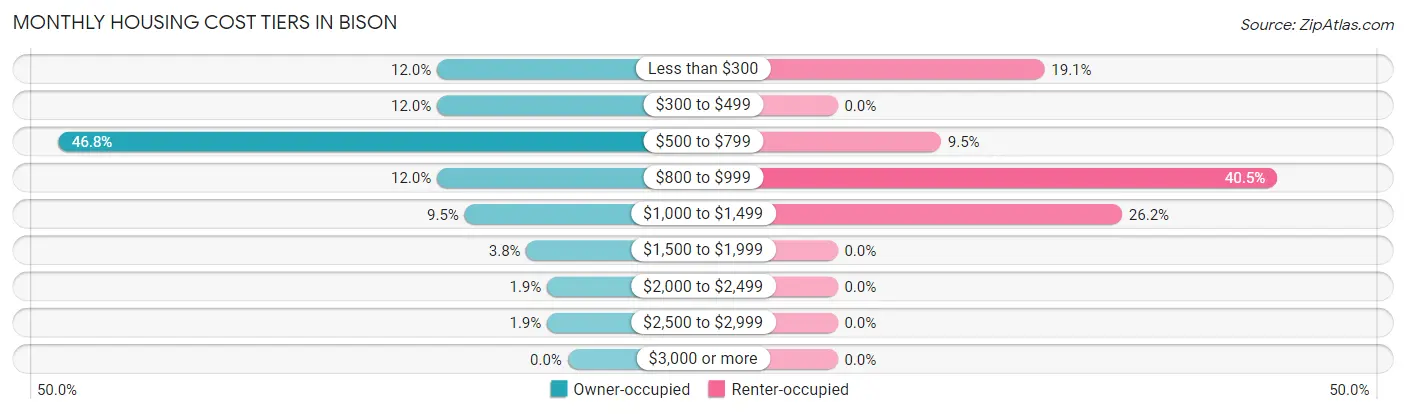
| Monthly Cost | Owner-occupied | Renter-occupied |
| Less than $300 | 19 (12.0%) | 8 (19.1%) |
| $300 to $499 | 19 (12.0%) | 0 (0.0%) |
| $500 to $799 | 74 (46.8%) | 4 (9.5%) |
| $800 to $999 | 19 (12.0%) | 17 (40.5%) |
| $1,000 to $1,499 | 15 (9.5%) | 11 (26.2%) |
| $1,500 to $1,999 | 6 (3.8%) | 0 (0.0%) |
| $2,000 to $2,499 | 3 (1.9%) | 0 (0.0%) |
| $2,500 to $2,999 | 3 (1.9%) | 0 (0.0%) |
| $3,000 or more | 0 (0.0%) | 0 (0.0%) |
| Total | 158 (100.0%) | 42 (100.0%) |
Physical Housing Characteristics in Bison
Housing Structures in Bison
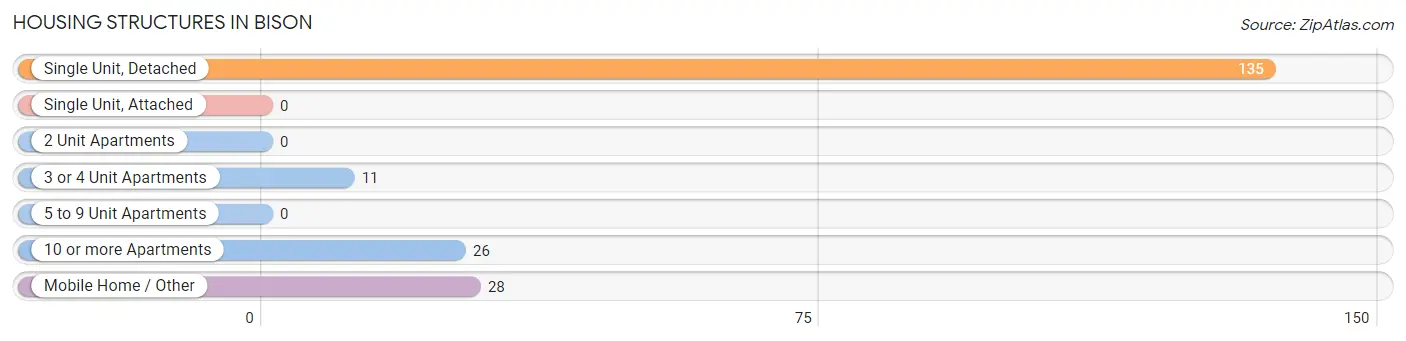
| Structure Type | # Housing Units | % Housing Units |
| Single Unit, Detached | 135 | 67.5% |
| Single Unit, Attached | 0 | 0.0% |
| 2 Unit Apartments | 0 | 0.0% |
| 3 or 4 Unit Apartments | 11 | 5.5% |
| 5 to 9 Unit Apartments | 0 | 0.0% |
| 10 or more Apartments | 26 | 13.0% |
| Mobile Home / Other | 28 | 14.0% |
| Total | 200 | 100.0% |
Housing Structures by Occupancy in Bison
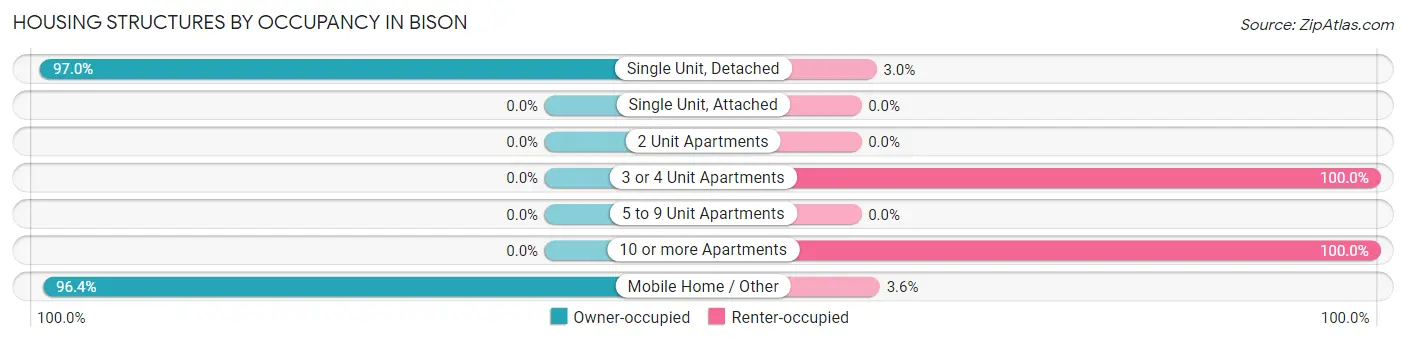
| Structure Type | Owner-occupied | Renter-occupied |
| Single Unit, Detached | 131 (97.0%) | 4 (3.0%) |
| Single Unit, Attached | 0 (0.0%) | 0 (0.0%) |
| 2 Unit Apartments | 0 (0.0%) | 0 (0.0%) |
| 3 or 4 Unit Apartments | 0 (0.0%) | 11 (100.0%) |
| 5 to 9 Unit Apartments | 0 (0.0%) | 0 (0.0%) |
| 10 or more Apartments | 0 (0.0%) | 26 (100.0%) |
| Mobile Home / Other | 27 (96.4%) | 1 (3.6%) |
| Total | 158 (79.0%) | 42 (21.0%) |
Housing Structures by Number of Rooms in Bison
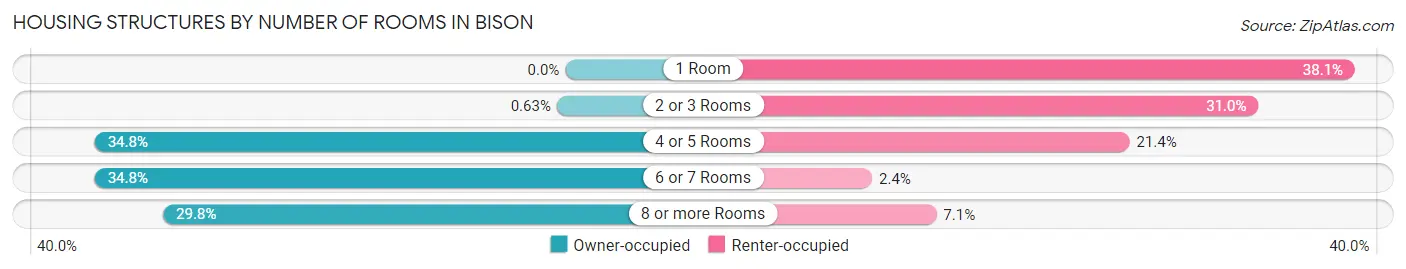
| Number of Rooms | Owner-occupied | Renter-occupied |
| 1 Room | 0 (0.0%) | 16 (38.1%) |
| 2 or 3 Rooms | 1 (0.6%) | 13 (30.9%) |
| 4 or 5 Rooms | 55 (34.8%) | 9 (21.4%) |
| 6 or 7 Rooms | 55 (34.8%) | 1 (2.4%) |
| 8 or more Rooms | 47 (29.7%) | 3 (7.1%) |
| Total | 158 (100.0%) | 42 (100.0%) |
Housing Structure by Heating Type in Bison
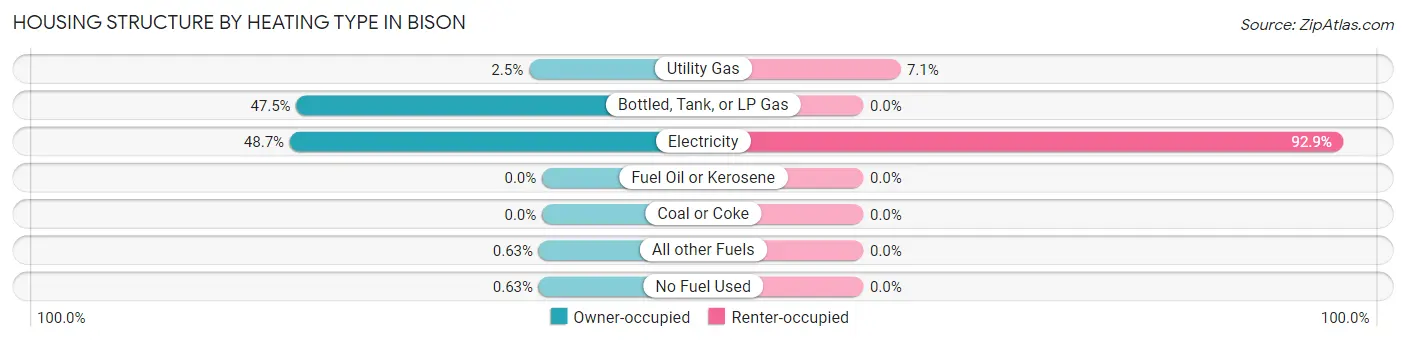
| Heating Type | Owner-occupied | Renter-occupied |
| Utility Gas | 4 (2.5%) | 3 (7.1%) |
| Bottled, Tank, or LP Gas | 75 (47.5%) | 0 (0.0%) |
| Electricity | 77 (48.7%) | 39 (92.9%) |
| Fuel Oil or Kerosene | 0 (0.0%) | 0 (0.0%) |
| Coal or Coke | 0 (0.0%) | 0 (0.0%) |
| All other Fuels | 1 (0.6%) | 0 (0.0%) |
| No Fuel Used | 1 (0.6%) | 0 (0.0%) |
| Total | 158 (100.0%) | 42 (100.0%) |
Household Vehicle Usage in Bison
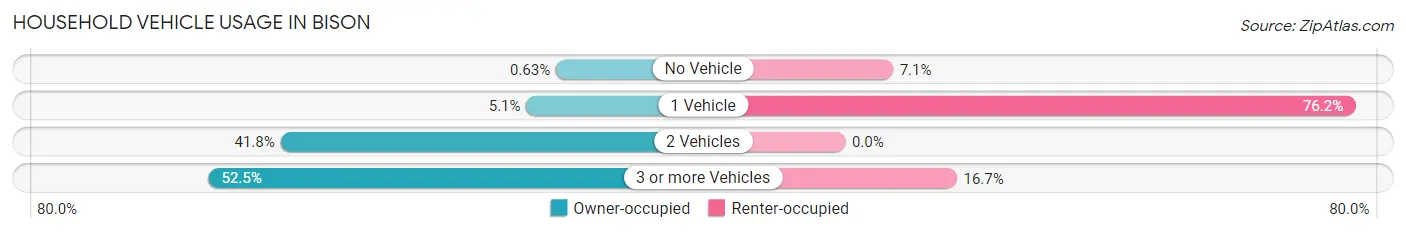
| Vehicles per Household | Owner-occupied | Renter-occupied |
| No Vehicle | 1 (0.6%) | 3 (7.1%) |
| 1 Vehicle | 8 (5.1%) | 32 (76.2%) |
| 2 Vehicles | 66 (41.8%) | 0 (0.0%) |
| 3 or more Vehicles | 83 (52.5%) | 7 (16.7%) |
| Total | 158 (100.0%) | 42 (100.0%) |
Real Estate & Mortgages in Bison
Real Estate and Mortgage Overview in Bison
| Characteristic | Without Mortgage | With Mortgage |
| Housing Units | 107 | 51 |
| Median Property Value | $73,800 | $75,000 |
| Median Household Income | $64,688 | $4 |
| Monthly Housing Costs | $557 | $0 |
| Real Estate Taxes | $1,257 | $0 |
Property Value by Mortgage Status in Bison
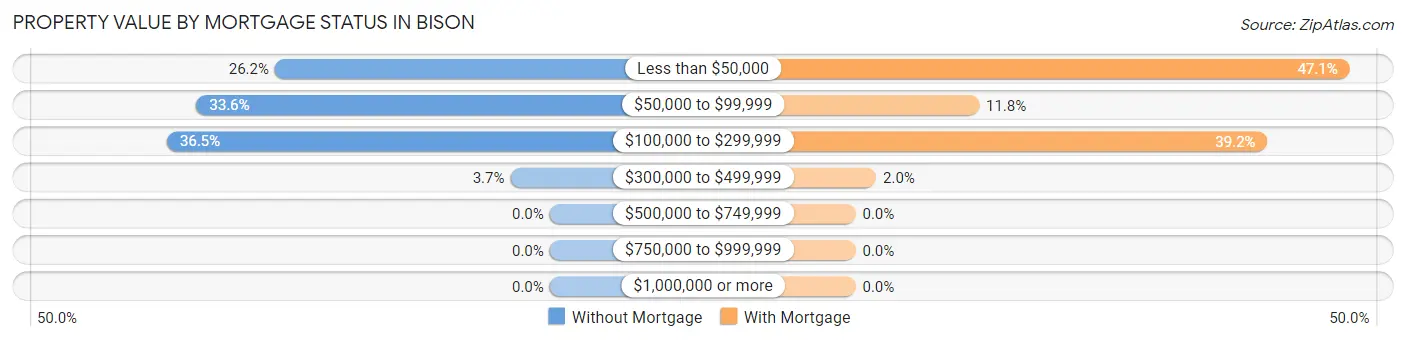
| Property Value | Without Mortgage | With Mortgage |
| Less than $50,000 | 28 (26.2%) | 24 (47.1%) |
| $50,000 to $99,999 | 36 (33.6%) | 6 (11.8%) |
| $100,000 to $299,999 | 39 (36.4%) | 20 (39.2%) |
| $300,000 to $499,999 | 4 (3.7%) | 1 (2.0%) |
| $500,000 to $749,999 | 0 (0.0%) | 0 (0.0%) |
| $750,000 to $999,999 | 0 (0.0%) | 0 (0.0%) |
| $1,000,000 or more | 0 (0.0%) | 0 (0.0%) |
| Total | 107 (100.0%) | 51 (100.0%) |
Household Income by Mortgage Status in Bison
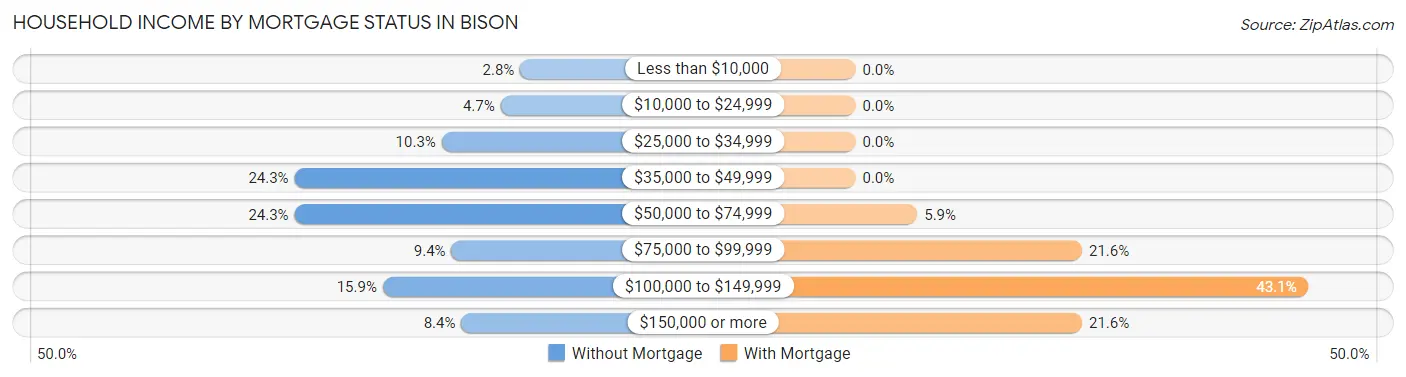
| Household Income | Without Mortgage | With Mortgage |
| Less than $10,000 | 3 (2.8%) | 0 (0.0%) |
| $10,000 to $24,999 | 5 (4.7%) | 0 (0.0%) |
| $25,000 to $34,999 | 11 (10.3%) | 0 (0.0%) |
| $35,000 to $49,999 | 26 (24.3%) | 0 (0.0%) |
| $50,000 to $74,999 | 26 (24.3%) | 3 (5.9%) |
| $75,000 to $99,999 | 10 (9.3%) | 11 (21.6%) |
| $100,000 to $149,999 | 17 (15.9%) | 22 (43.1%) |
| $150,000 or more | 9 (8.4%) | 11 (21.6%) |
| Total | 107 (100.0%) | 51 (100.0%) |
Property Value to Household Income Ratio in Bison
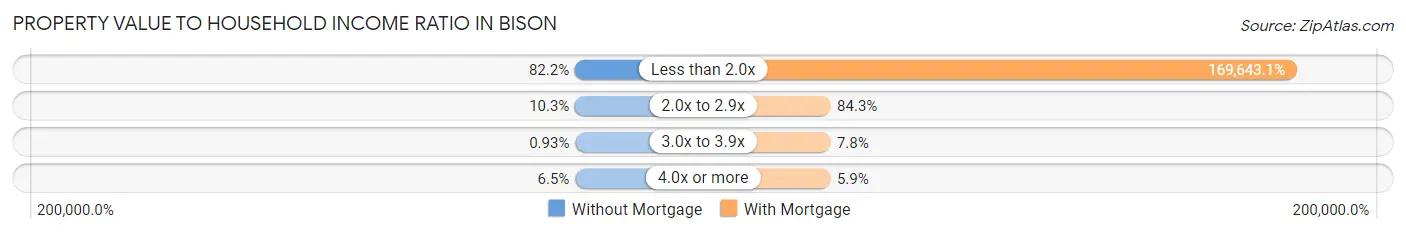
| Value-to-Income Ratio | Without Mortgage | With Mortgage |
| Less than 2.0x | 88 (82.2%) | 86,518 (169,643.1%) |
| 2.0x to 2.9x | 11 (10.3%) | 43 (84.3%) |
| 3.0x to 3.9x | 1 (0.9%) | 4 (7.8%) |
| 4.0x or more | 7 (6.5%) | 3 (5.9%) |
| Total | 107 (100.0%) | 51 (100.0%) |
Real Estate Taxes by Mortgage Status in Bison
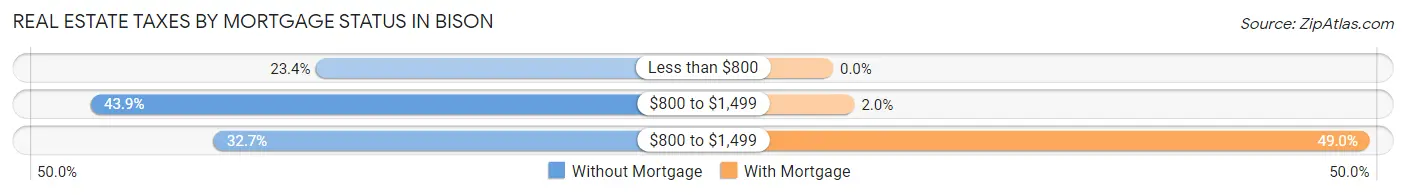
| Property Taxes | Without Mortgage | With Mortgage |
| Less than $800 | 25 (23.4%) | 0 (0.0%) |
| $800 to $1,499 | 47 (43.9%) | 1 (2.0%) |
| $800 to $1,499 | 35 (32.7%) | 25 (49.0%) |
| Total | 107 (100.0%) | 51 (100.0%) |
Health & Disability in Bison
Health Insurance Coverage by Age in Bison
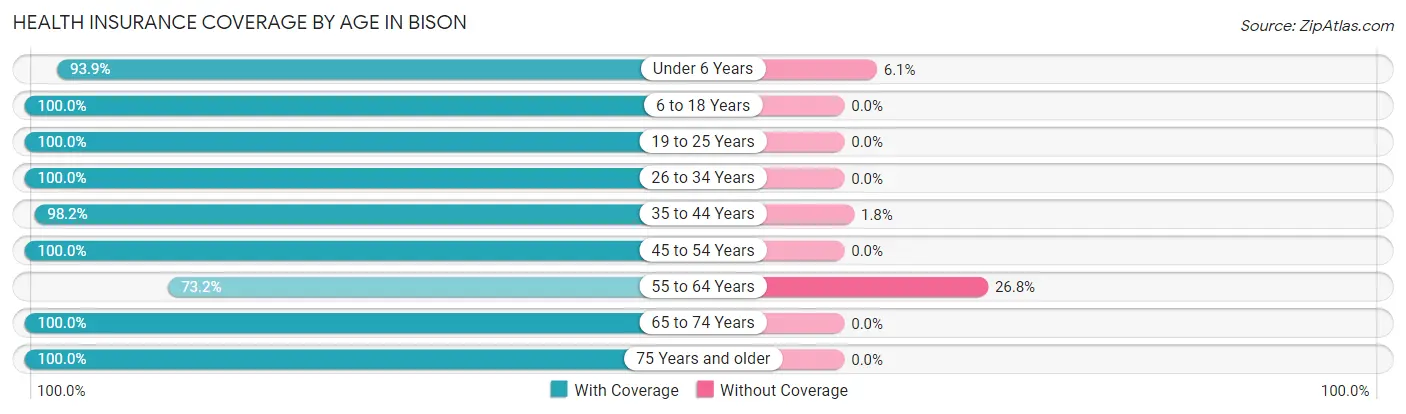
| Age Bracket | With Coverage | Without Coverage |
| Under 6 Years | 31 (93.9%) | 2 (6.1%) |
| 6 to 18 Years | 60 (100.0%) | 0 (0.0%) |
| 19 to 25 Years | 3 (100.0%) | 0 (0.0%) |
| 26 to 34 Years | 17 (100.0%) | 0 (0.0%) |
| 35 to 44 Years | 54 (98.2%) | 1 (1.8%) |
| 45 to 54 Years | 84 (100.0%) | 0 (0.0%) |
| 55 to 64 Years | 41 (73.2%) | 15 (26.8%) |
| 65 to 74 Years | 48 (100.0%) | 0 (0.0%) |
| 75 Years and older | 61 (100.0%) | 0 (0.0%) |
| Total | 399 (95.7%) | 18 (4.3%) |
Health Insurance Coverage by Citizenship Status in Bison
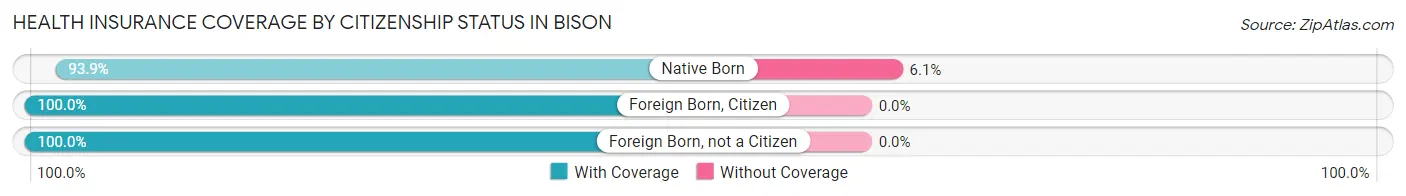
| Citizenship Status | With Coverage | Without Coverage |
| Native Born | 31 (93.9%) | 2 (6.1%) |
| Foreign Born, Citizen | 60 (100.0%) | 0 (0.0%) |
| Foreign Born, not a Citizen | 3 (100.0%) | 0 (0.0%) |
Health Insurance Coverage by Household Income in Bison
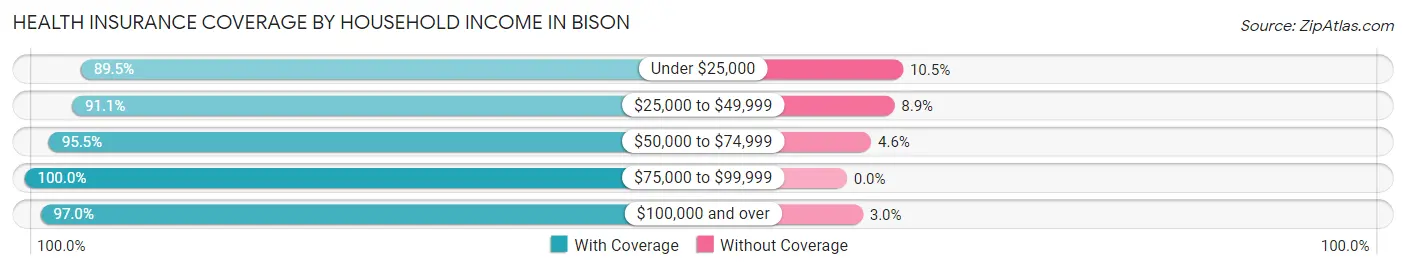
| Household Income | With Coverage | Without Coverage |
| Under $25,000 | 17 (89.5%) | 2 (10.5%) |
| $25,000 to $49,999 | 92 (91.1%) | 9 (8.9%) |
| $50,000 to $74,999 | 63 (95.5%) | 3 (4.5%) |
| $75,000 to $99,999 | 97 (100.0%) | 0 (0.0%) |
| $100,000 and over | 130 (97.0%) | 4 (3.0%) |
Public vs Private Health Insurance Coverage by Age in Bison
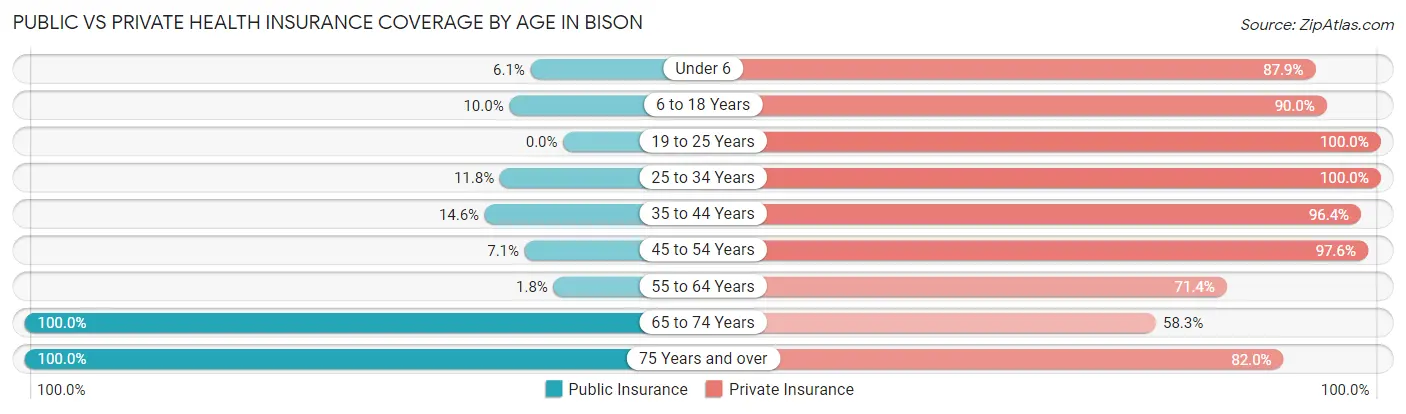
| Age Bracket | Public Insurance | Private Insurance |
| Under 6 | 2 (6.1%) | 29 (87.9%) |
| 6 to 18 Years | 6 (10.0%) | 54 (90.0%) |
| 19 to 25 Years | 0 (0.0%) | 3 (100.0%) |
| 25 to 34 Years | 2 (11.8%) | 17 (100.0%) |
| 35 to 44 Years | 8 (14.5%) | 53 (96.4%) |
| 45 to 54 Years | 6 (7.1%) | 82 (97.6%) |
| 55 to 64 Years | 1 (1.8%) | 40 (71.4%) |
| 65 to 74 Years | 48 (100.0%) | 28 (58.3%) |
| 75 Years and over | 61 (100.0%) | 50 (82.0%) |
| Total | 134 (32.1%) | 356 (85.4%) |
Disability Status by Sex by Age in Bison
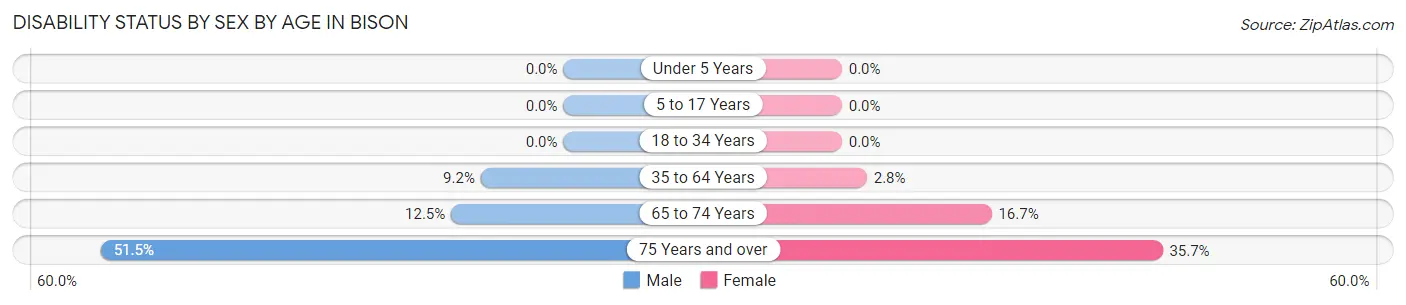
| Age Bracket | Male | Female |
| Under 5 Years | 0 (0.0%) | 0 (0.0%) |
| 5 to 17 Years | 0 (0.0%) | 0 (0.0%) |
| 18 to 34 Years | 0 (0.0%) | 0 (0.0%) |
| 35 to 64 Years | 8 (9.2%) | 3 (2.8%) |
| 65 to 74 Years | 3 (12.5%) | 4 (16.7%) |
| 75 Years and over | 17 (51.5%) | 10 (35.7%) |
Disability Class by Sex by Age in Bison
Disability Class: Hearing Difficulty
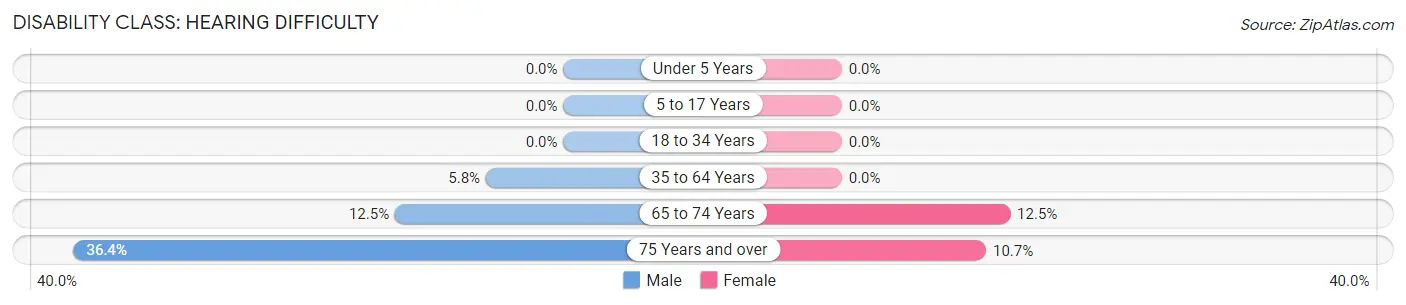
| Age Bracket | Male | Female |
| Under 5 Years | 0 (0.0%) | 0 (0.0%) |
| 5 to 17 Years | 0 (0.0%) | 0 (0.0%) |
| 18 to 34 Years | 0 (0.0%) | 0 (0.0%) |
| 35 to 64 Years | 5 (5.8%) | 0 (0.0%) |
| 65 to 74 Years | 3 (12.5%) | 3 (12.5%) |
| 75 Years and over | 12 (36.4%) | 3 (10.7%) |
Disability Class: Vision Difficulty
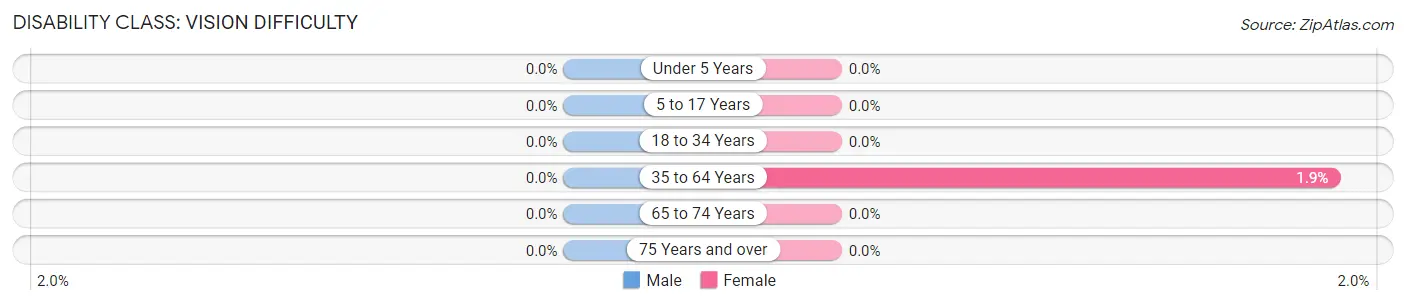
| Age Bracket | Male | Female |
| Under 5 Years | 0 (0.0%) | 0 (0.0%) |
| 5 to 17 Years | 0 (0.0%) | 0 (0.0%) |
| 18 to 34 Years | 0 (0.0%) | 0 (0.0%) |
| 35 to 64 Years | 0 (0.0%) | 2 (1.8%) |
| 65 to 74 Years | 0 (0.0%) | 0 (0.0%) |
| 75 Years and over | 0 (0.0%) | 0 (0.0%) |
Disability Class: Cognitive Difficulty
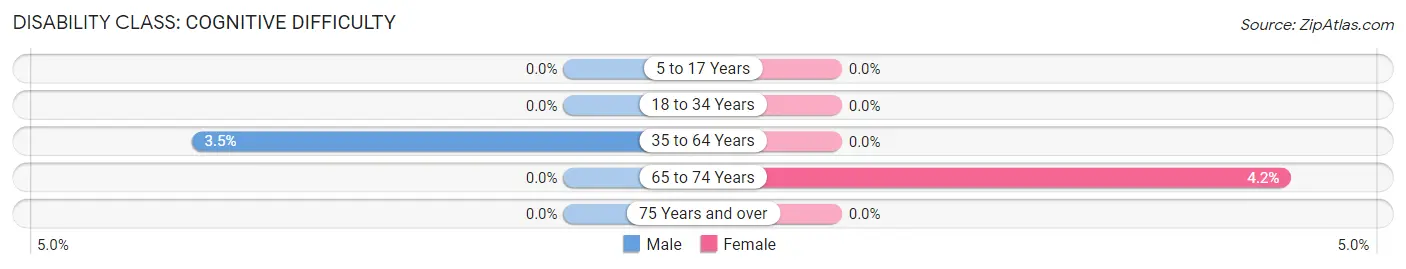
| Age Bracket | Male | Female |
| 5 to 17 Years | 0 (0.0%) | 0 (0.0%) |
| 18 to 34 Years | 0 (0.0%) | 0 (0.0%) |
| 35 to 64 Years | 3 (3.5%) | 0 (0.0%) |
| 65 to 74 Years | 0 (0.0%) | 1 (4.2%) |
| 75 Years and over | 0 (0.0%) | 0 (0.0%) |
Disability Class: Ambulatory Difficulty
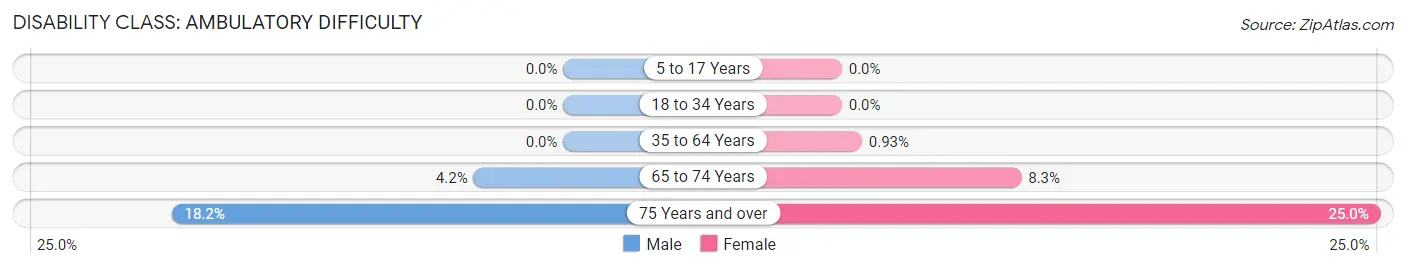
| Age Bracket | Male | Female |
| 5 to 17 Years | 0 (0.0%) | 0 (0.0%) |
| 18 to 34 Years | 0 (0.0%) | 0 (0.0%) |
| 35 to 64 Years | 0 (0.0%) | 1 (0.9%) |
| 65 to 74 Years | 1 (4.2%) | 2 (8.3%) |
| 75 Years and over | 6 (18.2%) | 7 (25.0%) |
Disability Class: Self-Care Difficulty
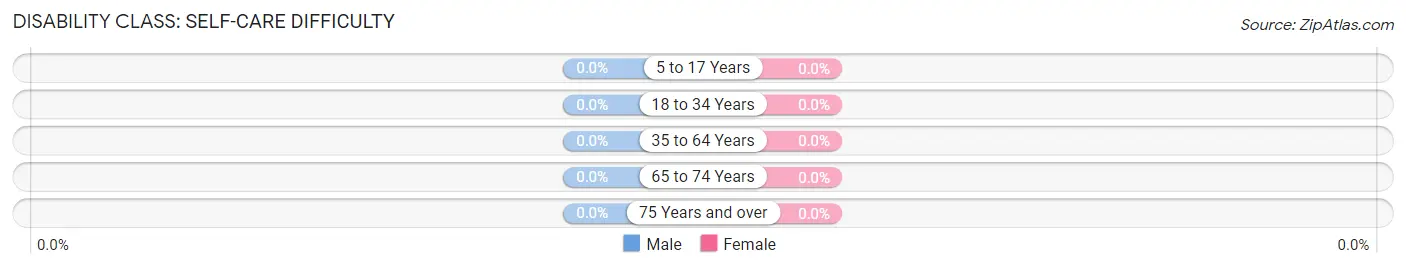
| Age Bracket | Male | Female |
| 5 to 17 Years | 0 (0.0%) | 0 (0.0%) |
| 18 to 34 Years | 0 (0.0%) | 0 (0.0%) |
| 35 to 64 Years | 0 (0.0%) | 0 (0.0%) |
| 65 to 74 Years | 0 (0.0%) | 0 (0.0%) |
| 75 Years and over | 0 (0.0%) | 0 (0.0%) |
Technology Access in Bison
Computing Device Access in Bison
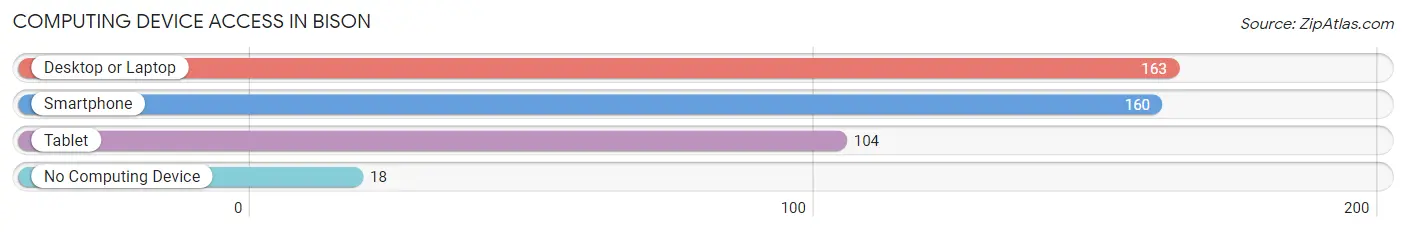
| Device Type | # Households | % Households |
| Desktop or Laptop | 163 | 81.5% |
| Smartphone | 160 | 80.0% |
| Tablet | 104 | 52.0% |
| No Computing Device | 18 | 9.0% |
| Total | 200 | 100.0% |
Internet Access in Bison
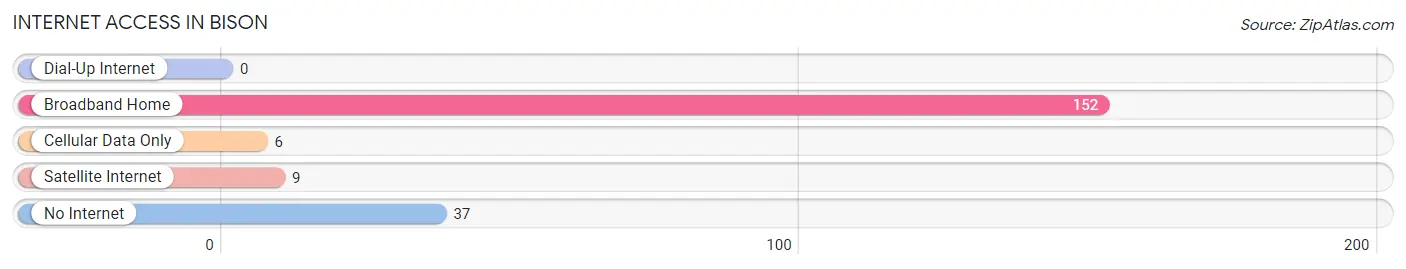
| Internet Type | # Households | % Households |
| Dial-Up Internet | 0 | 0.0% |
| Broadband Home | 152 | 76.0% |
| Cellular Data Only | 6 | 3.0% |
| Satellite Internet | 9 | 4.5% |
| No Internet | 37 | 18.5% |
| Total | 200 | 100.0% |
Bison Summary
Bison, South Dakota is a small town located in the northern part of the state, in Perkins County. It is situated on the edge of the Badlands, and is surrounded by rolling hills and prairies. The town has a population of just over 500 people, and is the county seat of Perkins County.
History
Bison was founded in 1883, when the Chicago, Milwaukee, St. Paul and Pacific Railroad (the Milwaukee Road) was built through the area. The town was named after the large herds of bison that roamed the area. The town was incorporated in 1887, and the first post office was established in 1888.
In the early 1900s, Bison was a thriving agricultural community, with a population of over 1,000 people. The town had several businesses, including a bank, a hotel, a general store, a blacksmith shop, and a livery stable.
In the 1920s, the Great Depression hit the town hard, and the population began to decline. The Milwaukee Road closed its line through Bison in the 1930s, and the town's economy suffered further.
In the 1950s, the town began to recover, and the population began to grow again. The town was revitalized in the 1970s, when the Badlands National Park was established nearby. The park brought in tourists, and the town's economy began to improve.
Geography
Bison is located in the northern part of South Dakota, in Perkins County. It is situated on the edge of the Badlands, and is surrounded by rolling hills and prairies. The town is located at an elevation of 2,845 feet (867 m).
The town is located on the Cheyenne River, which flows through the area. The town is also located near the White River, which flows through the Badlands.
Economy
The economy of Bison is largely based on tourism. The town is located near the Badlands National Park, which attracts visitors from all over the world. The town also has several businesses, including restaurants, hotels, and shops.
The town is also home to several agricultural businesses, including cattle ranches and farms. The town is also home to several manufacturing businesses, including a furniture factory and a metal fabrication plant.
Demographics
As of the 2010 census, the population of Bison was 514. The racial makeup of the town was 97.3% White, 0.4% African American, 0.2% Native American, 0.2% Asian, 0.2% from other races, and 1.9% from two or more races. Hispanic or Latino of any race were 0.8% of the population.
The median income for a household in the town was $37,500, and the median income for a family was $45,000. The per capita income for the town was $18,845. About 11.2% of families and 14.2% of the population were below the poverty line, including 18.2% of those under age 18 and 8.3% of those age 65 or over.
Common Questions
What is Per Capita Income in Bison?
Per Capita income in Bison is $36,948.
What is the Median Family Income in Bison?
Median Family Income in Bison is $78,750.
What is the Median Household income in Bison?
Median Household Income in Bison is $66,786.
What is Income or Wage Gap in Bison?
Income or Wage Gap in Bison is 45.2%.
Women in Bison earn 54.8 cents for every dollar earned by a man.
What is Inequality or Gini Index in Bison?
Inequality or Gini Index in Bison is 0.34.
What is the Total Population of Bison?
Total Population of Bison is 417.
What is the Total Male Population of Bison?
Total Male Population of Bison is 213.
What is the Total Female Population of Bison?
Total Female Population of Bison is 204.
What is the Ratio of Males per 100 Females in Bison?
There are 104.41 Males per 100 Females in Bison.
What is the Ratio of Females per 100 Males in Bison?
There are 95.77 Females per 100 Males in Bison.
What is the Median Population Age in Bison?
Median Population Age in Bison is 46.9 Years.
What is the Average Family Size in Bison
Average Family Size in Bison is 2.4 People.
What is the Average Household Size in Bison
Average Household Size in Bison is 2.1 People.
How Large is the Labor Force in Bison?
There are 223 People in the Labor Forcein in Bison.
What is the Percentage of People in the Labor Force in Bison?
66.4% of People are in the Labor Force in Bison.