Arlington, SD Map & Demographics
Arlington Map
Arlington Overview
$28,785
PER CAPITA INCOME
$83,819
AVG FAMILY INCOME
$60,729
AVG HOUSEHOLD INCOME
32.0%
WAGE / INCOME GAP [ % ]
68.0¢/ $1
WAGE / INCOME GAP [ $ ]
0.38
INEQUALITY / GINI INDEX
846
TOTAL POPULATION
398
MALE POPULATION
448
FEMALE POPULATION
88.84
MALES / 100 FEMALES
112.56
FEMALES / 100 MALES
37.0
MEDIAN AGE
3.0
AVG FAMILY SIZE
2.3
AVG HOUSEHOLD SIZE
430
LABOR FORCE [ PEOPLE ]
67.7%
PERCENT IN LABOR FORCE
0.9%
UNEMPLOYMENT RATE
Arlington Zip Codes
Arlington Area Codes
Income in Arlington
Income Overview in Arlington
Per Capita Income in Arlington is $28,785, while median incomes of families and households are $83,819 and $60,729 respectively.
| Characteristic | Number | Measure |
| Per Capita Income | 846 | $28,785 |
| Median Family Income | 217 | $83,819 |
| Mean Family Income | 217 | $82,527 |
| Median Household Income | 343 | $60,729 |
| Mean Household Income | 343 | $67,578 |
| Income Deficit | 217 | $0 |
| Wage / Income Gap (%) | 846 | 32.04% |
| Wage / Income Gap ($) | 846 | 67.96¢ per $1 |
| Gini / Inequality Index | 846 | 0.38 |
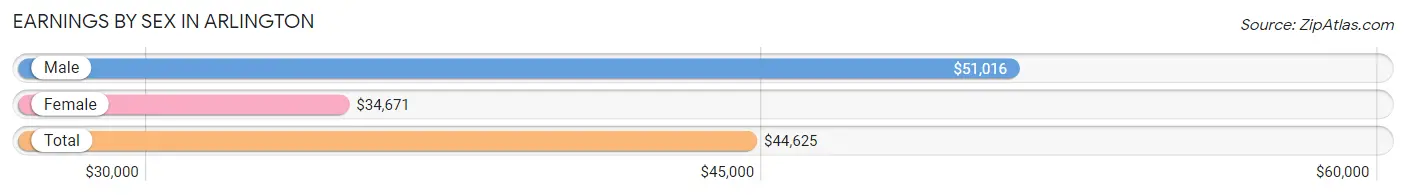
Earnings by Sex in Arlington
Average Earnings in Arlington are $44,625, $51,016 for men and $34,671 for women, a difference of 32.0%.
| Sex | Number | Average Earnings |
| Male | 249 (54.4%) | $51,016 |
| Female | 209 (45.6%) | $34,671 |
| Total | 458 (100.0%) | $44,625 |
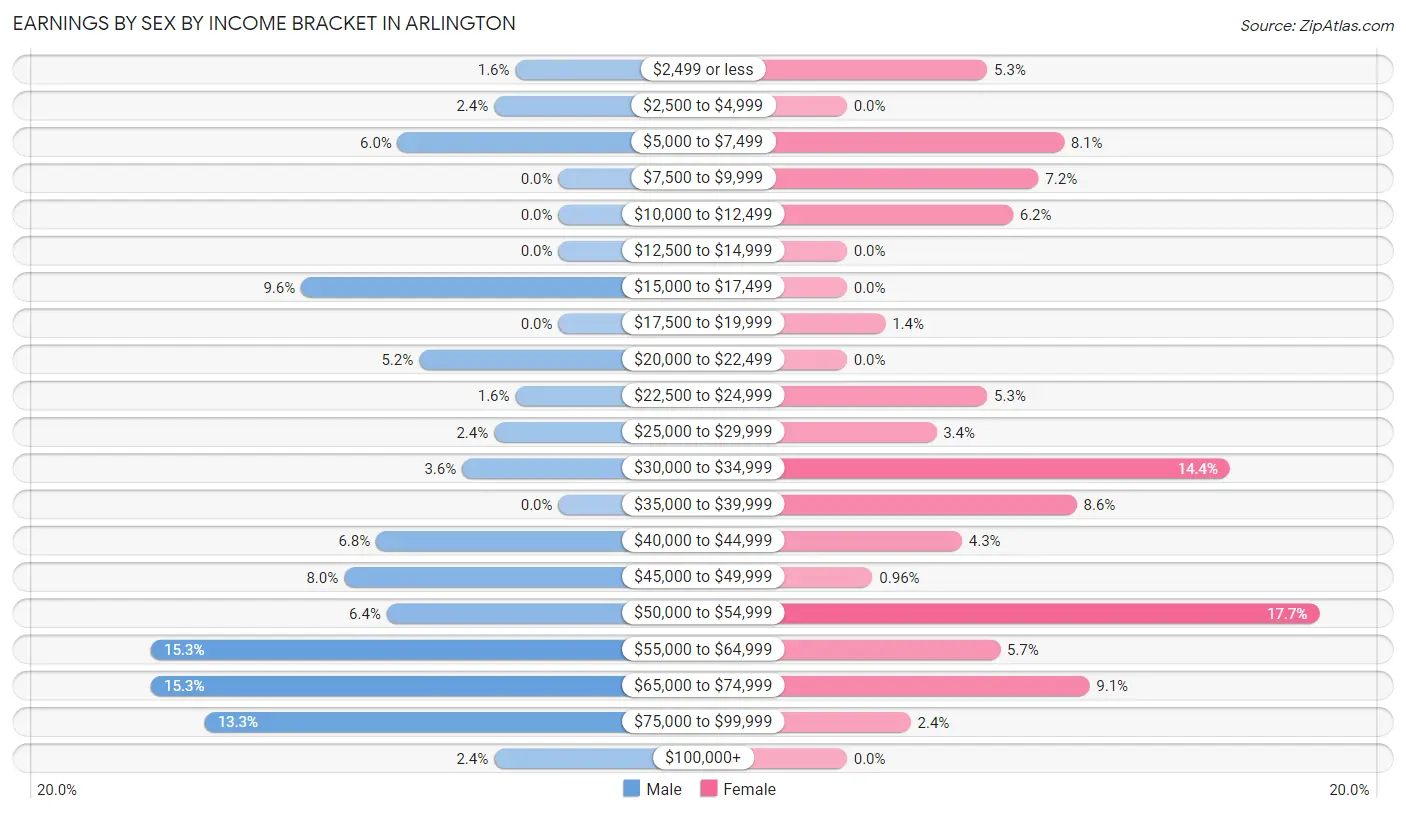
Earnings by Sex by Income Bracket in Arlington
The most common earnings brackets in Arlington are $55,000 to $64,999 for men (38 | 15.3%) and $50,000 to $54,999 for women (37 | 17.7%).
| Income | Male | Female |
| $2,499 or less | 4 (1.6%) | 11 (5.3%) |
| $2,500 to $4,999 | 6 (2.4%) | 0 (0.0%) |
| $5,000 to $7,499 | 15 (6.0%) | 17 (8.1%) |
| $7,500 to $9,999 | 0 (0.0%) | 15 (7.2%) |
| $10,000 to $12,499 | 0 (0.0%) | 13 (6.2%) |
| $12,500 to $14,999 | 0 (0.0%) | 0 (0.0%) |
| $15,000 to $17,499 | 24 (9.6%) | 0 (0.0%) |
| $17,500 to $19,999 | 0 (0.0%) | 3 (1.4%) |
| $20,000 to $22,499 | 13 (5.2%) | 0 (0.0%) |
| $22,500 to $24,999 | 4 (1.6%) | 11 (5.3%) |
| $25,000 to $29,999 | 6 (2.4%) | 7 (3.4%) |
| $30,000 to $34,999 | 9 (3.6%) | 30 (14.3%) |
| $35,000 to $39,999 | 0 (0.0%) | 18 (8.6%) |
| $40,000 to $44,999 | 17 (6.8%) | 9 (4.3%) |
| $45,000 to $49,999 | 20 (8.0%) | 2 (1.0%) |
| $50,000 to $54,999 | 16 (6.4%) | 37 (17.7%) |
| $55,000 to $64,999 | 38 (15.3%) | 12 (5.7%) |
| $65,000 to $74,999 | 38 (15.3%) | 19 (9.1%) |
| $75,000 to $99,999 | 33 (13.3%) | 5 (2.4%) |
| $100,000+ | 6 (2.4%) | 0 (0.0%) |
| Total | 249 (100.0%) | 209 (100.0%) |
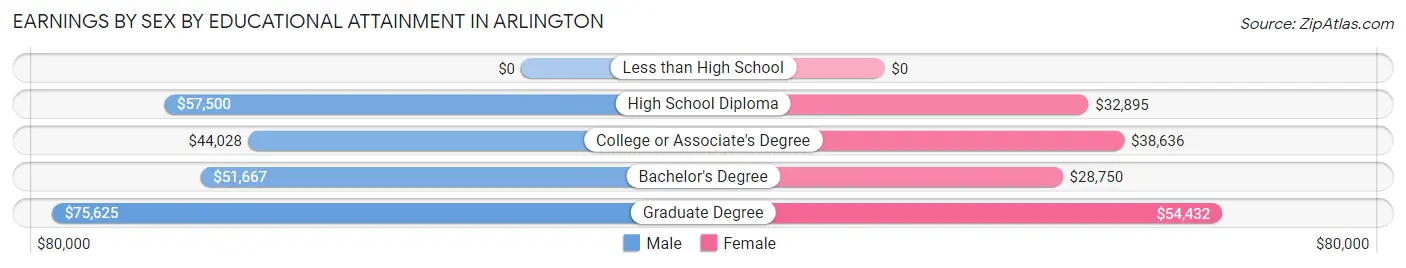
Earnings by Sex by Educational Attainment in Arlington
Average earnings in Arlington are $56,875 for men and $34,934 for women, a difference of 38.6%. Men with an educational attainment of graduate degree enjoy the highest average annual earnings of $75,625, while those with college or associate's degree education earn the least with $44,028. Women with an educational attainment of graduate degree earn the most with the average annual earnings of $54,432, while those with bachelor's degree education have the smallest earnings of $28,750.
| Educational Attainment | Male Income | Female Income |
| Less than High School | - | - |
| High School Diploma | $57,500 | $32,895 |
| College or Associate's Degree | $44,028 | $38,636 |
| Bachelor's Degree | $51,667 | $28,750 |
| Graduate Degree | $75,625 | $54,432 |
| Total | $56,875 | $34,934 |
Family Income in Arlington
Family Income Brackets in Arlington
According to the Arlington family income data, there are 60 families falling into the $75,000 to $99,999 income range, which is the most common income bracket and makes up 27.7% of all families.
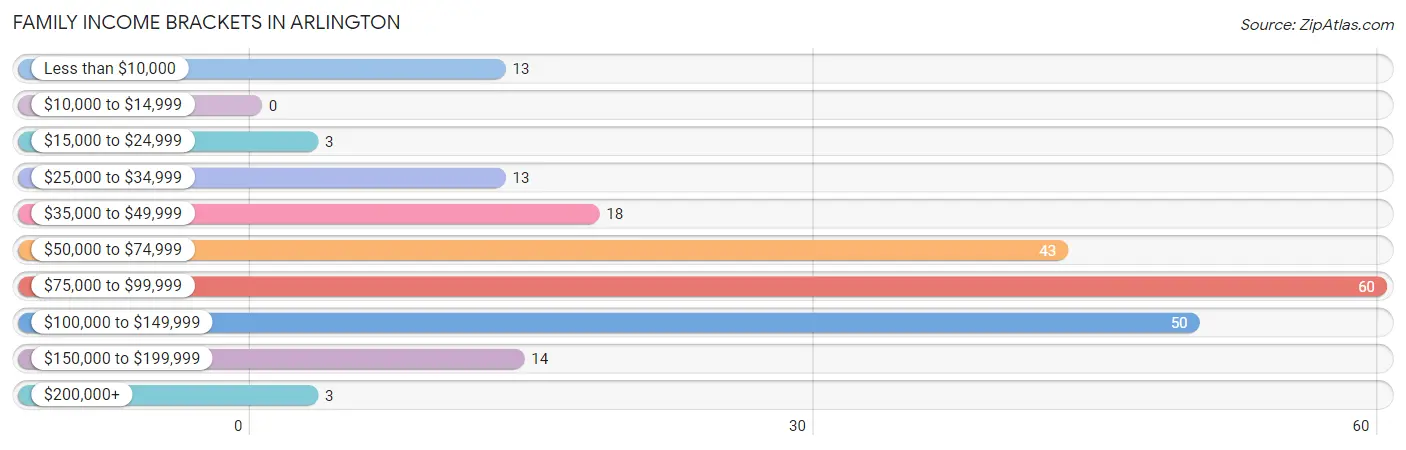
| Income Bracket | # Families | % Families |
| Less than $10,000 | 13 | 6.0% |
| $10,000 to $14,999 | 0 | 0.0% |
| $15,000 to $24,999 | 3 | 1.4% |
| $25,000 to $34,999 | 13 | 6.0% |
| $35,000 to $49,999 | 18 | 8.3% |
| $50,000 to $74,999 | 43 | 19.8% |
| $75,000 to $99,999 | 60 | 27.6% |
| $100,000 to $149,999 | 50 | 23.0% |
| $150,000 to $199,999 | 14 | 6.5% |
| $200,000+ | 3 | 1.4% |
Family Income by Famaliy Size in Arlington
4-person families (36 | 16.6%) account for the highest median family income in Arlington with $102,917 per family, while 2-person families (122 | 56.2%) have the highest median income of $37,750 per family member.
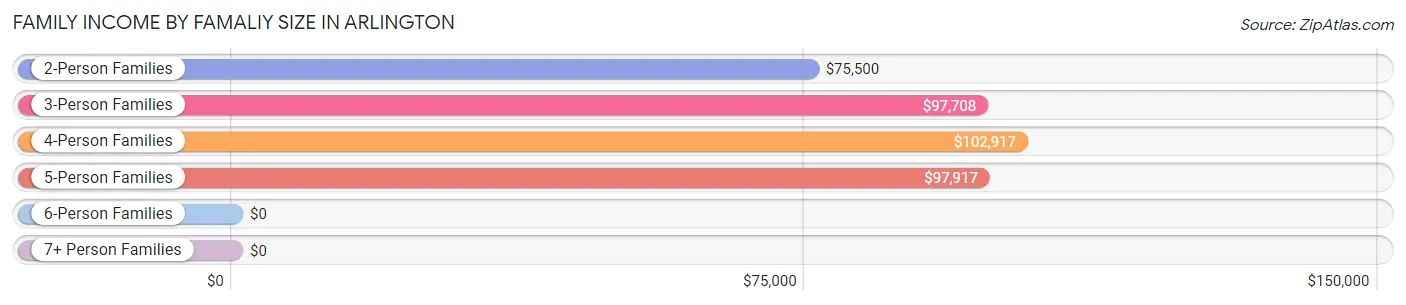
| Income Bracket | # Families | Median Income |
| 2-Person Families | 122 (56.2%) | $75,500 |
| 3-Person Families | 35 (16.1%) | $97,708 |
| 4-Person Families | 36 (16.6%) | $102,917 |
| 5-Person Families | 14 (6.5%) | $97,917 |
| 6-Person Families | 3 (1.4%) | $0 |
| 7+ Person Families | 7 (3.2%) | $0 |
| Total | 217 (100.0%) | $83,819 |
Family Income by Number of Earners in Arlington
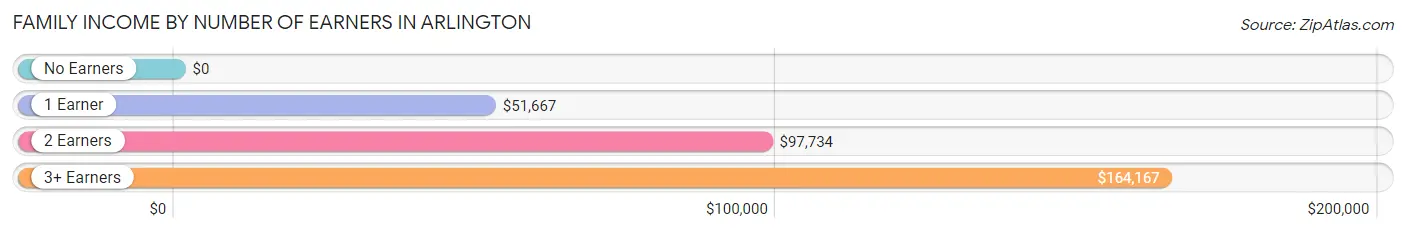
| Number of Earners | # Families | Median Income |
| No Earners | 8 (3.7%) | $0 |
| 1 Earner | 58 (26.7%) | $51,667 |
| 2 Earners | 143 (65.9%) | $97,734 |
| 3+ Earners | 8 (3.7%) | $164,167 |
| Total | 217 (100.0%) | $83,819 |
Household Income in Arlington
Household Income Brackets in Arlington
With 69 households falling in the category, the $75,000 to $99,999 income range is the most frequent in Arlington, accounting for 20.1% of all households. In contrast, only 3 households (0.9%) fall into the $200,000+ income bracket, making it the least populous group.
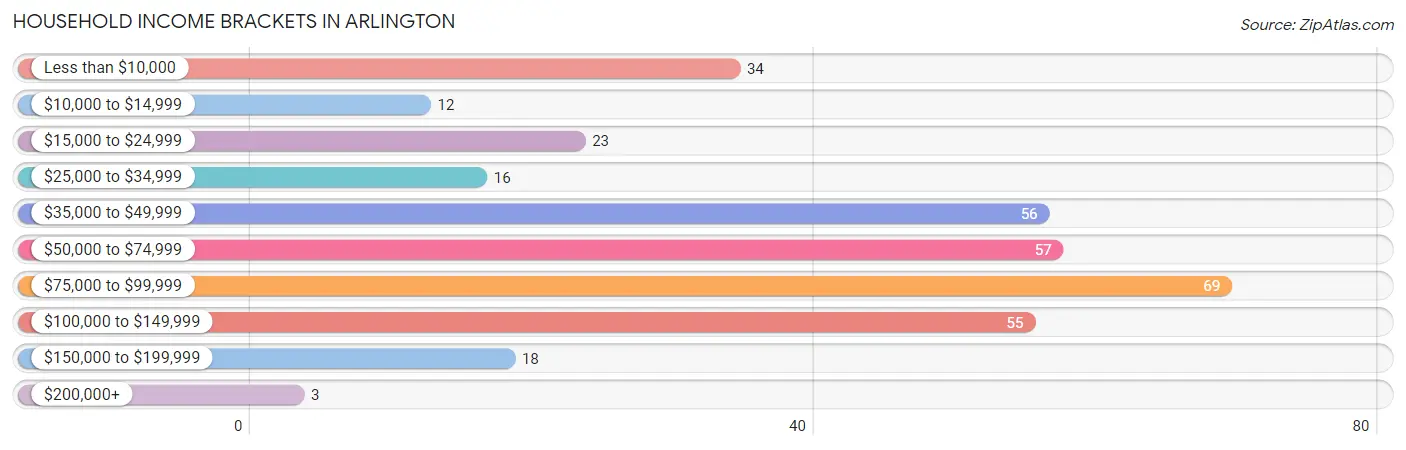
| Income Bracket | # Households | % Households |
| Less than $10,000 | 34 | 9.9% |
| $10,000 to $14,999 | 12 | 3.5% |
| $15,000 to $24,999 | 23 | 6.7% |
| $25,000 to $34,999 | 16 | 4.7% |
| $35,000 to $49,999 | 56 | 16.3% |
| $50,000 to $74,999 | 57 | 16.6% |
| $75,000 to $99,999 | 69 | 20.1% |
| $100,000 to $149,999 | 55 | 16.0% |
| $150,000 to $199,999 | 18 | 5.2% |
| $200,000+ | 3 | 0.9% |
Household Income by Householder Age in Arlington
The median household income in Arlington is $60,729, with the highest median household income of $85,156 found in the 45 to 64 years age bracket for the primary householder. A total of 113 households (32.9%) fall into this category. Meanwhile, the 15 to 24 years age bracket for the primary householder has the lowest median household income of $0, with 13 households (3.8%) in this group.
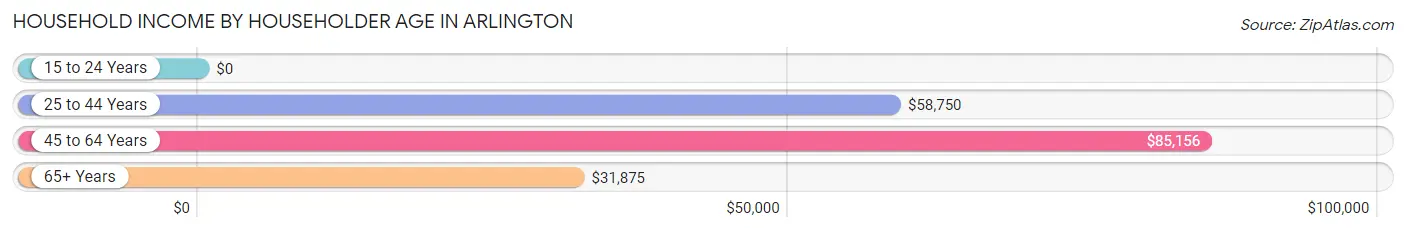
| Income Bracket | # Households | Median Income |
| 15 to 24 Years | 13 (3.8%) | $0 |
| 25 to 44 Years | 138 (40.2%) | $58,750 |
| 45 to 64 Years | 113 (32.9%) | $85,156 |
| 65+ Years | 79 (23.0%) | $31,875 |
| Total | 343 (100.0%) | $60,729 |
Poverty in Arlington
Income Below Poverty by Sex and Age in Arlington
With 6.8% poverty level for males and 16.0% for females among the residents of Arlington, under 5 year old males and 65 to 74 year old females are the most vulnerable to poverty, with 9 males (20.4%) and 19 females (43.2%) in their respective age groups living below the poverty level.
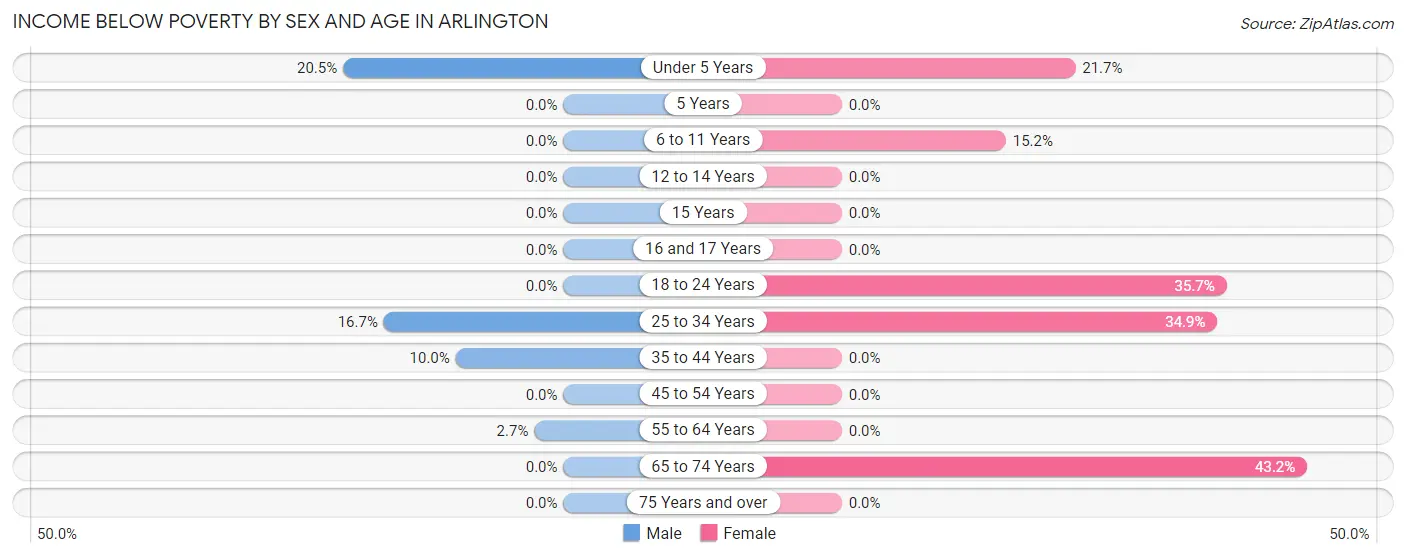
| Age Bracket | Male | Female |
| Under 5 Years | 9 (20.4%) | 13 (21.7%) |
| 5 Years | 0 (0.0%) | 0 (0.0%) |
| 6 to 11 Years | 0 (0.0%) | 7 (15.2%) |
| 12 to 14 Years | 0 (0.0%) | 0 (0.0%) |
| 15 Years | 0 (0.0%) | 0 (0.0%) |
| 16 and 17 Years | 0 (0.0%) | 0 (0.0%) |
| 18 to 24 Years | 0 (0.0%) | 5 (35.7%) |
| 25 to 34 Years | 11 (16.7%) | 23 (34.8%) |
| 35 to 44 Years | 4 (10.0%) | 0 (0.0%) |
| 45 to 54 Years | 0 (0.0%) | 0 (0.0%) |
| 55 to 64 Years | 2 (2.7%) | 0 (0.0%) |
| 65 to 74 Years | 0 (0.0%) | 19 (43.2%) |
| 75 Years and over | 0 (0.0%) | 0 (0.0%) |
| Total | 26 (6.8%) | 67 (16.0%) |
Income Above Poverty by Sex and Age in Arlington
According to the poverty statistics in Arlington, males aged 5 years and females aged 5 years are the age groups that are most secure financially, with 100.0% of males and 100.0% of females in these age groups living above the poverty line.
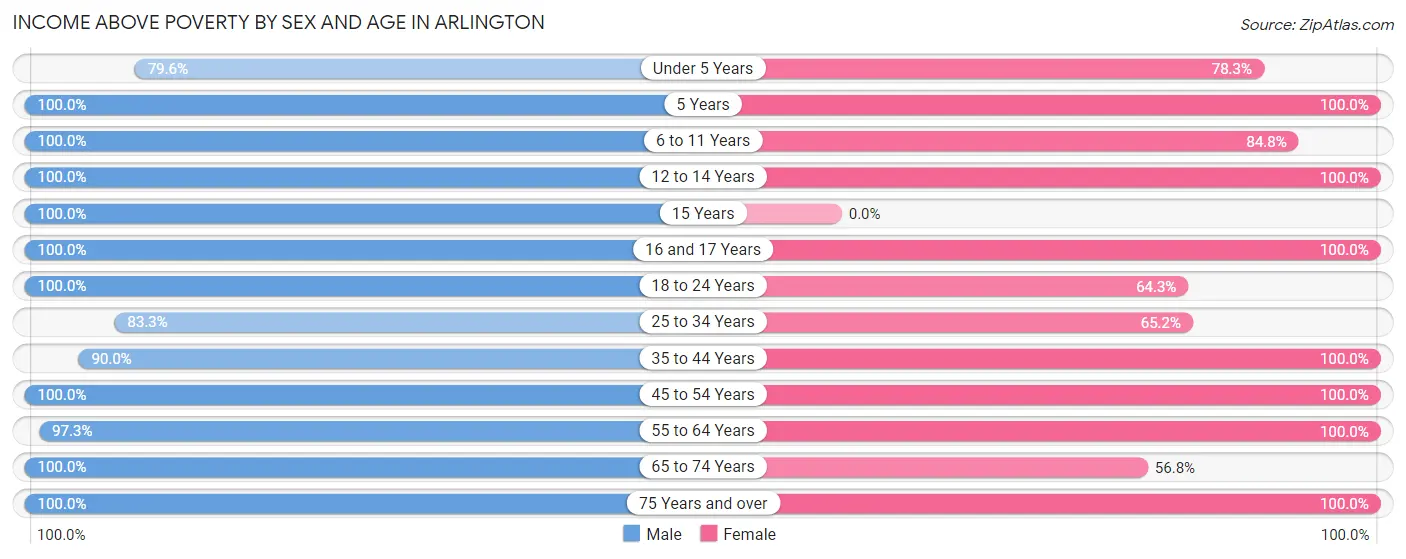
| Age Bracket | Male | Female |
| Under 5 Years | 35 (79.5%) | 47 (78.3%) |
| 5 Years | 1 (100.0%) | 9 (100.0%) |
| 6 to 11 Years | 14 (100.0%) | 39 (84.8%) |
| 12 to 14 Years | 20 (100.0%) | 16 (100.0%) |
| 15 Years | 1 (100.0%) | 0 (0.0%) |
| 16 and 17 Years | 2 (100.0%) | 4 (100.0%) |
| 18 to 24 Years | 32 (100.0%) | 9 (64.3%) |
| 25 to 34 Years | 55 (83.3%) | 43 (65.1%) |
| 35 to 44 Years | 36 (90.0%) | 44 (100.0%) |
| 45 to 54 Years | 35 (100.0%) | 33 (100.0%) |
| 55 to 64 Years | 72 (97.3%) | 59 (100.0%) |
| 65 to 74 Years | 43 (100.0%) | 25 (56.8%) |
| 75 Years and over | 9 (100.0%) | 24 (100.0%) |
| Total | 355 (93.2%) | 352 (84.0%) |
Income Below Poverty Among Married-Couple Families in Arlington
The poverty statistics for married-couple families in Arlington show that 6.0% or 11 of the total 182 families live below the poverty line. Families with 1 or 2 children have the highest poverty rate of 22.0%, comprising of 11 families. On the other hand, families with no children have the lowest poverty rate of 0.0%, which includes 0 families.
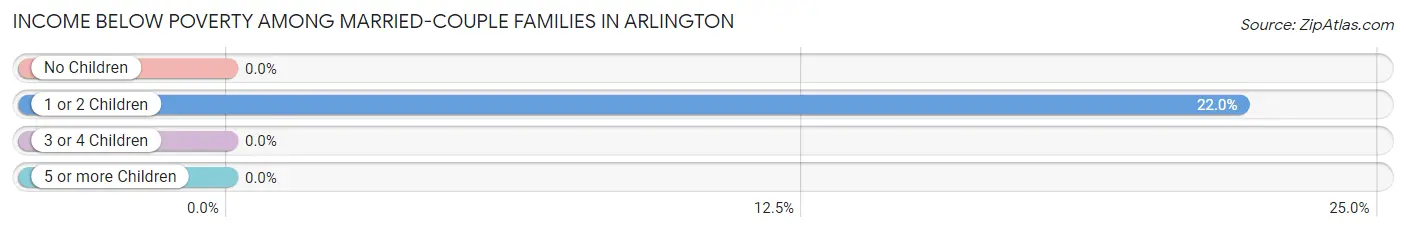
| Children | Above Poverty | Below Poverty |
| No Children | 108 (100.0%) | 0 (0.0%) |
| 1 or 2 Children | 39 (78.0%) | 11 (22.0%) |
| 3 or 4 Children | 17 (100.0%) | 0 (0.0%) |
| 5 or more Children | 7 (100.0%) | 0 (0.0%) |
| Total | 171 (94.0%) | 11 (6.0%) |
Income Below Poverty Among Single-Parent Households in Arlington
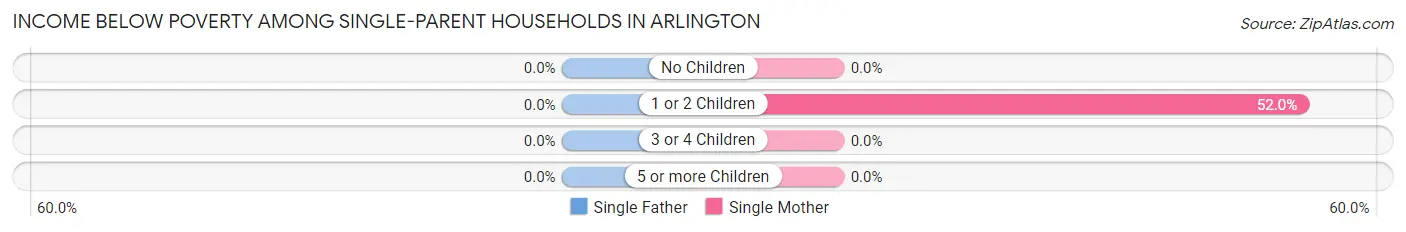
| Children | Single Father | Single Mother |
| No Children | 0 (0.0%) | 0 (0.0%) |
| 1 or 2 Children | 0 (0.0%) | 13 (52.0%) |
| 3 or 4 Children | 0 (0.0%) | 0 (0.0%) |
| 5 or more Children | 0 (0.0%) | 0 (0.0%) |
| Total | 0 (0.0%) | 13 (46.4%) |
Income Below Poverty Among Married-Couple vs Single-Parent Households in Arlington
The poverty data for Arlington shows that 11 of the married-couple family households (6.0%) and 13 of the single-parent households (37.1%) are living below the poverty level. Within the married-couple family households, those with 1 or 2 children have the highest poverty rate, with 11 households (22.0%) falling below the poverty line. Among the single-parent households, those with 1 or 2 children have the highest poverty rate, with 13 household (44.8%) living below poverty.
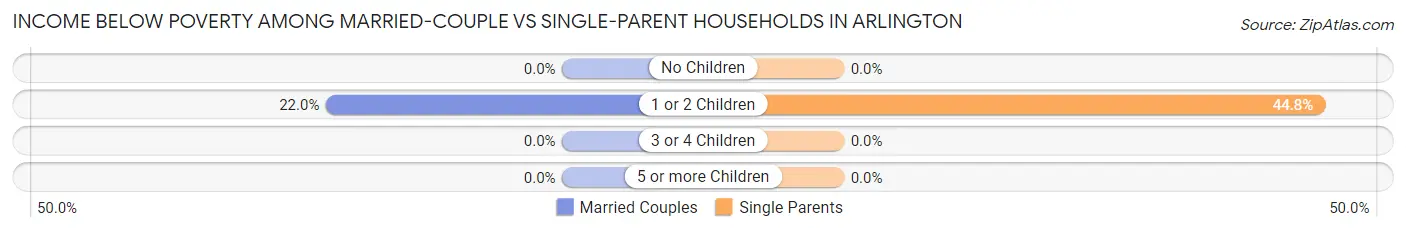
| Children | Married-Couple Families | Single-Parent Households |
| No Children | 0 (0.0%) | 0 (0.0%) |
| 1 or 2 Children | 11 (22.0%) | 13 (44.8%) |
| 3 or 4 Children | 0 (0.0%) | 0 (0.0%) |
| 5 or more Children | 0 (0.0%) | 0 (0.0%) |
| Total | 11 (6.0%) | 13 (37.1%) |
Race in Arlington
The most populous races in Arlington are White / Caucasian (843 | 99.7%), Hispanic or Latino (7 | 0.8%), and Two or more Races (3 | 0.4%).
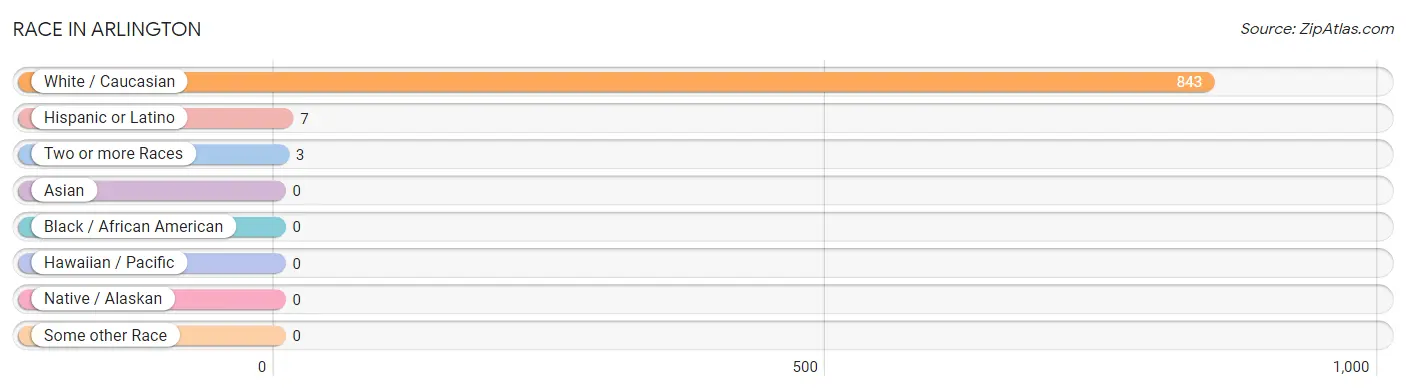
| Race | # Population | % Population |
| Asian | 0 | 0.0% |
| Black / African American | 0 | 0.0% |
| Hawaiian / Pacific | 0 | 0.0% |
| Hispanic or Latino | 7 | 0.8% |
| Native / Alaskan | 0 | 0.0% |
| White / Caucasian | 843 | 99.7% |
| Two or more Races | 3 | 0.4% |
| Some other Race | 0 | 0.0% |
| Total | 846 | 100.0% |
Ancestry in Arlington
The most populous ancestries reported in Arlington are German (421 | 49.8%), Norwegian (209 | 24.7%), Irish (95 | 11.2%), Belgian (58 | 6.9%), and Danish (58 | 6.9%), together accounting for 99.4% of all Arlington residents.
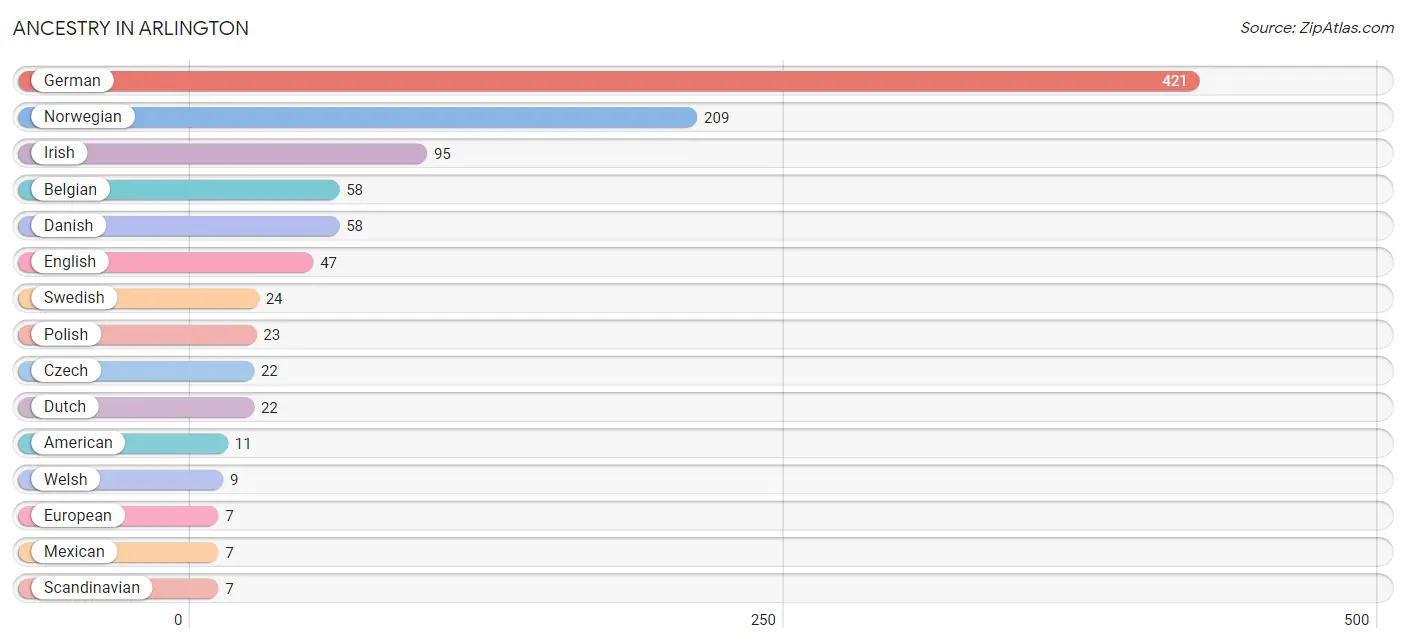
| Ancestry | # Population | % Population |
| American | 11 | 1.3% |
| Belgian | 58 | 6.9% |
| Czech | 22 | 2.6% |
| Danish | 58 | 6.9% |
| Dutch | 22 | 2.6% |
| English | 47 | 5.6% |
| European | 7 | 0.8% |
| French | 6 | 0.7% |
| German | 421 | 49.8% |
| Irish | 95 | 11.2% |
| Luxembourger | 3 | 0.4% |
| Mexican | 7 | 0.8% |
| Northern European | 2 | 0.2% |
| Norwegian | 209 | 24.7% |
| Polish | 23 | 2.7% |
| Scandinavian | 7 | 0.8% |
| Scotch-Irish | 7 | 0.8% |
| Swedish | 24 | 2.8% |
| Welsh | 9 | 1.1% | View All 19 Rows |
Immigrants in Arlington
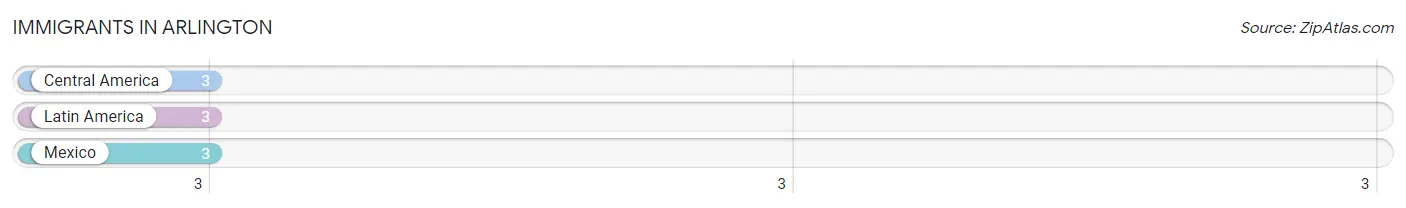
The most numerous immigrant groups reported in Arlington came from Central America (3 | 0.4%), Latin America (3 | 0.4%), and Mexico (3 | 0.4%), together accounting for 1.1% of all Arlington residents.
| Immigration Origin | # Population | % Population |
| Central America | 3 | 0.4% |
| Latin America | 3 | 0.4% |
| Mexico | 3 | 0.4% | View All 3 Rows |
Sex and Age in Arlington
Sex and Age in Arlington
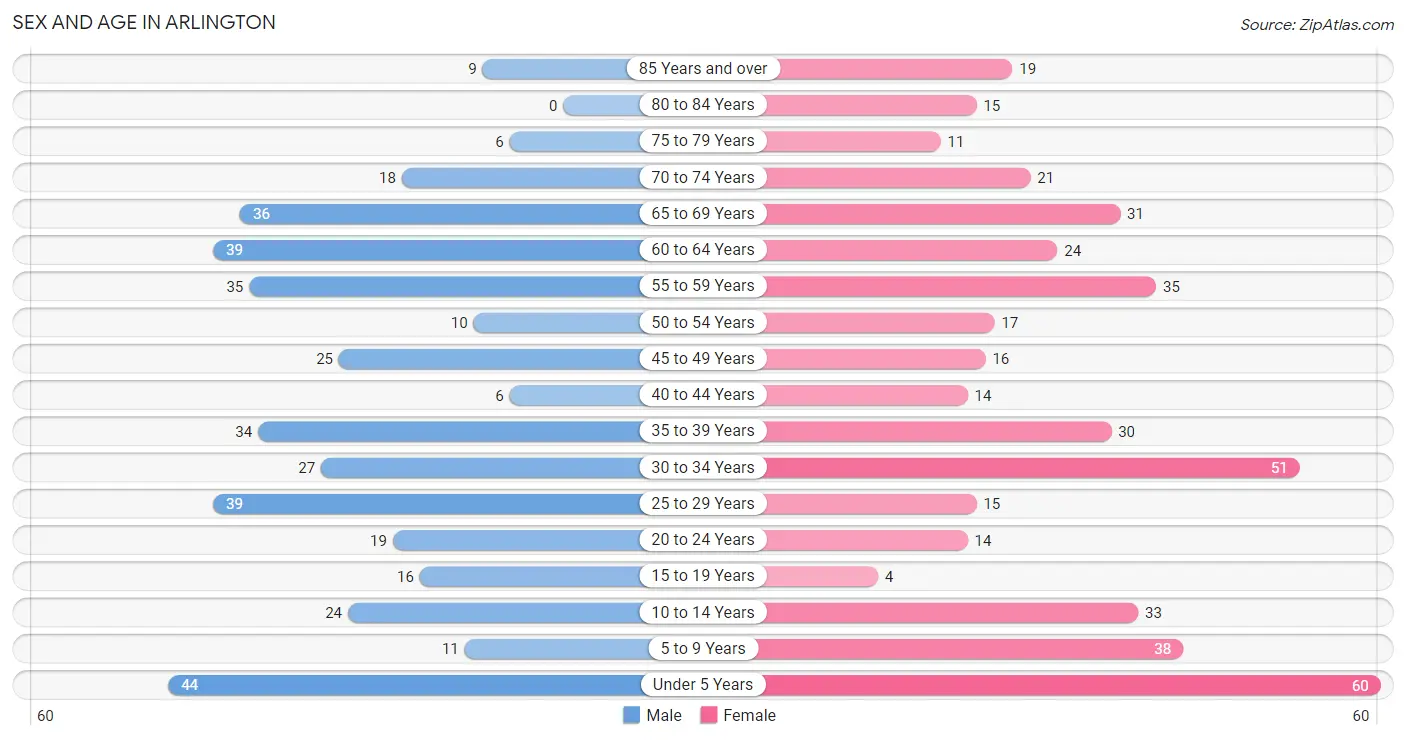
The most populous age groups in Arlington are Under 5 Years (44 | 11.1%) for men and Under 5 Years (60 | 13.4%) for women.
| Age Bracket | Male | Female |
| Under 5 Years | 44 (11.1%) | 60 (13.4%) |
| 5 to 9 Years | 11 (2.8%) | 38 (8.5%) |
| 10 to 14 Years | 24 (6.0%) | 33 (7.4%) |
| 15 to 19 Years | 16 (4.0%) | 4 (0.9%) |
| 20 to 24 Years | 19 (4.8%) | 14 (3.1%) |
| 25 to 29 Years | 39 (9.8%) | 15 (3.4%) |
| 30 to 34 Years | 27 (6.8%) | 51 (11.4%) |
| 35 to 39 Years | 34 (8.5%) | 30 (6.7%) |
| 40 to 44 Years | 6 (1.5%) | 14 (3.1%) |
| 45 to 49 Years | 25 (6.3%) | 16 (3.6%) |
| 50 to 54 Years | 10 (2.5%) | 17 (3.8%) |
| 55 to 59 Years | 35 (8.8%) | 35 (7.8%) |
| 60 to 64 Years | 39 (9.8%) | 24 (5.4%) |
| 65 to 69 Years | 36 (9.0%) | 31 (6.9%) |
| 70 to 74 Years | 18 (4.5%) | 21 (4.7%) |
| 75 to 79 Years | 6 (1.5%) | 11 (2.5%) |
| 80 to 84 Years | 0 (0.0%) | 15 (3.4%) |
| 85 Years and over | 9 (2.3%) | 19 (4.2%) |
| Total | 398 (100.0%) | 448 (100.0%) |
Families and Households in Arlington
Median Family Size in Arlington
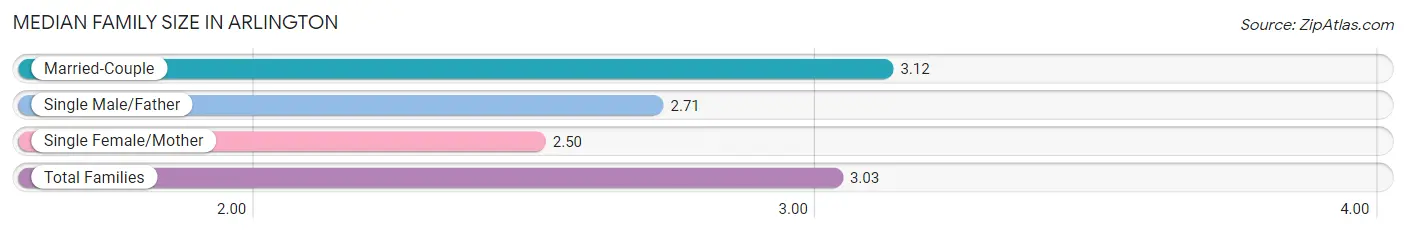
The median family size in Arlington is 3.03 persons per family, with married-couple families (182 | 83.9%) accounting for the largest median family size of 3.12 persons per family. On the other hand, single female/mother families (28 | 12.9%) represent the smallest median family size with 2.50 persons per family.
| Family Type | # Families | Family Size |
| Married-Couple | 182 (83.9%) | 3.12 |
| Single Male/Father | 7 (3.2%) | 2.71 |
| Single Female/Mother | 28 (12.9%) | 2.50 |
| Total Families | 217 (100.0%) | 3.03 |
Median Household Size in Arlington
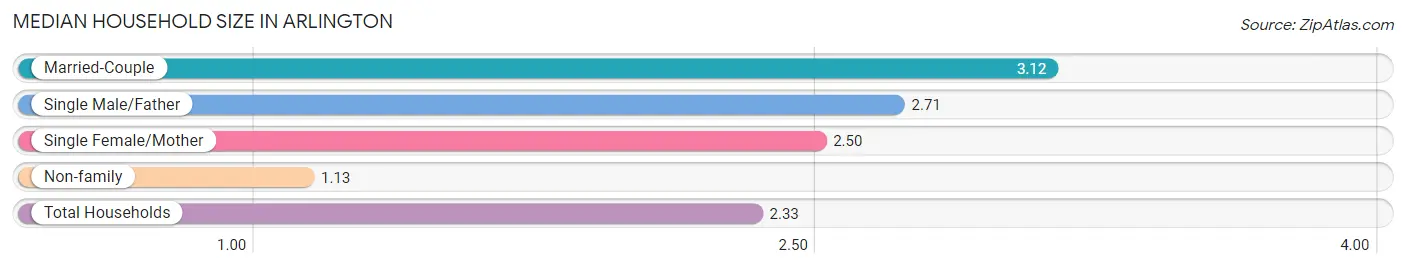
The median household size in Arlington is 2.33 persons per household, with married-couple households (182 | 53.1%) accounting for the largest median household size of 3.12 persons per household. non-family households (126 | 36.7%) represent the smallest median household size with 1.13 persons per household.
| Household Type | # Households | Household Size |
| Married-Couple | 182 (53.1%) | 3.12 |
| Single Male/Father | 7 (2.0%) | 2.71 |
| Single Female/Mother | 28 (8.2%) | 2.50 |
| Non-family | 126 (36.7%) | 1.13 |
| Total Households | 343 (100.0%) | 2.33 |
Household Size by Marriage Status in Arlington
Out of a total of 343 households in Arlington, 217 (63.3%) are family households, while 126 (36.7%) are nonfamily households. The most numerous type of family households are 2-person households, comprising 122, and the most common type of nonfamily households are 1-person households, comprising 108.
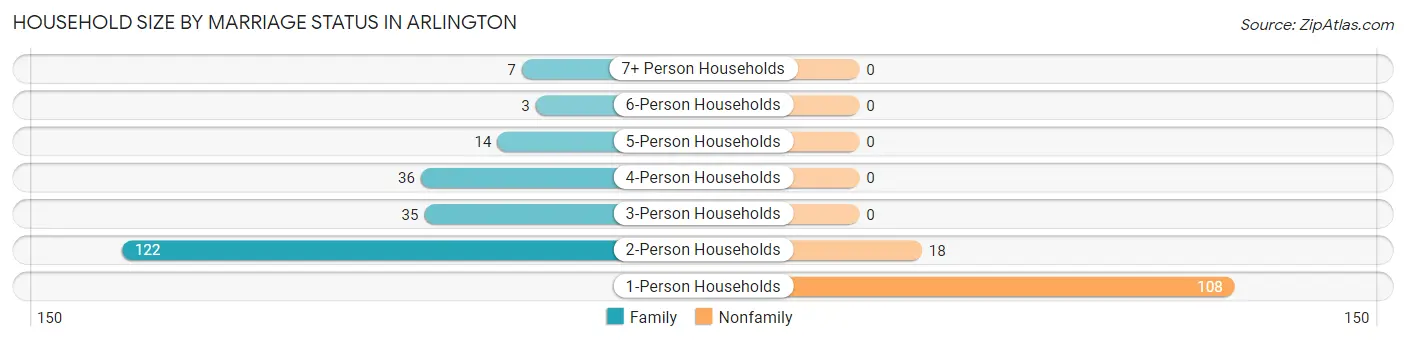
| Household Size | Family Households | Nonfamily Households |
| 1-Person Households | - | 108 (31.5%) |
| 2-Person Households | 122 (35.6%) | 18 (5.2%) |
| 3-Person Households | 35 (10.2%) | 0 (0.0%) |
| 4-Person Households | 36 (10.5%) | 0 (0.0%) |
| 5-Person Households | 14 (4.1%) | 0 (0.0%) |
| 6-Person Households | 3 (0.9%) | 0 (0.0%) |
| 7+ Person Households | 7 (2.0%) | 0 (0.0%) |
| Total | 217 (63.3%) | 126 (36.7%) |
Female Fertility in Arlington
Fertility by Age in Arlington
Average fertility rate in Arlington is 103.0 births per 1,000 women. Women in the age bracket of 20 to 34 years have the highest fertility rate with 188.0 births per 1,000 women. Women in the age bracket of 20 to 34 years acount for 100.0% of all women with births.
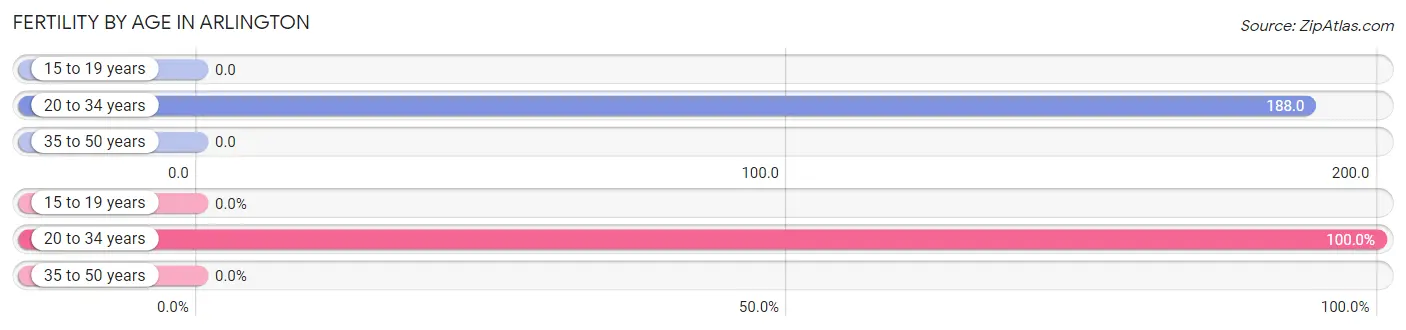
| Age Bracket | Women with Births | Births / 1,000 Women |
| 15 to 19 years | 0 (0.0%) | 0.0 |
| 20 to 34 years | 15 (100.0%) | 188.0 |
| 35 to 50 years | 0 (0.0%) | 0.0 |
| Total | 15 (100.0%) | 103.0 |
Fertility by Age by Marriage Status in Arlington
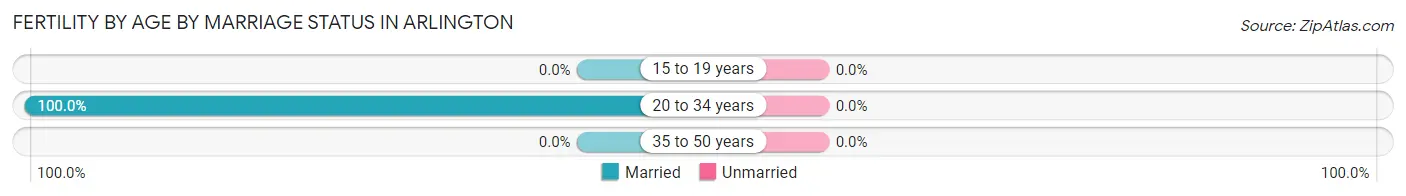
| Age Bracket | Married | Unmarried |
| 15 to 19 years | 0 (0.0%) | 0 (0.0%) |
| 20 to 34 years | 15 (100.0%) | 0 (0.0%) |
| 35 to 50 years | 0 (0.0%) | 0 (0.0%) |
| Total | 15 (100.0%) | 0 (0.0%) |
Fertility by Education in Arlington
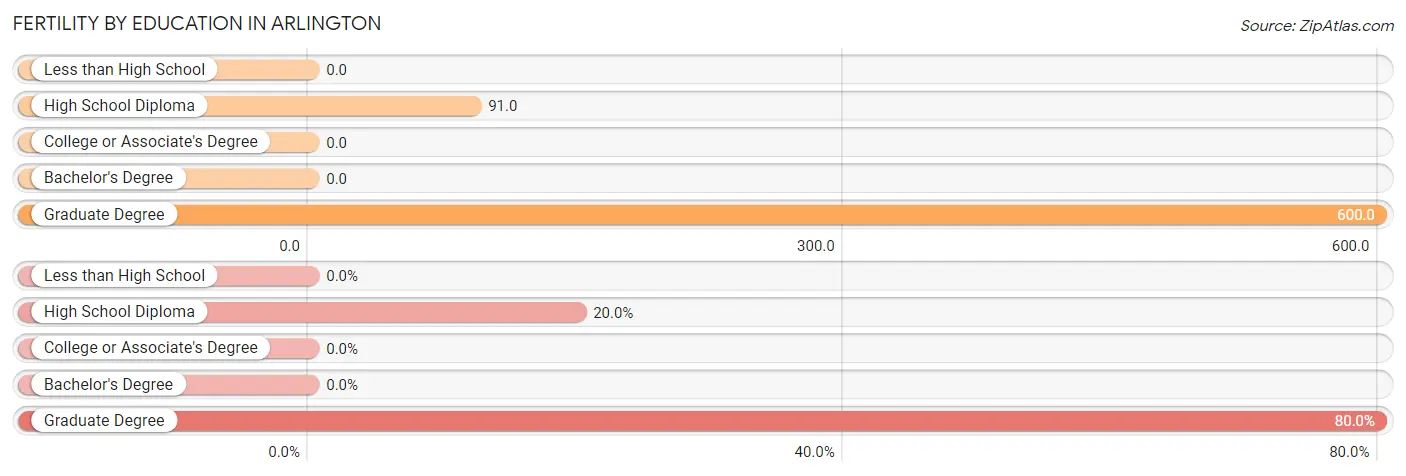
| Educational Attainment | Women with Births | Births / 1,000 Women |
| Less than High School | 0 (0.0%) | 0.0 |
| High School Diploma | 3 (20.0%) | 91.0 |
| College or Associate's Degree | 0 (0.0%) | 0.0 |
| Bachelor's Degree | 0 (0.0%) | 0.0 |
| Graduate Degree | 12 (80.0%) | 600.0 |
| Total | 15 (100.0%) | 103.0 |
Fertility by Education by Marriage Status in Arlington
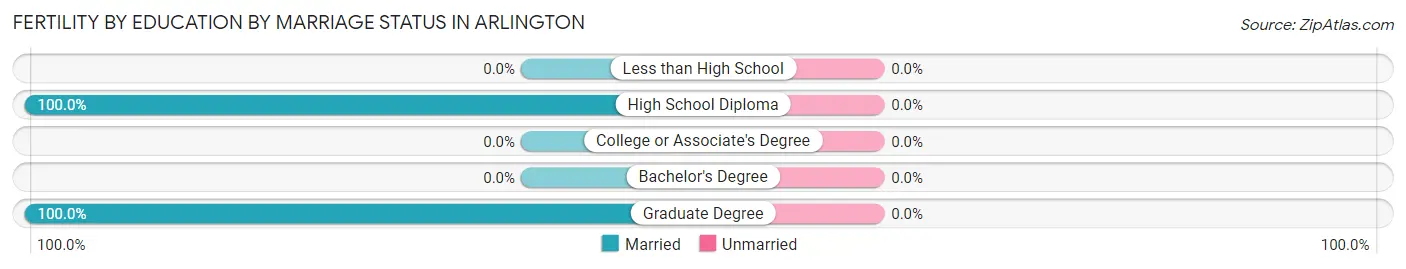
| Educational Attainment | Married | Unmarried |
| Less than High School | 0 (0.0%) | 0 (0.0%) |
| High School Diploma | 3 (100.0%) | 0 (0.0%) |
| College or Associate's Degree | 0 (0.0%) | 0 (0.0%) |
| Bachelor's Degree | 0 (0.0%) | 0 (0.0%) |
| Graduate Degree | 12 (100.0%) | 0 (0.0%) |
| Total | 15 (100.0%) | 0 (0.0%) |
Employment Characteristics in Arlington
Employment by Class of Employer in Arlington
Among the 426 employed individuals in Arlington, private company employees (286 | 67.1%), local government employees (43 | 10.1%), and state government employees (28 | 6.6%) make up the most common classes of employment.
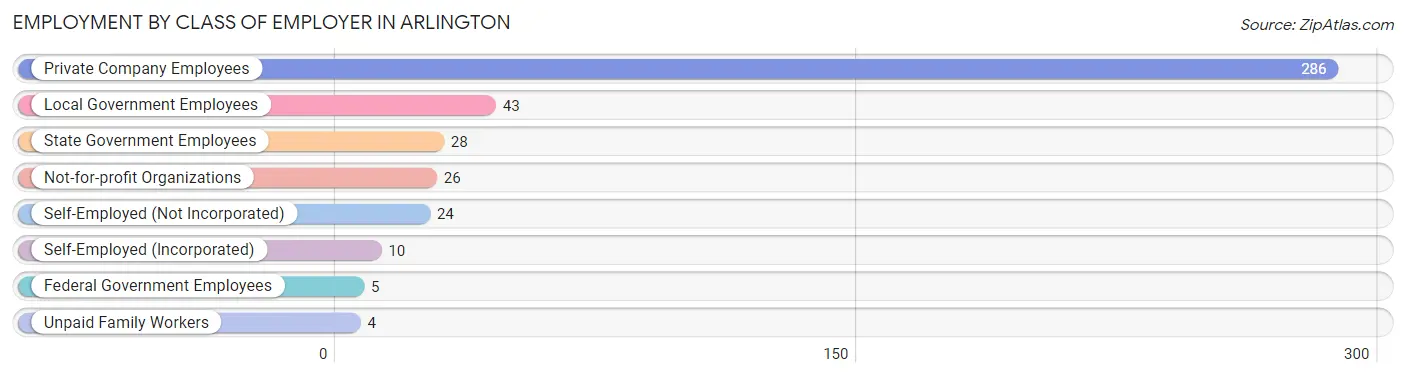
| Employer Class | # Employees | % Employees |
| Private Company Employees | 286 | 67.1% |
| Self-Employed (Incorporated) | 10 | 2.4% |
| Self-Employed (Not Incorporated) | 24 | 5.6% |
| Not-for-profit Organizations | 26 | 6.1% |
| Local Government Employees | 43 | 10.1% |
| State Government Employees | 28 | 6.6% |
| Federal Government Employees | 5 | 1.2% |
| Unpaid Family Workers | 4 | 0.9% |
| Total | 426 | 100.0% |
Employment Status by Age in Arlington
According to the labor force statistics for Arlington, out of the total population over 16 years of age (635), 67.7% or 430 individuals are in the labor force, with 0.9% or 4 of them unemployed. The age group with the highest labor force participation rate is 16 to 19 years, with 100.0% or 19 individuals in the labor force. Within the labor force, the 25 to 29 years age range has the highest percentage of unemployed individuals, with 8.0% or 4 of them being unemployed.
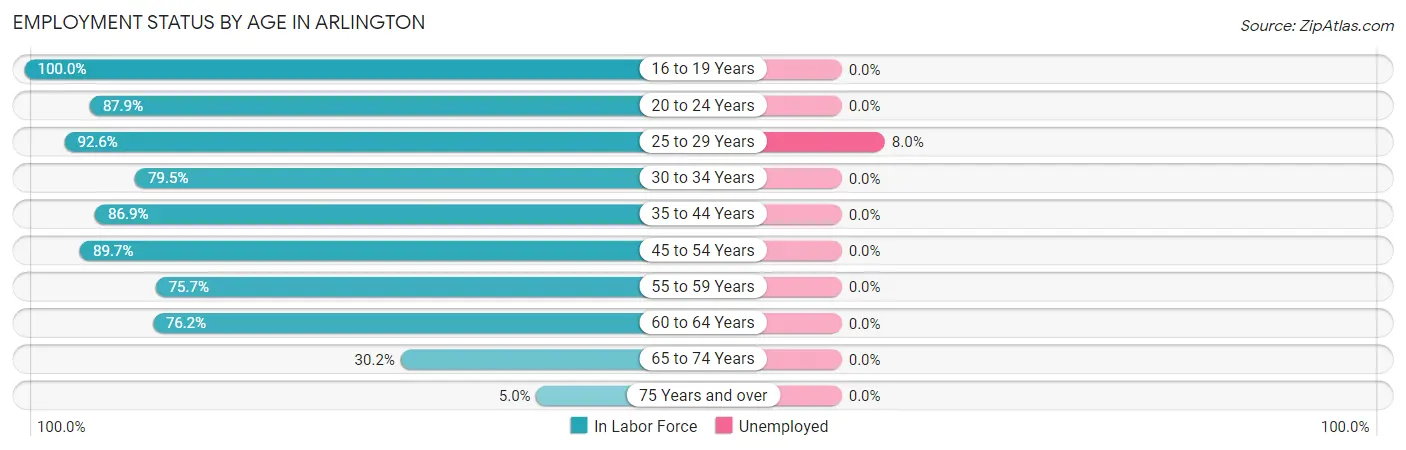
| Age Bracket | In Labor Force | Unemployed |
| 16 to 19 Years | 19 (100.0%) | 0 (0.0%) |
| 20 to 24 Years | 29 (87.9%) | 0 (0.0%) |
| 25 to 29 Years | 50 (92.6%) | 4 (8.0%) |
| 30 to 34 Years | 62 (79.5%) | 0 (0.0%) |
| 35 to 44 Years | 73 (86.9%) | 0 (0.0%) |
| 45 to 54 Years | 61 (89.7%) | 0 (0.0%) |
| 55 to 59 Years | 53 (75.7%) | 0 (0.0%) |
| 60 to 64 Years | 48 (76.2%) | 0 (0.0%) |
| 65 to 74 Years | 32 (30.2%) | 0 (0.0%) |
| 75 Years and over | 3 (5.0%) | 0 (0.0%) |
| Total | 430 (67.7%) | 4 (0.9%) |
Employment Status by Educational Attainment in Arlington
According to labor force statistics for Arlington, 83.2% of individuals (347) out of the total population between 25 and 64 years of age (417) are in the labor force, with 1.2% or 4 of them being unemployed. The group with the highest labor force participation rate are those with the educational attainment of high school diploma, with 90.9% or 130 individuals in the labor force. Within the labor force, individuals with high school diploma education have the highest percentage of unemployment, with 3.1% or 4 of them being unemployed.
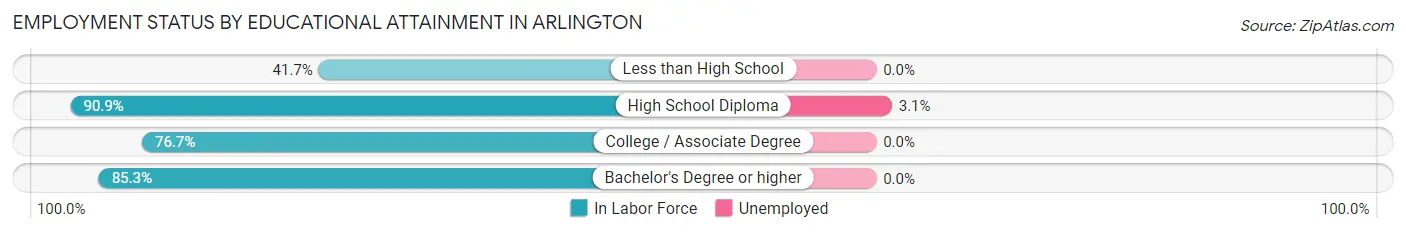
| Educational Attainment | In Labor Force | Unemployed |
| Less than High School | 5 (41.7%) | 0 (0.0%) |
| High School Diploma | 130 (90.9%) | 4 (3.1%) |
| College / Associate Degree | 102 (76.7%) | 0 (0.0%) |
| Bachelor's Degree or higher | 110 (85.3%) | 0 (0.0%) |
| Total | 347 (83.2%) | 5 (1.2%) |
Employment Occupations by Sex in Arlington
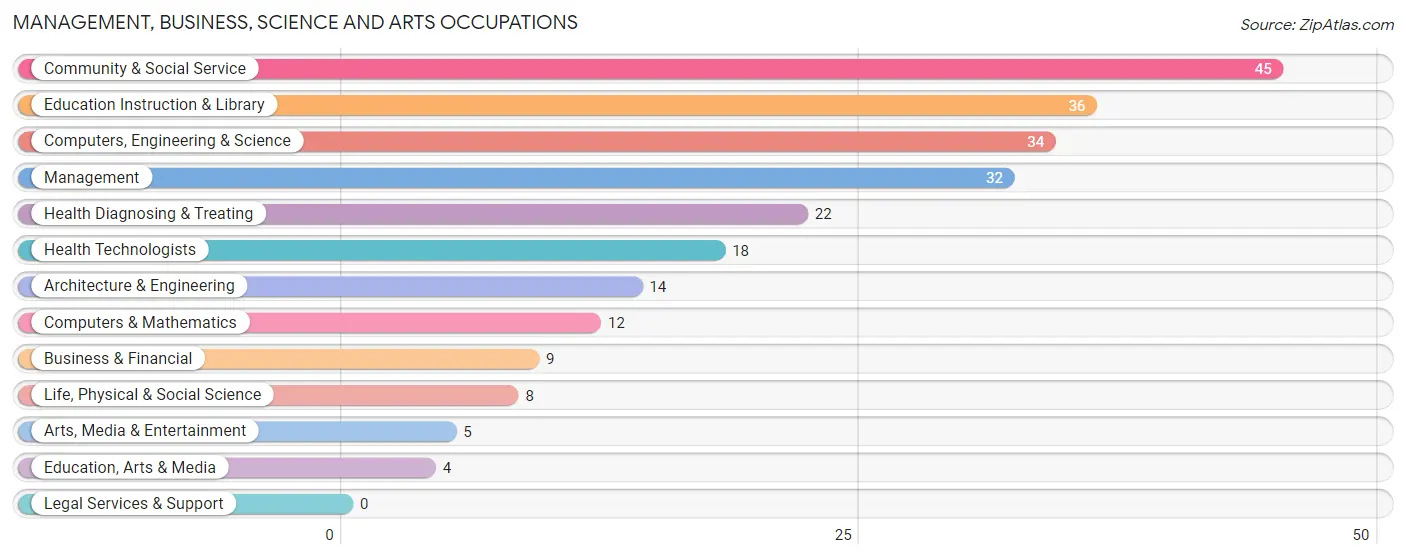
Management, Business, Science and Arts Occupations
The most common Management, Business, Science and Arts occupations in Arlington are Community & Social Service (45 | 10.6%), Education Instruction & Library (36 | 8.5%), Computers, Engineering & Science (34 | 8.0%), Management (32 | 7.5%), and Health Diagnosing & Treating (22 | 5.2%).
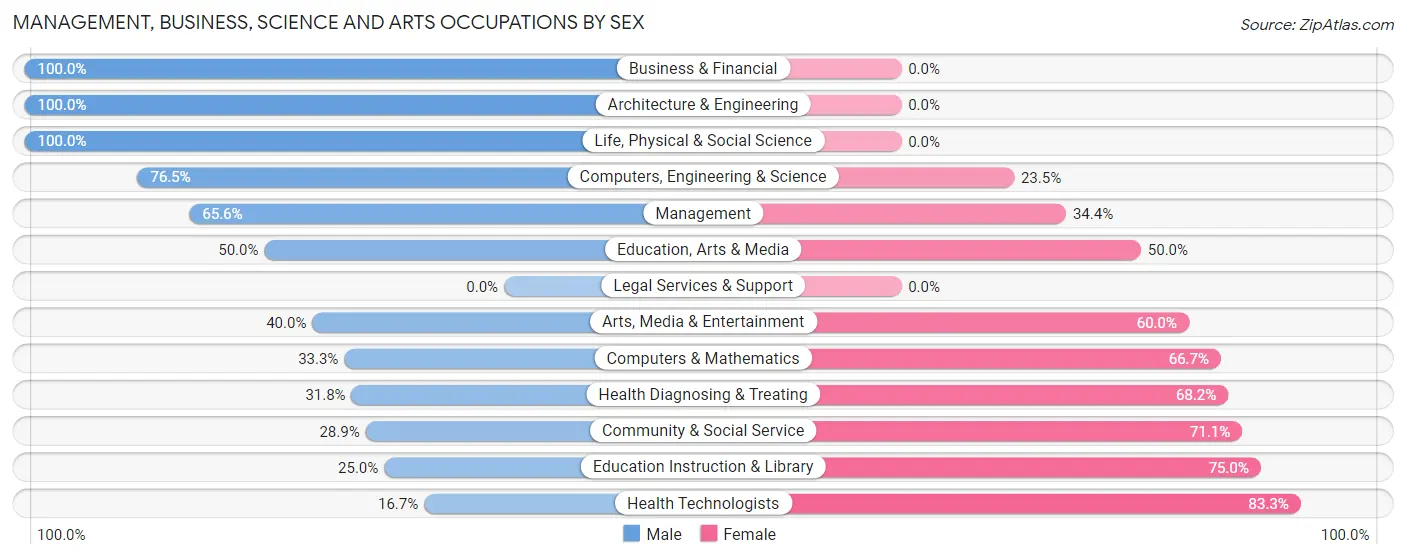
Management, Business, Science and Arts Occupations by Sex
Within the Management, Business, Science and Arts occupations in Arlington, the most male-oriented occupations are Business & Financial (100.0%), Architecture & Engineering (100.0%), and Life, Physical & Social Science (100.0%), while the most female-oriented occupations are Health Technologists (83.3%), Education Instruction & Library (75.0%), and Community & Social Service (71.1%).
| Occupation | Male | Female |
| Management | 21 (65.6%) | 11 (34.4%) |
| Business & Financial | 9 (100.0%) | 0 (0.0%) |
| Computers, Engineering & Science | 26 (76.5%) | 8 (23.5%) |
| Computers & Mathematics | 4 (33.3%) | 8 (66.7%) |
| Architecture & Engineering | 14 (100.0%) | 0 (0.0%) |
| Life, Physical & Social Science | 8 (100.0%) | 0 (0.0%) |
| Community & Social Service | 13 (28.9%) | 32 (71.1%) |
| Education, Arts & Media | 2 (50.0%) | 2 (50.0%) |
| Legal Services & Support | 0 (0.0%) | 0 (0.0%) |
| Education Instruction & Library | 9 (25.0%) | 27 (75.0%) |
| Arts, Media & Entertainment | 2 (40.0%) | 3 (60.0%) |
| Health Diagnosing & Treating | 7 (31.8%) | 15 (68.2%) |
| Health Technologists | 3 (16.7%) | 15 (83.3%) |
| Total (Category) | 76 (53.5%) | 66 (46.5%) |
| Total (Overall) | 238 (55.9%) | 188 (44.1%) |
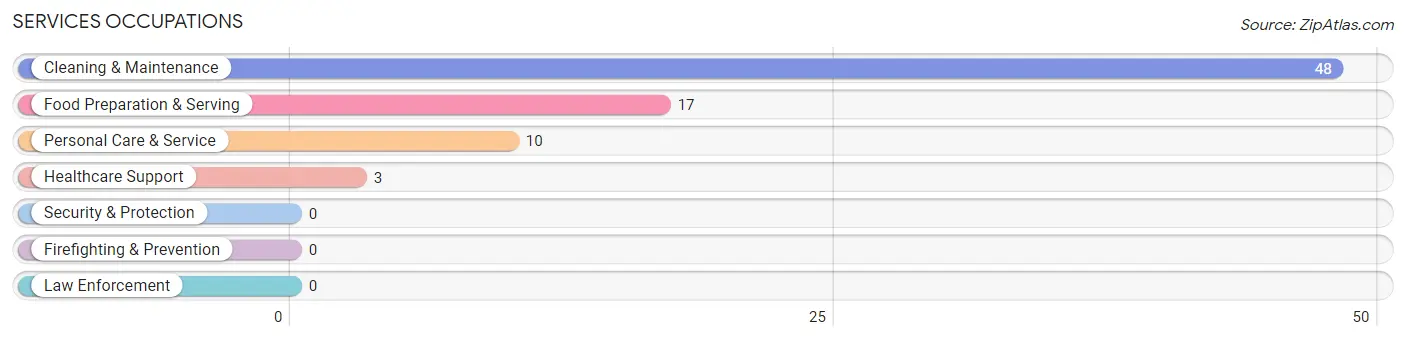
Services Occupations
The most common Services occupations in Arlington are Cleaning & Maintenance (48 | 11.3%), Food Preparation & Serving (17 | 4.0%), Personal Care & Service (10 | 2.4%), and Healthcare Support (3 | 0.7%).
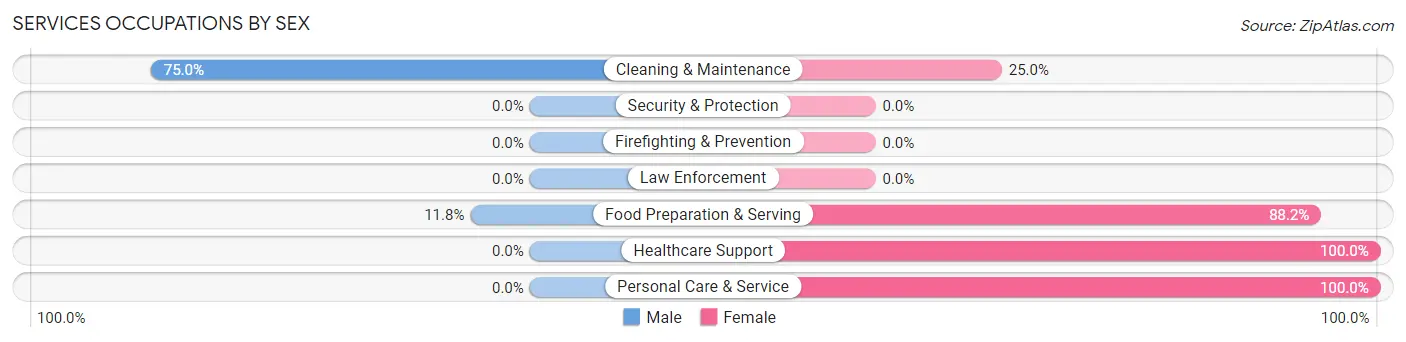
Services Occupations by Sex
Within the Services occupations in Arlington, the most male-oriented occupations are Cleaning & Maintenance (75.0%), and Food Preparation & Serving (11.8%), while the most female-oriented occupations are Healthcare Support (100.0%), Personal Care & Service (100.0%), and Food Preparation & Serving (88.2%).
| Occupation | Male | Female |
| Healthcare Support | 0 (0.0%) | 3 (100.0%) |
| Security & Protection | 0 (0.0%) | 0 (0.0%) |
| Firefighting & Prevention | 0 (0.0%) | 0 (0.0%) |
| Law Enforcement | 0 (0.0%) | 0 (0.0%) |
| Food Preparation & Serving | 2 (11.8%) | 15 (88.2%) |
| Cleaning & Maintenance | 36 (75.0%) | 12 (25.0%) |
| Personal Care & Service | 0 (0.0%) | 10 (100.0%) |
| Total (Category) | 38 (48.7%) | 40 (51.3%) |
| Total (Overall) | 238 (55.9%) | 188 (44.1%) |
Sales and Office Occupations
The most common Sales and Office occupations in Arlington are Sales & Related (45 | 10.6%), and Office & Administration (32 | 7.5%).
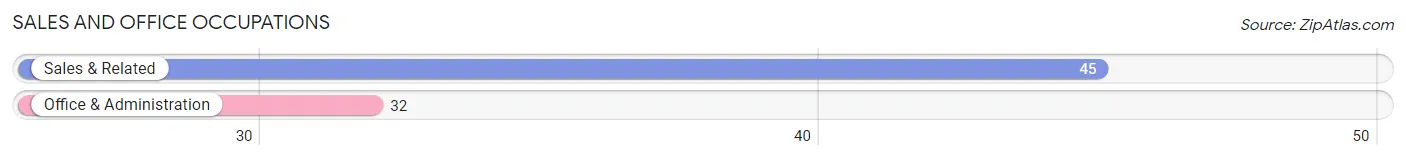
Sales and Office Occupations by Sex

| Occupation | Male | Female |
| Sales & Related | 3 (6.7%) | 42 (93.3%) |
| Office & Administration | 14 (43.8%) | 18 (56.2%) |
| Total (Category) | 17 (22.1%) | 60 (77.9%) |
| Total (Overall) | 238 (55.9%) | 188 (44.1%) |
Natural Resources, Construction and Maintenance Occupations
The most common Natural Resources, Construction and Maintenance occupations in Arlington are Installation, Maintenance & Repair (26 | 6.1%), and Construction & Extraction (17 | 4.0%).
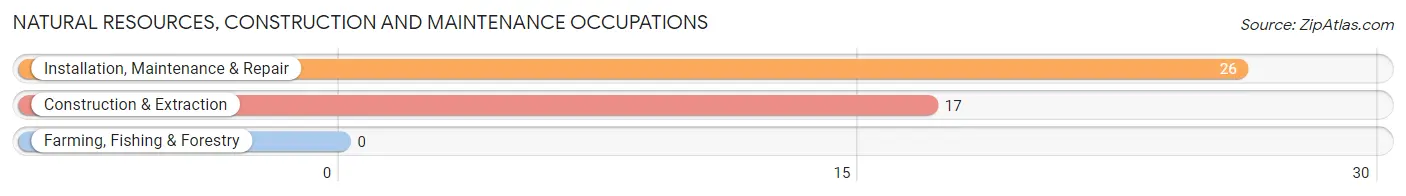
Natural Resources, Construction and Maintenance Occupations by Sex
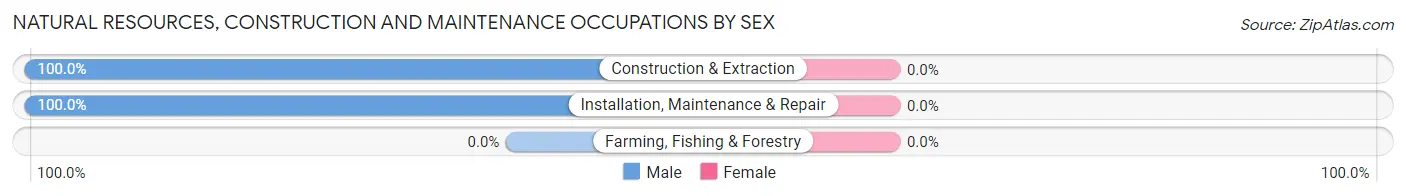
| Occupation | Male | Female |
| Farming, Fishing & Forestry | 0 (0.0%) | 0 (0.0%) |
| Construction & Extraction | 17 (100.0%) | 0 (0.0%) |
| Installation, Maintenance & Repair | 26 (100.0%) | 0 (0.0%) |
| Total (Category) | 43 (100.0%) | 0 (0.0%) |
| Total (Overall) | 238 (55.9%) | 188 (44.1%) |
Production, Transportation and Moving Occupations
The most common Production, Transportation and Moving occupations in Arlington are Production (49 | 11.5%), Transportation (24 | 5.6%), and Material Moving (13 | 3.0%).
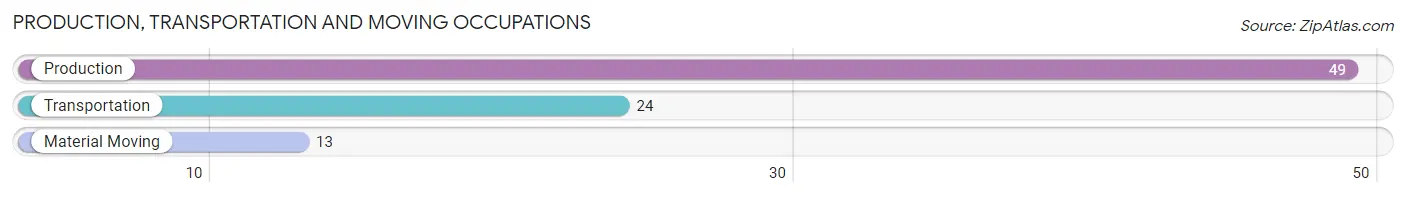
Production, Transportation and Moving Occupations by Sex
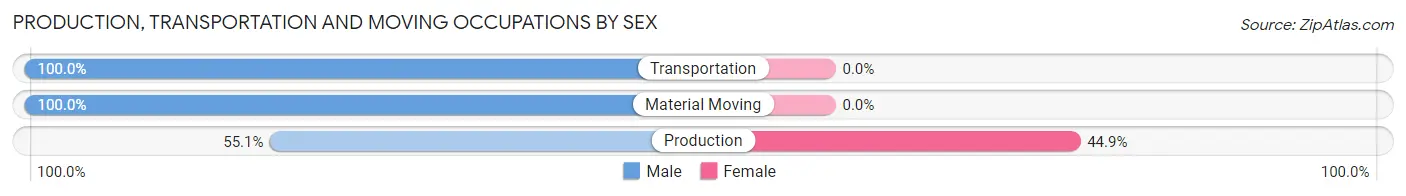
| Occupation | Male | Female |
| Production | 27 (55.1%) | 22 (44.9%) |
| Transportation | 24 (100.0%) | 0 (0.0%) |
| Material Moving | 13 (100.0%) | 0 (0.0%) |
| Total (Category) | 64 (74.4%) | 22 (25.6%) |
| Total (Overall) | 238 (55.9%) | 188 (44.1%) |
Employment Industries by Sex in Arlington
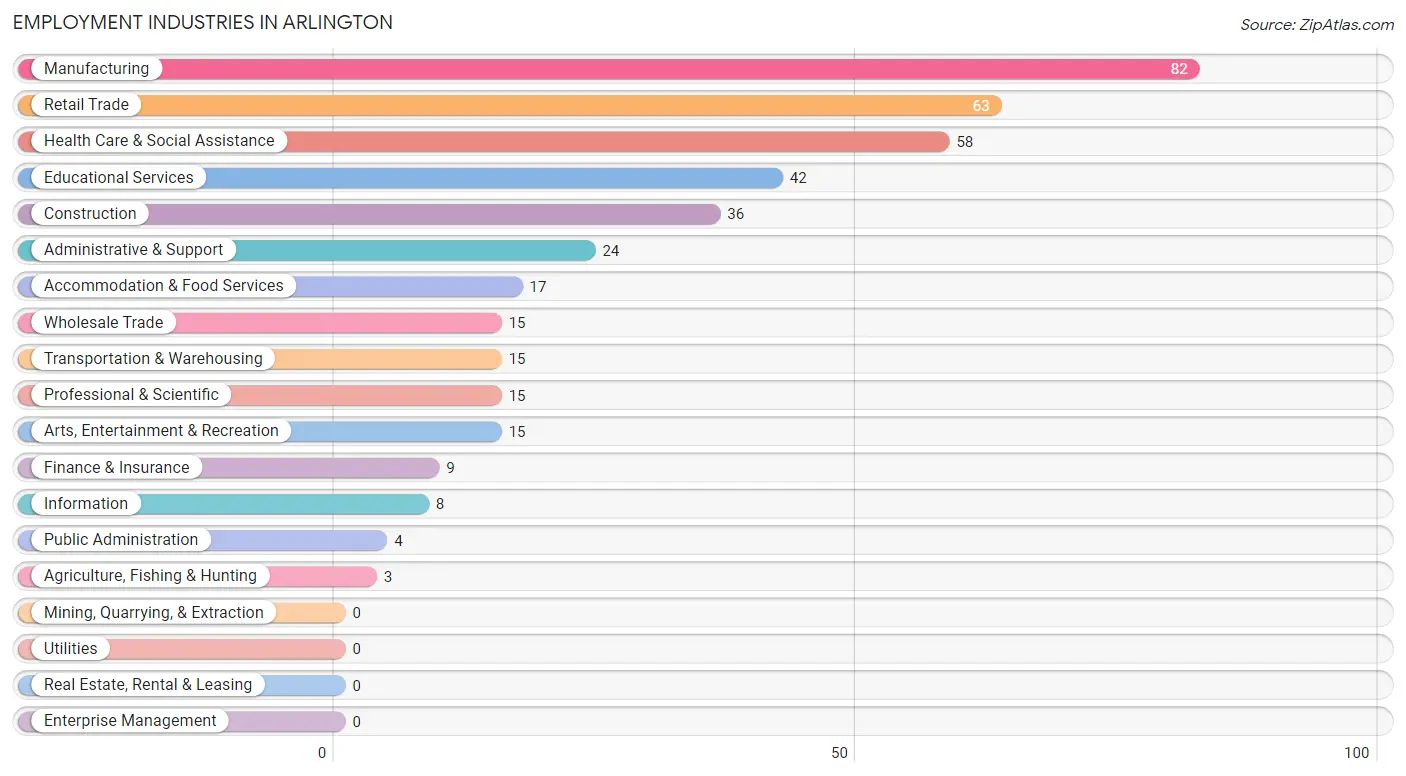
Employment Industries in Arlington
The major employment industries in Arlington include Manufacturing (82 | 19.3%), Retail Trade (63 | 14.8%), Health Care & Social Assistance (58 | 13.6%), Educational Services (42 | 9.9%), and Construction (36 | 8.5%).
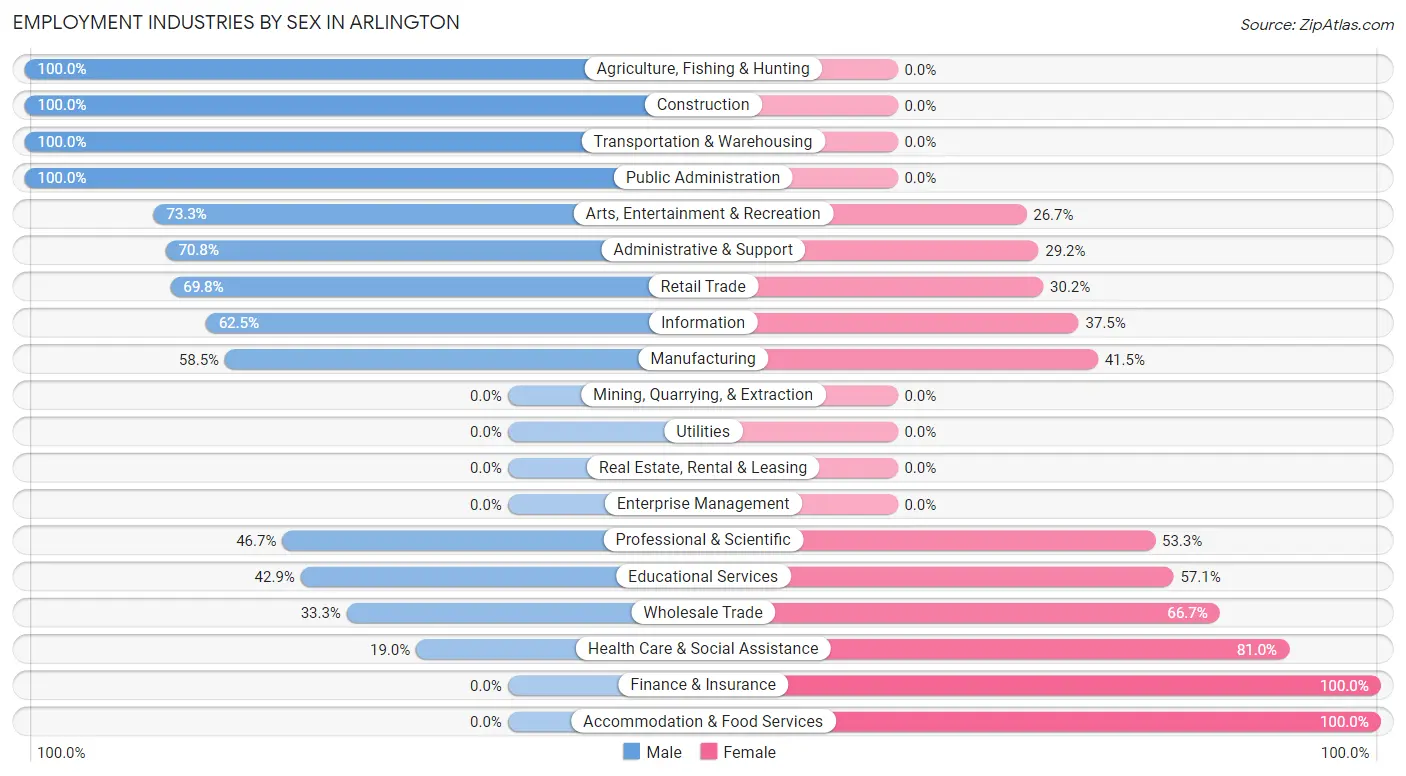
Employment Industries by Sex in Arlington
The Arlington industries that see more men than women are Agriculture, Fishing & Hunting (100.0%), Construction (100.0%), and Transportation & Warehousing (100.0%), whereas the industries that tend to have a higher number of women are Finance & Insurance (100.0%), Accommodation & Food Services (100.0%), and Health Care & Social Assistance (81.0%).
| Industry | Male | Female |
| Agriculture, Fishing & Hunting | 3 (100.0%) | 0 (0.0%) |
| Mining, Quarrying, & Extraction | 0 (0.0%) | 0 (0.0%) |
| Construction | 36 (100.0%) | 0 (0.0%) |
| Manufacturing | 48 (58.5%) | 34 (41.5%) |
| Wholesale Trade | 5 (33.3%) | 10 (66.7%) |
| Retail Trade | 44 (69.8%) | 19 (30.2%) |
| Transportation & Warehousing | 15 (100.0%) | 0 (0.0%) |
| Utilities | 0 (0.0%) | 0 (0.0%) |
| Information | 5 (62.5%) | 3 (37.5%) |
| Finance & Insurance | 0 (0.0%) | 9 (100.0%) |
| Real Estate, Rental & Leasing | 0 (0.0%) | 0 (0.0%) |
| Professional & Scientific | 7 (46.7%) | 8 (53.3%) |
| Enterprise Management | 0 (0.0%) | 0 (0.0%) |
| Administrative & Support | 17 (70.8%) | 7 (29.2%) |
| Educational Services | 18 (42.9%) | 24 (57.1%) |
| Health Care & Social Assistance | 11 (19.0%) | 47 (81.0%) |
| Arts, Entertainment & Recreation | 11 (73.3%) | 4 (26.7%) |
| Accommodation & Food Services | 0 (0.0%) | 17 (100.0%) |
| Public Administration | 4 (100.0%) | 0 (0.0%) |
| Total | 238 (55.9%) | 188 (44.1%) |
Education in Arlington
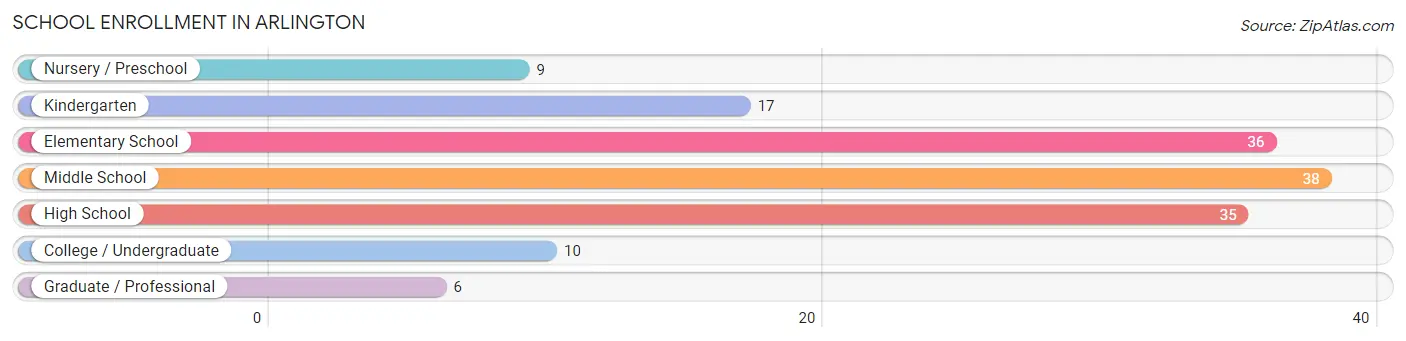
School Enrollment in Arlington
The most common levels of schooling among the 151 students in Arlington are middle school (38 | 25.2%), elementary school (36 | 23.8%), and high school (35 | 23.2%).
| School Level | # Students | % Students |
| Nursery / Preschool | 9 | 6.0% |
| Kindergarten | 17 | 11.3% |
| Elementary School | 36 | 23.8% |
| Middle School | 38 | 25.2% |
| High School | 35 | 23.2% |
| College / Undergraduate | 10 | 6.6% |
| Graduate / Professional | 6 | 4.0% |
| Total | 151 | 100.0% |
School Enrollment by Age by Funding Source in Arlington
Out of a total of 151 students who are enrolled in schools in Arlington, 9 (6.0%) attend a private institution, while the remaining 142 (94.0%) are enrolled in public schools. The age group of 3 to 4 year olds has the highest likelihood of being enrolled in private schools, with 9 (100.0% in the age bracket) enrolled. Conversely, the age group of 5 to 9 year old has the lowest likelihood of being enrolled in a private school, with 49 (100.0% in the age bracket) attending a public institution.
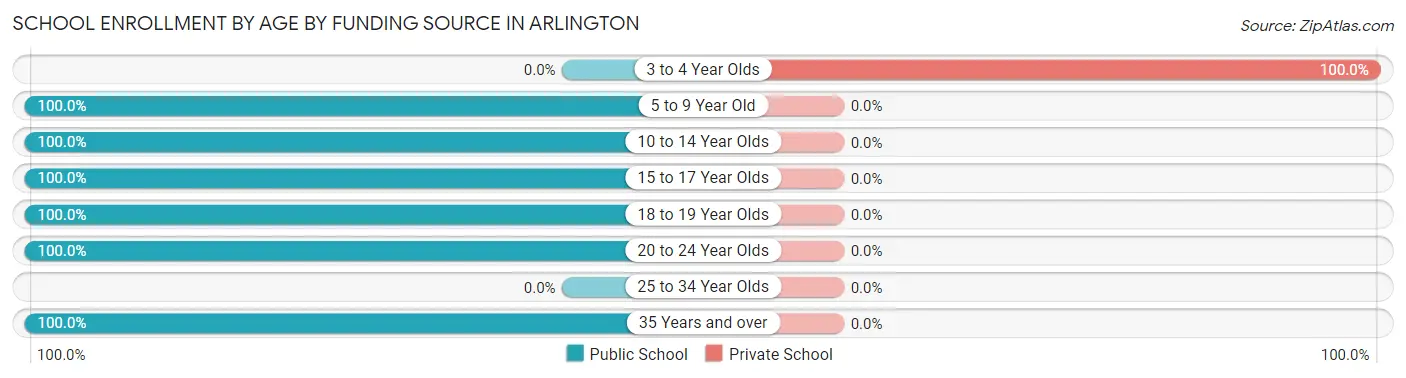
| Age Bracket | Public School | Private School |
| 3 to 4 Year Olds | 0 (0.0%) | 9 (100.0%) |
| 5 to 9 Year Old | 49 (100.0%) | 0 (0.0%) |
| 10 to 14 Year Olds | 57 (100.0%) | 0 (0.0%) |
| 15 to 17 Year Olds | 7 (100.0%) | 0 (0.0%) |
| 18 to 19 Year Olds | 13 (100.0%) | 0 (0.0%) |
| 20 to 24 Year Olds | 5 (100.0%) | 0 (0.0%) |
| 25 to 34 Year Olds | 0 (0.0%) | 0 (0.0%) |
| 35 Years and over | 11 (100.0%) | 0 (0.0%) |
| Total | 142 (94.0%) | 9 (6.0%) |
Educational Attainment by Field of Study in Arlington
Education (47 | 29.6%), bio, nature & agricultural (20 | 12.6%), engineering (18 | 11.3%), science & technology (16 | 10.1%), and business (15 | 9.4%) are the most common fields of study among 159 individuals in Arlington who have obtained a bachelor's degree or higher.
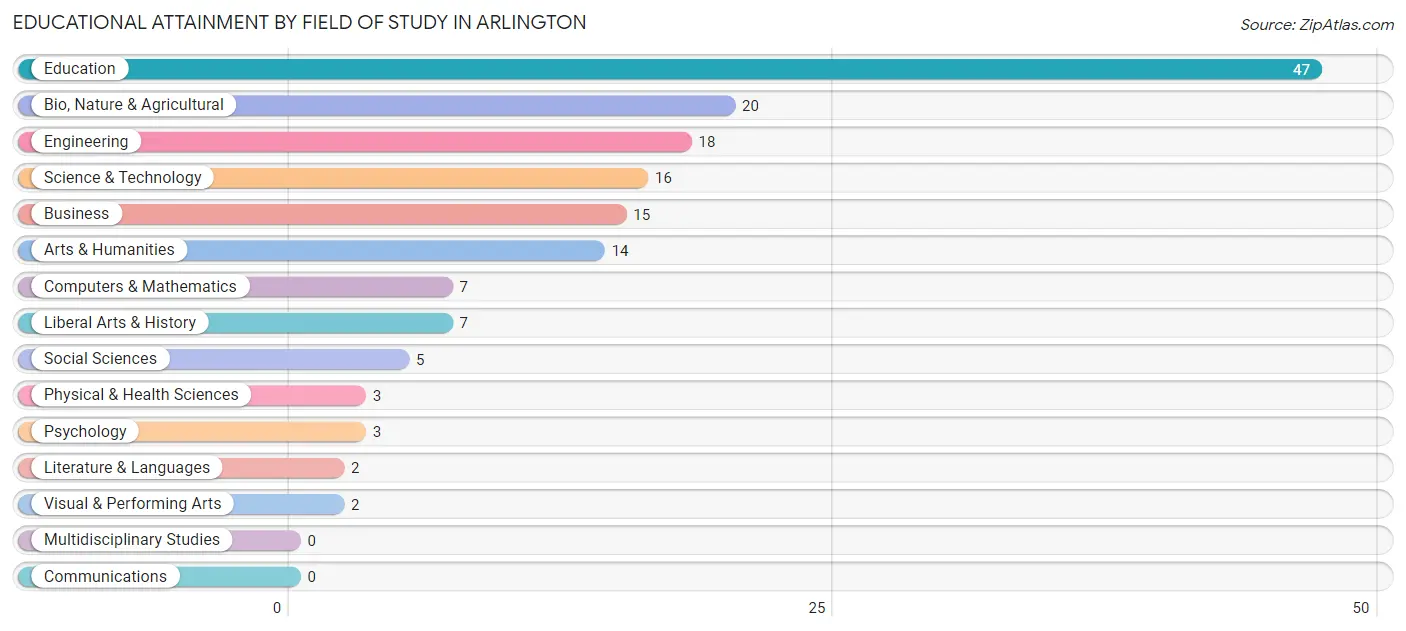
| Field of Study | # Graduates | % Graduates |
| Computers & Mathematics | 7 | 4.4% |
| Bio, Nature & Agricultural | 20 | 12.6% |
| Physical & Health Sciences | 3 | 1.9% |
| Psychology | 3 | 1.9% |
| Social Sciences | 5 | 3.1% |
| Engineering | 18 | 11.3% |
| Multidisciplinary Studies | 0 | 0.0% |
| Science & Technology | 16 | 10.1% |
| Business | 15 | 9.4% |
| Education | 47 | 29.6% |
| Literature & Languages | 2 | 1.3% |
| Liberal Arts & History | 7 | 4.4% |
| Visual & Performing Arts | 2 | 1.3% |
| Communications | 0 | 0.0% |
| Arts & Humanities | 14 | 8.8% |
| Total | 159 | 100.0% |
Transportation & Commute in Arlington
Vehicle Availability by Sex in Arlington
The most prevalent vehicle ownership categories in Arlington are males with 2 vehicles (110, accounting for 46.2%) and females with 2 vehicles (94, making up 58.5%).
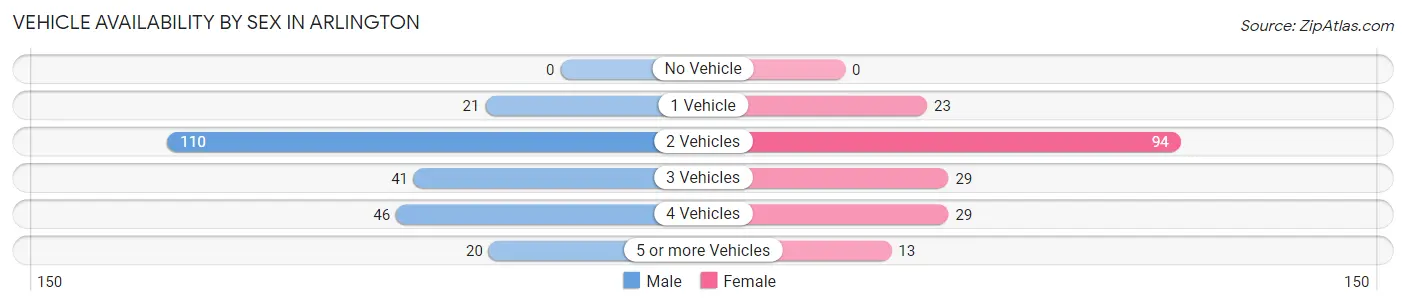
| Vehicles Available | Male | Female |
| No Vehicle | 0 (0.0%) | 0 (0.0%) |
| 1 Vehicle | 21 (8.8%) | 23 (12.2%) |
| 2 Vehicles | 110 (46.2%) | 94 (50.0%) |
| 3 Vehicles | 41 (17.2%) | 29 (15.4%) |
| 4 Vehicles | 46 (19.3%) | 29 (15.4%) |
| 5 or more Vehicles | 20 (8.4%) | 13 (6.9%) |
| Total | 238 (100.0%) | 188 (100.0%) |
Commute Time in Arlington
The most frequently occuring commute durations in Arlington are 5 to 9 minutes (119 commuters, 28.9%), 25 to 29 minutes (74 commuters, 18.0%), and 30 to 34 minutes (60 commuters, 14.6%).
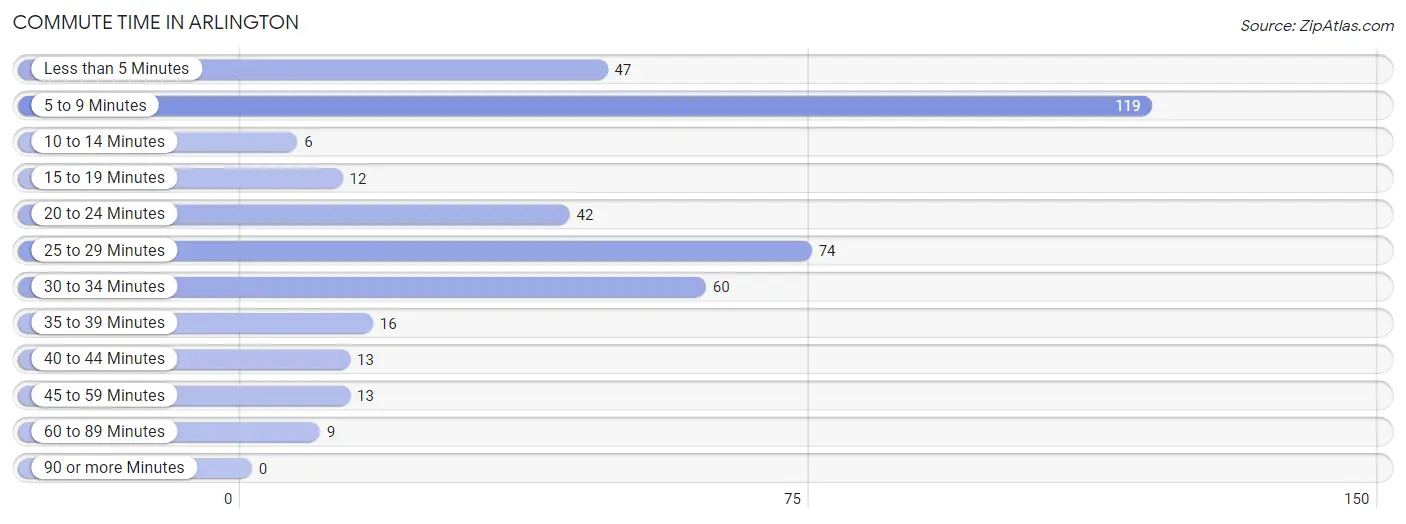
| Commute Time | # Commuters | % Commuters |
| Less than 5 Minutes | 47 | 11.4% |
| 5 to 9 Minutes | 119 | 28.9% |
| 10 to 14 Minutes | 6 | 1.5% |
| 15 to 19 Minutes | 12 | 2.9% |
| 20 to 24 Minutes | 42 | 10.2% |
| 25 to 29 Minutes | 74 | 18.0% |
| 30 to 34 Minutes | 60 | 14.6% |
| 35 to 39 Minutes | 16 | 3.9% |
| 40 to 44 Minutes | 13 | 3.2% |
| 45 to 59 Minutes | 13 | 3.2% |
| 60 to 89 Minutes | 9 | 2.2% |
| 90 or more Minutes | 0 | 0.0% |
Commute Time by Sex in Arlington
The most common commute times in Arlington are 5 to 9 minutes (61 commuters, 26.0%) for males and 5 to 9 minutes (58 commuters, 33.0%) for females.
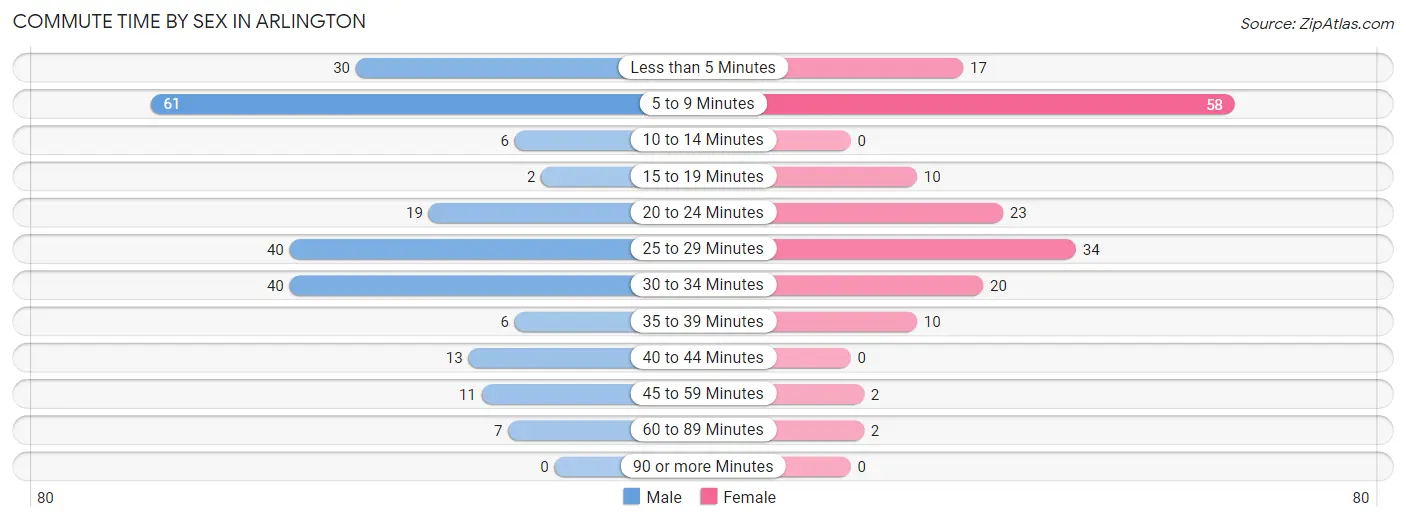
| Commute Time | Male | Female |
| Less than 5 Minutes | 30 (12.8%) | 17 (9.7%) |
| 5 to 9 Minutes | 61 (26.0%) | 58 (33.0%) |
| 10 to 14 Minutes | 6 (2.5%) | 0 (0.0%) |
| 15 to 19 Minutes | 2 (0.9%) | 10 (5.7%) |
| 20 to 24 Minutes | 19 (8.1%) | 23 (13.1%) |
| 25 to 29 Minutes | 40 (17.0%) | 34 (19.3%) |
| 30 to 34 Minutes | 40 (17.0%) | 20 (11.4%) |
| 35 to 39 Minutes | 6 (2.5%) | 10 (5.7%) |
| 40 to 44 Minutes | 13 (5.5%) | 0 (0.0%) |
| 45 to 59 Minutes | 11 (4.7%) | 2 (1.1%) |
| 60 to 89 Minutes | 7 (3.0%) | 2 (1.1%) |
| 90 or more Minutes | 0 (0.0%) | 0 (0.0%) |
Time of Departure to Work by Sex in Arlington
The most frequent times of departure to work in Arlington are 7:00 AM to 7:29 AM (61, 26.0%) for males and 7:30 AM to 7:59 AM (45, 25.6%) for females.
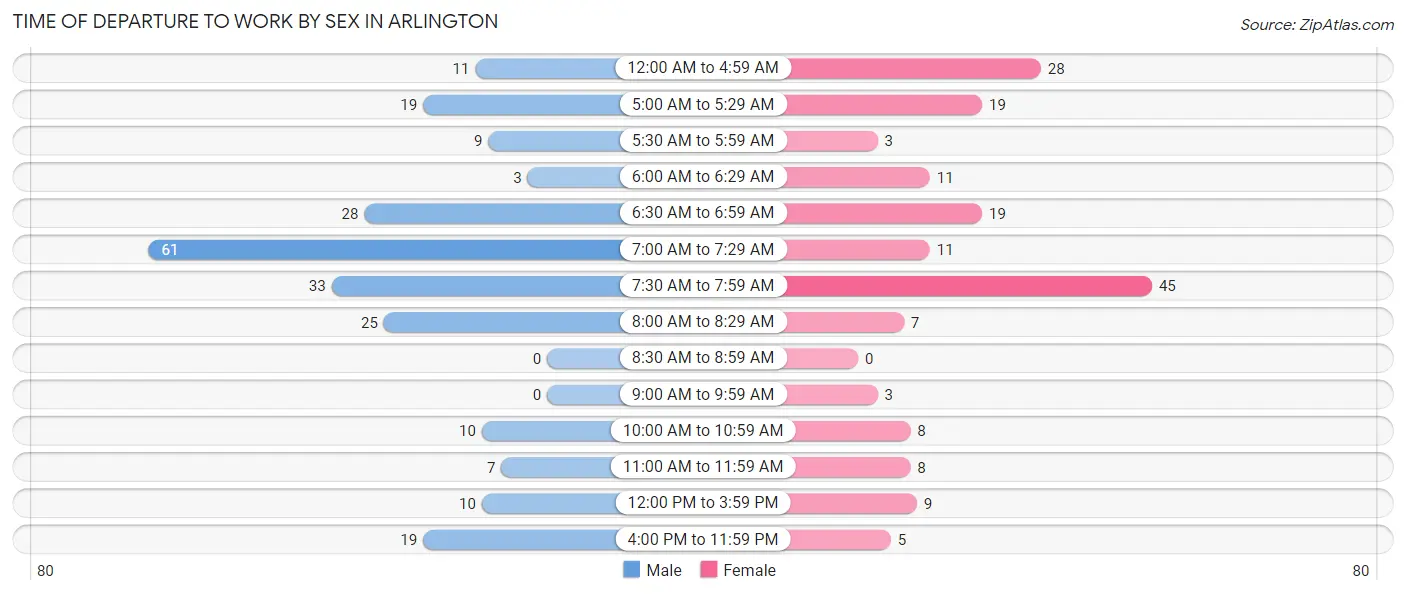
| Time of Departure | Male | Female |
| 12:00 AM to 4:59 AM | 11 (4.7%) | 28 (15.9%) |
| 5:00 AM to 5:29 AM | 19 (8.1%) | 19 (10.8%) |
| 5:30 AM to 5:59 AM | 9 (3.8%) | 3 (1.7%) |
| 6:00 AM to 6:29 AM | 3 (1.3%) | 11 (6.2%) |
| 6:30 AM to 6:59 AM | 28 (11.9%) | 19 (10.8%) |
| 7:00 AM to 7:29 AM | 61 (26.0%) | 11 (6.2%) |
| 7:30 AM to 7:59 AM | 33 (14.0%) | 45 (25.6%) |
| 8:00 AM to 8:29 AM | 25 (10.6%) | 7 (4.0%) |
| 8:30 AM to 8:59 AM | 0 (0.0%) | 0 (0.0%) |
| 9:00 AM to 9:59 AM | 0 (0.0%) | 3 (1.7%) |
| 10:00 AM to 10:59 AM | 10 (4.3%) | 8 (4.5%) |
| 11:00 AM to 11:59 AM | 7 (3.0%) | 8 (4.5%) |
| 12:00 PM to 3:59 PM | 10 (4.3%) | 9 (5.1%) |
| 4:00 PM to 11:59 PM | 19 (8.1%) | 5 (2.8%) |
| Total | 235 (100.0%) | 176 (100.0%) |
Housing Occupancy in Arlington
Occupancy by Ownership in Arlington
Of the total 343 dwellings in Arlington, owner-occupied units account for 238 (69.4%), while renter-occupied units make up 105 (30.6%).
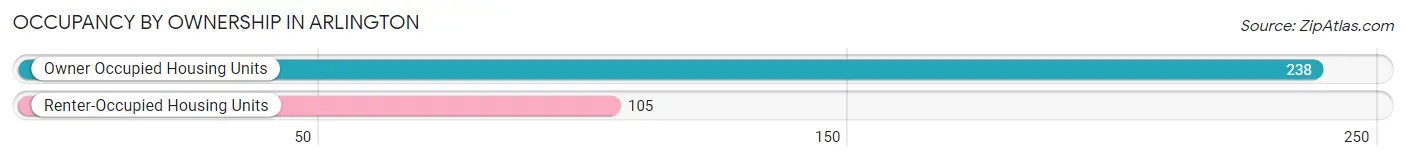
| Occupancy | # Housing Units | % Housing Units |
| Owner Occupied Housing Units | 238 | 69.4% |
| Renter-Occupied Housing Units | 105 | 30.6% |
| Total Occupied Housing Units | 343 | 100.0% |
Occupancy by Household Size in Arlington
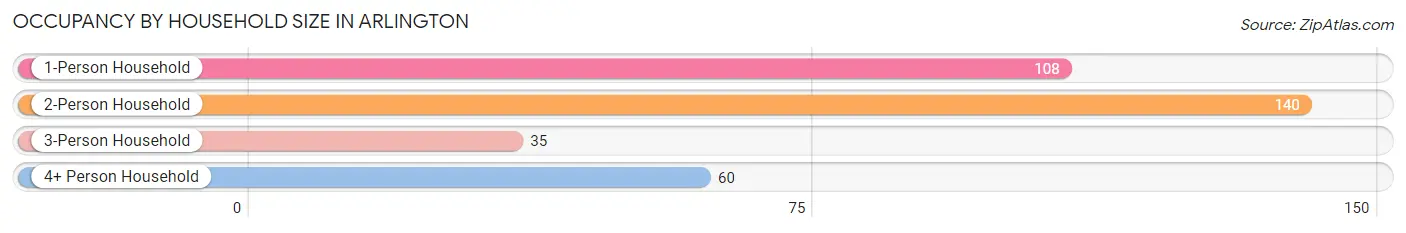
| Household Size | # Housing Units | % Housing Units |
| 1-Person Household | 108 | 31.5% |
| 2-Person Household | 140 | 40.8% |
| 3-Person Household | 35 | 10.2% |
| 4+ Person Household | 60 | 17.5% |
| Total Housing Units | 343 | 100.0% |
Occupancy by Ownership by Household Size in Arlington
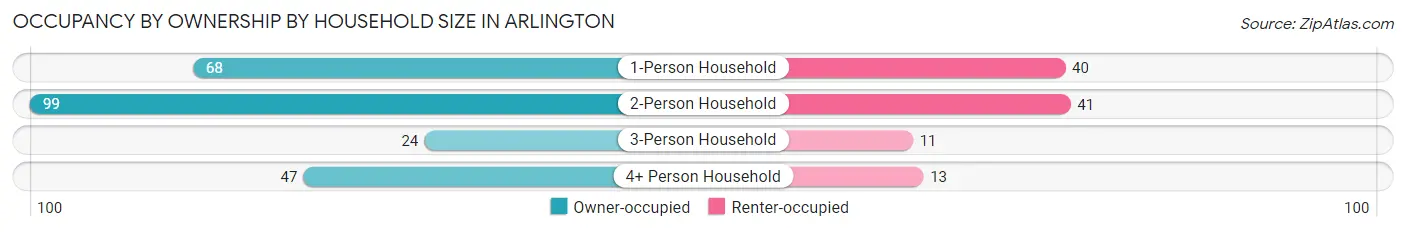
| Household Size | Owner-occupied | Renter-occupied |
| 1-Person Household | 68 (63.0%) | 40 (37.0%) |
| 2-Person Household | 99 (70.7%) | 41 (29.3%) |
| 3-Person Household | 24 (68.6%) | 11 (31.4%) |
| 4+ Person Household | 47 (78.3%) | 13 (21.7%) |
| Total Housing Units | 238 (69.4%) | 105 (30.6%) |
Occupancy by Educational Attainment in Arlington
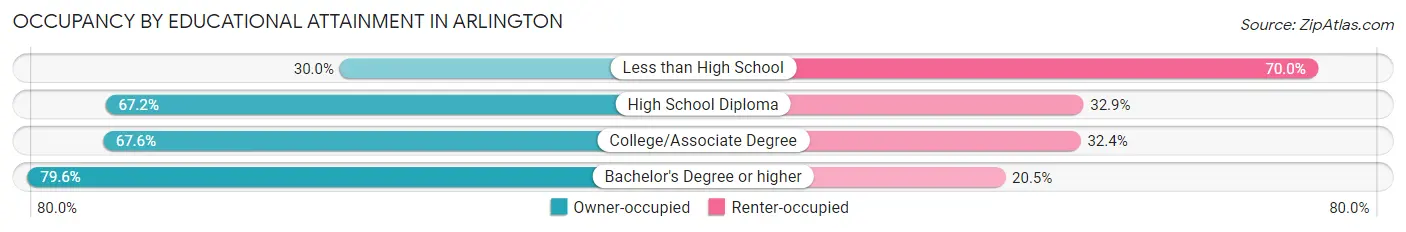
| Household Size | Owner-occupied | Renter-occupied |
| Less than High School | 3 (30.0%) | 7 (70.0%) |
| High School Diploma | 92 (67.1%) | 45 (32.9%) |
| College/Associate Degree | 73 (67.6%) | 35 (32.4%) |
| Bachelor's Degree or higher | 70 (79.5%) | 18 (20.4%) |
Occupancy by Age of Householder in Arlington
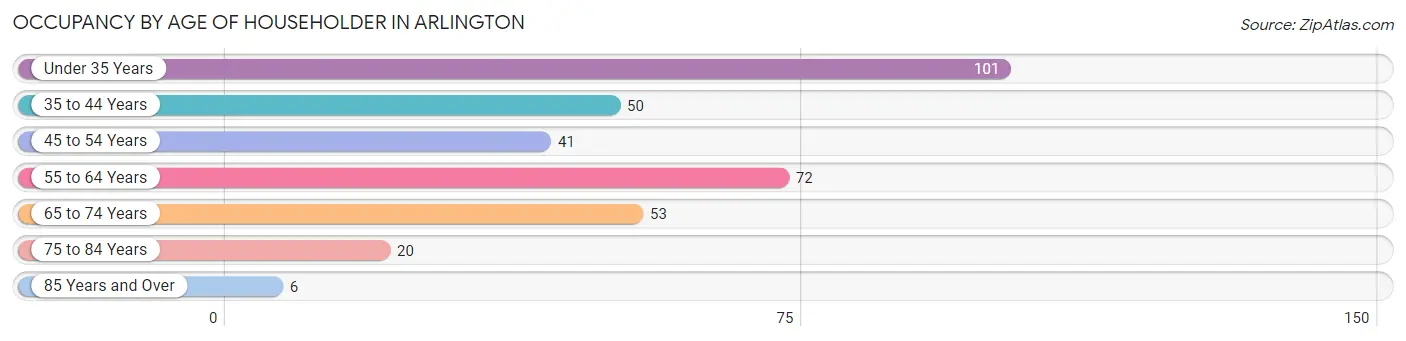
| Age Bracket | # Households | % Households |
| Under 35 Years | 101 | 29.4% |
| 35 to 44 Years | 50 | 14.6% |
| 45 to 54 Years | 41 | 11.9% |
| 55 to 64 Years | 72 | 21.0% |
| 65 to 74 Years | 53 | 15.4% |
| 75 to 84 Years | 20 | 5.8% |
| 85 Years and Over | 6 | 1.8% |
| Total | 343 | 100.0% |
Housing Finances in Arlington
Median Income by Occupancy in Arlington
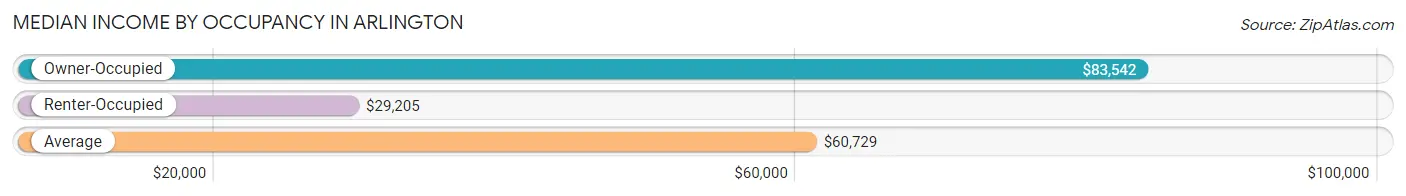
| Occupancy Type | # Households | Median Income |
| Owner-Occupied | 238 (69.4%) | $83,542 |
| Renter-Occupied | 105 (30.6%) | $29,205 |
| Average | 343 (100.0%) | $60,729 |
Occupancy by Householder Income Bracket in Arlington
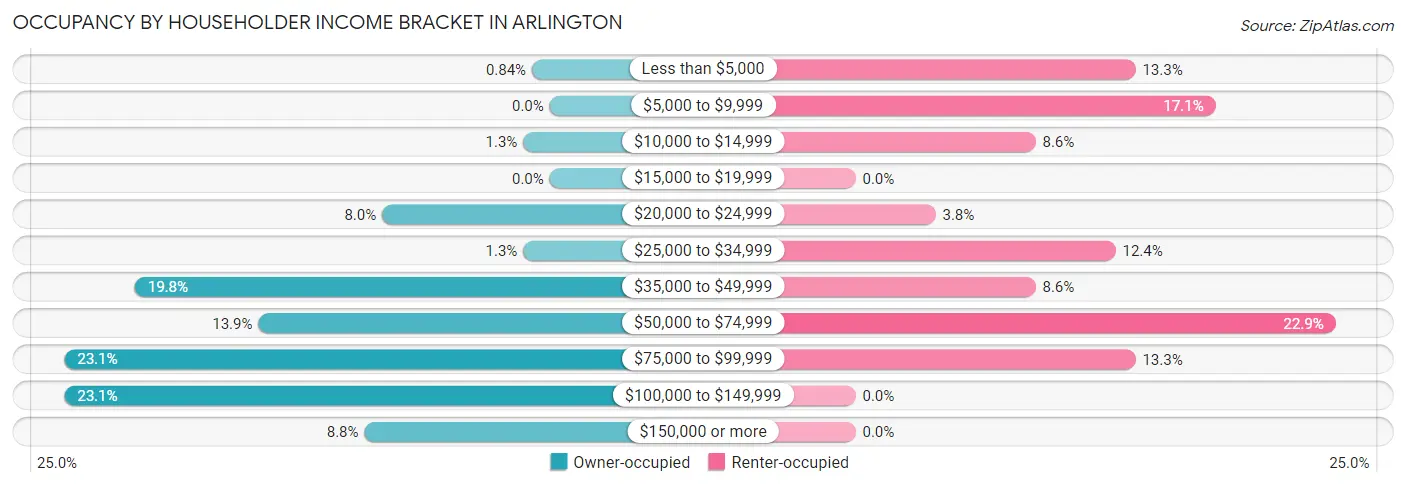
| Income Bracket | Owner-occupied | Renter-occupied |
| Less than $5,000 | 2 (0.8%) | 14 (13.3%) |
| $5,000 to $9,999 | 0 (0.0%) | 18 (17.1%) |
| $10,000 to $14,999 | 3 (1.3%) | 9 (8.6%) |
| $15,000 to $19,999 | 0 (0.0%) | 0 (0.0%) |
| $20,000 to $24,999 | 19 (8.0%) | 4 (3.8%) |
| $25,000 to $34,999 | 3 (1.3%) | 13 (12.4%) |
| $35,000 to $49,999 | 47 (19.8%) | 9 (8.6%) |
| $50,000 to $74,999 | 33 (13.9%) | 24 (22.9%) |
| $75,000 to $99,999 | 55 (23.1%) | 14 (13.3%) |
| $100,000 to $149,999 | 55 (23.1%) | 0 (0.0%) |
| $150,000 or more | 21 (8.8%) | 0 (0.0%) |
| Total | 238 (100.0%) | 105 (100.0%) |
Monthly Housing Cost Tiers in Arlington
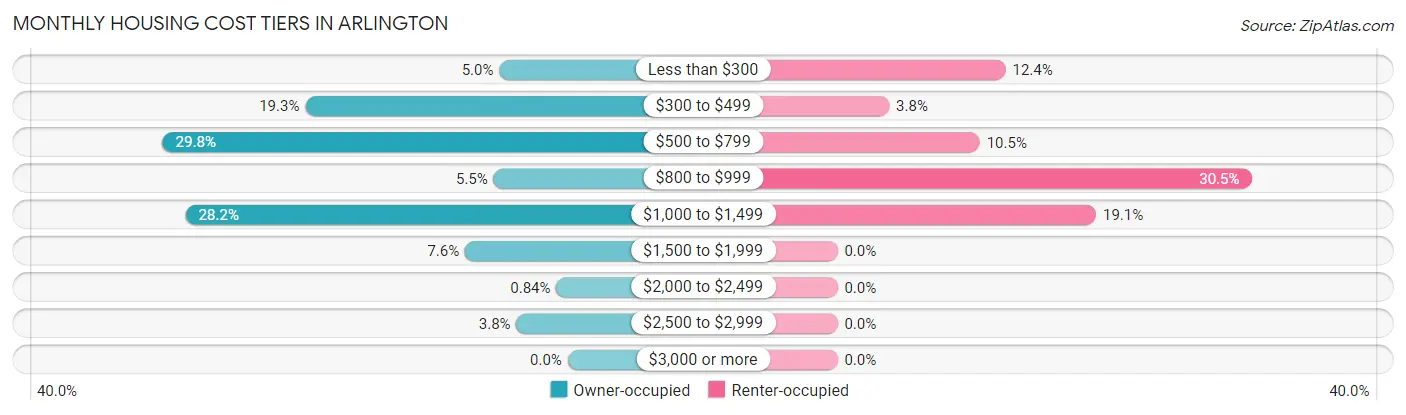
| Monthly Cost | Owner-occupied | Renter-occupied |
| Less than $300 | 12 (5.0%) | 13 (12.4%) |
| $300 to $499 | 46 (19.3%) | 4 (3.8%) |
| $500 to $799 | 71 (29.8%) | 11 (10.5%) |
| $800 to $999 | 13 (5.5%) | 32 (30.5%) |
| $1,000 to $1,499 | 67 (28.1%) | 20 (19.1%) |
| $1,500 to $1,999 | 18 (7.6%) | 0 (0.0%) |
| $2,000 to $2,499 | 2 (0.8%) | 0 (0.0%) |
| $2,500 to $2,999 | 9 (3.8%) | 0 (0.0%) |
| $3,000 or more | 0 (0.0%) | 0 (0.0%) |
| Total | 238 (100.0%) | 105 (100.0%) |
Physical Housing Characteristics in Arlington
Housing Structures in Arlington
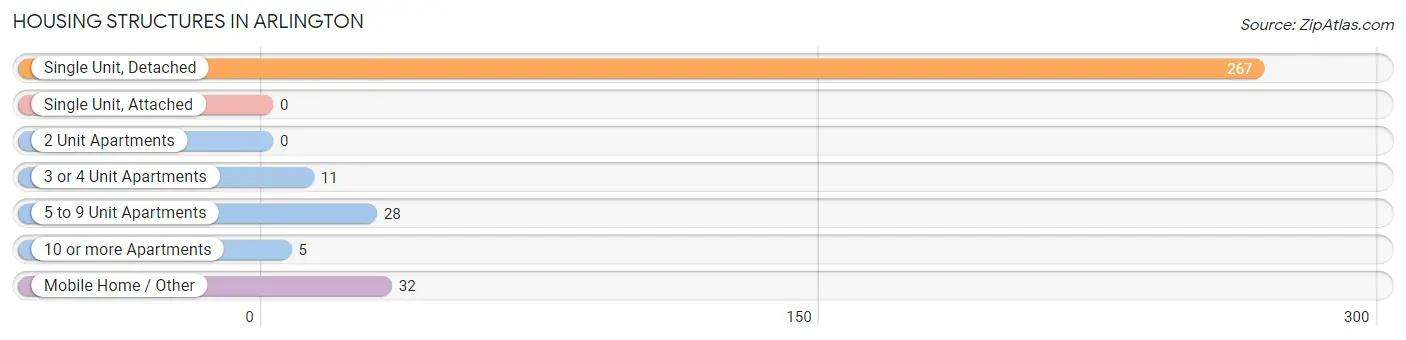
| Structure Type | # Housing Units | % Housing Units |
| Single Unit, Detached | 267 | 77.8% |
| Single Unit, Attached | 0 | 0.0% |
| 2 Unit Apartments | 0 | 0.0% |
| 3 or 4 Unit Apartments | 11 | 3.2% |
| 5 to 9 Unit Apartments | 28 | 8.2% |
| 10 or more Apartments | 5 | 1.5% |
| Mobile Home / Other | 32 | 9.3% |
| Total | 343 | 100.0% |
Housing Structures by Occupancy in Arlington
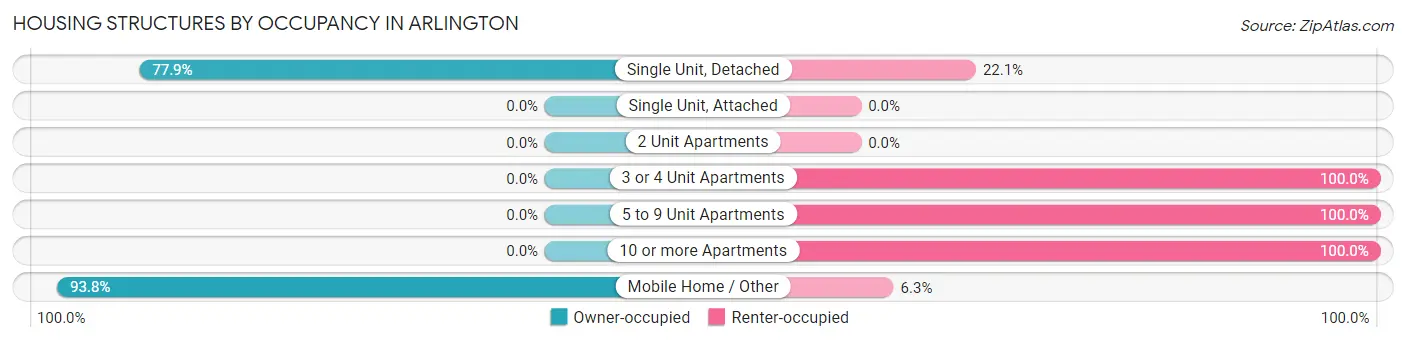
| Structure Type | Owner-occupied | Renter-occupied |
| Single Unit, Detached | 208 (77.9%) | 59 (22.1%) |
| Single Unit, Attached | 0 (0.0%) | 0 (0.0%) |
| 2 Unit Apartments | 0 (0.0%) | 0 (0.0%) |
| 3 or 4 Unit Apartments | 0 (0.0%) | 11 (100.0%) |
| 5 to 9 Unit Apartments | 0 (0.0%) | 28 (100.0%) |
| 10 or more Apartments | 0 (0.0%) | 5 (100.0%) |
| Mobile Home / Other | 30 (93.8%) | 2 (6.2%) |
| Total | 238 (69.4%) | 105 (30.6%) |
Housing Structures by Number of Rooms in Arlington
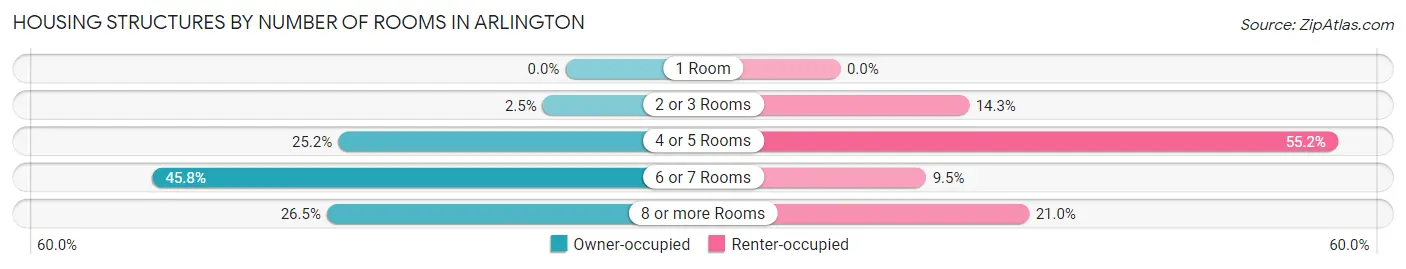
| Number of Rooms | Owner-occupied | Renter-occupied |
| 1 Room | 0 (0.0%) | 0 (0.0%) |
| 2 or 3 Rooms | 6 (2.5%) | 15 (14.3%) |
| 4 or 5 Rooms | 60 (25.2%) | 58 (55.2%) |
| 6 or 7 Rooms | 109 (45.8%) | 10 (9.5%) |
| 8 or more Rooms | 63 (26.5%) | 22 (20.9%) |
| Total | 238 (100.0%) | 105 (100.0%) |
Housing Structure by Heating Type in Arlington
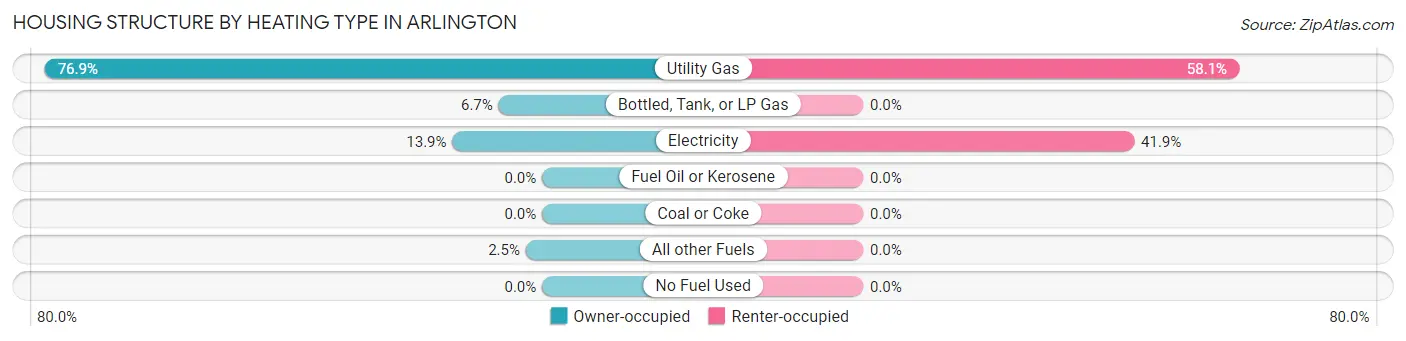
| Heating Type | Owner-occupied | Renter-occupied |
| Utility Gas | 183 (76.9%) | 61 (58.1%) |
| Bottled, Tank, or LP Gas | 16 (6.7%) | 0 (0.0%) |
| Electricity | 33 (13.9%) | 44 (41.9%) |
| Fuel Oil or Kerosene | 0 (0.0%) | 0 (0.0%) |
| Coal or Coke | 0 (0.0%) | 0 (0.0%) |
| All other Fuels | 6 (2.5%) | 0 (0.0%) |
| No Fuel Used | 0 (0.0%) | 0 (0.0%) |
| Total | 238 (100.0%) | 105 (100.0%) |
Household Vehicle Usage in Arlington
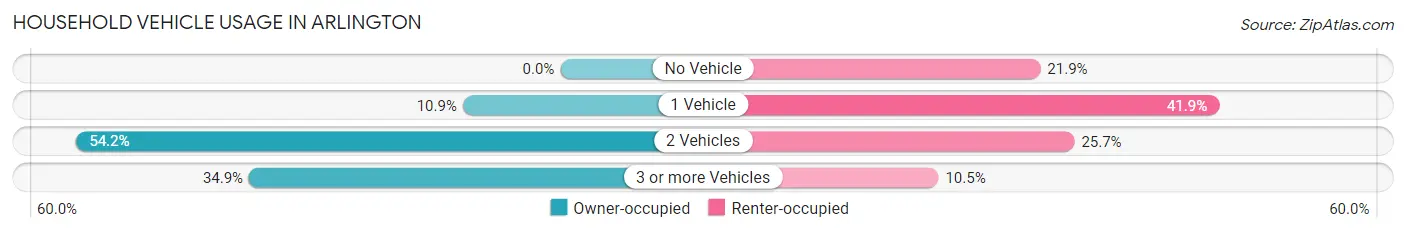
| Vehicles per Household | Owner-occupied | Renter-occupied |
| No Vehicle | 0 (0.0%) | 23 (21.9%) |
| 1 Vehicle | 26 (10.9%) | 44 (41.9%) |
| 2 Vehicles | 129 (54.2%) | 27 (25.7%) |
| 3 or more Vehicles | 83 (34.9%) | 11 (10.5%) |
| Total | 238 (100.0%) | 105 (100.0%) |
Real Estate & Mortgages in Arlington
Real Estate and Mortgage Overview in Arlington
| Characteristic | Without Mortgage | With Mortgage |
| Housing Units | 105 | 133 |
| Median Property Value | $109,400 | $143,900 |
| Median Household Income | $63,958 | $16 |
| Monthly Housing Costs | $480 | $0 |
| Real Estate Taxes | $1,315 | $0 |
Property Value by Mortgage Status in Arlington
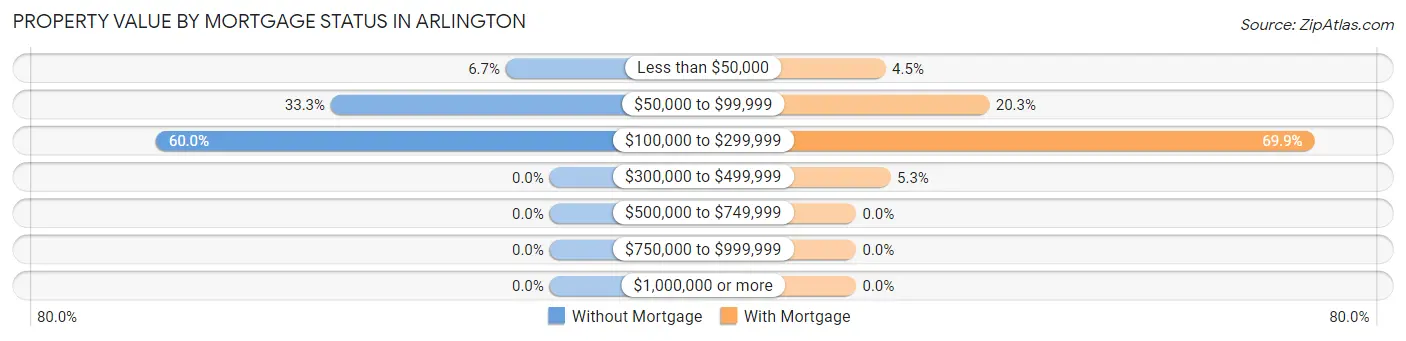
| Property Value | Without Mortgage | With Mortgage |
| Less than $50,000 | 7 (6.7%) | 6 (4.5%) |
| $50,000 to $99,999 | 35 (33.3%) | 27 (20.3%) |
| $100,000 to $299,999 | 63 (60.0%) | 93 (69.9%) |
| $300,000 to $499,999 | 0 (0.0%) | 7 (5.3%) |
| $500,000 to $749,999 | 0 (0.0%) | 0 (0.0%) |
| $750,000 to $999,999 | 0 (0.0%) | 0 (0.0%) |
| $1,000,000 or more | 0 (0.0%) | 0 (0.0%) |
| Total | 105 (100.0%) | 133 (100.0%) |
Household Income by Mortgage Status in Arlington
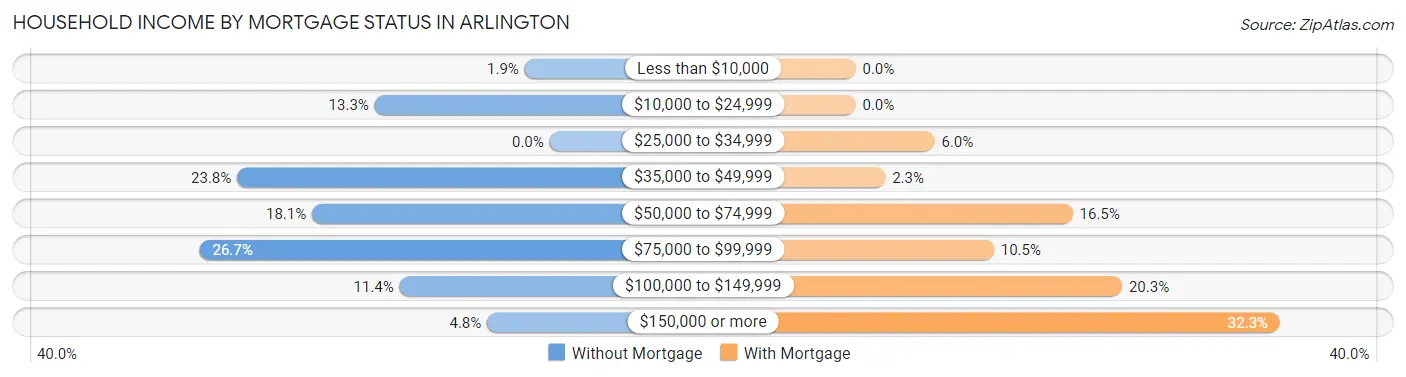
| Household Income | Without Mortgage | With Mortgage |
| Less than $10,000 | 2 (1.9%) | 0 (0.0%) |
| $10,000 to $24,999 | 14 (13.3%) | 0 (0.0%) |
| $25,000 to $34,999 | 0 (0.0%) | 8 (6.0%) |
| $35,000 to $49,999 | 25 (23.8%) | 3 (2.3%) |
| $50,000 to $74,999 | 19 (18.1%) | 22 (16.5%) |
| $75,000 to $99,999 | 28 (26.7%) | 14 (10.5%) |
| $100,000 to $149,999 | 12 (11.4%) | 27 (20.3%) |
| $150,000 or more | 5 (4.8%) | 43 (32.3%) |
| Total | 105 (100.0%) | 133 (100.0%) |
Property Value to Household Income Ratio in Arlington
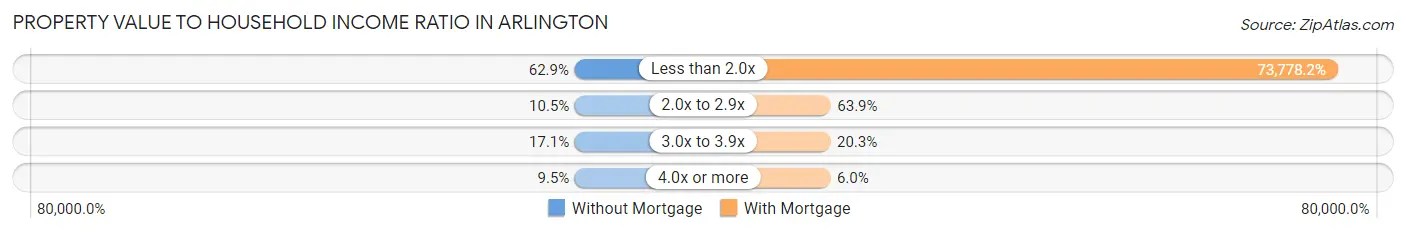
| Value-to-Income Ratio | Without Mortgage | With Mortgage |
| Less than 2.0x | 66 (62.9%) | 98,125 (73,778.2%) |
| 2.0x to 2.9x | 11 (10.5%) | 85 (63.9%) |
| 3.0x to 3.9x | 18 (17.1%) | 27 (20.3%) |
| 4.0x or more | 10 (9.5%) | 8 (6.0%) |
| Total | 105 (100.0%) | 133 (100.0%) |
Real Estate Taxes by Mortgage Status in Arlington
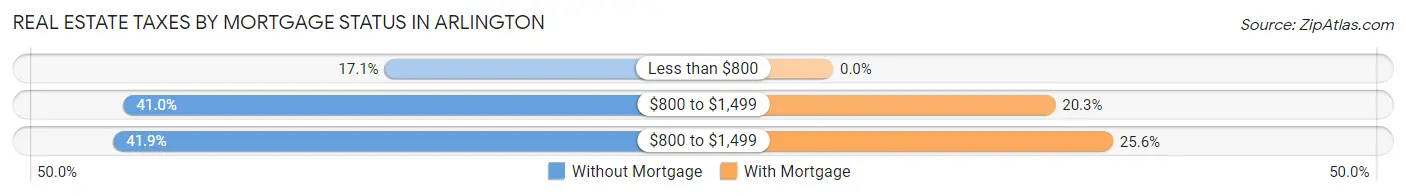
| Property Taxes | Without Mortgage | With Mortgage |
| Less than $800 | 18 (17.1%) | 0 (0.0%) |
| $800 to $1,499 | 43 (40.9%) | 27 (20.3%) |
| $800 to $1,499 | 44 (41.9%) | 34 (25.6%) |
| Total | 105 (100.0%) | 133 (100.0%) |
Health & Disability in Arlington
Health Insurance Coverage by Age in Arlington
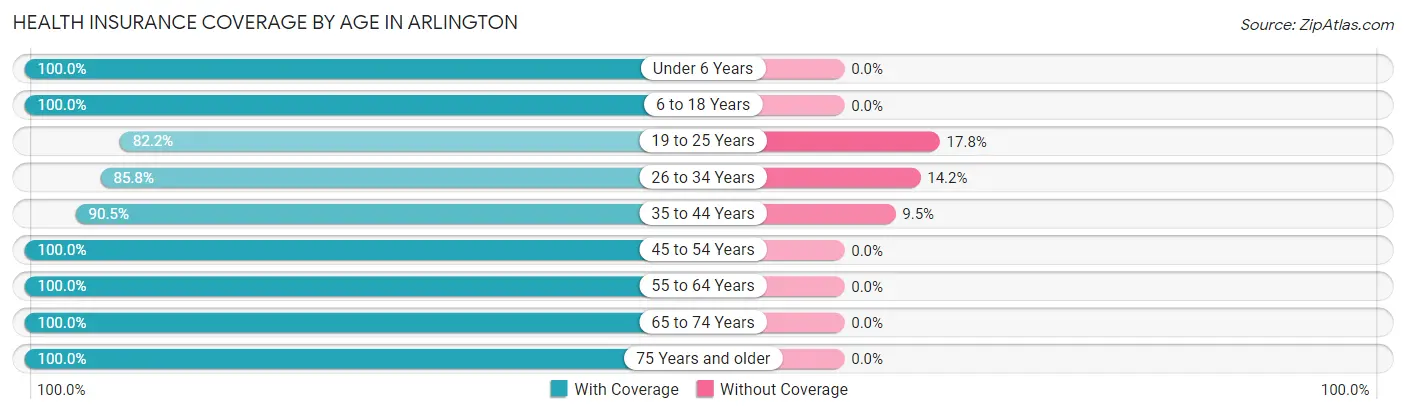
| Age Bracket | With Coverage | Without Coverage |
| Under 6 Years | 114 (100.0%) | 0 (0.0%) |
| 6 to 18 Years | 116 (100.0%) | 0 (0.0%) |
| 19 to 25 Years | 37 (82.2%) | 8 (17.8%) |
| 26 to 34 Years | 103 (85.8%) | 17 (14.2%) |
| 35 to 44 Years | 76 (90.5%) | 8 (9.5%) |
| 45 to 54 Years | 68 (100.0%) | 0 (0.0%) |
| 55 to 64 Years | 133 (100.0%) | 0 (0.0%) |
| 65 to 74 Years | 87 (100.0%) | 0 (0.0%) |
| 75 Years and older | 33 (100.0%) | 0 (0.0%) |
| Total | 767 (95.9%) | 33 (4.1%) |
Health Insurance Coverage by Citizenship Status in Arlington
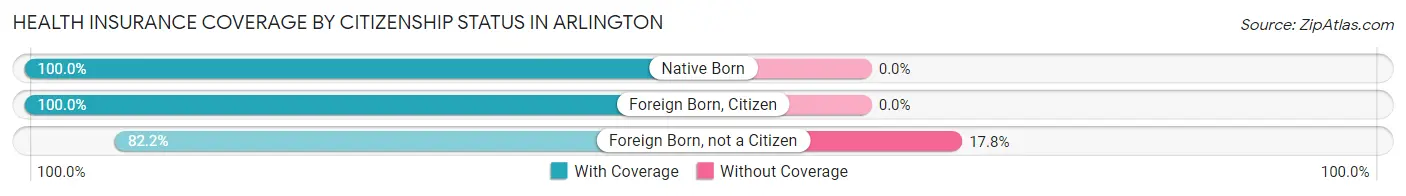
| Citizenship Status | With Coverage | Without Coverage |
| Native Born | 114 (100.0%) | 0 (0.0%) |
| Foreign Born, Citizen | 116 (100.0%) | 0 (0.0%) |
| Foreign Born, not a Citizen | 37 (82.2%) | 8 (17.8%) |
Health Insurance Coverage by Household Income in Arlington
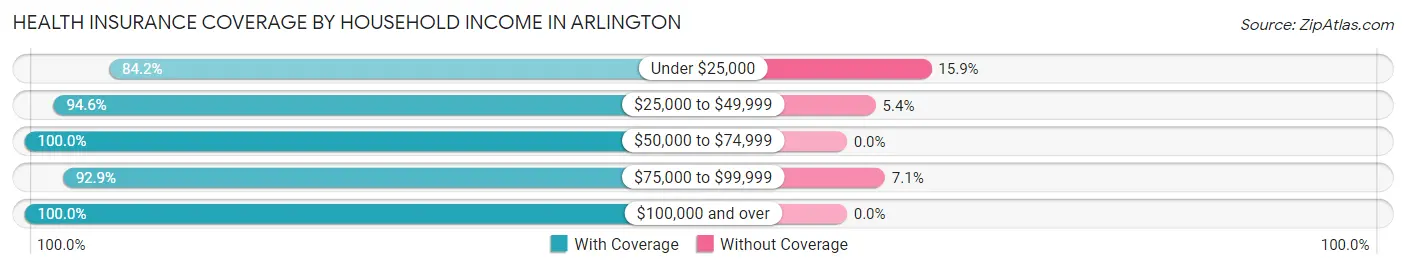
| Household Income | With Coverage | Without Coverage |
| Under $25,000 | 69 (84.2%) | 13 (15.9%) |
| $25,000 to $49,999 | 140 (94.6%) | 8 (5.4%) |
| $50,000 to $74,999 | 116 (100.0%) | 0 (0.0%) |
| $75,000 to $99,999 | 156 (92.9%) | 12 (7.1%) |
| $100,000 and over | 286 (100.0%) | 0 (0.0%) |
Public vs Private Health Insurance Coverage by Age in Arlington
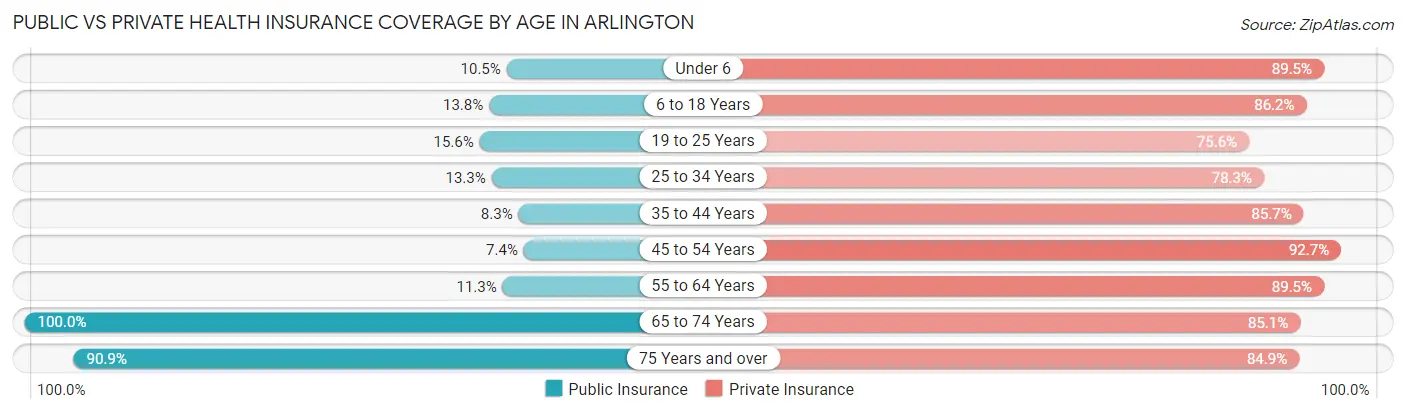
| Age Bracket | Public Insurance | Private Insurance |
| Under 6 | 12 (10.5%) | 102 (89.5%) |
| 6 to 18 Years | 16 (13.8%) | 100 (86.2%) |
| 19 to 25 Years | 7 (15.6%) | 34 (75.6%) |
| 25 to 34 Years | 16 (13.3%) | 94 (78.3%) |
| 35 to 44 Years | 7 (8.3%) | 72 (85.7%) |
| 45 to 54 Years | 5 (7.3%) | 63 (92.6%) |
| 55 to 64 Years | 15 (11.3%) | 119 (89.5%) |
| 65 to 74 Years | 87 (100.0%) | 74 (85.1%) |
| 75 Years and over | 30 (90.9%) | 28 (84.9%) |
| Total | 195 (24.4%) | 686 (85.8%) |
Disability Status by Sex by Age in Arlington
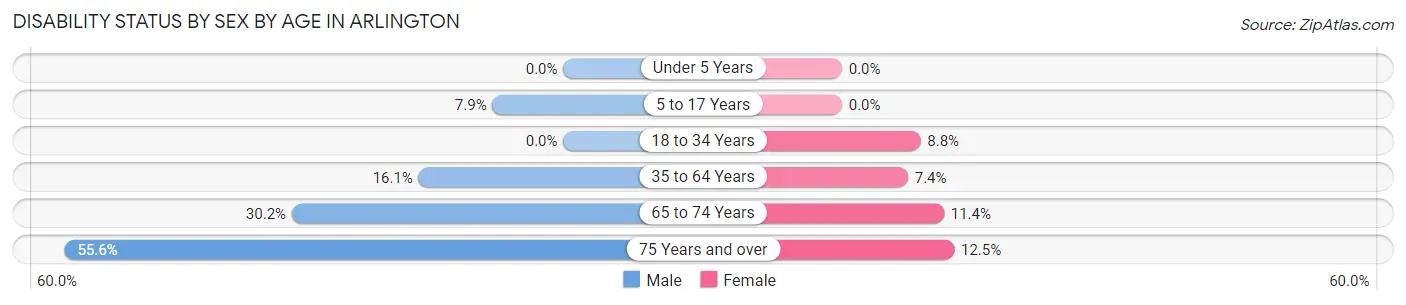
| Age Bracket | Male | Female |
| Under 5 Years | 0 (0.0%) | 0 (0.0%) |
| 5 to 17 Years | 3 (7.9%) | 0 (0.0%) |
| 18 to 34 Years | 0 (0.0%) | 7 (8.7%) |
| 35 to 64 Years | 24 (16.1%) | 10 (7.3%) |
| 65 to 74 Years | 13 (30.2%) | 5 (11.4%) |
| 75 Years and over | 5 (55.6%) | 3 (12.5%) |
Disability Class by Sex by Age in Arlington
Disability Class: Hearing Difficulty
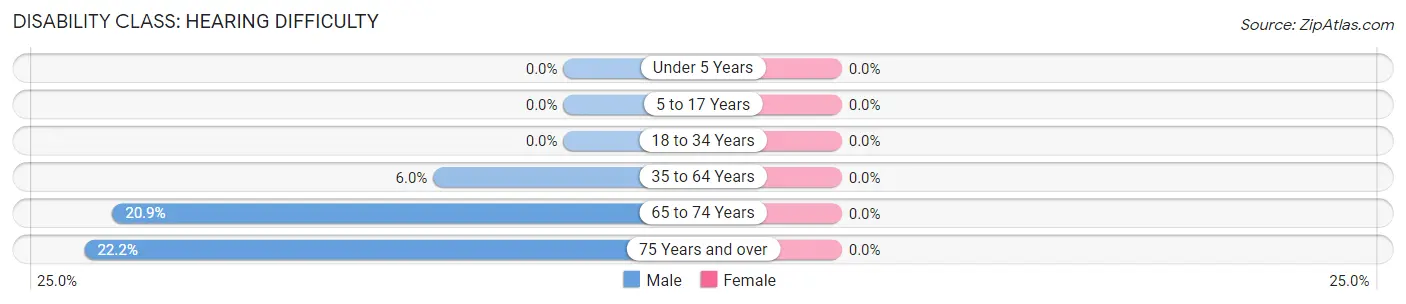
| Age Bracket | Male | Female |
| Under 5 Years | 0 (0.0%) | 0 (0.0%) |
| 5 to 17 Years | 0 (0.0%) | 0 (0.0%) |
| 18 to 34 Years | 0 (0.0%) | 0 (0.0%) |
| 35 to 64 Years | 9 (6.0%) | 0 (0.0%) |
| 65 to 74 Years | 9 (20.9%) | 0 (0.0%) |
| 75 Years and over | 2 (22.2%) | 0 (0.0%) |
Disability Class: Vision Difficulty
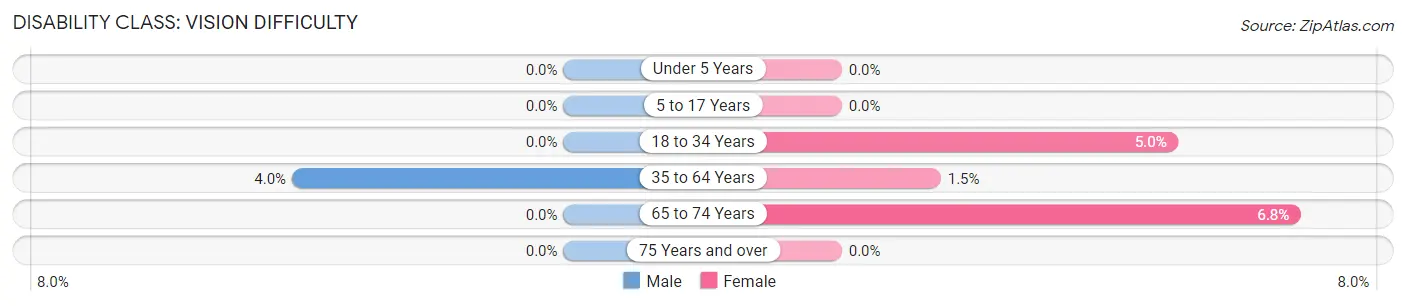
| Age Bracket | Male | Female |
| Under 5 Years | 0 (0.0%) | 0 (0.0%) |
| 5 to 17 Years | 0 (0.0%) | 0 (0.0%) |
| 18 to 34 Years | 0 (0.0%) | 4 (5.0%) |
| 35 to 64 Years | 6 (4.0%) | 2 (1.5%) |
| 65 to 74 Years | 0 (0.0%) | 3 (6.8%) |
| 75 Years and over | 0 (0.0%) | 0 (0.0%) |
Disability Class: Cognitive Difficulty
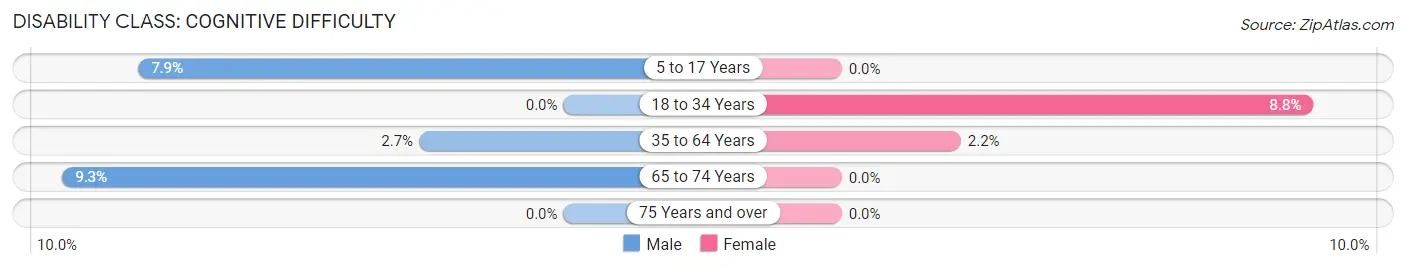
| Age Bracket | Male | Female |
| 5 to 17 Years | 3 (7.9%) | 0 (0.0%) |
| 18 to 34 Years | 0 (0.0%) | 7 (8.7%) |
| 35 to 64 Years | 4 (2.7%) | 3 (2.2%) |
| 65 to 74 Years | 4 (9.3%) | 0 (0.0%) |
| 75 Years and over | 0 (0.0%) | 0 (0.0%) |
Disability Class: Ambulatory Difficulty
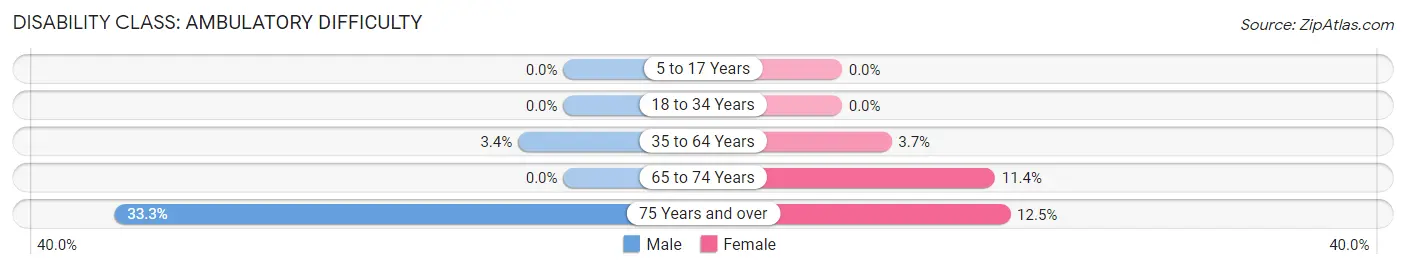
| Age Bracket | Male | Female |
| 5 to 17 Years | 0 (0.0%) | 0 (0.0%) |
| 18 to 34 Years | 0 (0.0%) | 0 (0.0%) |
| 35 to 64 Years | 5 (3.4%) | 5 (3.7%) |
| 65 to 74 Years | 0 (0.0%) | 5 (11.4%) |
| 75 Years and over | 3 (33.3%) | 3 (12.5%) |
Disability Class: Self-Care Difficulty
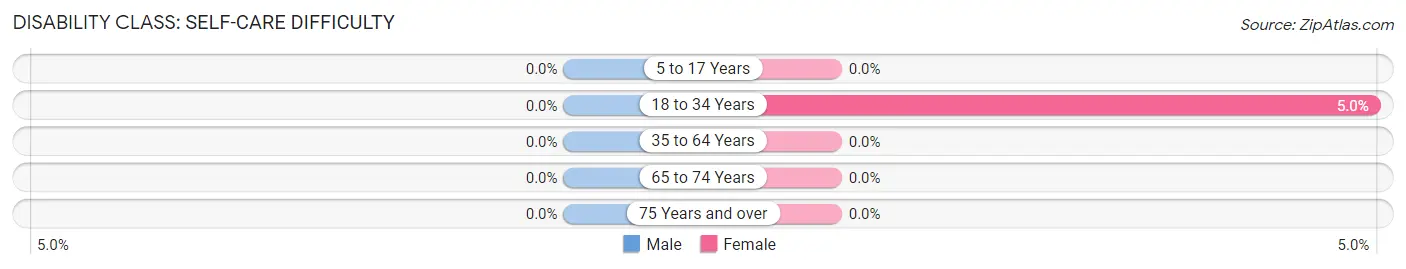
| Age Bracket | Male | Female |
| 5 to 17 Years | 0 (0.0%) | 0 (0.0%) |
| 18 to 34 Years | 0 (0.0%) | 4 (5.0%) |
| 35 to 64 Years | 0 (0.0%) | 0 (0.0%) |
| 65 to 74 Years | 0 (0.0%) | 0 (0.0%) |
| 75 Years and over | 0 (0.0%) | 0 (0.0%) |
Technology Access in Arlington
Computing Device Access in Arlington
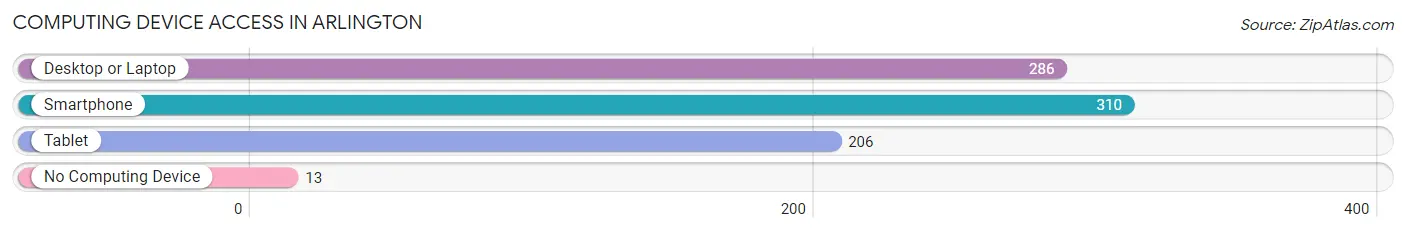
| Device Type | # Households | % Households |
| Desktop or Laptop | 286 | 83.4% |
| Smartphone | 310 | 90.4% |
| Tablet | 206 | 60.1% |
| No Computing Device | 13 | 3.8% |
| Total | 343 | 100.0% |
Internet Access in Arlington
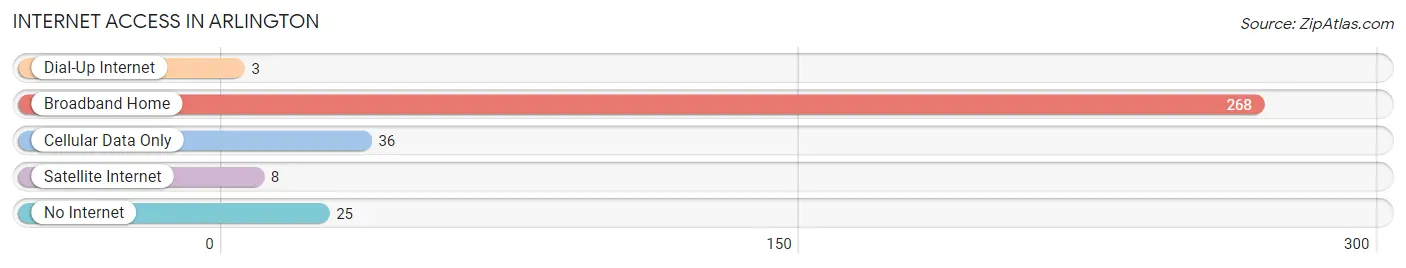
| Internet Type | # Households | % Households |
| Dial-Up Internet | 3 | 0.9% |
| Broadband Home | 268 | 78.1% |
| Cellular Data Only | 36 | 10.5% |
| Satellite Internet | 8 | 2.3% |
| No Internet | 25 | 7.3% |
| Total | 343 | 100.0% |
Arlington Summary
Arlington is a small town located in the southeastern corner of South Dakota, in the United States. It is situated in Kingsbury County, and is part of the Sioux Falls Metropolitan Statistical Area. The town has a population of 1,093, according to the 2010 census.
History
Arlington was founded in 1883 by a group of settlers from Wisconsin. The town was named after the Arlington House, a hotel in Madison, Wisconsin. The first post office was established in 1884, and the town was incorporated in 1887.
The town was originally a farming community, and the main crops were wheat, corn, and oats. In the early 1900s, the town began to diversify its economy, and a number of businesses were established, including a creamery, a lumberyard, a bank, and a hotel.
In the 1950s, the town began to experience a population decline, as many of its residents moved away in search of better job opportunities. However, in recent years, the town has seen a resurgence in population, as people have moved back to the area in search of a more rural lifestyle.
Geography
Arlington is located in the southeastern corner of South Dakota, in Kingsbury County. It is situated at the intersection of U.S. Route 81 and South Dakota Highway 19. The town is located approximately 25 miles south of Sioux Falls, the largest city in the state.
The town is situated on the banks of the Big Sioux River, and is surrounded by rolling hills and farmland. The climate in Arlington is characterized by hot summers and cold winters. The average annual temperature is 48°F, and the average annual precipitation is 22 inches.
Economy
The economy of Arlington is largely based on agriculture. The town is home to several large farms, which produce a variety of crops, including corn, soybeans, wheat, and oats. In addition, the town is home to several businesses, including a lumberyard, a bank, and a hotel.
The town is also home to a number of manufacturing companies, which produce a variety of products, including furniture, clothing, and automotive parts. The town is also home to a number of retail stores, which sell a variety of goods, including clothing, groceries, and home goods.
Demographics
According to the 2010 census, the population of Arlington is 1,093. The town has a median age of 38.7 years, and the median household income is $45,938. The town is predominantly white, with 92.3% of the population identifying as such. The town also has a small Hispanic population, with 4.2% of the population identifying as Hispanic or Latino.
The town is served by the Arlington Public School District, which consists of one elementary school, one middle school, and one high school. The town is also home to a number of churches, including the First Presbyterian Church, the United Methodist Church, and the Church of Jesus Christ of Latter-day Saints.
Conclusion
Arlington is a small town located in the southeastern corner of South Dakota. The town has a population of 1,093, and is predominantly white. The town's economy is largely based on agriculture, and the town is home to several businesses, including a lumberyard, a bank, and a hotel. The town is served by the Arlington Public School District, and is home to a number of churches.
Common Questions
What is Per Capita Income in Arlington?
Per Capita income in Arlington is $28,785.
What is the Median Family Income in Arlington?
Median Family Income in Arlington is $83,819.
What is the Median Household income in Arlington?
Median Household Income in Arlington is $60,729.
What is Income or Wage Gap in Arlington?
Income or Wage Gap in Arlington is 32.0%.
Women in Arlington earn 68.0 cents for every dollar earned by a man.
What is Inequality or Gini Index in Arlington?
Inequality or Gini Index in Arlington is 0.38.
What is the Total Population of Arlington?
Total Population of Arlington is 846.
What is the Total Male Population of Arlington?
Total Male Population of Arlington is 398.
What is the Total Female Population of Arlington?
Total Female Population of Arlington is 448.
What is the Ratio of Males per 100 Females in Arlington?
There are 88.84 Males per 100 Females in Arlington.
What is the Ratio of Females per 100 Males in Arlington?
There are 112.56 Females per 100 Males in Arlington.
What is the Median Population Age in Arlington?
Median Population Age in Arlington is 37.0 Years.
What is the Average Family Size in Arlington
Average Family Size in Arlington is 3.0 People.
What is the Average Household Size in Arlington
Average Household Size in Arlington is 2.3 People.
How Large is the Labor Force in Arlington?
There are 430 People in the Labor Forcein in Arlington.
What is the Percentage of People in the Labor Force in Arlington?
67.7% of People are in the Labor Force in Arlington.
What is the Unemployment Rate in Arlington?
Unemployment Rate in Arlington is 0.9%.